Interface-acting nucleotide controls polymerization dynamics at microtubule plus- and minus-ends
- Department of Biophysics and Biochemistry, the University of Texas Southwestern Medical Center, United States
- Department of Biomedical Engineering, Pennsylvania State University, United States
Figures
Figure 1 with 3 supplements
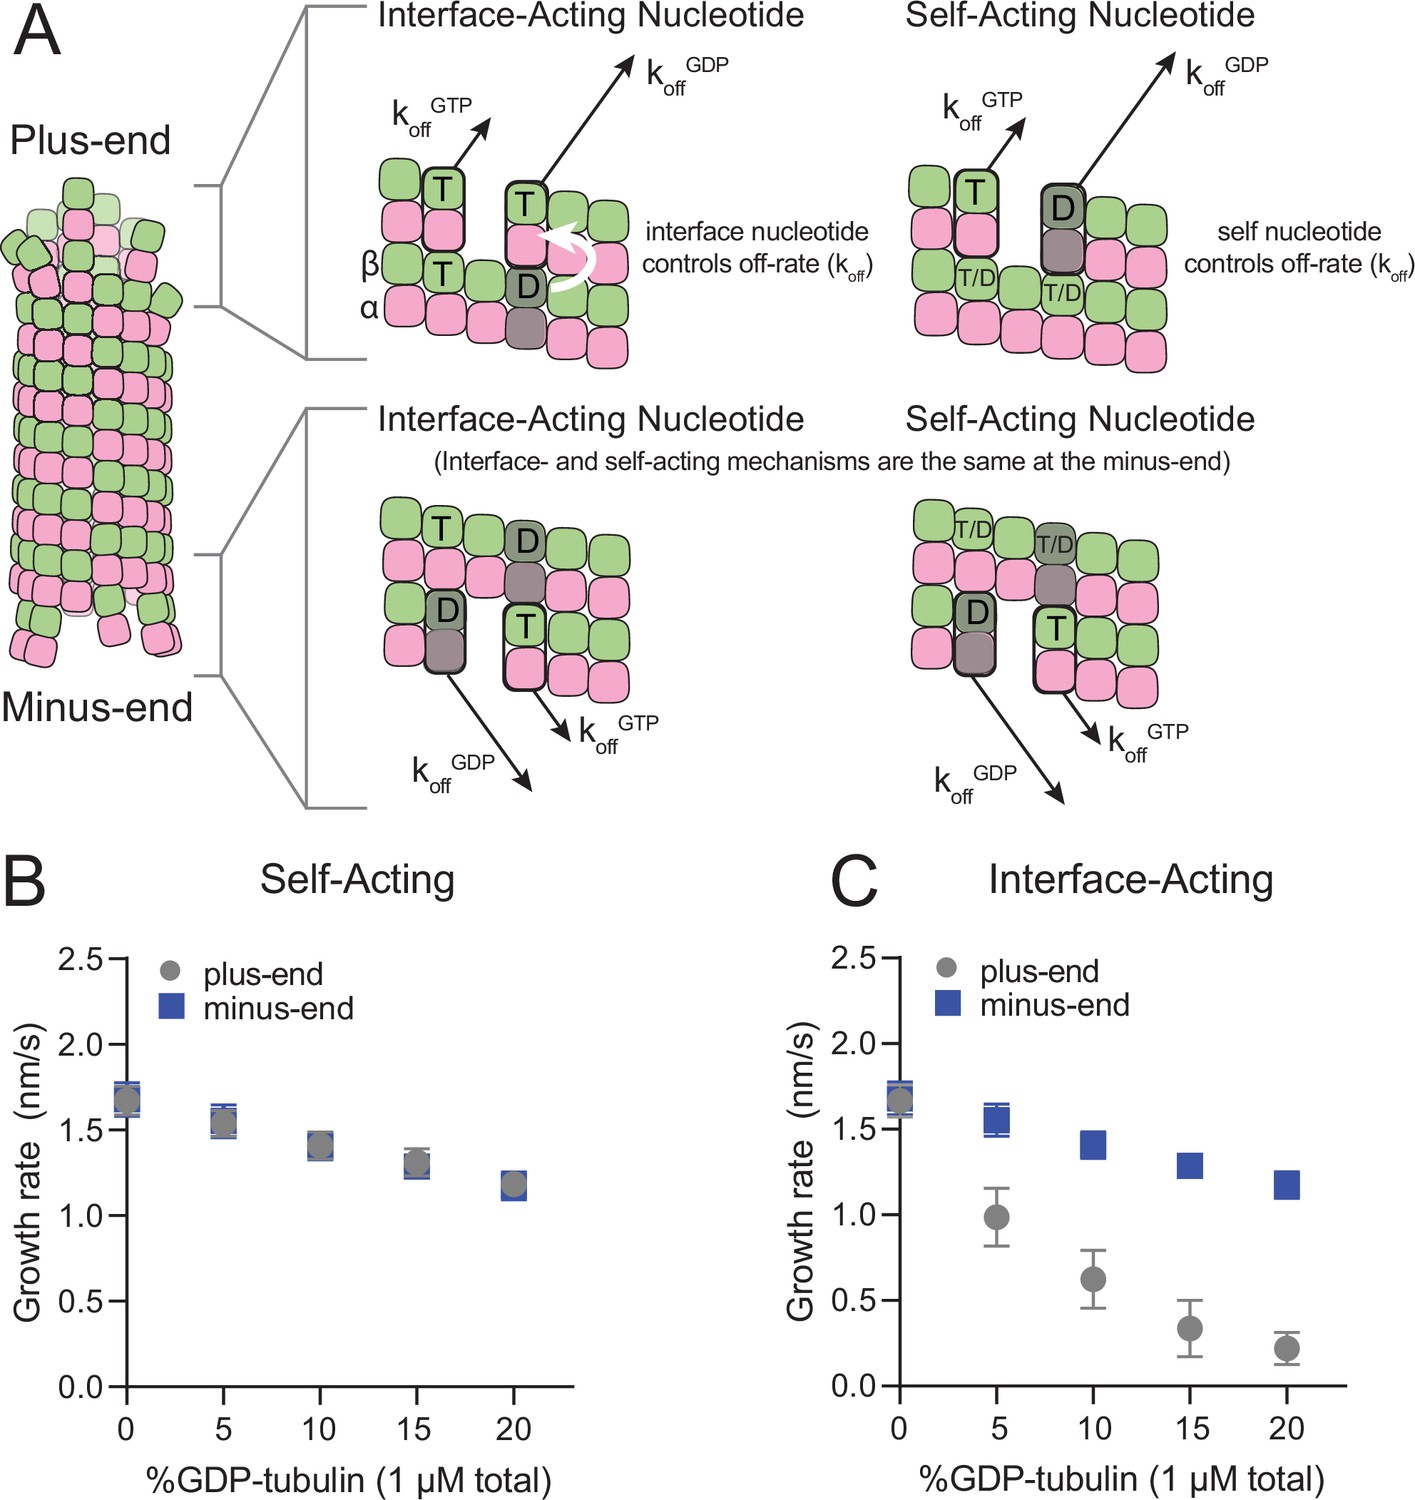
Mechanisms of nucleotide action and simulations of plus- and minus-ends.
(A) Cartoon showing self- (cis) or interface-acting (trans) nucleotide mechanisms. In an interface-acting mechanism, the nucleotide at the interface of two tubulin dimers controls their interaction affinity, shown by a white arrow. In a self-acting mechanism, the nucleotide bound to the terminal tubulin controls how tightly that tubulin interacts with the lattice. At the plus-end, the two mechanisms can lead to different outcomes because there are two nucleotides involved – one bound to the terminal β-tubulin, and one at the interface between the terminal tubulin and the microtubule lattice. At the minus-end, however, self-acting and interface-acting mechanisms are equivalent because the incoming nucleotide becomes the interfacial nucleotide. T=GTP, T/D=GTP or GDP, D=GDP. (B and C) Simulated growth rates of GTP microtubule plus- and minus-ends, using arbitrarily chosen parameters that support elongation in the chosen concentration range. (B) In a self-acting mechanism, both plus-end (circles) and minus-end (squares) growth rates are predicted to decrease linearly with the amount of GDP-tubulin. (C) In an interface-acting mechanism, plus-end (circles) growth rates are predicted to be disproportionately impacted by GDP-tubulin relative to minus-end growth rates. Error bars are standard deviation (n=50 per condition) and if not visible, are obscured by the symbols. Simulation parameters are: kon: 1.0 μM–1 s–1, KDlong = 100 μM, KDcorner = 100 nM, KDlong,GDP = 300 mM. The predicted difference between mechanisms at the plus-end is robust across different choices for KDlong, KDcorner, and the GDP weakening effect (Figure 1—figure supplement 3). Note that because the two mechanisms are equivalent at the minus-end, interface-acting simulations for the minus-end use the same simulation results as the self-acting simulations. The total [tubulin] is constant, thus minus-end growth rates decrease in proportion to the decrease in the concentration of GTP-tubulin.
-
Figure 1—source data 1
Simulated growth rates for microtubule plus- and minus-ends under different models for nucleotide action.
- https://cdn.elifesciences.org/articles/89231/elife-89231-fig1-data1-v2.xlsx
Figure 1—figure supplement 1

Implementation of plus- and minus-end models.
(A) The microtubule lattice is represented as a two-dimensional grid; interactions between edge protofilaments generate the seam (dashed line) and mimic the cylindrical nature of the microtubule lattice. Grey and blue boxes represent GMPCPP- and GDP-αβ-tubulin, respectively; white boxes represent empty positions (no tubulin). Arrows show how new subunits can associate at the plus-end or minus-end, respectively. Simulations begin with a microtubule seed, shown here as three rows of GMPCPP-tubulin. Subunit on rates are determined by the on-rate constant (konplus or konminus) and the concentration of tubulin. (B) Implementation of self-acting and interface-acting nucleotide mechanisms in plus-end simulations. Arrows indicate tubulin off-rates from the lattice, with black arrows denoting GMPCPP-tubulin off-rates and blue arrows denoting GDP-tubulin off-rates. (C) Tubulin dissociation rates from the lattice vary with the number of nearest neighbors. Plus-end simulations use the plus-end on-rate constant (konplus), and minus-end simulations use the minus-end on-rate constant (konminus).
Figure 1—figure supplement 2
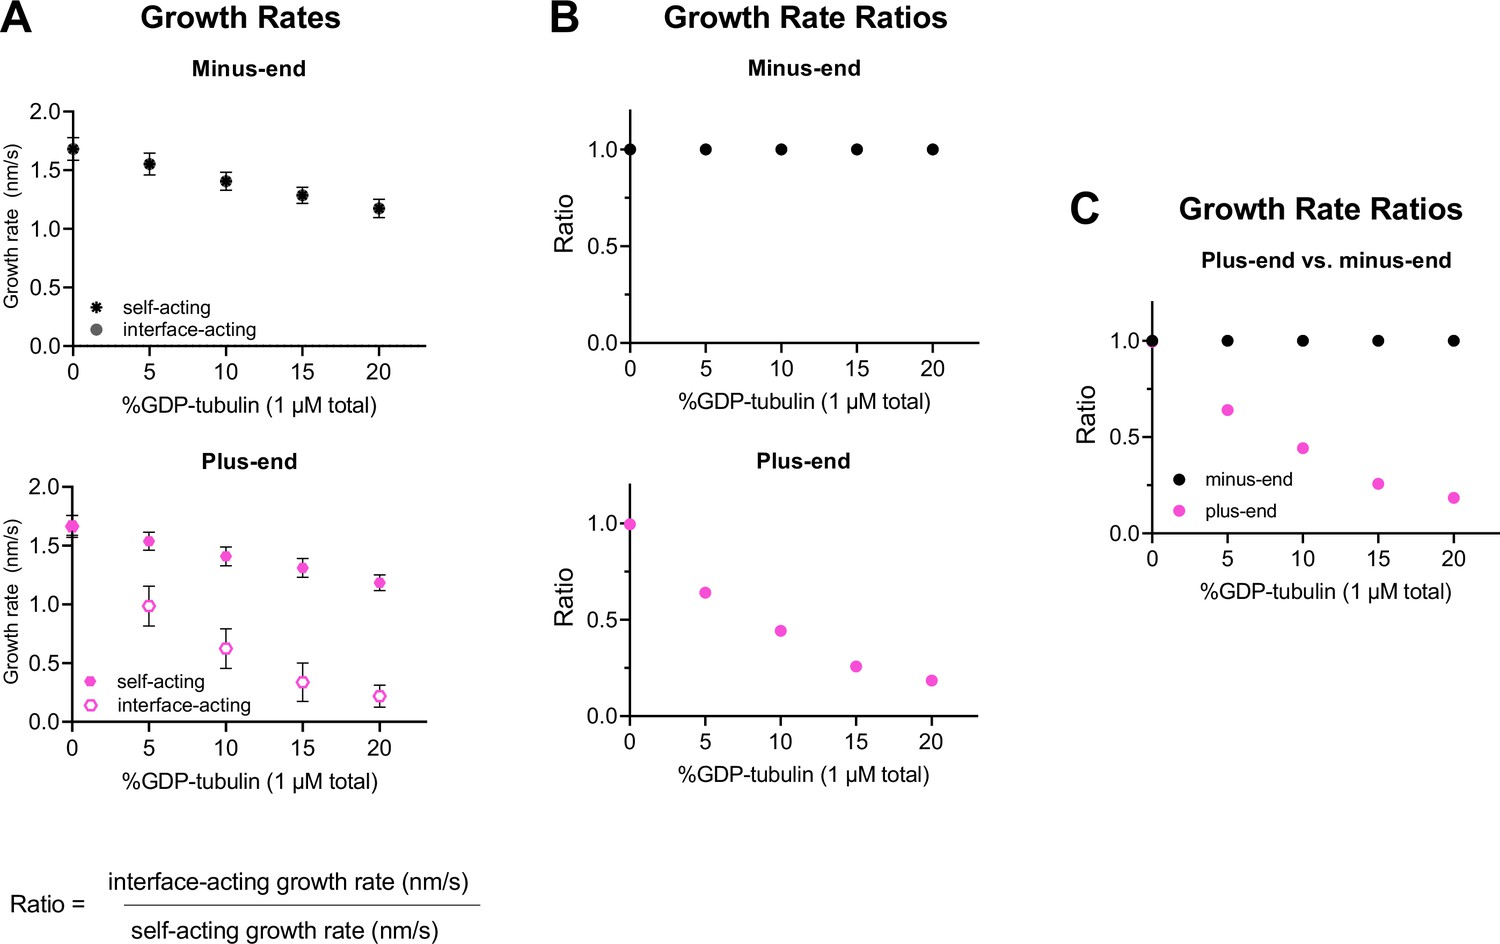
Using simulated growth rates to predict differences between interface- and self-acting nucleotide mechanisms at plus-end and minus-ends.
(A) Simulated minus-end and plus-end growth rates (nm/s) for interface-acting or self-acting nucleotide mechanisms using parameters shown in Figure 1. If growth rate markers are not visible, they are obscured by another marker. Error bars are standard deviation, with n=50 independent simulations per concentration of GDP-tubulin. (B) Growth rate ratios are defined as the growth rate for the interface-acting mechanism divided by the growth rate for the self-acting nucleotide mechanism, as a function of the GDP-tubulin concentration. A ratio of 1 indicates that no difference in growth rates is predicted for self- and interface-acting nucleotide mechanisms. (C) Growth rate ratios of plus- and minus-ends from panel (B) plotted together to emphasize how self- and interface-acting mechanisms predict increasingly different plus-end growth rates with increasing GDP-tubulin, whereas the two mechanisms predict similar minus-end growth rates across a range of GDP-tubulin concentrations.
Figure 1—figure supplement 3
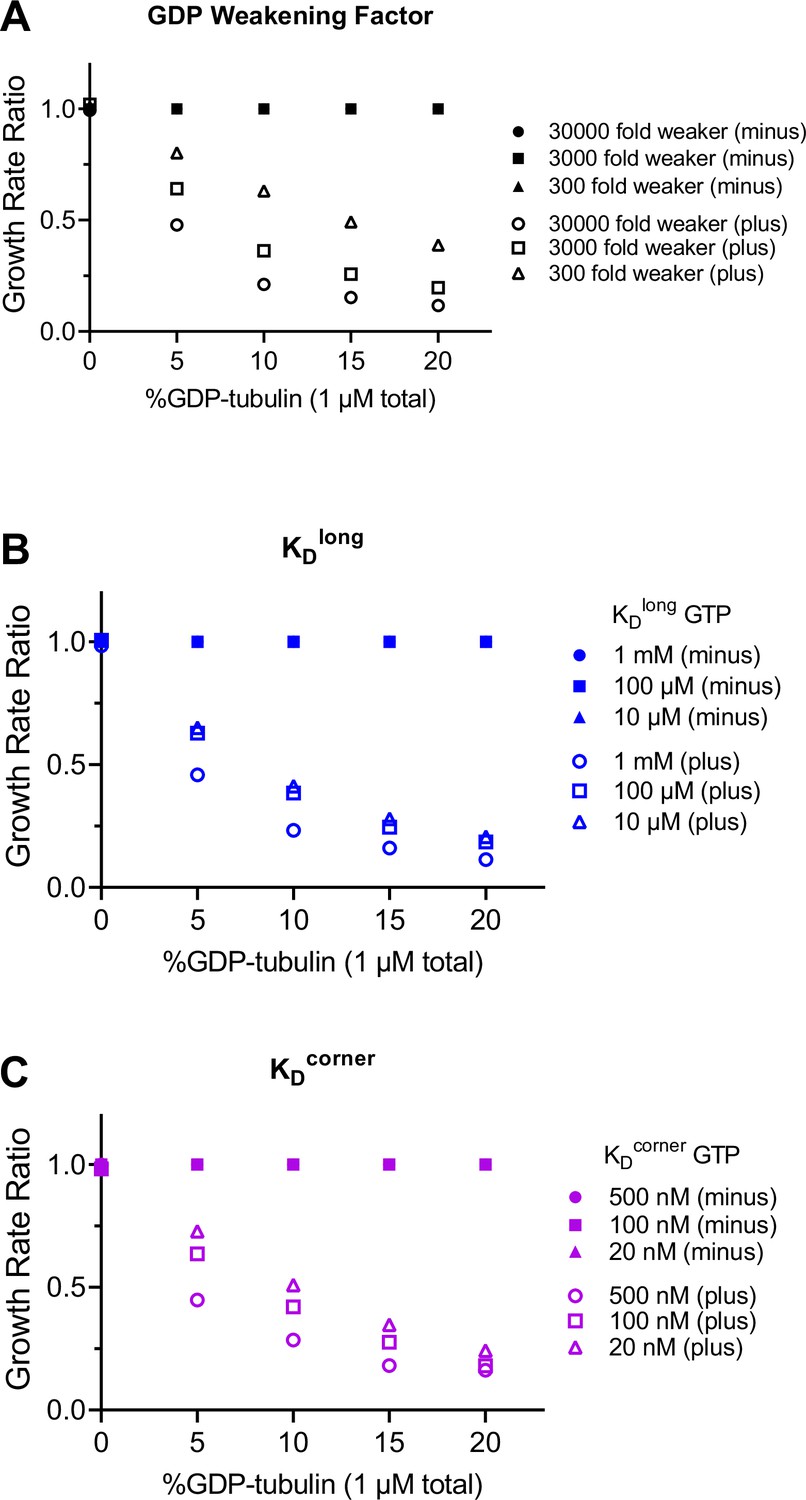
Predicted differences between self- and interface-acting mechanisms at the plus-end are robust to variation in simulation parameters.
(A–C) Ratios of simulated plus-end (open symbols) and minus-end (filled symbols) growth rates for interface- and self-acting nucleotide mechanisms. Growth rate ratios are calculated by dividing the interface-acting growth rate by the self-acting growth rate. A ratio of 1 means that no difference in growth rates is predicted. For each simulation parameter, a weaker and stronger choice (relative to the value used in Figure 1) was tested. The predicted difference between interface-acting and self-acting mechanisms persists, even for different choices of (A) GDP weakening factor (100-fold range), (B) longitudinal interaction (KDlong, 100-fold range), and (C) corner interaction (KDcorner, 25-fold range). The original conditions used in Figure 1 are: GDP weakening factor of 3000, KDlong of 100 μM, and KDcorner of 100 nM. The GDP weakening factor describes the fold change between the GDP- and GTP-type interactions. N=50 simulations per concentration.
Figure 2
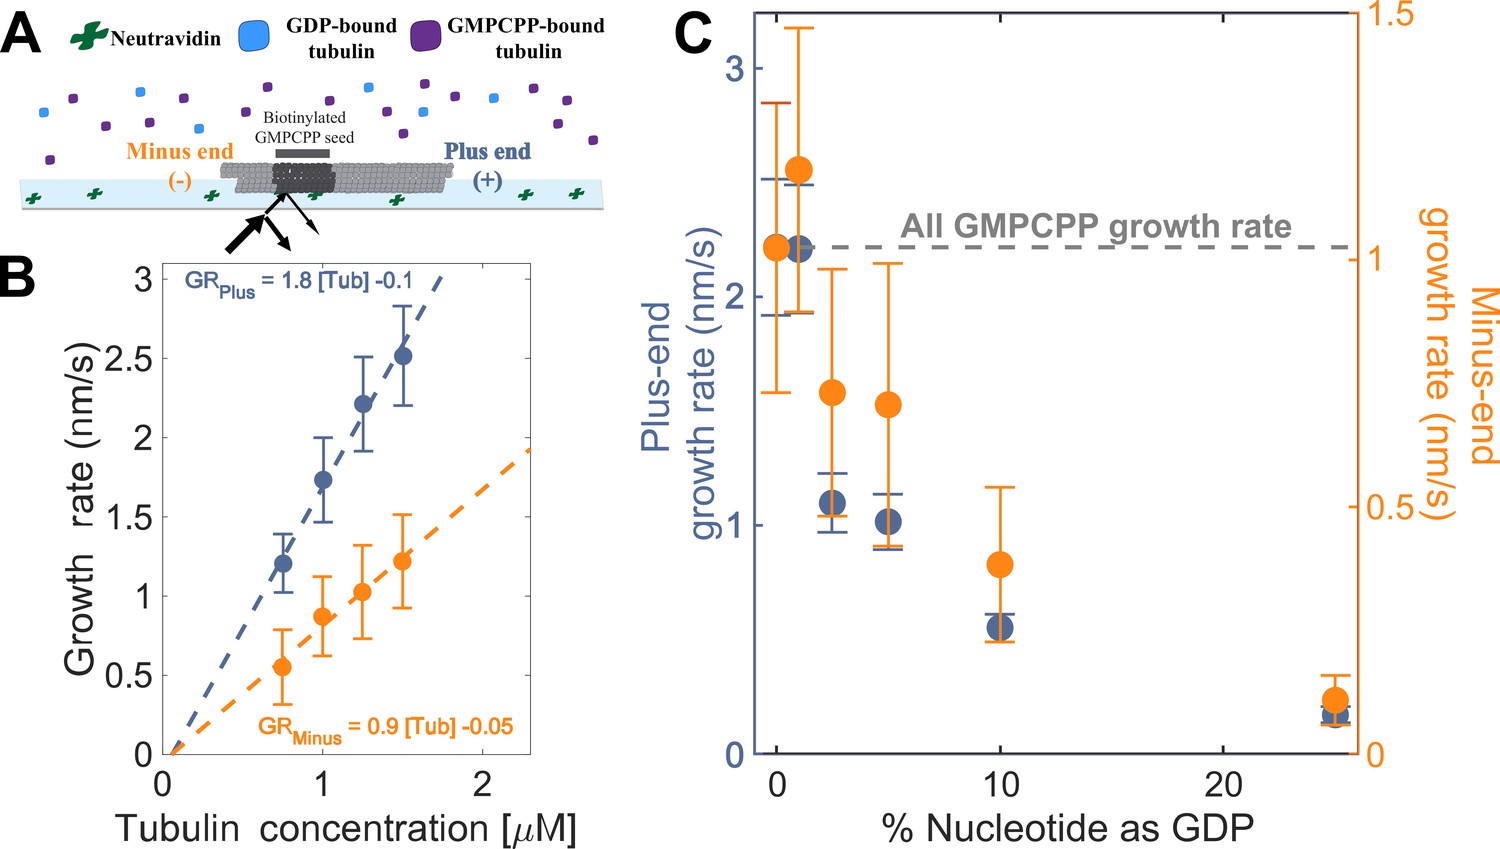
Microtubule plus- and minus-end growth both decrease in the presence of GDP-tubulin.
(A) Schematic of the in vitro assay, in which biotinylated GMPCPP microtubule seeds are attached to a neutravidin-coated cover slip, and microtubule assembly in the presence of tubulin bound to either GDP or GMPCPP is monitored using Interference Reflection Microscopy (IRM). (B) Growth rates of microtubule plus- and minus-ends in GMPCPP as a function of tubulin concentration (n=64–125 for the plus-end and n=39–95 for the minus-end). The error bars denote standard deviation. (C) Plus- (left y-axis) and minus-end (right y-axis) growth rates at 1.25 μM tubulin in mixtures of GDP and GMPCPP containing 1 mM total nucleotide (n=66–121 for the plus-end and n=44–94 for the minus-end). The gray line denotes the ‘all GMPCPP’ growth rates of the two ends. The error bars denote standard deviation. Using a two-sided t-test with unequal variance, differences in the mean normalized growth rates at plus- and minus-ends were statistically significant with P<0.001 for all nucleotide mixtures except 0% GDP.
-
Figure 2—source data 1
Measured growth rates for microtubule plus- and minus-ends.
- https://cdn.elifesciences.org/articles/89231/elife-89231-fig2-data1-v2.xlsx
Figure 3 with 1 supplement
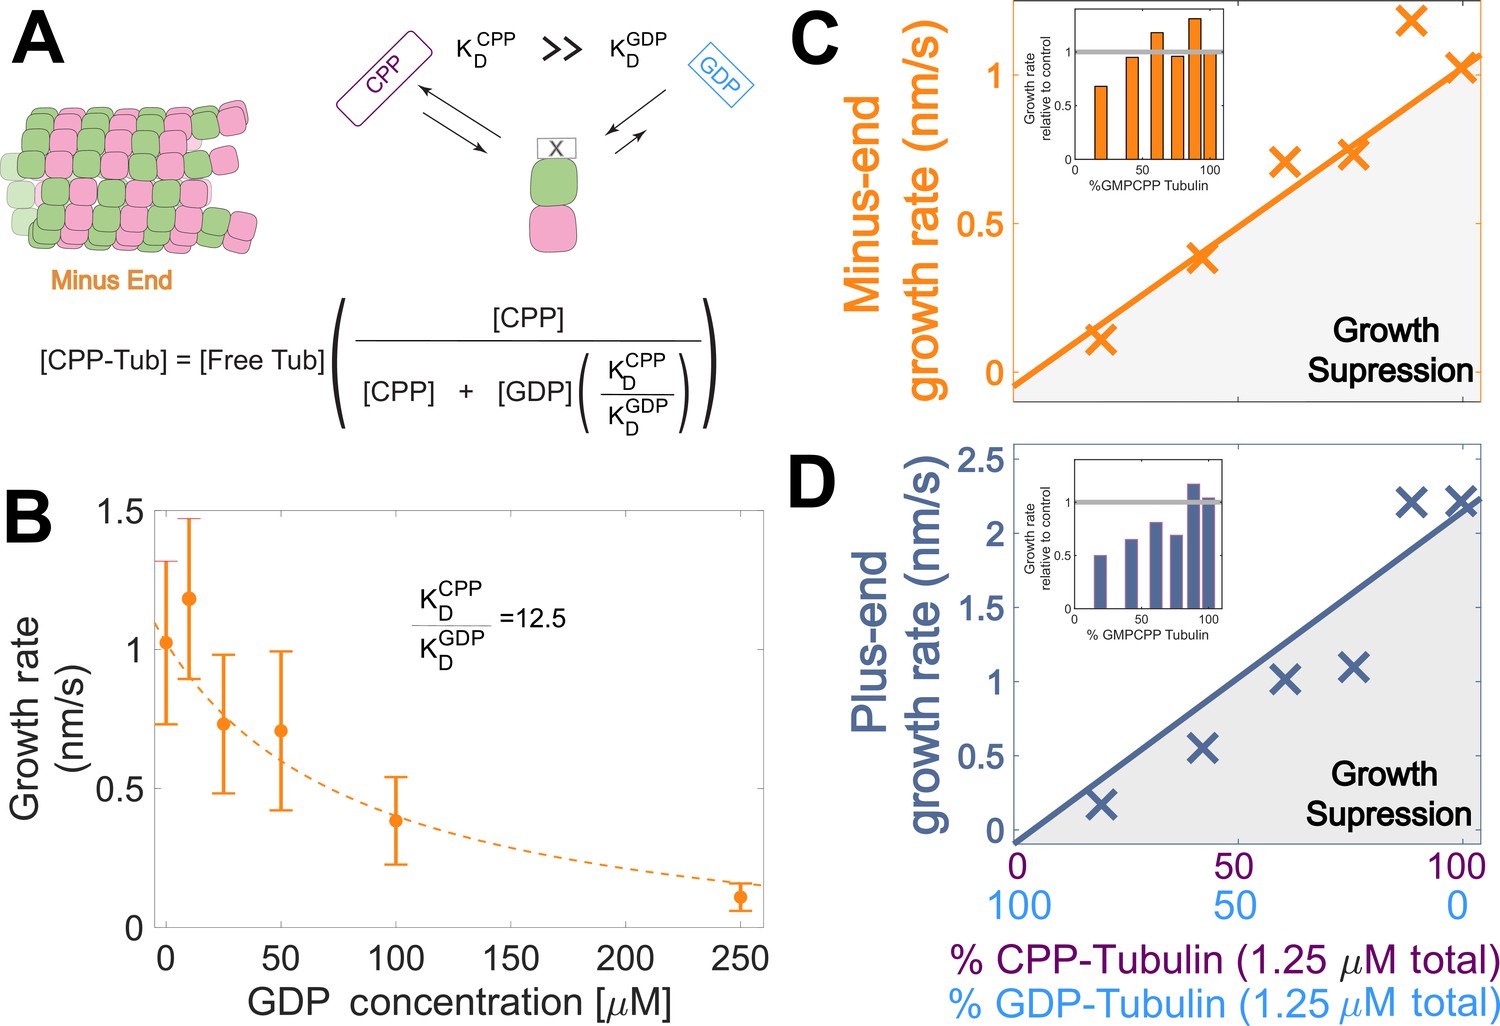
Microtubule plus-end growth is suppressed superstoichiometrically by GDP-tubulin.
(A) Competitive nucleotide binding model. Mixed nucleotide assays result in either GDP- or GMPCPP-bound tubulin landing and creating a nucleotide interface at the minus-end. The concentration of GMPCPP bound tubulin was determined using the concentrations of each nucleotide and their relative affinities (KDCPP/ KDGDP) through a competitive binding model (inset equation). (B) Minus-end growth rates as a function of GDP concentration. GMPCPP-tubulin was assumed to be the only tubulin that can contribute to minus-end growth in the mixed nucleotide assays. Minus-end growth rates over varying GDP concentrations were globally fit to a competitive inhibition model (equation in panel A), which resulted in a GMPCPP-tubulin concentration that was consistent with the ‘all-GMPCPP’ minus-growth curves (Figure 2B). The relative affinity of tubulin for GMPCPP compared to GDP (KDCPP/ KDGDP) was the only free parameter in the model. (C–D) Growth rates from Figure 2C plotted as a function of the fraction of GDP-tubulin, estimated using the known nucleotide content and binding affinities. Growth rates are considered suppressed when falling below the solid lines exhibiting the ‘all-GMPCPP’ minus- and plus-end growth curves. Insets plot growth rates normalized to the ‘GMPCPP-only’ growth rates (gray solid line), showing a disproportionate decrease (~1.5-fold for most concentrations) in plus-end growth. Differences in mean normalized growth rates at plus- and minus-ends were statistically significant with P<0.001 for all nucleotide mixtures except 0% GDP (see Figure 2).
-
Figure 3—source data 1
Measured minus-end growth rates as a function of GDP concentration, and plus- and minus-end growth rates plotted vs the concentration of GDP-tubulin.
- https://cdn.elifesciences.org/articles/89231/elife-89231-fig3-data1-v2.xlsx
Figure 3—figure supplement 1
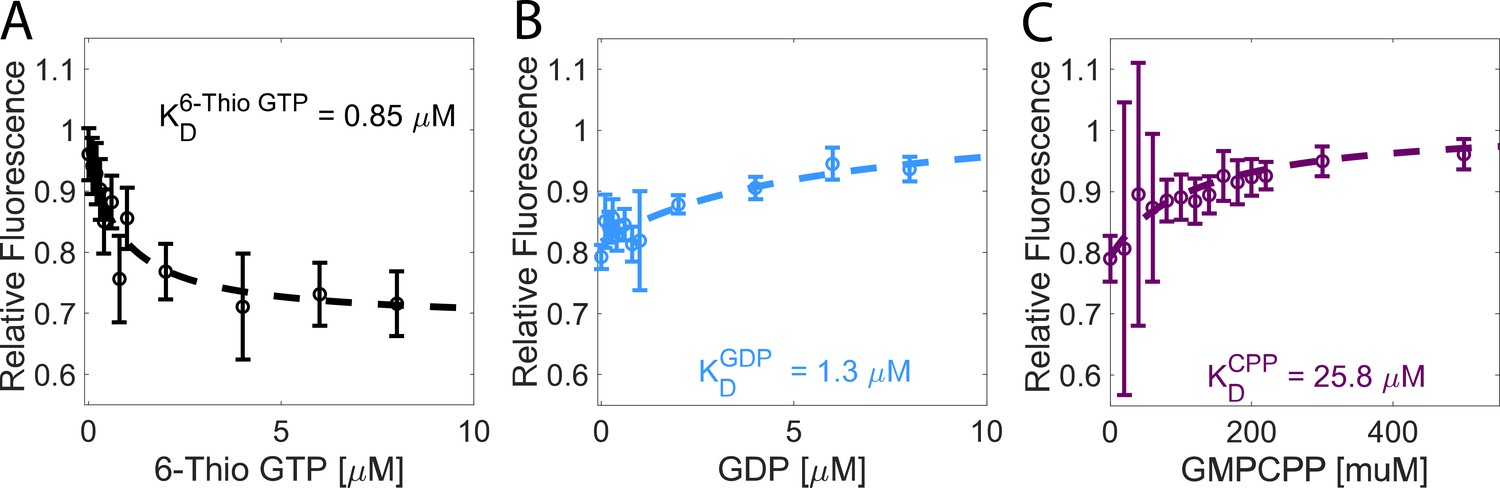
Tubulin has a higher affinity for GDP than for GMPCPP.
(A) The affinity of tubulin for 6-Thio GTP measured by nucleotide-dependent quenching of the tubulin tryptophan fluorescence. Values are the tubulin fluorescence (0.2 μM tubulin) divided by the fluorescence of a signal matched BSA sample to correct for the inner filter effect. Error bars are SEM for n=6 determinations for each sample, accounting for errors in the concentrations of tubulin and BSA, and in the buffer control. (B) Determination of tubulin affinity for GDP. Increasing concentrations of GDP were added to a solution of 0.2 μM tubulin in the presence of 3 μM 6-Thio GTP. GDP displaces 6-Thio GTP from the tubulin, causing unquenching of tryptophan fluorescence. Error bars denote SEM with n=6–11 determinations per point. (C) Determination of tubulin affinity for GMPCPP using an identical approach. Error bars are SEM with n=6 determinations per point.
Figure 4
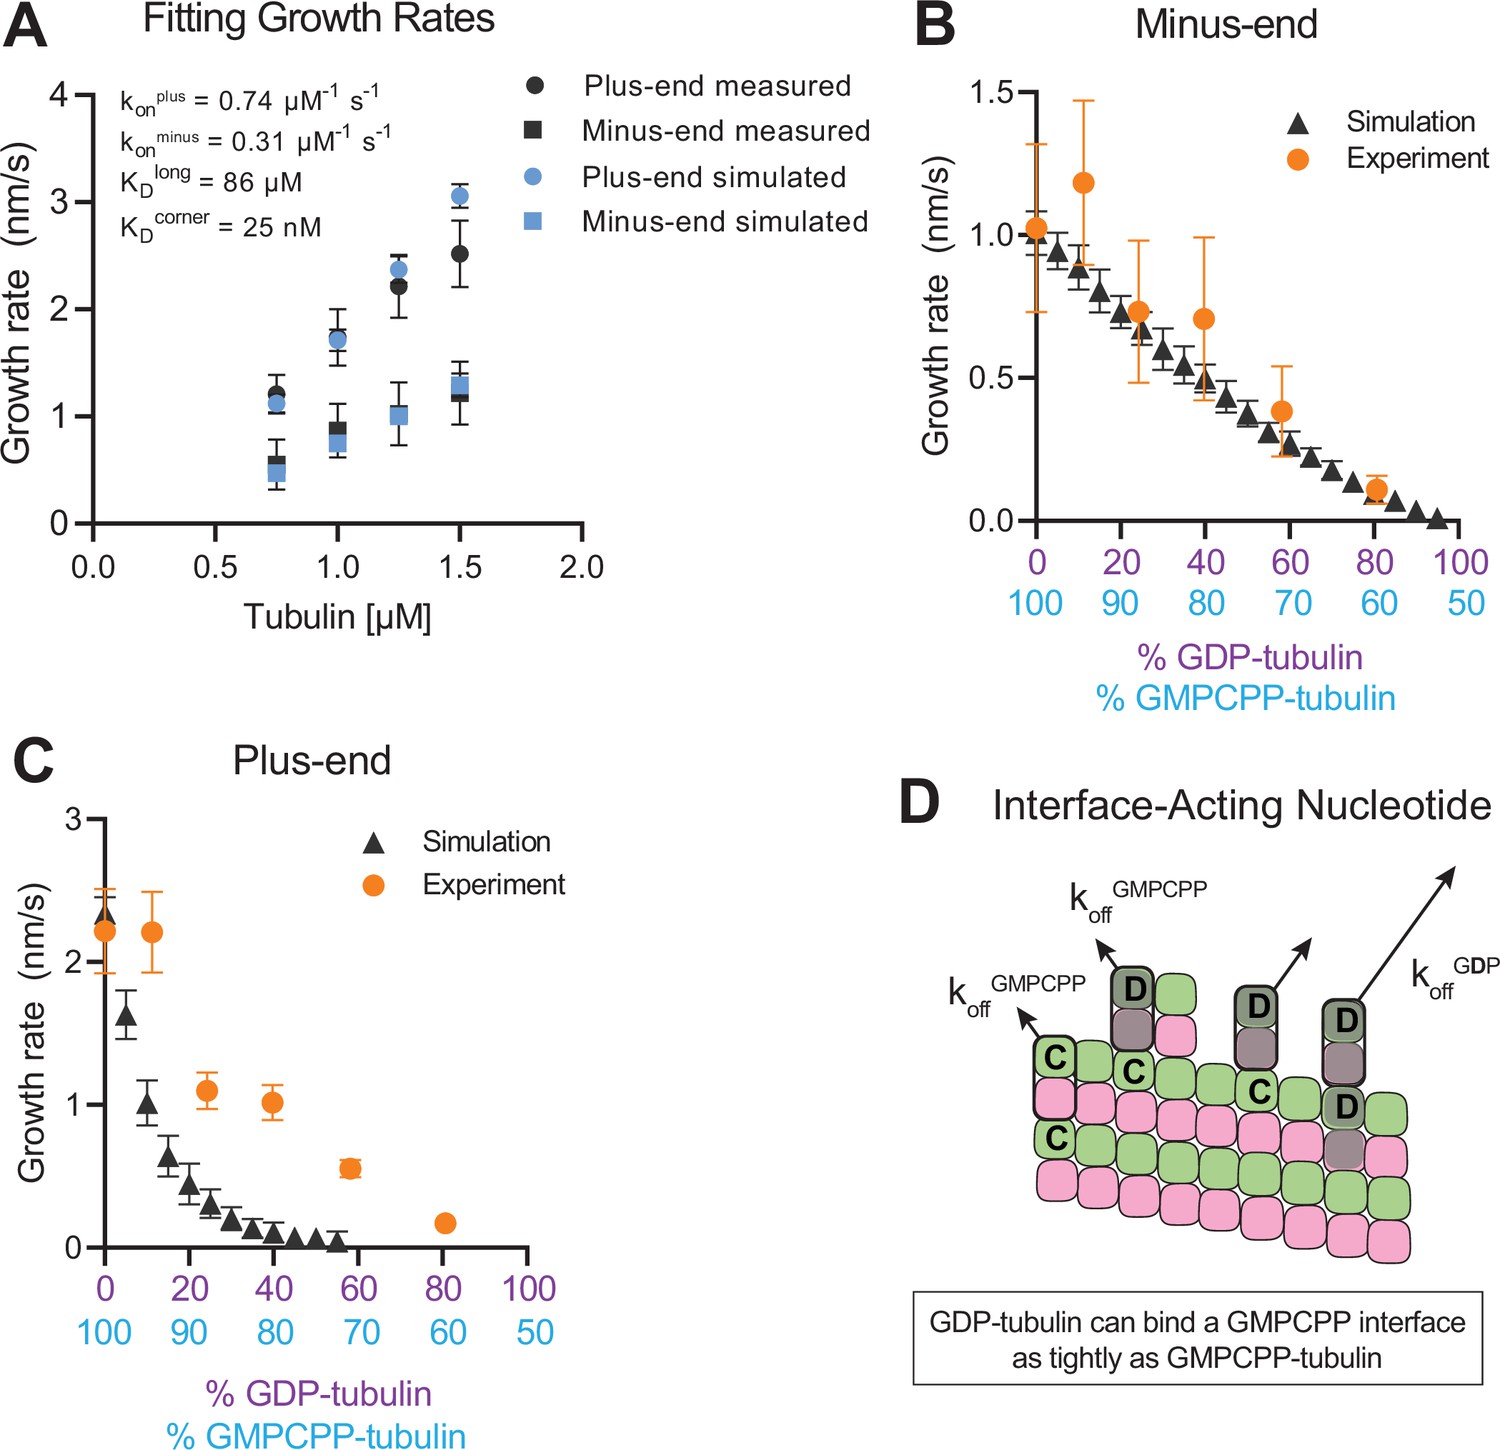
Simulating microtubule growth rates in the presence of GDP-tubulin.
(A) Measured and simulated growth rates for plus- and minus-ends of GMPCPP microtubules. Inset shows the best-fit values for the plus-end and minus-end on-rate constants (konplus and konminus, respectively), longitudinal interaction (KDlong), and corner interaction (KDcorner). Error bars show standard deviation (n=50 per simulated concentration) and are obscured by symbols in some cases; experimental data are replotted from Figure 3. (B and C) Simulated and experimental growth rates at 1.25 μM tubulin in the presence of variable amounts of GDP-tubulin for microtubule minus-ends (B) and plus-ends (C).(D) Cartoon showing how off-rates (koff) of GDP-tubulin at the plus-end are dependent upon the interfacial nucleotide; C=GMPCPP, D=GDP (shaded grey). Long-residing GDP-tubulin bound at corner- (one longitudinal and one lateral contact) or bucket-type (one longitudinal and two lateral contacts) binding sites explains the outsized effects of GDP-tubulin on plus-end elongation.
-
Figure 4—source data 1
Simulated growth rates after model fitting and how they predict the effect of GDP on plus- and minus-end growth.
- https://cdn.elifesciences.org/articles/89231/elife-89231-fig4-data1-v2.xlsx
Figure 5 with 1 supplement
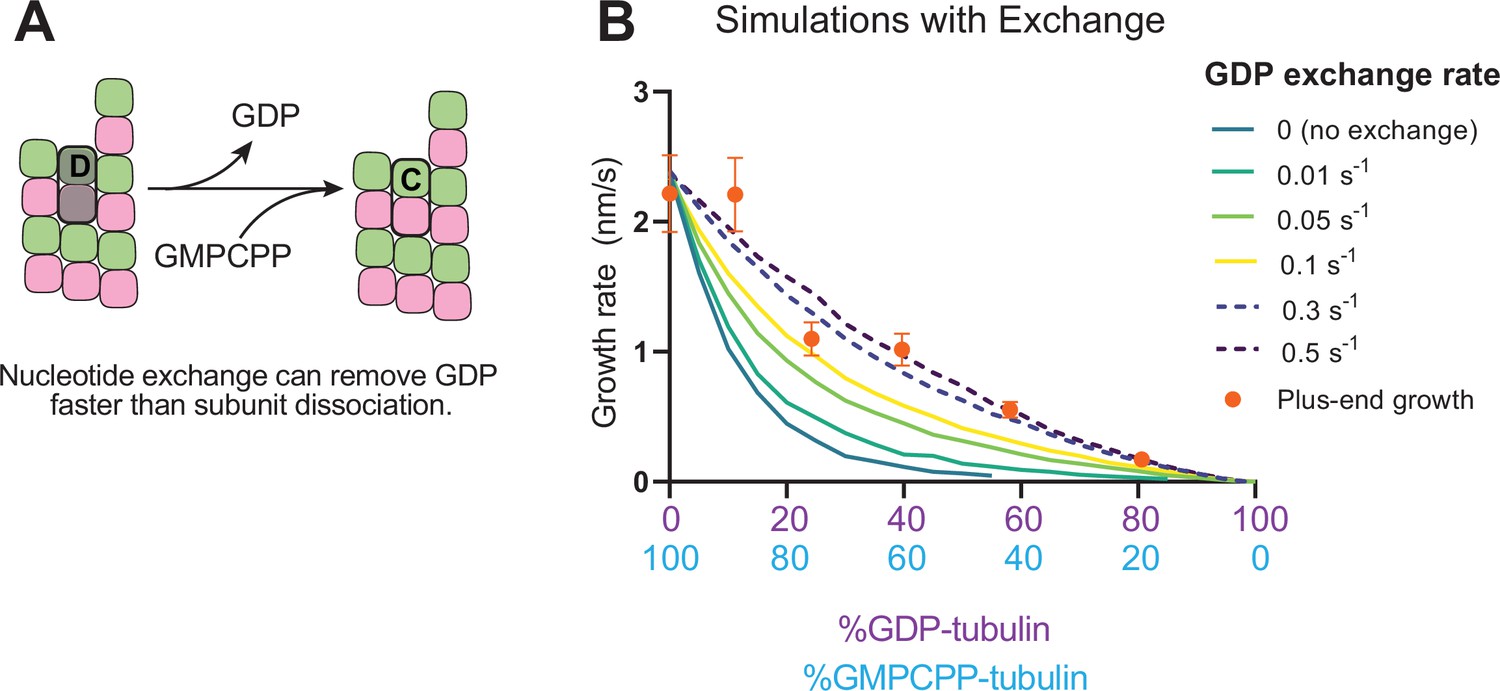
Effects of nucleotide exchange on simulated microtubule plus-end growth rates.
(A) Nucleotide exchange on terminal subunits can mitigate protofilament poisoning at microtubule plus-ends by reducing the lifetime of GDP on the microtubule end. (B) Simulated growth rates of microtubule plus-ends as a function of the nucleotide exchange rate (N=50 per simulated concentration, see Methods), showing that faster rates of exchange modulate the effect of protofilament poisoning. Orange circles show the measured plus-end growth rates (Figure 3).
-
Figure 5—source data 1
How including a finite rate of nucleotide exchange alters predictions of the effect of GDP on growth rate.
- https://cdn.elifesciences.org/articles/89231/elife-89231-fig5-data1-v2.xlsx
Figure 5—figure supplement 1

Implementation and analysis of nucleotide exchange.
(A) Implementation of nucleotide exchange in simulations of plus-ended growth. Terminal exposed subunits can undergo exchange with a finite first-order rate, kexchange (s–1). The probability of exchange to GDP or GMPCPP is determined by the relative concentration of each nucleotide. (B) Root-mean-squared error (RMSE) of predicted growth rates vs. experimental growth rates for a series of exchange rates, across the tested range of GDP- and GMPCPP-tubulin mixtures. Fraction total error is defined as the relative error compared to the error when exchange rate is 0 s–1.
Tables
Table 1
Table 2
Calculated on-rates and off-rates for simulations presented in 1—5Figures 1—5.
On-rate is calculated using the biochemical kon and the concentration of tubulin [µM]. Off-rate is calculated using the biochemical kon and the dissociation constant KD.
| Simulated end | On-rate (s–1) | kofflong (s–1) | koffcorner(s–1) | kofflong GDP (s–1) | koffcorner GDP (s–1) | Tubulin(µM) | |
|---|---|---|---|---|---|---|---|
| Figure 1 | plus | 1 | 100 | 0.1 | 3x10⁵ | 300 | 1 |
| minus | 1 | 100 | 0.1 | 3x10⁵ | 300 | 1 | |
| Figure 4A | plus | 0.9 | 64 | 0.019 | 2.2x10⁵ | 65 | 1.25 |
| minus | 0.4 | 27 | 0.0078 | 9.3x10⁴ | 27.3 | 1.25 | |
| Figure 4B | plus | 0.9 | 64 | 0.019 | 2.2x10⁵ | 65 | 1.25 |
| Figure 4C | minus | 0.4 | 27 | 0.0078 | 9.3x10⁴ | 27.3 | 1.25 |
| Figure 5B | plus | 0.9 | 64 | 0.019 | 2.2x10⁵ | 65 | 1.25 |
Table 3
Simulation parameters for Figure 1—figure supplement 1.
Shading has been added to highlight which simulation parameters were changed, with respect to the reference parameters used in Figure 1. The GDP fold weaker values are the fold change between the GTP- and GDP-type interaction.
| Figure 1—figure supplement 3 | change | kon(µM–1 s–1) | KDlongGTP(µM) | KDcornerGTP(µM) | KDlongGDP(µM) | KDcornerGDP(µM) | GDPlong fold weaker | GDPcorner fold weaker | Tubulin (µM) |
|---|---|---|---|---|---|---|---|---|---|
| Figure 1—figure supplement 3A | GDP weakening | 1.0 | 100 | 0.1 | 3x10⁶ | 3000 | 30,000 | 30,000 | 1 |
| Figure 1—figure supplement 3A | GDP weakening | 1.0 | 100 | 0.1 | 3x10⁵ | 300 | 3,000 | 3,000 | 1 |
| Figure 1—figure supplement 3 | GDP weakening | 1.0 | 100 | 0.1 | 3x10⁴ | 30 | 300 | 300 | 1 |
| Figure 1—figure supplement 3 | KDlong | 1.0 | 1000 | 0.1 | 3x10⁶ | 300 | 3000 | 3000 | 1 |
| Figure 1—figure supplement 3 | KDlong | 1.0 | 100 | 0.1 | 3x10⁵ | 300 | 3000 | 3000 | 1 |
| Figure 1—figure supplement 3 | KDlong | 1.0 | 10 | 0.1 | 3x10⁴ | 300 | 3000 | 3000 | 1 |
| Figure 1—figure supplement 3 | KDcorner | 1.0 | 100 | 0.5 | 3x10⁵ | 1500 | 3000 | 3000 | 1 |
| Figure 1—figure supplement 3 | KDcorner | 1.0 | 100 | 0.1 | 3x10⁵ | 300 | 3000 | 3000 | 1 |
| Figure 1—figure supplement 3 | KDcorner | 1.0 | 100 | 0.02 | 3x10⁵ | 60 | 3000 | 3000 | 1 |
Table 4
Calculated on-rates and off-rates for simulations in Figure 1—figure supplement 1.
On-rate is calculated using the biochemical kon and the concentration of tubulin [µM]. Off-rate is calculated using the biochemical kon and the dissociation constant KD. All simulations in Figure 1—figure supplements 2 and 3 use the same biochemical kon for plus-end and minus-end simulations, as was done in Figure 1. Shading highlights which off-rates changed, with respect to the original values in Figure 1.
| Figure 1—figure supplement 3 | On-rate (s–1) | kofflong GTP (s–1) | koffcorner GTP (s–1) | kofflong GDP (s–1) | koffcorner GDP (s–1) | Tubulin (µM) |
|---|---|---|---|---|---|---|
| Figure 1—figure supplement 3A | 1 | 100 | 0.1 | 3x10⁶ | 3000 | 1 |
| Figure 1—figure supplement 3A | 1 | 100 | 0.1 | 3x10⁵ | 300 | 1 |
| Figure 1—figure supplement 3A | 1 | 100 | 0.1 | 3x10⁴ | 30 | 1 |
| Figure 1—figure supplement 3B | 1 | 1000 | 0.1 | 3x10⁶ | 300 | 1 |
| Figure 1—figure supplement 3B | 1 | 100 | 0.1 | 3x10⁵ | 300 | 1 |
| Figure 1—figure supplement 3B | 1 | 10 | 0.1 | 3x10⁴ | 300 | 1 |
| Figure 1—figure supplement 3C | 1 | 100 | 0.5 | 3x10⁵ | 1500 | 1 |
| Figure 1—figure supplement 3C | 1 | 100 | 0.1 | 3x10⁵ | 300 | 1 |
| Figure 1—figure supplement 3C | 1 | 100 | 0.02 | 3x10⁵ | 60 | 1 |
Additional files
Download links
A two-part list of links to download the article, or parts of the article, in various formats.
Downloads (link to download the article as PDF)
Open citations (links to open the citations from this article in various online reference manager services)
Cite this article (links to download the citations from this article in formats compatible with various reference manager tools)
Interface-acting nucleotide controls polymerization dynamics at microtubule plus- and minus-ends
eLife 12:RP89231.
https://doi.org/10.7554/eLife.89231.3


