Mitochondrial temperature homeostasis resists external metabolic stresses
- Faculty of Medicine and Health Technology, Tampere University, Finland
- Université Paris Cité, Inserm, Maladies Neurodéveloppementales et Neurovasculaires, France
- SANKEN (The Institute of Scientific and Industrial Research), Osaka University, Japan
- Department of Chemistry, POSTECH, Republic of Korea
- Department of Environment and Genetics, La Trobe University, Australia
Figures
Figure 1
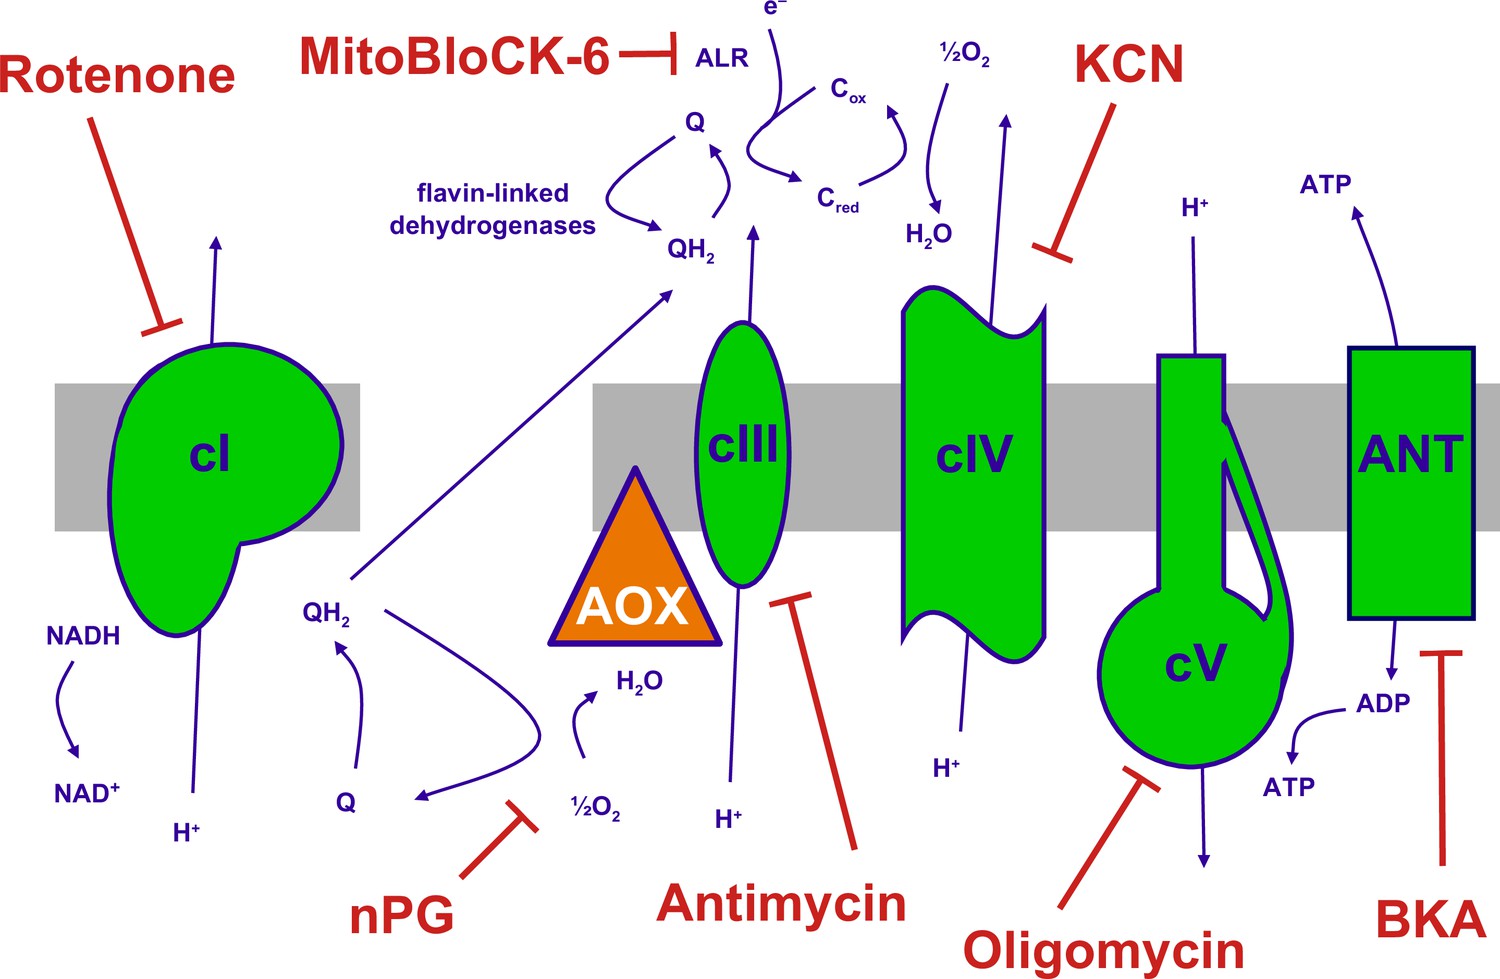
The mitochondrial oxidative phosphorylation (OXPHOS) system and inhibitors.
Summary of the major components of the OXPHOS system and classic inhibitors. Protonmotive OXPHOS enzyme complexes (cI, cIII, cIV, cV) shown in green, the non-protonmotive transgenically introduced alternative oxidase (AOX) from Ciona intestinalis in orange, the inner mitochondrial membrane in grey. Ions and small molecules indicated in purple, inhibitors in brick-red. BKA – bongkrekic acid, an inhibitor of the adenine nucleotide translocase (ANT). nPG – n-propyl gallate, an inhibitor of AOX, Q – ubiquinone (oxidised coenzyme Q), QH2 – ubiquinol (reduced coenzyme Q), cred, cox – reduced and oxidised forms of cytochrome c, respectively. Complex I (cI), along with a number of flavin-linked dehydrogenases, one of which is succinate dehydrogenase, also described as complex II, each reduce ubiquinone, thus contributing input electrons to complex III (cIII). ALR – ‘augmenter of liver regeneration’, Evr1 in yeast, acts as an additional feeder of electrons to cytochrome c, from the oxidation of sulfhydryl groups in proteins destined for the mitochondrial inter-membrane space via the Mia40 pathway and is inhibited by MitoBLloCK-6.
Figure 2 with 5 supplements
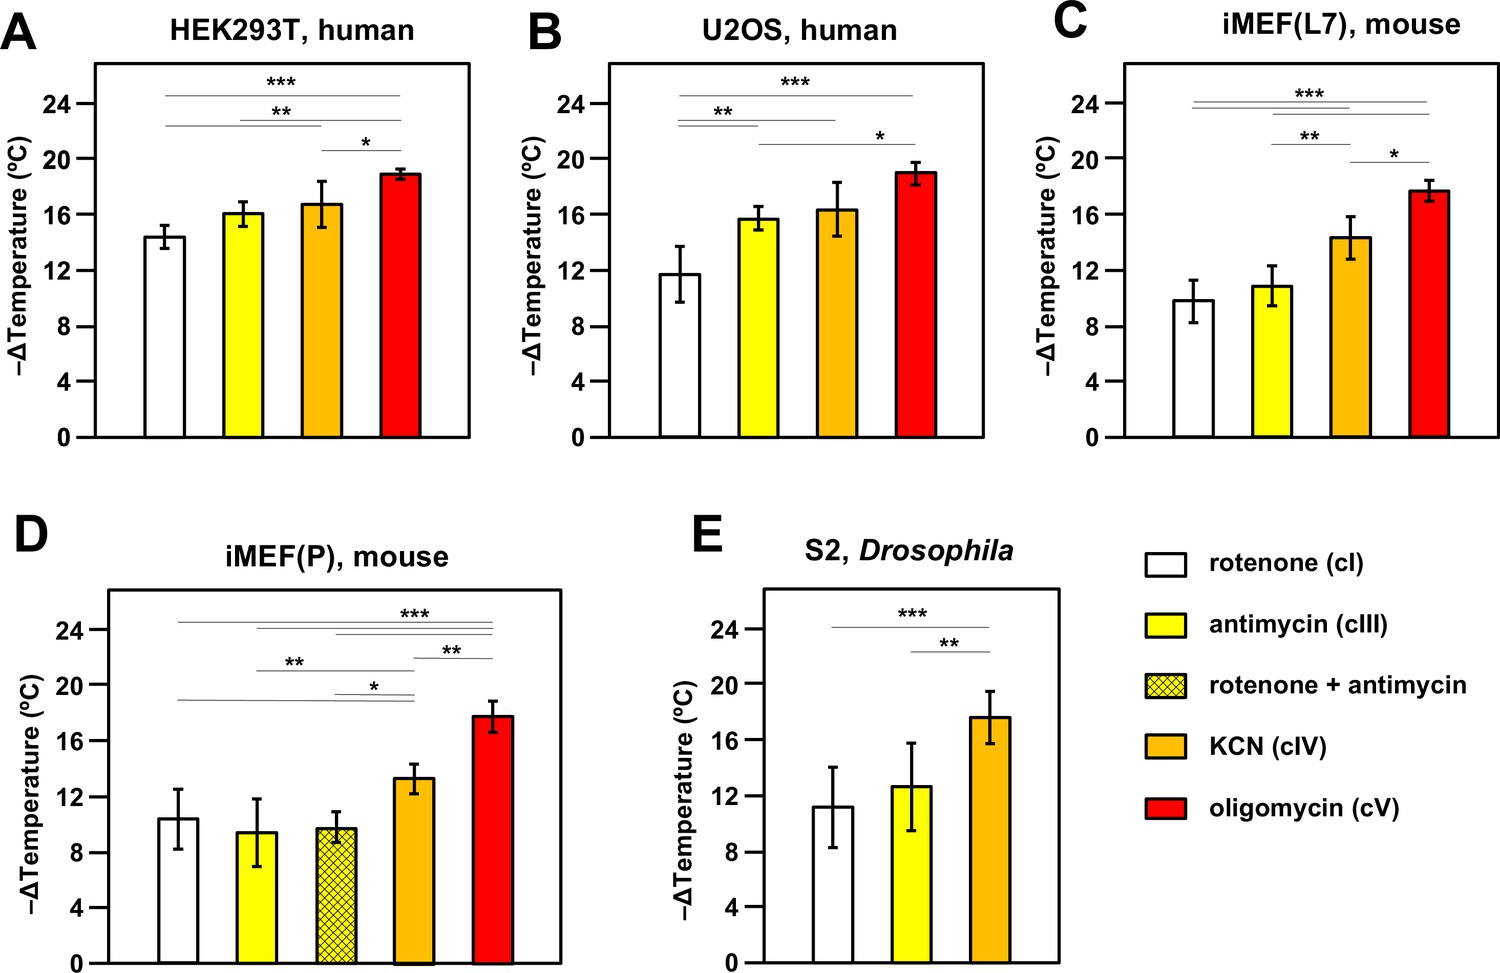
Oxidative phosphorylation (OXPHOS) inhibitors decrease mitochondrial temperature to different extents.
Extrapolated mitochondrial temperature shifts (means ± SD for at least five independent experiments in each case), based on Mito Thermo Yellow (MTY) fluorescence in (A-E) five different cell lines treated with the indicated OXPHOS inhibitors, with internal temperature calibration at the end of each experiment. *, **, *** denote significantly different data sets (one-way ANOVA with Tukey HSD post hoc test, p<0.05, 0.01, and 0.001, respectively). Note that a stable reading could not be obtained for S2 cells treated with oligomycin (Figure 2—figure supplement 5D), hence reliable calibration was not possible. iMEF(L7) and iMEF(P) are two isolates of immortalised, embryonic fibroblasts derived from wild-type C57Bl/6J mice.
-
Figure 2—source data 1
No title.
- https://cdn.elifesciences.org/articles/89232/elife-89232-fig2-data1-v3.xlsx
-
Figure 2—source data 2
No title.
- https://cdn.elifesciences.org/articles/89232/elife-89232-fig2-data2-v3.xlsx
-
Figure 2—source data 3
No title.
- https://cdn.elifesciences.org/articles/89232/elife-89232-fig2-data3-v3.xlsx
-
Figure 2—source data 4
No title.
- https://cdn.elifesciences.org/articles/89232/elife-89232-fig2-data4-v3.xlsx
-
Figure 2—source data 5
No title.
- https://cdn.elifesciences.org/articles/89232/elife-89232-fig2-data5-v3.xlsx
Figure 2—figure supplement 1

Instrumentation for mitochondrial temperature estimation using fluorescent probes.
Schematic illustration of spectrophotometer, QuantaMaster QM-6/2003 LPS-220B with a Peltier temperature-controlled sample cell chamber. Waterbath (Julabo CORIO CD, Germany) with refrigerated/heated circulator (−20°C to 150°C) provides accurate temperature range via circulation around the sample cell chamber. The xenon lamp (Xenon short arc UXL 75XE, USHIO, Japan) used as the light excitation source. The excitation monochromator selects the desired wavelength of excitation light, which is focused at the sample position. The emission monochromator is scanned across the desired emission range and fluorescence intensity is recorded in the detector as a function of emission wavelength. While data is recorded, the cell sample is stirred continuously, maintaining oxygen concentration far above the level required for fully active cellular respiration. For instrument validation see Figure 2—figure supplement 2. Illustration by Maria Carretero-Junquera.
Figure 2—figure supplement 2
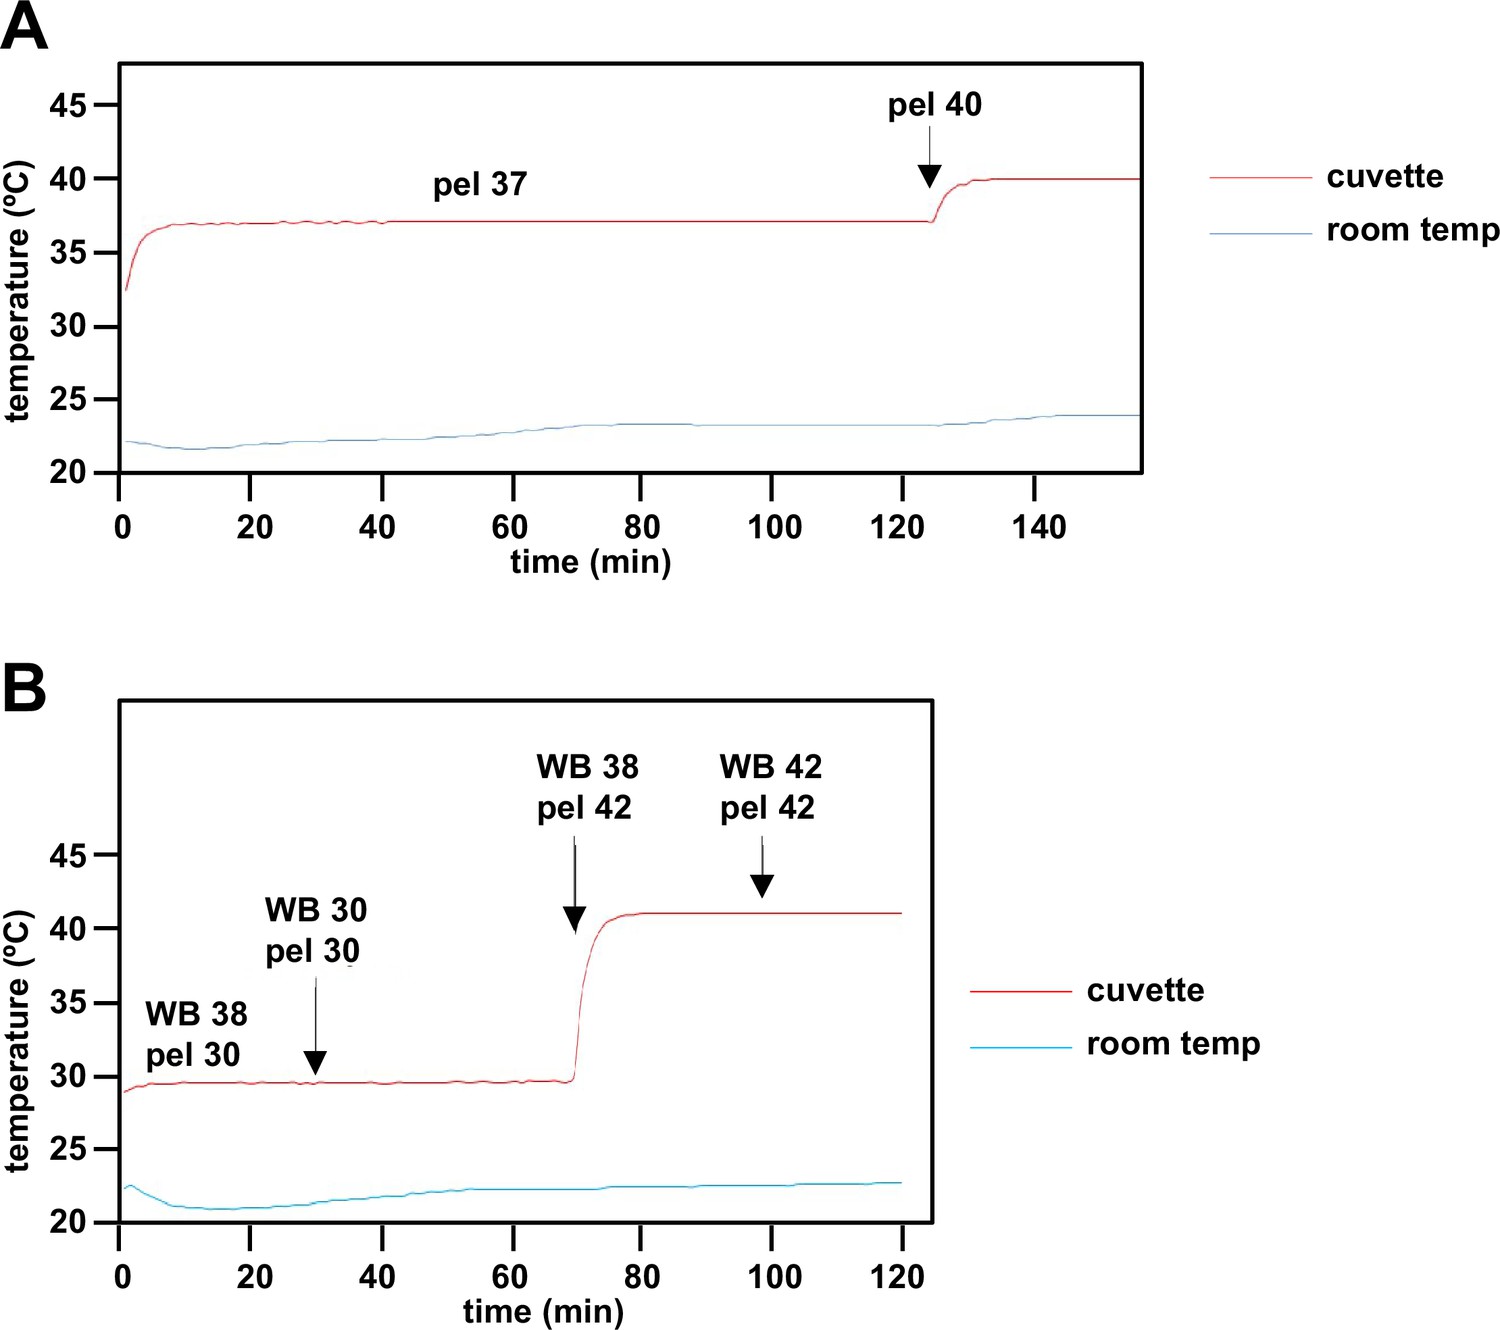
Instrument validation steps for estimation of mitochondrial temperature.
(A) In an initial step, an external temperature probe was used to validate the temperature readings of components of the apparatus (water bath - WB, Peltier - pel, cuvette) as shown on the digital displays. After a 3°C temperature shift, the Peltier took ~2 min to stabilise at the new temperature, and held steady despite minor fluctuations in the external room temperature. (B) The cuvette temperature was not affected by water bath temperature changes or differences from the set temperature of the Peltier. The water bath temperature (not shown) itself took ~5–6 min to restabilise. Note that the cuvette temperature in steady state was 1°C lower than that of the Peltier, which was taken account of in the calibration shown in Figure 3D.
Figure 2—figure supplement 3
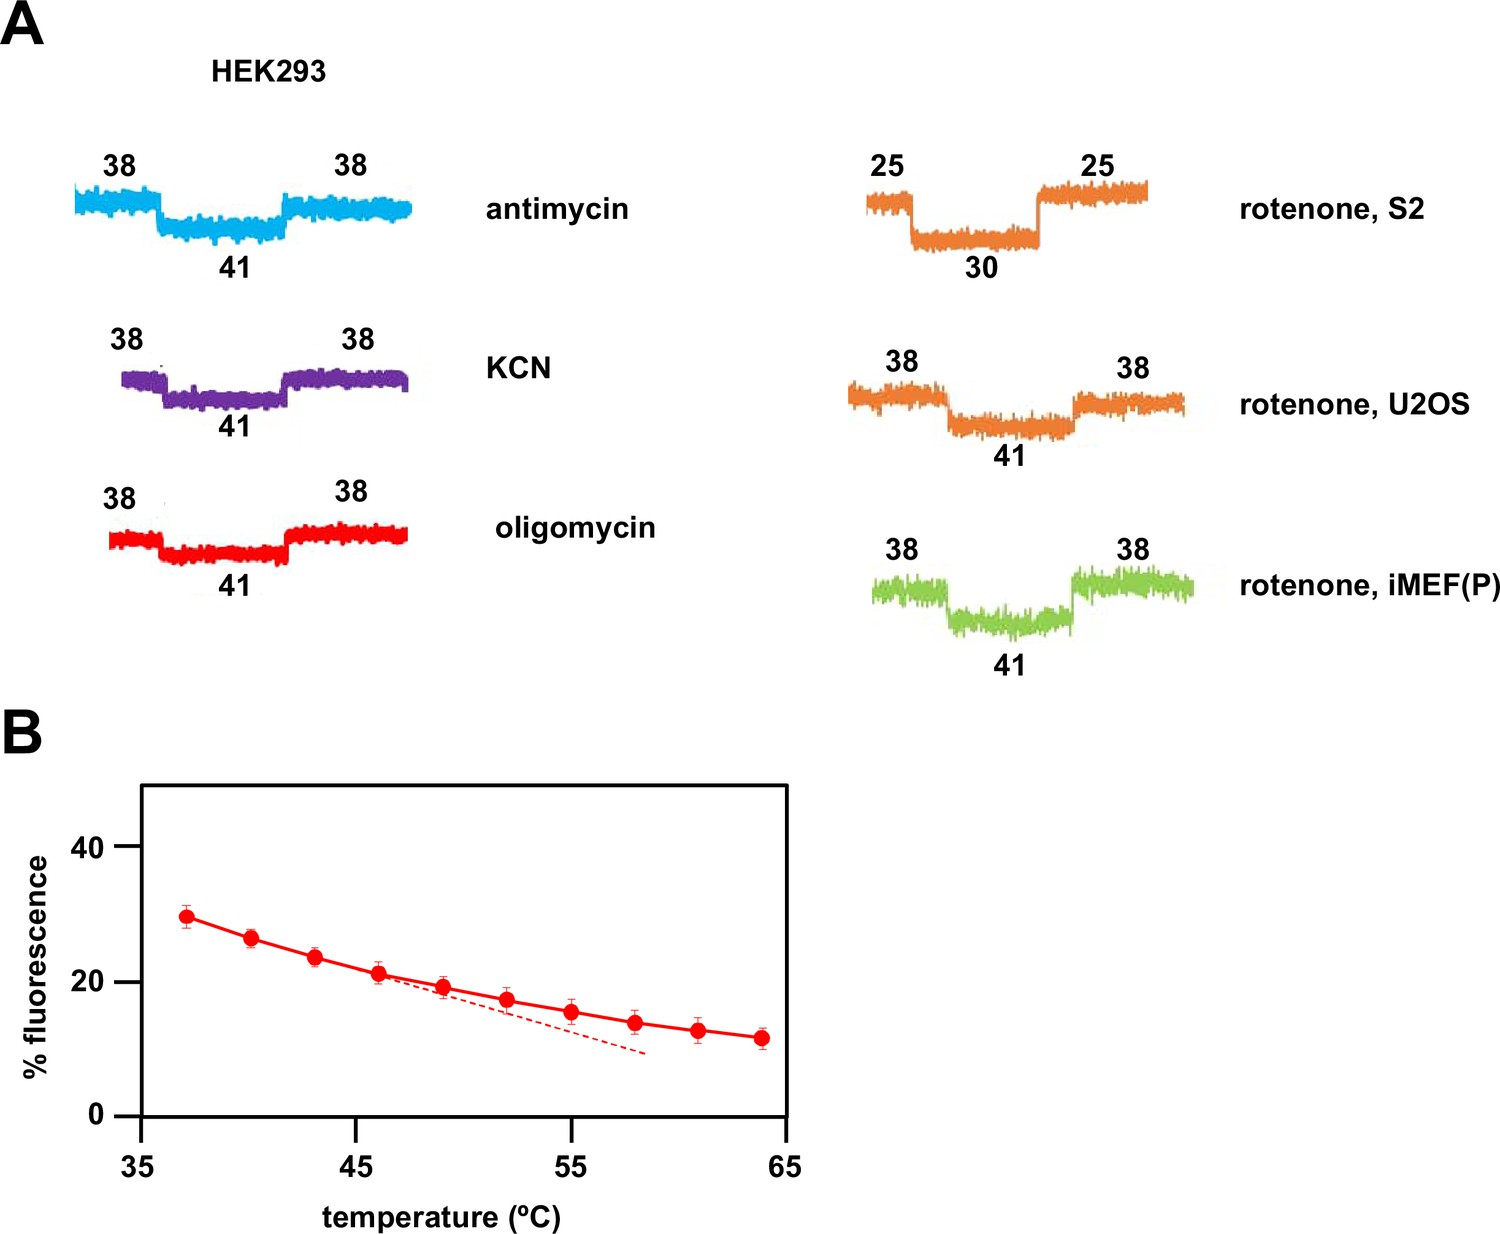
Fluorescence calibration steps for estimation of mitochondrial temperature.
(A) Sample traces showing calibration steps after fluorescence of the indicated inhibitor-treated cells had reached a steady value. Vertical axes are arbitrary values, horizontal axes (time) rescaled for uniformity. In each case fluorescence reached a new equilibrium value rapidly after the externally applied shifts in temperature, as indicated (°C). (B) Variation of Mito Thermo Yellow (MTY) fluorescence in PBS with temperature. Each data point is the mean ± SD from five independent experiments. The dotted line indicates the slight deviation from linearity at higher temperatures, implying that MTY-based mitochondrial temperature may be in error by ~2°C in the 50–60°C range.
-
Figure 2—figure supplement 3—source data 1
No title.
- https://cdn.elifesciences.org/articles/89232/elife-89232-fig2-figsupp3-data1-v3.xlsx
Figure 2—figure supplement 4
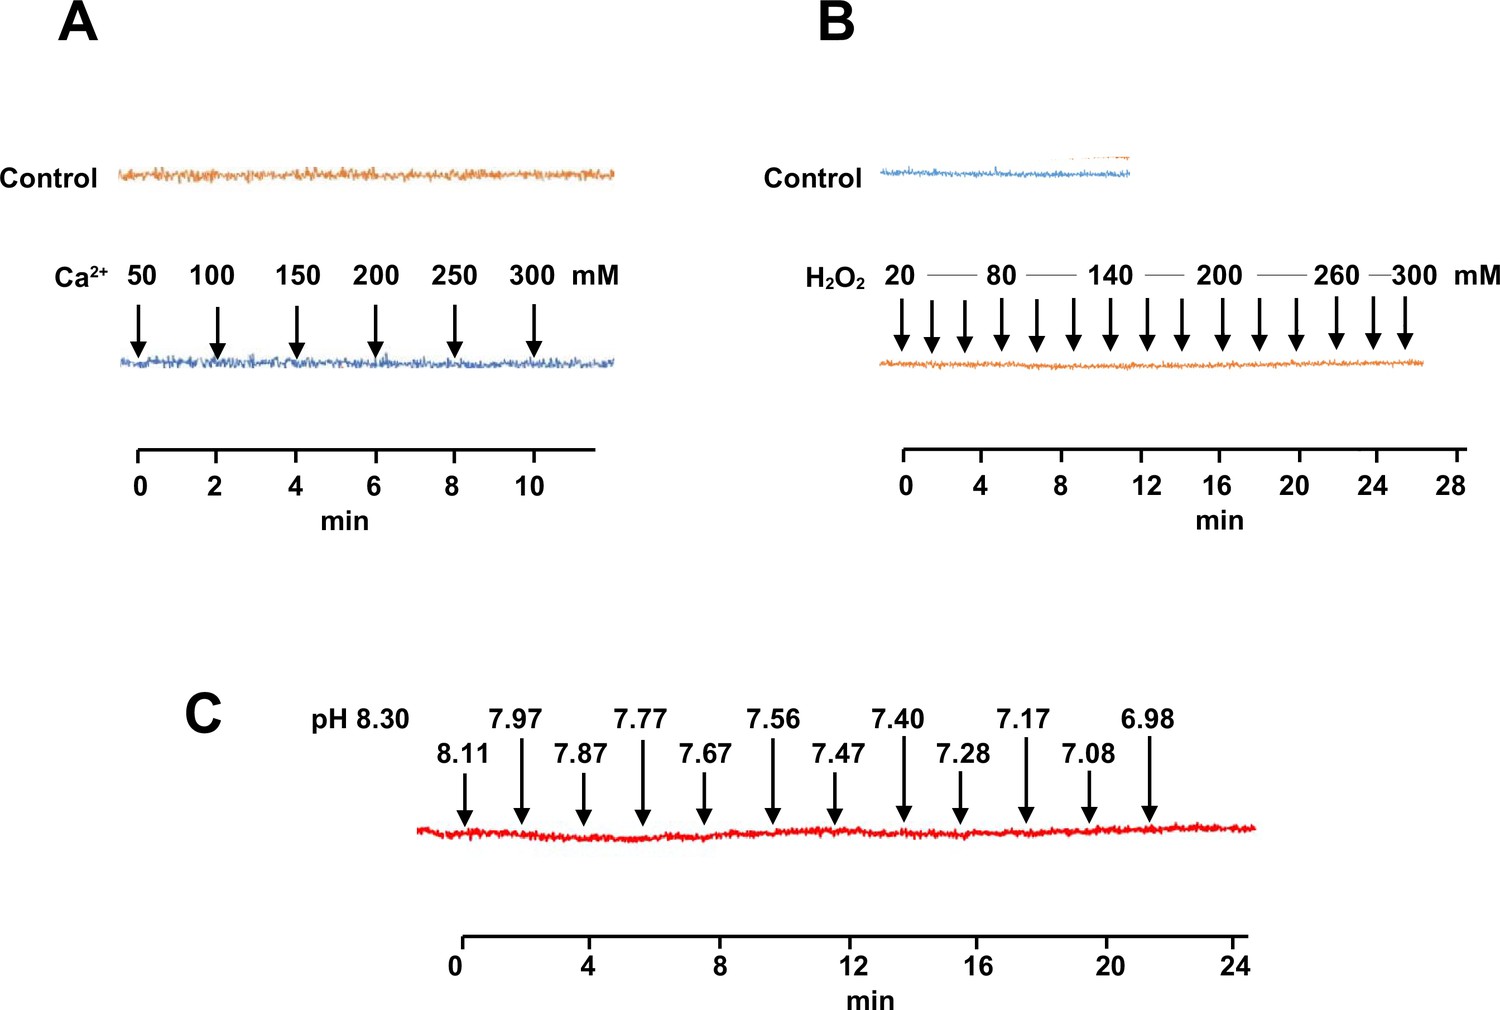
Independence of Mito Thermo Yellow (MTY) fluorescence from parameters other than temperature.
Response of MTY fluorescence to changes in (A) calcium concentration, (B) hydrogen peroxide, and (C) pH over time (since first addition of supplement to PBS). Supplements were added sequentially to the cuvette, to bring samples to successively higher concentrations (A, B) or pH (C). Each trace is a mean from five independent experiments. Actual pH changes were verified in parallel samples. Note that some traces showed a very slight but continuous bleaching effect with time that was independent of the addition of the supplements and was seen also in control traces for unsupplemented samples analysed in parallel: this has been corrected for, by realigning traces back to the horizontal.
Figure 2—figure supplement 5

Supplementary data on effects of oxidative phosphorylation (OXPHOS) inhibitors on mitochondrial temperature.
(A) Representative fluorescence traces, uniformly rescaled, for Mito Thermo Yellow (MTY)-labelled iMEF(P) cells treated with the indicated combinations of OXPHOS inhibitors. Vertical scale (not shown): arbitrary values to similar scale. Rotenone+antimycin (panel i) gave the same stable fluorescence reading as the individual inhibitors, whereas other combinations (panels ii–vi) showed prolonged and/or continuous decline of the fluorescence reading, which is likely be due to dye leakage upon loss of membrane potential, as shown previously (Chrétien et al., 2018) (see Discussion for further exploration of this issue). For this reason we did not attempt to interpret findings from combinations of inhibitors other than rotenone plus antimycin (Figure 2D). (B) Fluorescence trace for addition of 100 μM MitoBloCK-6 to MTY-stained cells. Note the immediate >20-fold increase in fluorescence intensity upon addition of the drug. (C) Extrapolated mitochondrial temperature shifts for iMEFs grown in different media and treated with rotenone. Data for lines iMEF(L7) and iMEF(P) grown in normal glucose (glc) medium are from the experiments shown in Figure 2C and D, respectively. Gal – galactose. Lo glc – low-glucose medium (see Materials and methods). Data are shown as scatter plots to indicate the distributions. There are no significant differences between the groups (one-way ANOVA with Tukey HSD post hoc test). (C) Representative, uniformly scaled traces of MTY fluorescence in S2 (panel i) and U2OS (panel iii) cells treated with oligomycin and S2 cells treated with KCN (panel ii), as indicated. For clarity, vertical scale (arbitrary values) and temperature calibration are omitted. Fluorescence in oligomycin-treated S2 cells had not reached a stable value even 2 hr after addition of the drug; therefore, no meaningful calibration could be conducted. Treatment of other cell lines with oligomycin or of S2 cells with other OXPHOS inhibitors did not produce this problem, as per the examples shown.
-
Figure 2—figure supplement 5—source data 1
No title.
- https://cdn.elifesciences.org/articles/89232/elife-89232-fig2-figsupp5-data1-v3.xlsx
Figure 3 with 3 supplements
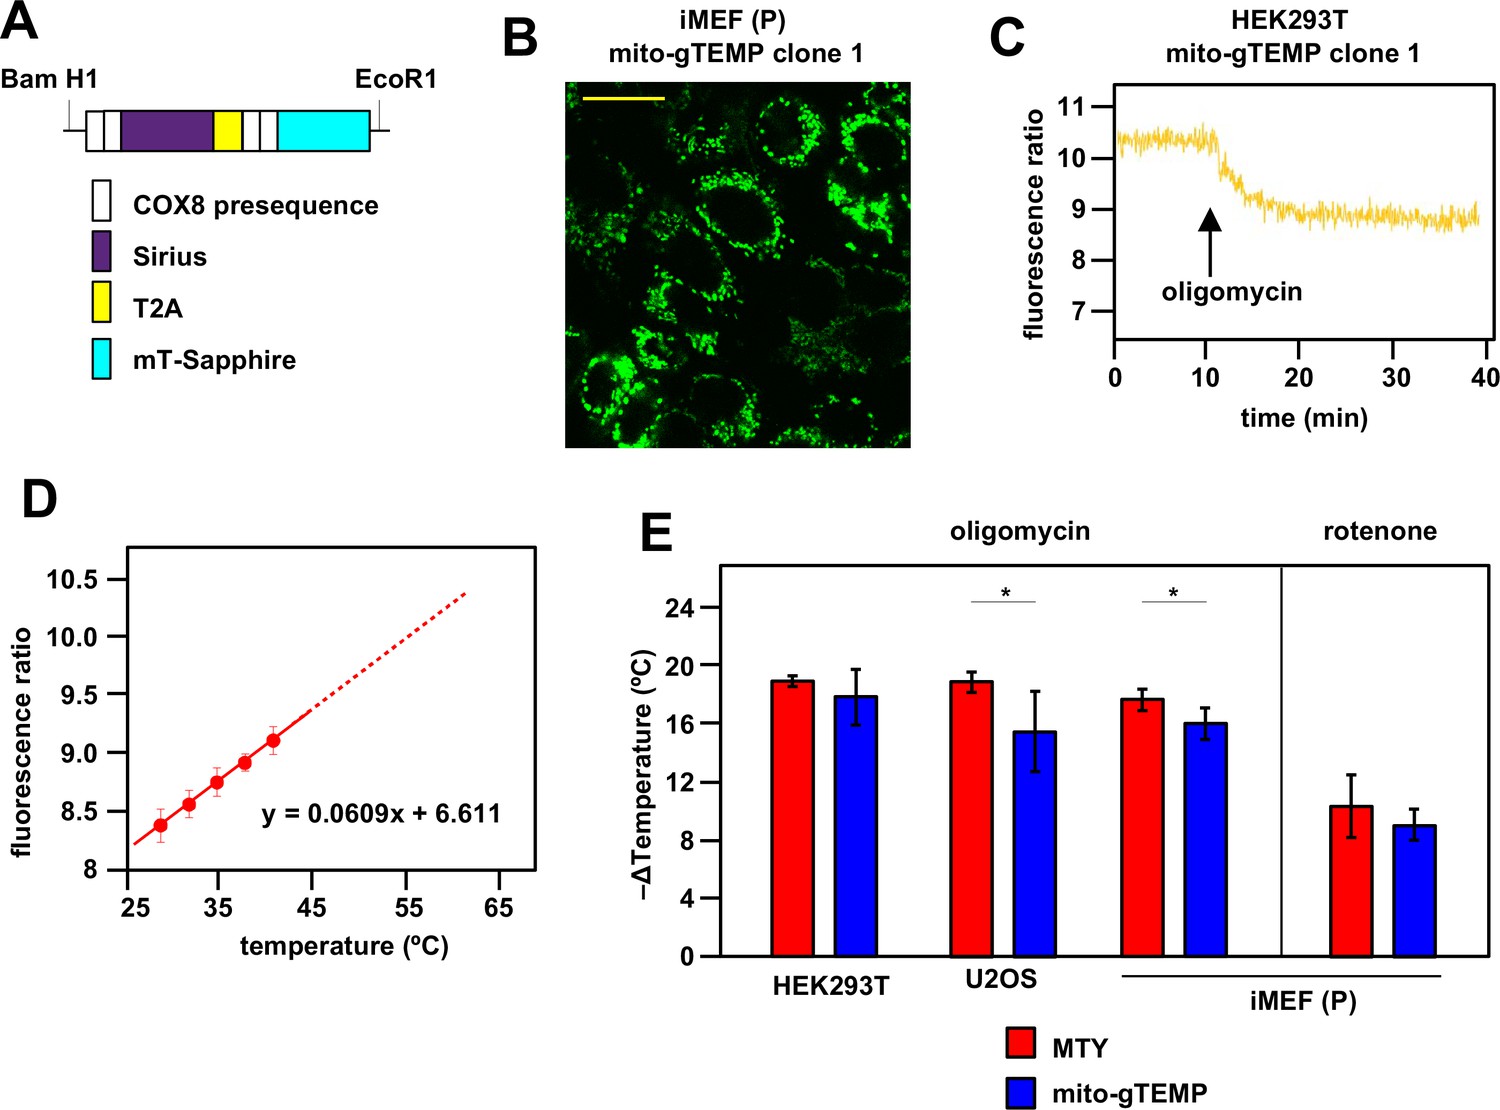
Ratiometric fluorescence probes confirm mitochondrial temperature measurements by Mito Thermo Yellow (MTY).
(A) Diagrammatic map (not to scale) of the self-cleaving polyprotein encoded by plasmid mito-gTEMP (coxVIIIx2-gTEMP)/pcDNA3, indicating the reiterated cytochrome oxidase subunit 8 (COX8) targeting presequences, the Sirius and mT-Sapphire coding regions and the T2A element (Donnelly et al., 2001a), which promotes self-cleavage via ribosome frameshifting (Donnelly et al., 2001b). (B) Illustrative mT-Sapphire fluorescence image of iMEF cell clone expressing mito-gTEMP, showing variable expression even within cells of the clone. Scale bar 5 μm. See Figure 3—figure supplement 1 for confirmation of mitochondrial localisation. (C) Illustrative trace of mT-Sapphire/Sirius fluorescence ratio in HEK293T cell clone expressing mito-gTEMP, following treatment with oligomycin. Note that, as for MTY, Sirius fluorescence decreases with increasing temperature, so that the decreased mT-Sapphire/Sirius fluorescence ratio after oligomycin treatment represents a decrease in temperature. (D) Calibration curve for mT-Sapphire/Sirius fluorescence ratio (means ± SD, nine independent experiments in each case) in mito-gTEMP expressing iMEFs treated with oligomycin, and shifted to various temperatures up to 42°C. Solid red line represents linear best fit (as per equation shown) extrapolated to higher temperatures (dotted red line) that were not directly tested due to the effects of prolonged high temperatures on cell integrity and viability (Roti Roti, 2008). Note that, during these trials, we observed that continuous illumination of mito-gTEMP expressing cells at the excitation wavelength for more than 40 min caused damage affecting the fluorescence signal. All calibration measurements were therefore conducted over <35 min. We also noted that the internal temperature of the cuvette took ~2 min to equilibrate with that of the surrounding Peltier (Figure 2—figure supplement 2), for which reason fluorescence values were measured over just the final minute at each calibration step. (E) Extrapolated mitochondrial temperature shifts (means ± SD for at least five independent experiments in each case) in the indicated cell lines and mito-gTEMP transfected cell clones following treatment with oligomycin, based on (red bars) MTY fluorescence, reproduced from corresponding panels of Figure 2, and (blue bars) mito-gTEMP fluorescence ratio, applying calibration curves such as shown in panel (C), derived separately for each cell line studied. ** denotes significant differences between the two methods (Student’s t test within each cell line, p<0.01).
-
Figure 3—source data 1
No title.
- https://cdn.elifesciences.org/articles/89232/elife-89232-fig3-data1-v3.xlsx
-
Figure 3—source data 2
No title.
- https://cdn.elifesciences.org/articles/89232/elife-89232-fig3-data2-v3.xlsx
Figure 3—figure supplement 1

Mitochondrial localisation of mito-gTEMP.
Fluorescence microscopy images of iMEF(P) cells transfected with mito-gTEMP and imaged as indicated, as described in Materials and methods. Scale bars 10 μm.
Figure 3—figure supplement 2

Supplementary data on mitochondrially targeted temperature-sensitive fluorescent probes.
(A, B, D) Fluorescence traces (AU – arbitrary units) and (C, E) fluorescence ratios at the wavelengths used to measure mT-Sapphire and Sirius, in PBS at 38°C, to which were added the indicated drugs (arrowed).
Figure 3—figure supplement 3

Idealised scheme for cellular/mitochondrial fractionation.
See Materials and methods for technical details. Cells are initially lysed by homogenisation under hypotonic conditions, and nuclei (blue), cytosol (grey), and membranous debris (black) are removed by a series of low- and moderate-speed centrifugation steps, yielding a pellet highly enriched in mitochondria (red). Mitochondria are then resuspended and subfractionated by mild detergent treatment and further centrifugation, separating mitoplasts (red, bounded by inner membrane in black) from the fraction containing the disrupted outer membrane (dark green) and inter-membrane space (IMS) components (light green). In a second subfractionation step, mitoplasts are sonicated and ‘inside-out’ sub-mitochondrial particles (SMPs, black) separated from matrix components (red) by higher speed centrifugation.
Figure 4
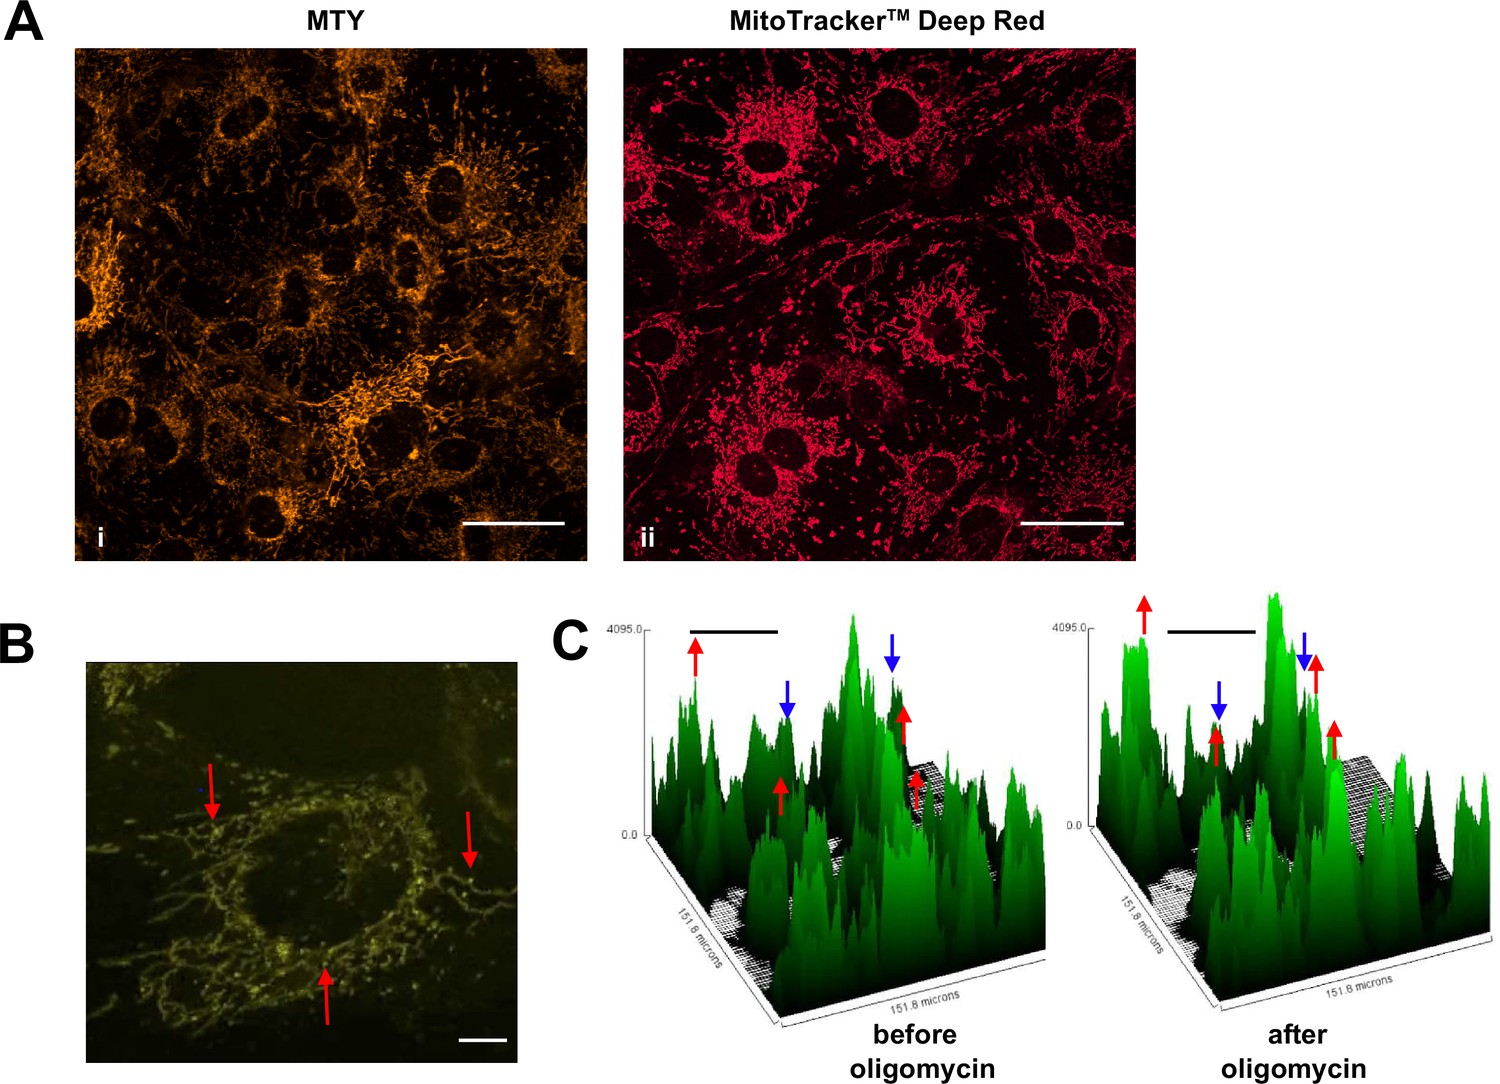
Mitochondrial temperature variation between and within cells.
(A, B) Micrographic images of iMEF cells stained with Mito Thermo Yellow (MTY) (A, panel i and B), alongside a parallel culture of cells stained with Mitotracker Deep Red FM (A, panel ii), which shows much more uniform staining. The intensity of MTY staining appears to vary between and even within cells. Scale bars – 10 μm. (B) Still image from Video 1, brightness and contrast optimised, showing bright (i.e. potentially cooler) foci (arrowed) within the less intensely stained mitochondrial network. Many of these foci appear mobile within the mitochondrial network, over the 5 min time-scale of the video. Scale bar – 2 μm. (C) Fluorescence intensity histograms of a field of cells immediately before and 33 min after oligomycin treatment. Note that, in addition to the general pattern of increased brightness (e.g. peaks represented by red dots), mitochondria in some cells showed only minor changes in fluorescence intensity (e.g. peaks denoted by blue dots). Scale bars – 50 μm.
Figure 5 with 1 supplement
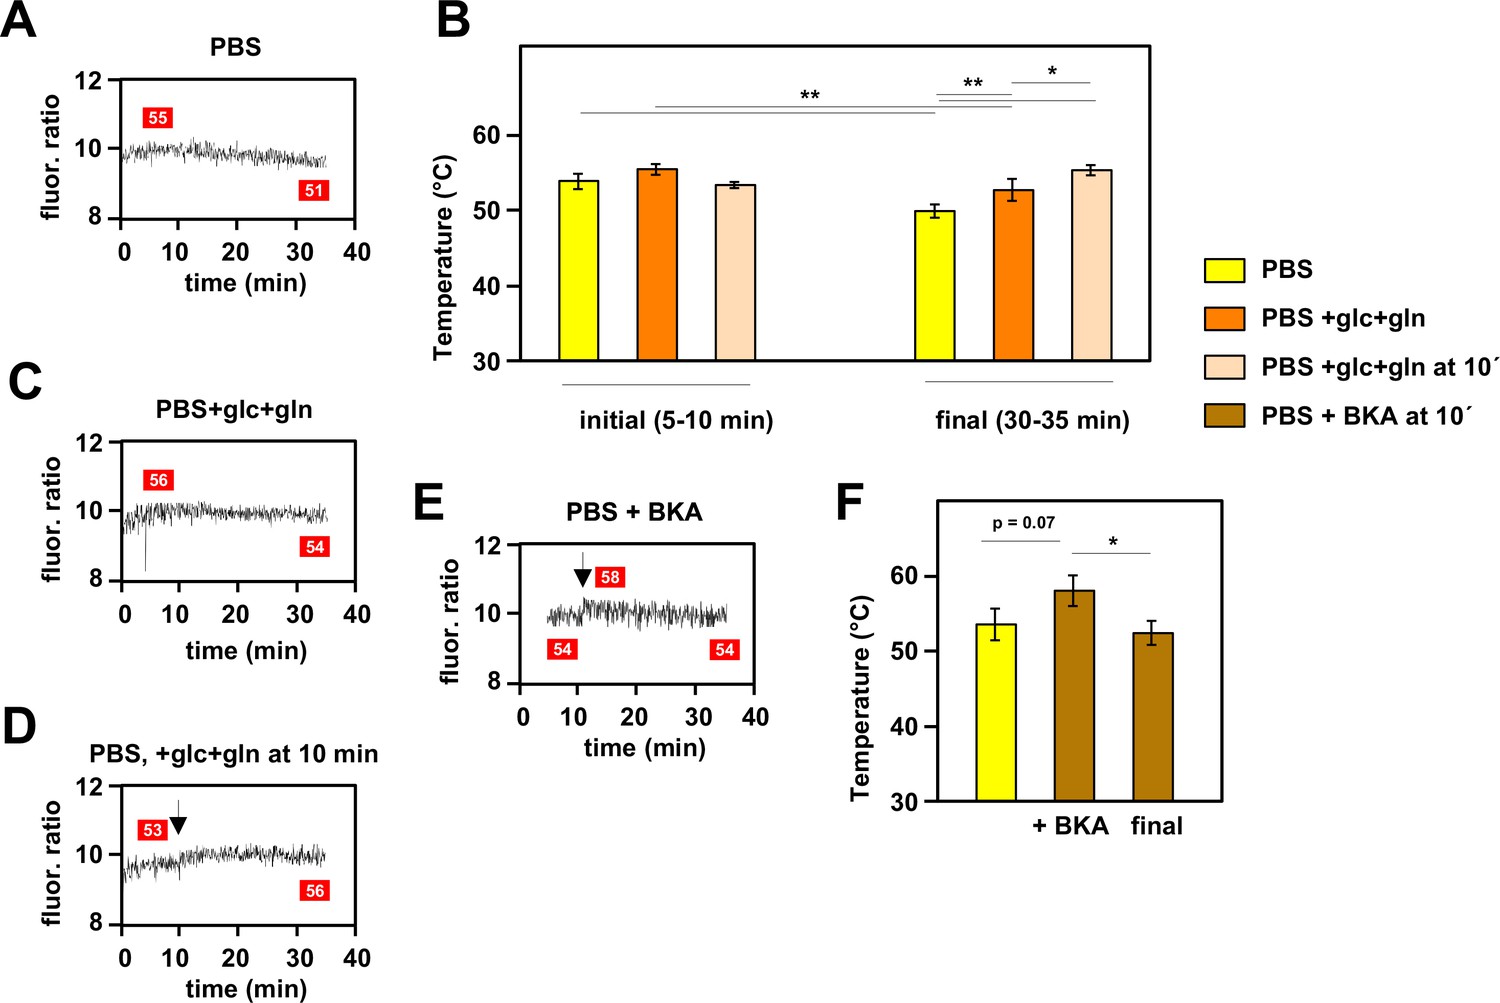
Mitochondrial temperature fluctuates in response to substrate availability.
(A, C, D, E) Representative fluorescence ratio traces of mito-gTEMP-expressing iMEF(P) cells resuspended in various media without oxidative phosphorylation (OXPHOS) inhibitors. PBS – phosphate-buffered saline, glc – glucose, and gln – glutamine at standard cell-culture concentrations, BKA – bongkrekic acid. Arrows indicate time of addition of substrates or of BKA. Mitochondrial temperatures (°C) extrapolated from calibration curve (Figure 3D) shown in red boxes. (B) Mitochondrial temperatures (°C, means ± SD of five independent experiments), averaged over the time intervals since cell resuspension as shown, extrapolated from mito-gTEMP fluorescence ratios using calibration curve (Figure 3D), for cells with and without substrate additions as shown. *, **, *** denote statistical significance (p<0.05, 0.01, 0.001, respectively, one-way ANOVA with Tukey post hoc HSD test). (F) Mitochondrial temperatures (°C, means ± SD, n=3 independent experiments), averaged over the time intervals since cell resuspension as shown, extrapolated from mito-gTEMP fluorescence ratios using calibration curve (Figure 3D), for cells treated with BKA at 11 min (values averaged over 11–16 min) and then tracked until 35 min (final values averaged over 30–35 min). *, **, *** denote statistical significance (p<0.05, 0.01, 0.001, respectively, one-way ANOVA with Tukey post hoc HSD test).
-
Figure 5—source data 1
No title.
- https://cdn.elifesciences.org/articles/89232/elife-89232-fig5-data1-v3.xlsx
-
Figure 5—source data 2
No title.
- https://cdn.elifesciences.org/articles/89232/elife-89232-fig5-data2-v3.xlsx
Figure 5—figure supplement 1

Effect of bongkrekic acid (BKA) on Mito Thermo Yellow (MTY) fluorescence.
MTY fluorescence traces for cell-free PBS or iMEF(P) cells treated with BKA as indicated. The drug produced an immediate quenching of fluorescence in both cases. In cells, this was followed by a gradual regain of fluorescence, possibly indicative of mitochondrial temperature decrease by several °C, based on the internal calibration (red boxes). See also Figure 5E and F.
Figure 6 with 2 supplements
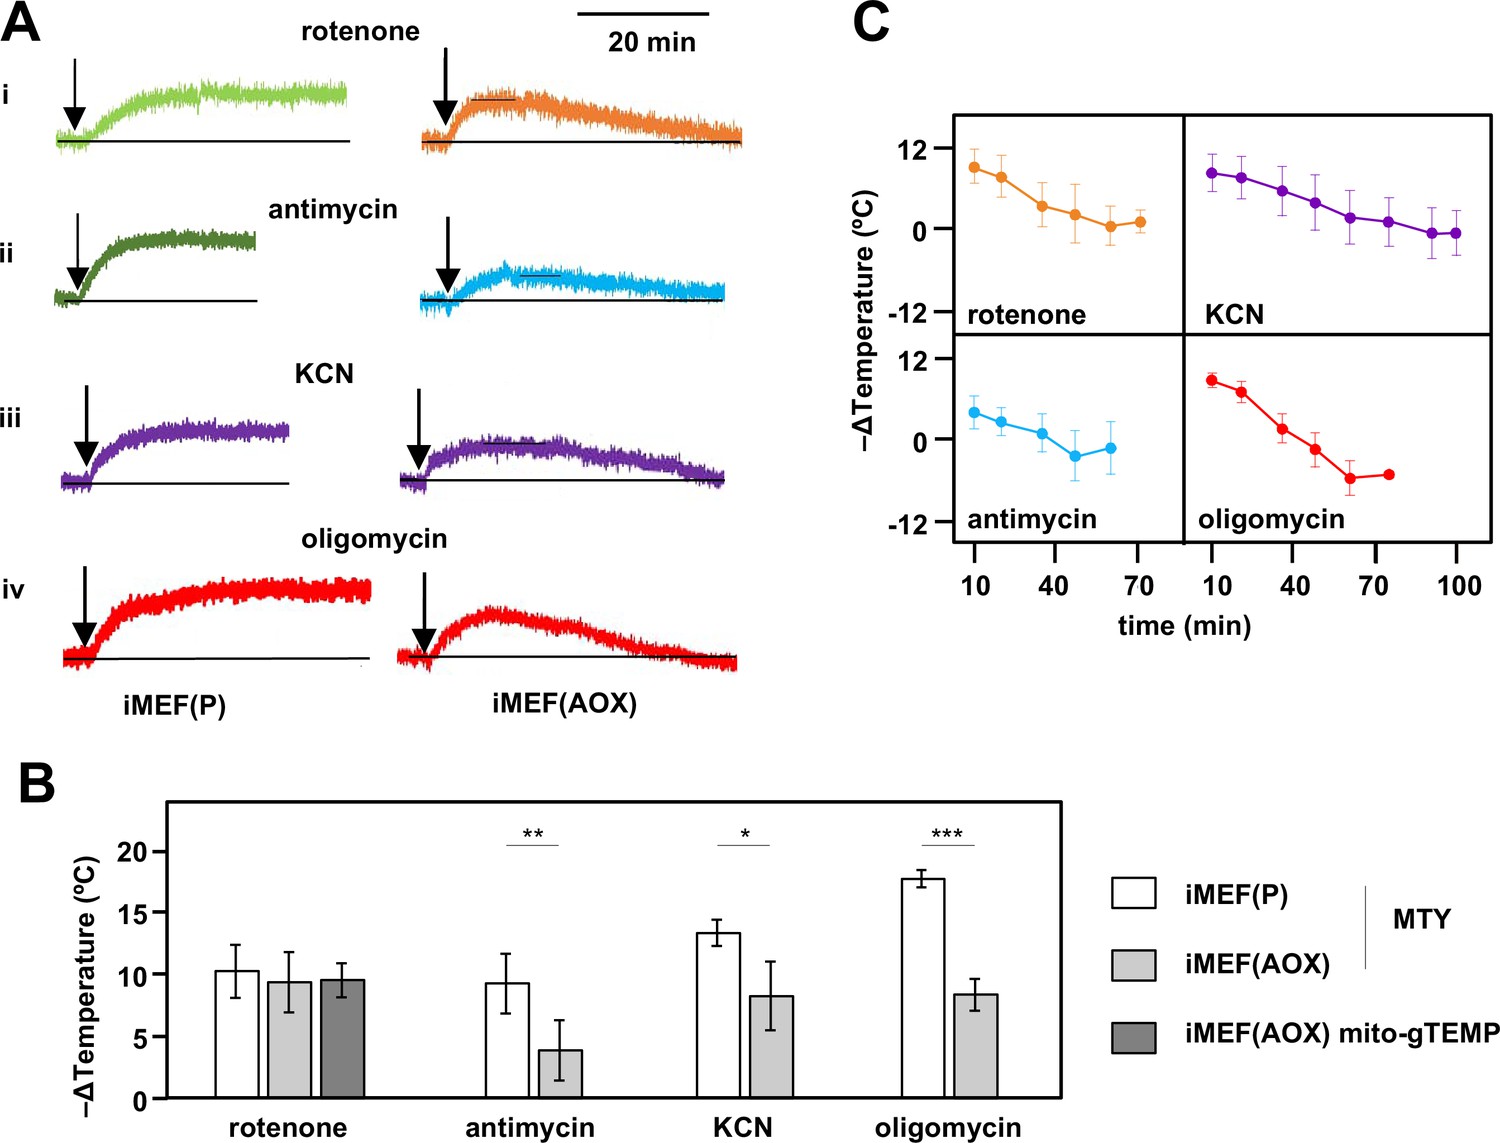
Restoration of high mitochondrial temperature in alternative oxidase (AOX)-expressing cells after oxidative phosphorylation (OXPHOS) inhibition.
(A) Representative traces of Mito Thermo Yellow (MTY) fluorescence over time, in control and AOX-expressing iMEFs treated with the OXPHOS inhibitors shown. Vertical axes are arbitrary values, horizontal axes scaled as indicated. Note that increased fluorescence indicates cooler mitochondria. Control iMEF(P) cells reached and maintained plateau levels of fluorescence, indicating a sustained decrease in mitochondrial temperature, whilst iMEF(AOX) cells showed rewarming after reaching a peak fluorescence value. (B) Peak mitochondrial temperature decrease (means ± SD, n>4 independent experiments) in the indicated cell lines following treatment with OXPHOS inhibitors, inferred from MTY fluorescence or mito-gTEMP fluorescence ratio as shown. Horizontal bars indicate significant differences for pairwise comparisons between iMEF(P) and iMEF(AOX) cells treated with the indicated inhibitors (MTY data, Student’s t test, p<0.05, 0.01, and 0.001, denoted, respectively, by *, **, and ***). There was no significant difference between the methods, applied to rotenone-treated iMEF(AOX) cells (Student’s t test, p>0.05). (C) Mitochondrial rewarming (means ± SD, n>5 independent experiments except at latest time-points, where n=3 or 4) in iMEF(AOX) cells treated with the inhibitors shown, inferred from MTY fluorescence traces.
-
Figure 6—source data 1
No title.
- https://cdn.elifesciences.org/articles/89232/elife-89232-fig6-data1-v3.xlsx
-
Figure 6—source data 2
No title.
- https://cdn.elifesciences.org/articles/89232/elife-89232-fig6-data2-v3.xlsx
Figure 6—figure supplement 1
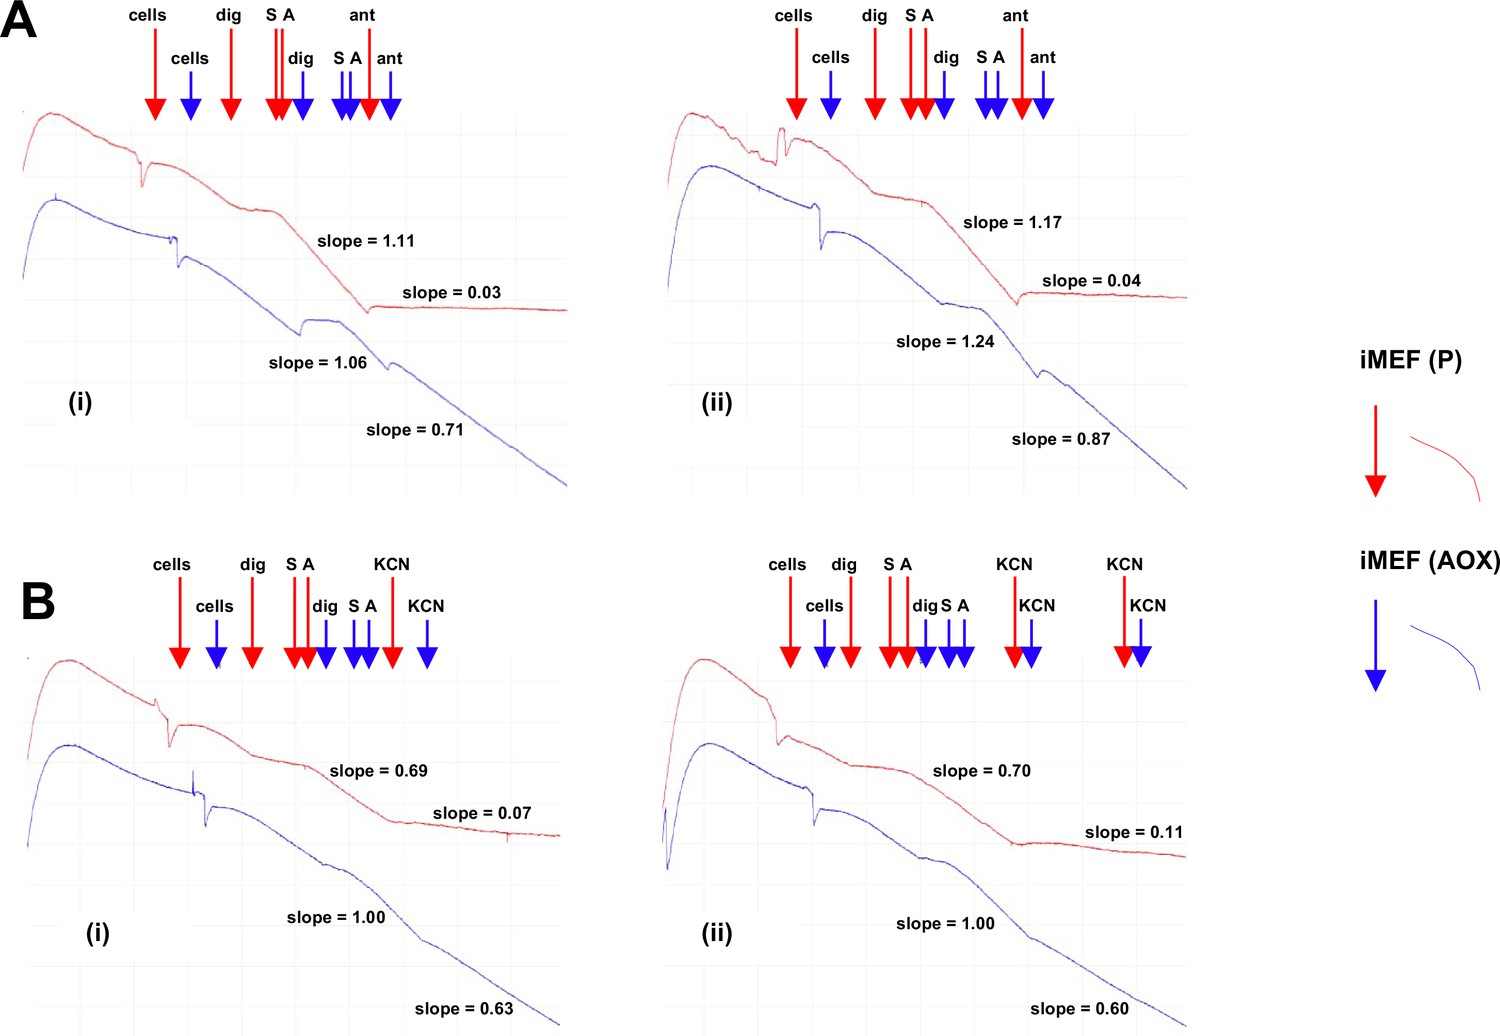
Alternative oxidase (AOX)-expressing iMEFs show antimycin- and KCN-resistant respiration.
Respirometric traces from digitonin-permeabilised cells of the indicated lines, treated successively with digitonin – dig, pyruvate+glutamate+malate substrate mix – S, and ADP – A, followed by either (A) antimycin (ant) or (B) either one or two successive doses of KCN. For details see Materials and methods. In each part, panels (i) and (ii) represent two independent trials. Relative rates of inhibitor-resistant oxygen consumption of iMEF (AOX) cells, based on the indicated slopes, and following subtraction of inhibitor-resistant oxygen consumption of control iMEF(P) cells, were as follows: (A) 70% and 67% antimycin resistance, (B) 50% and 47% KCN resistance.
Figure 6—figure supplement 2
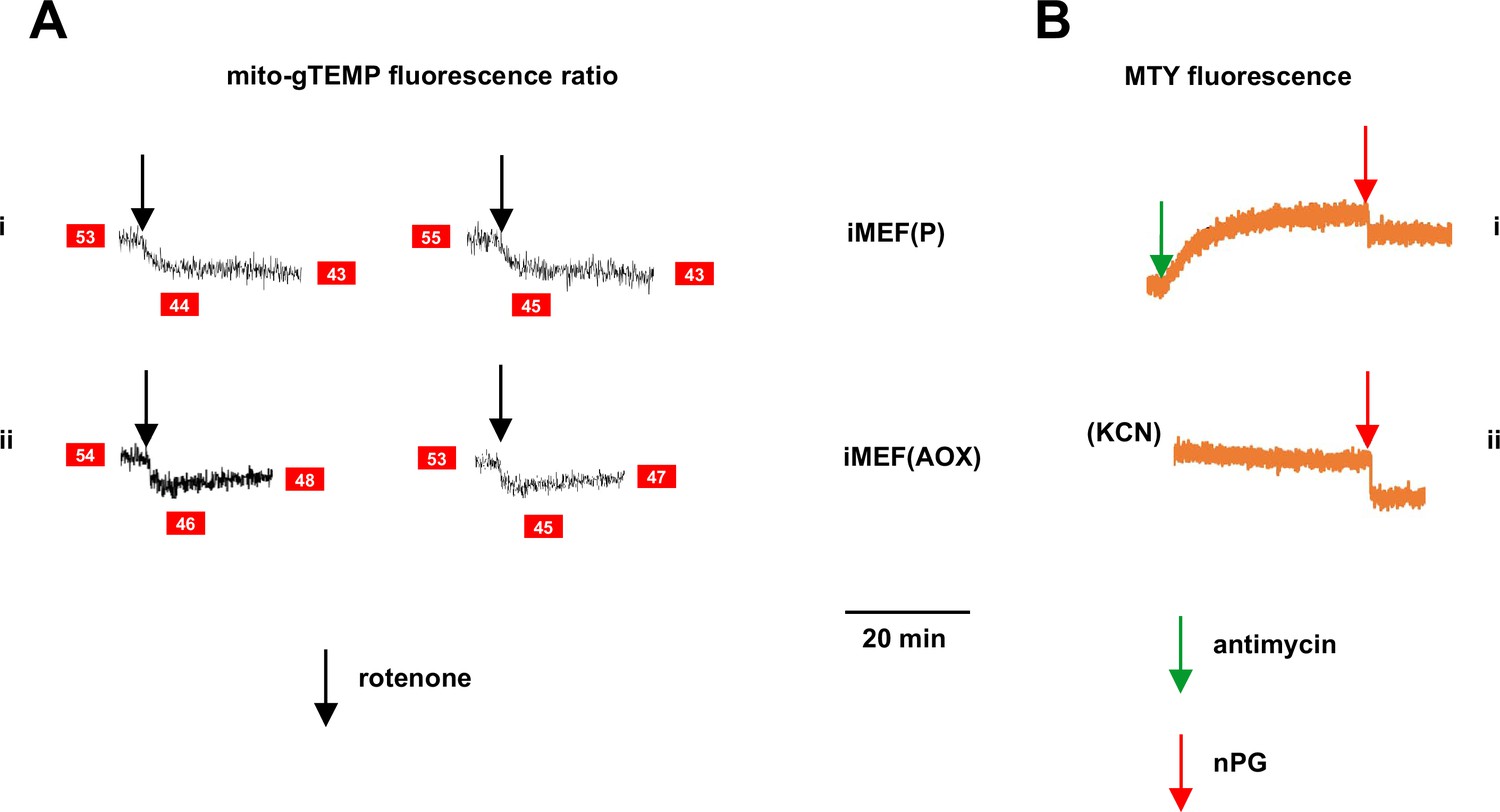
Supplementary data on effects of inhibitors on fluorescence in alternative oxidase (AOX)-expressing cells.
(A) Representative traces of mito-gTEMP fluorescence ratio for (i) control iMEF(P) and (ii) iMEF(AOX) cells, after rotenone delivery at 15 min until 35 min, with continuous recording (two replicate experiments in each case). Text in red boxes indicates inferred mitochondrial temperature (to nearest °C) from calibration curve of Figure 3D. AOX-expressing cells show a consistent warming of ~2°C by 20 min post-drug treatment, consistent with the Mito Thermo Yellow (MTY) data of Figure 6C. (B) Representative traces of MTY fluorescence for (i) control iMEF(P) cells and (ii) iMEF(AOX) cells treated with n-propyl gallate (nPG) (red arrows). Note that, prior to nPG addition, fluorescence in both cases had reached a stable level – in control cells after antimycin treatment and in AOX-expressing cells after rewarming, following KCN treatment. In both cases, nPG addition produced an abrupt quenching of the fluorescence, making its effect on mitochondrial temperature unquantifiable.
Figure 7 with 1 supplement
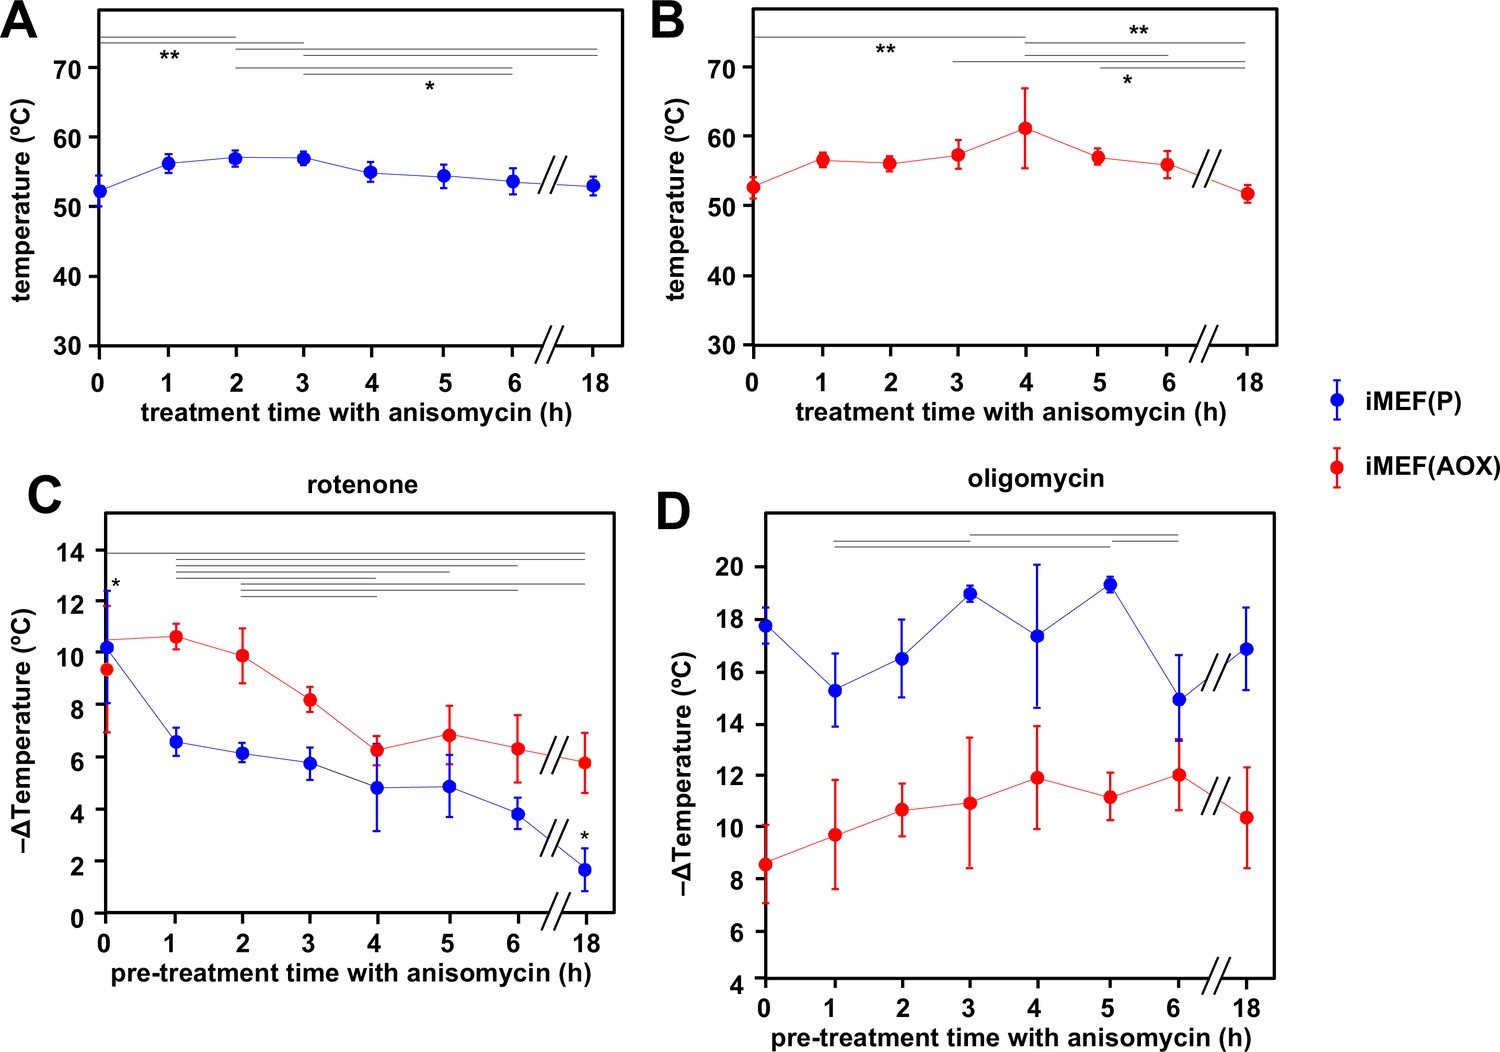
Cells maintain high mitochondrial temperature despite varying ATP demand.
(A, B) Intramitochondrial temperatures (means ± SD) estimated by mito-gTEMP fluorescence ratio in iMEF(P) and iMEF(alternative oxidase [AOX]) cells as indicated, treated with 150 μM anisomycin for the times shown. Temperatures extrapolated from calibration curve shown in Figure 3D. Horizontal bars denote data points that were significantly different (one-way ANOVA with Tukey HSD test, p<0.05). (C) Extrapolated mitochondrial temperature shifts (means ± SD for at least four independent experiments in each case) based on Mito Thermo Yellow (MTY) fluorescence, as indicated, in iMEF(P) and iMEF(AOX) cells pre-treated with 150 μM anisomycin for the times shown, followed by treatment with rotenone. Zero-time values (i.e. cells not treated with anisomycin) are reproduced from Figures 2D and 5B for iMEF(P) and iMEF(AOX) cells, respectively. Values for the two cell lines are significantly different at each time-point except 0 and 4 hr (Student’s t test, p<0.05). Within each cell line, in addition to the clear downward trend with time (i.e. lesser amount of mitochondrial temperature decrease), the values for the extreme time-points (0 and 18 hr) are significantly different from each other and from all other time-points for the iMEF(P) line (denoted by asterisks), whilst for the iMEF(AOX) line significant pairwise differences are indicated by horizontal lines above the graphed values (one-way ANOVA with Tukey post hoc HSD test, p>0.05). (D) Extrapolated mitochondrial temperature shifts (means ± SD for at least four independent experiments in each case) based on MTY fluorescence, as indicated, in iMEF(P) and iMEF(AOX) cells pre-treated with 150 μM anisomycin for the times shown, followed by treatment with oligomycin. Zero-time values (i.e. cells not treated with anisomycin) are reproduced from Figures 2D and 5B for iMEF(P) and iMEF(AOX) cells, respectively. Values for the two cell lines are significantly different at each time-point (Student’s t test, p<0.05). Within each cell line, and despite the apparent trend of the means for iMEF(AOX) cells, the values for different time-points are, in general, not significantly different from each other (one-way ANOVA with Tukey post hoc HSD test, p>0.05). Exceptions for iMEF(P) cells are indicated by horizontal lines (p<0.01).
-
Figure 7—source data 1
No title.
- https://cdn.elifesciences.org/articles/89232/elife-89232-fig7-data1-v3.xlsx
-
Figure 7—source data 2
No title.
- https://cdn.elifesciences.org/articles/89232/elife-89232-fig7-data2-v3.xlsx
-
Figure 7—source data 3
No title.
- https://cdn.elifesciences.org/articles/89232/elife-89232-fig7-data3-v3.xlsx
-
Figure 7—source data 4
No title.
- https://cdn.elifesciences.org/articles/89232/elife-89232-fig7-data4-v3.xlsx
Figure 7—figure supplement 1
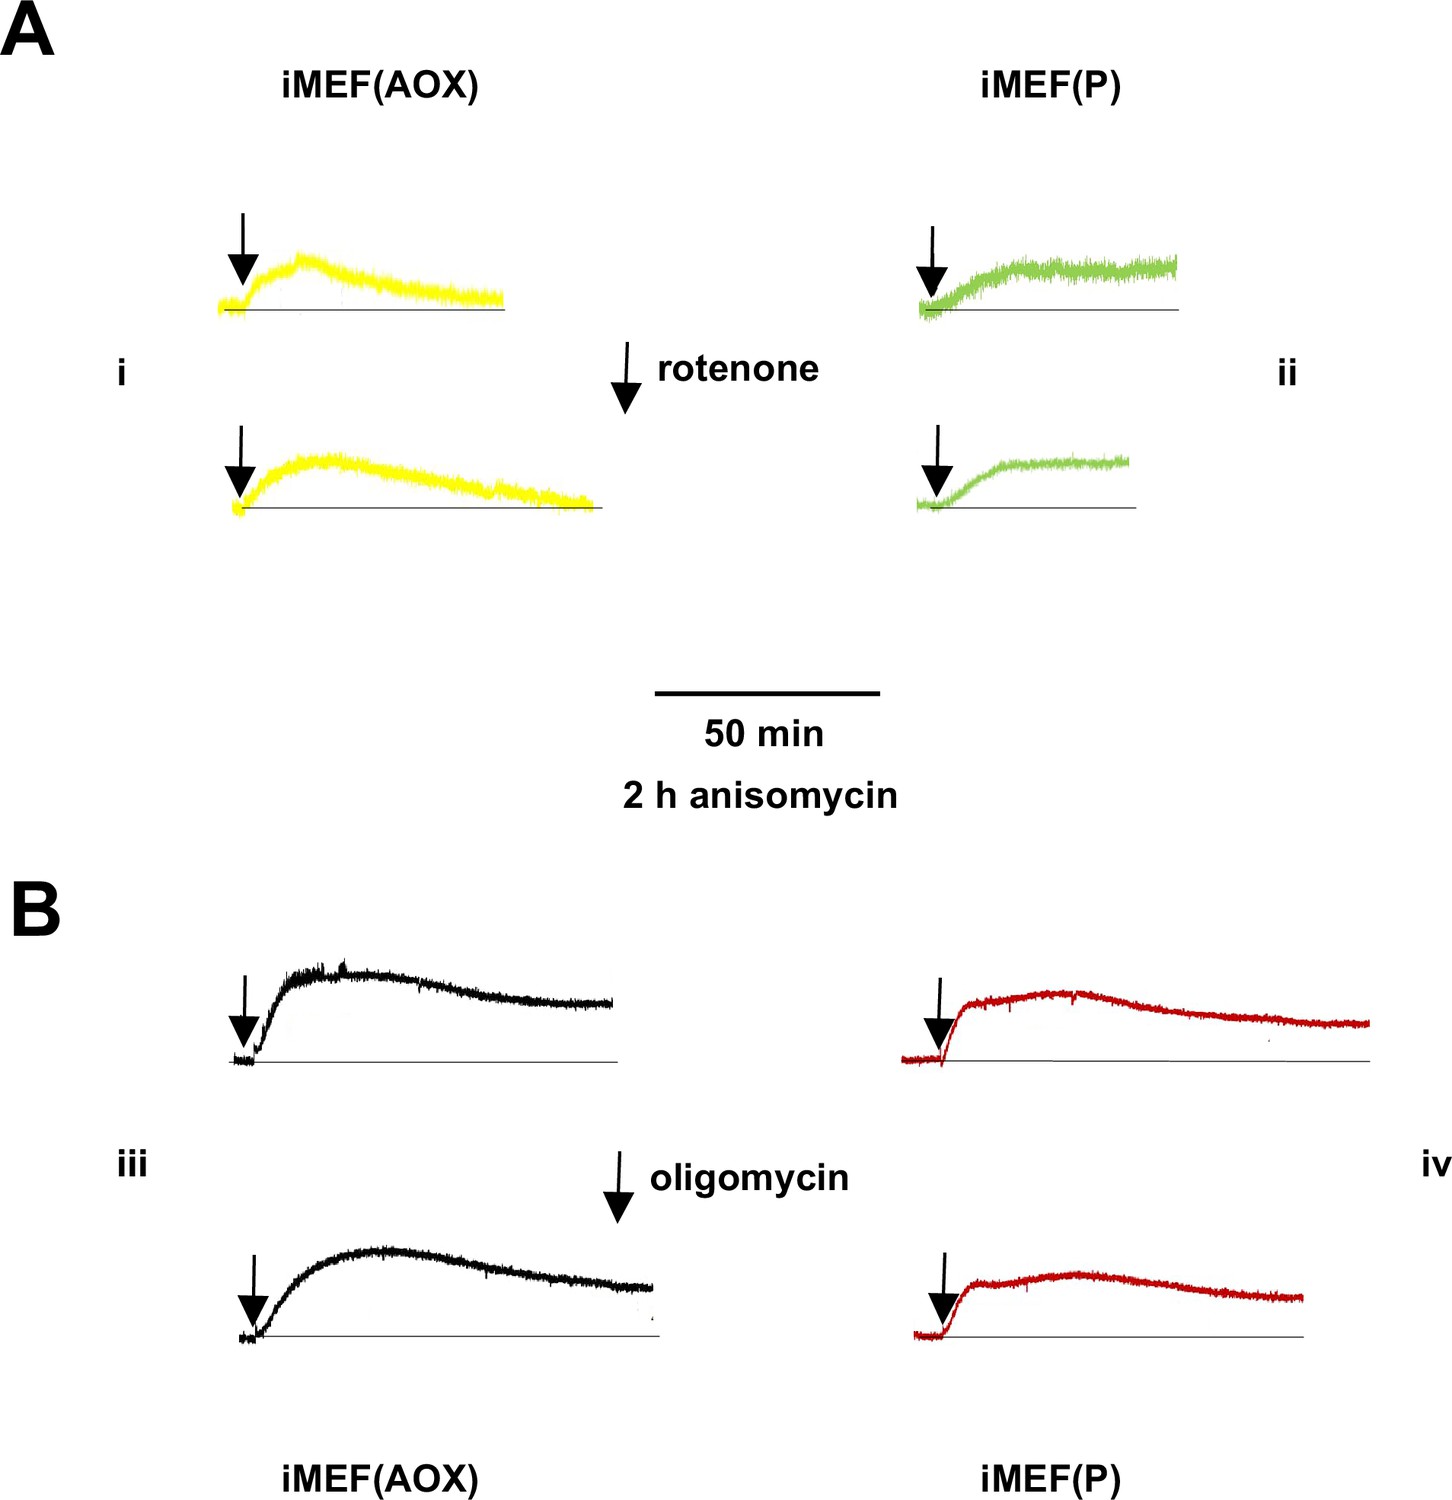
Supplementary data on mitochondrial temperature decrease in anisomycin-treated cells.
Representative fluorescence traces, uniformly rescaled, for (panels i, iii) Mito Thermo Yellow (MTY)-labelled iMEF(AOX) and (panels ii, iv) iMEF(P) cells pretreated for 2 hr with anisomycin, then incubated with (A) rotenone and (B) oligomycin.
Videos
Video 1
Mitochondrial temperature variation between and within cells.
Time-lapse micrographic images (1 frame per 10 s) of iMEF cells stained with Mito Thermo Yellow (MTY), brightness and contrast optimised, showing bright (i.e., potentially cooler) foci within the less intensely stained mitochondrial network. Many of these foci appear mobile within the mitochondrial network, over the 5 min time-scale of the video. See Figure 4B for a still image taken from the video.
Additional files
Download links
A two-part list of links to download the article, or parts of the article, in various formats.
Downloads (link to download the article as PDF)
Open citations (links to open the citations from this article in various online reference manager services)
Cite this article (links to download the citations from this article in formats compatible with various reference manager tools)
Mitochondrial temperature homeostasis resists external metabolic stresses
eLife 12:RP89232.
https://doi.org/10.7554/eLife.89232.3


