Vitamin D constrains inflammation by modulating the expression of key genes on Chr17q12-21.1
- Channing Division of Network Medicine, Department of Medicine, Brigham and Women’s Hospital and Harvard Medical School, United States
- Department of Environmental Health, Harvard TH Chan School of Public Health, United States
- Division of Pulmonary and Critical Care Medicine, Department of Medicine, Brigham and Women's Hospital and Harvard Medical School, United States
- Behavioral Neuroscience, Experimental and Biological Psychology, Philipps-University, Germany
- Excellence Cluster Cardio-Pulmonary System (ECCPS), Justus Liebig University Giessen, Germany
- Department of Pediatrics, Graduate School of Medicine, Chiba University, Japan
- Cutaneous Biology Research Center, Massachusetts General Hospital and Harvard Medical School, United States
- Division of Pediatric Pulmonary Medicine, Golisano Children’s Hospital at Strong, University of Rochester Medical Center, United States
- Endocrine Unit, Massachusetts General Hospital and Harvard Medical School, United States
- Institute of Laboratory Medicine and Pathobiochemistry, Molecular Diagnostics, Philipps University of Marburg and German Center for Lung Research (DZL), Germany
- Department of Clinical Immunology and Allergology, Laboratory of Immunopathology Sechenov University, Russian Federation
Figures
Figure 1 with 1 supplement
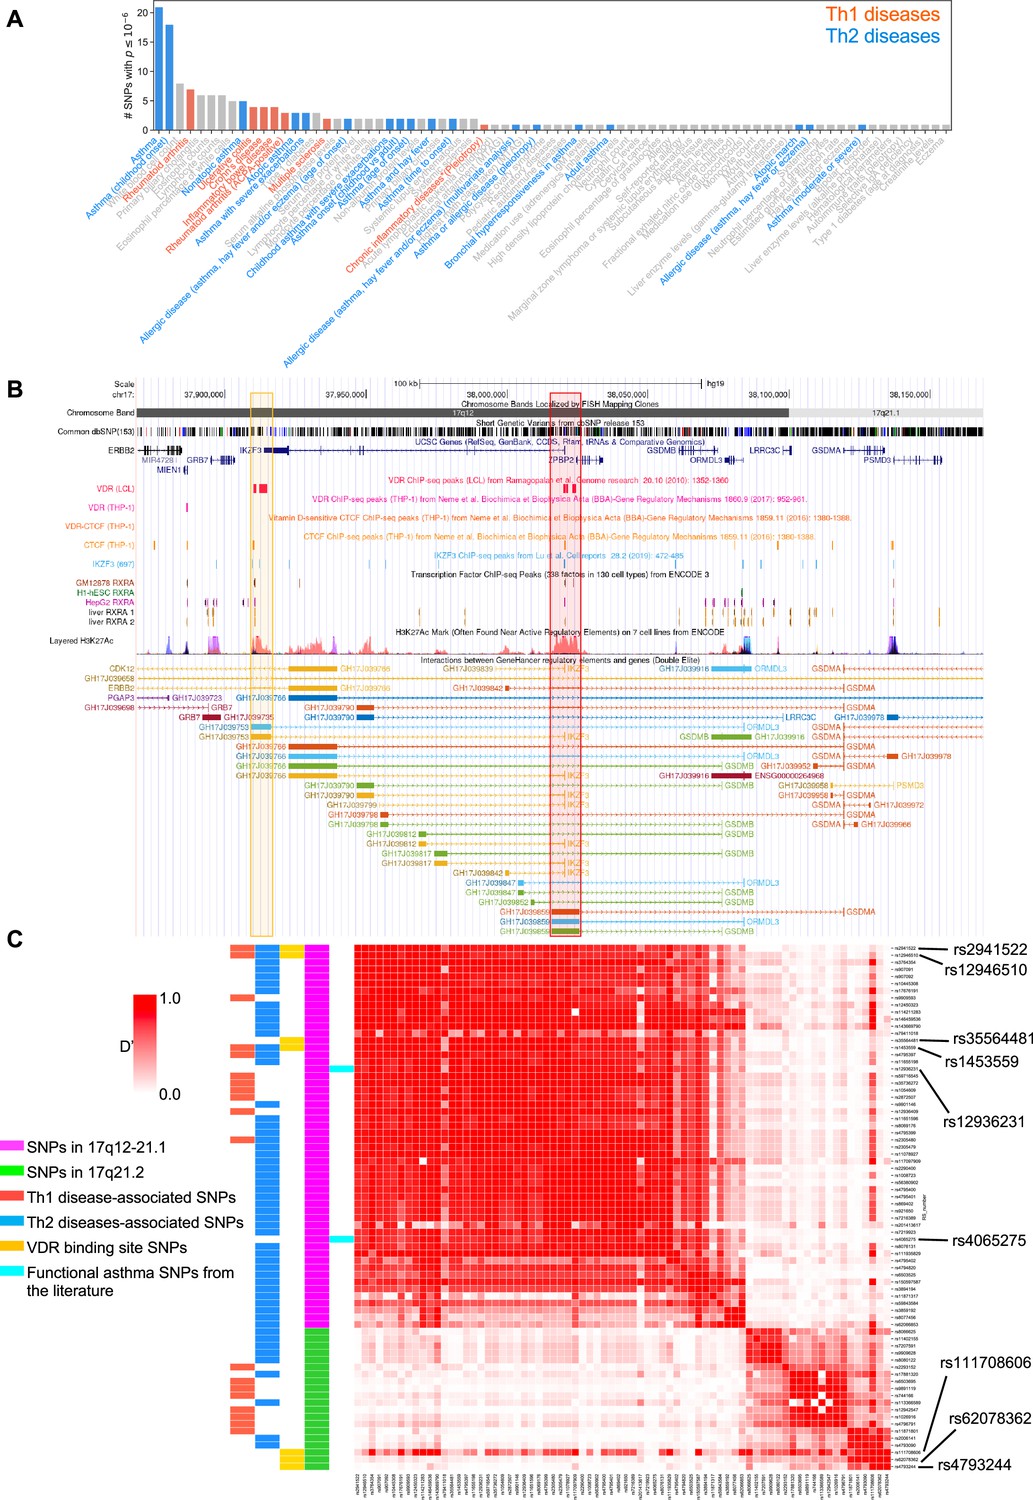
VDR-binding sites on Chr17q12 and q21.1 overlap with open chromatin signatures.
(A) Significant disease and trait associations in 17q12-21.1 (y-axis), retrieved from the NHGRI EBI GWAS Catalog, with at least one significant single-nucleotide polymorphism (SNP) (x-axis) in Chr17q12-21.1. Colored bars denote autoimmune diseases mapped to Th1 (red bars)- or Th2 (blue bars)-driven immunity. (B) University of California Santa Cruz (UCSC) Genome Browser tracks showing chromosomal location, common dbSNPs, VDR-, RXR-, CTCF-, and IKZF3-binding sites and H3K27Ac marks present in the Chr17q12-21.1 locus. VDR-binding sites overlapping with active regulatory elements are highlighted by colored boxes. (C) Linkage disequilibrium (LD) between the significant SNPs in the Chr17q12-21.1 (magenta) and 21.2 (green) region, highlighting Th1/Th2-associated SNPs (red and blue, respectively), expression quantitative trait loci (eQTLs) in the VDR-binding regions in Chr17q12 21.1 and 21.2 (yellow), and functional asthma SNPs from the literature (cyan).
Figure 1—figure supplement 1
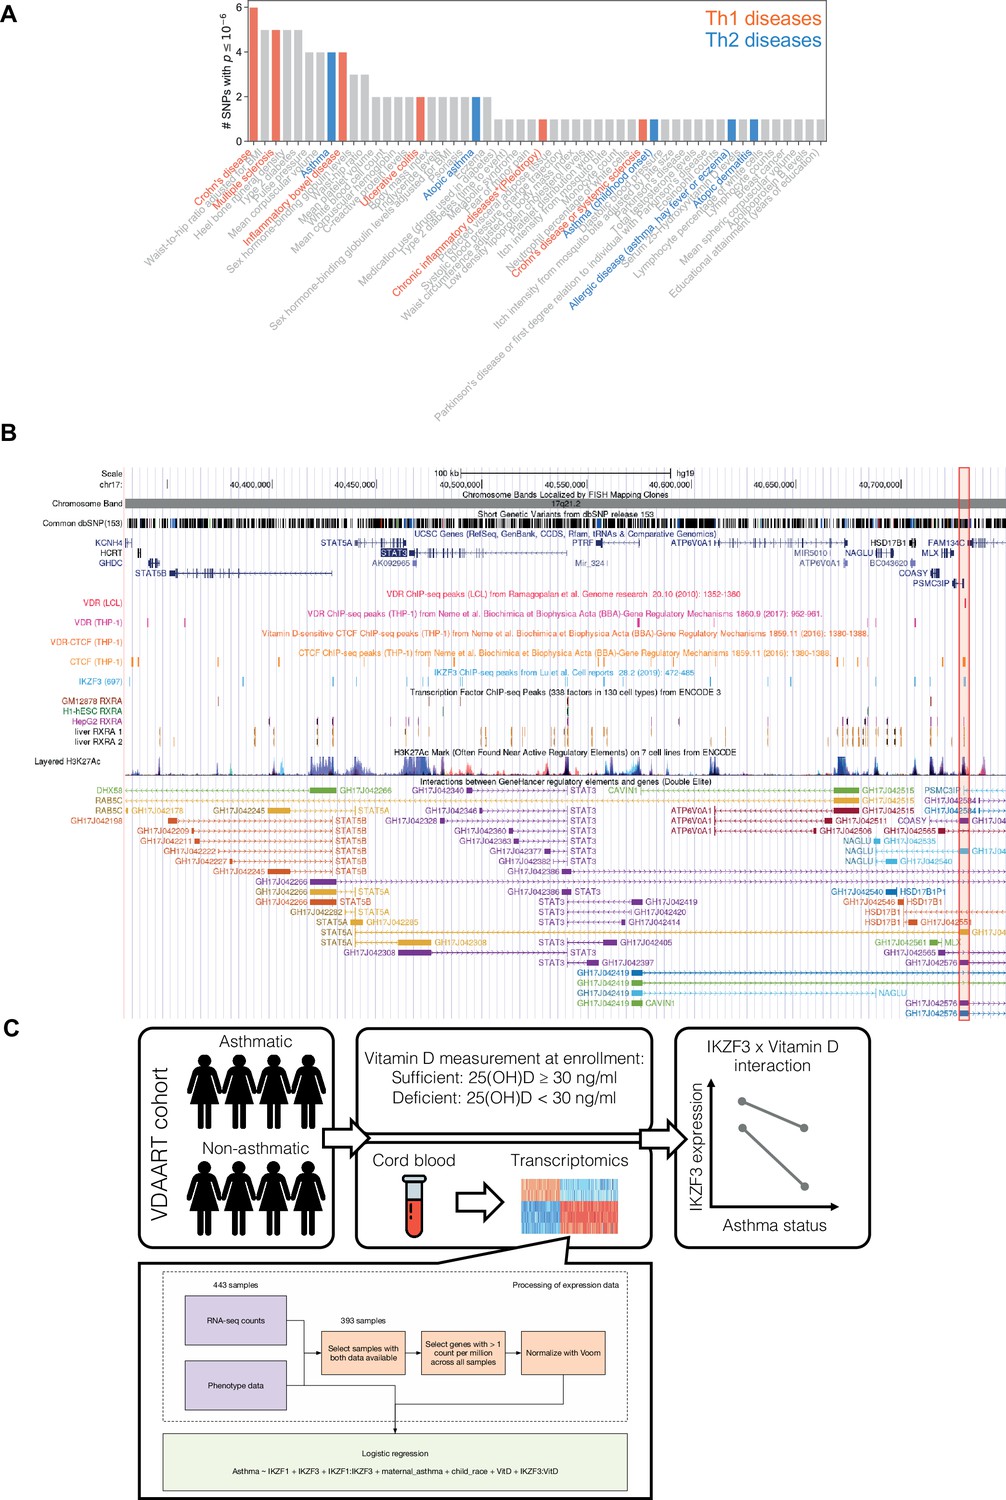
GWAS disease associations and VDR binding sites of the 17q21.2 locus; overview of the VDAART analyses.
(A) Significant disease and trait associations in 17q21.2 (y-axis), retrieved from the NHGRI-EBI GWAS Catalog, with at least one significant single-nucleotide polymorphism (SNP) (x-axis) in Chr17q21.2. Colored bars denote autoimmune diseases mapped to Th1 (red bars)- or Th2 (blue bars)-driven immunity. (B) University of California Santa Cruz (UCSC) Genome Browser tracks showing chromosomal location, common dbSNPs, VDR-, RXR-, CTCF-, and IKZF3-binding sites and H3K27Ac marks present in the Ch17q21.2 locus. VDR-binding sites overlapping with active regulatory elements are highlighted by colored boxes. (C) Overview of the analyses conducted on the VDAART transcriptomic and clinical data.
-
Figure 1—figure supplement 1—source data 1
Results of the logistic regression analysis represented schematically in Figure 1—figure supplement 1C.
- https://cdn.elifesciences.org/articles/89270/elife-89270-fig1-figsupp1-data1-v2.xlsx
Figure 2 with 2 supplements

Vdr expression is elevated in Th2 cells and vitamin D regulated expression of genes on Chr1q12 and Chr17q21.
(A) Scheme of the house dust mite (HDM)-induced airway inflammation protocol. (B) Flow cytometric analysis and cell frequencies of Vdr expression in CD45+ CD4+ T cells in the respective groups (n = 3–5). (C) Flow cytometric analyses and cell frequencies of Vdr expression in Th1 (Tbet+), Th2 (Gata3+), and Treg (Foxp3+) cells in the respective groups (n = 4–8). Quantitative Reverse transcription-polymerase chain reaction (RT-PCR) analysis of relative mRNA expression levels of genes encoded on Chr17q12-21.1 in (D) Th2 cultures of wild-type (WT) and vitamin D-deficient mice and (E) control and calcitriol-stimulated cultures. Quantitative RT-PCR analysis of relative mRNA expression levels of genes encoded on Chr17q21.2 in (F) Th2 cultures of WT and vitamin D-deficient mice and (G) control and calcitriol-stimulated cultures. Gene expression levels were normalized to the house keeping gene L32 and are expressed relative to the expression level in WT (D, F) or WT-vehicle (E, G) Th2 cells (n ≥ 4 per group). Each symbol represents one mouse. Numbers in flow plots indicate percentages. Error bars indicate the standard error of the mean (SEM). Statistical tests: two-tailed Mann–Whitney U-test (B, C). *p < 0.05, **p < 0.01, ***p < 0.001. Data summarize results from two independent experiments.
Figure 2—figure supplement 1
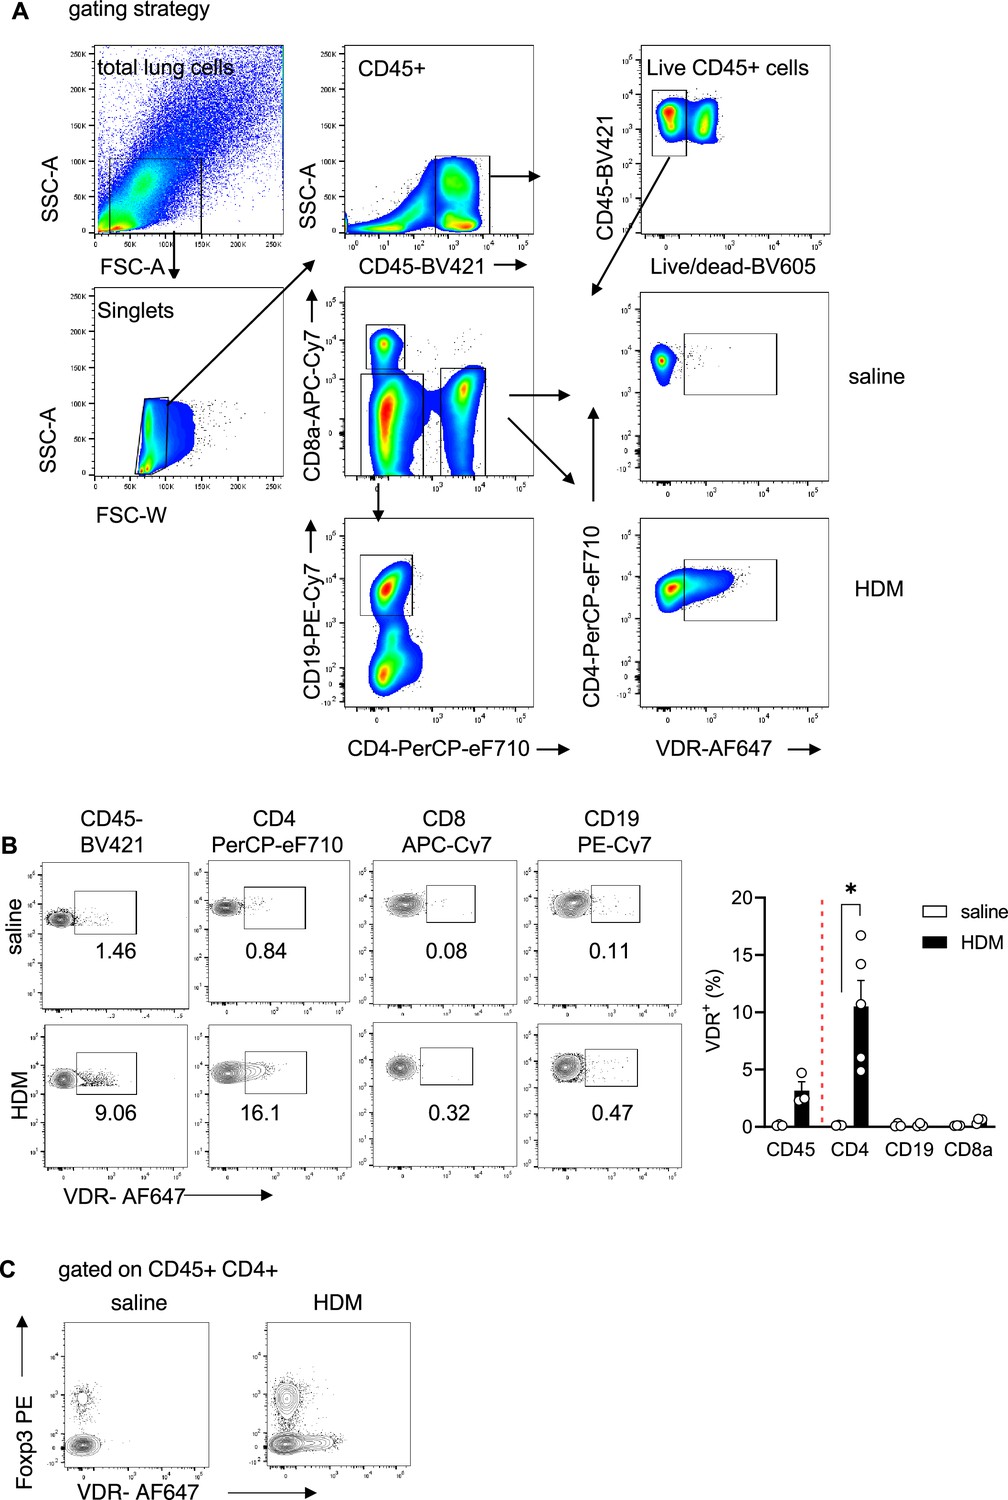
Baseline Vdr expression is confined to the CD4+ Foxp3 Teff cell population.
(A) Gating strategy for the analysis of Vdr expression in different leukocyte populations in the lung. (B) Flow cytometric analysis and cell frequencies of Vdr expression in CD45+, CD4+, CD8+, and CD19+ in the respective groups (n = 3–5). (C) Representative flow plots of lung CD45+CD4+ T cells isolated from saline and house dust mite (HDM)-immunized and -challenged mice for the co-expression of Foxp3 and Vdr. Each symbol represents one mouse. Numbers in flow plots indicate percentages. Error bars indicate the standard error of the mean (SEM). Statistical tests: two-tailed Mann–Whitney U-test. *p < 0.05. Data summarize results from two independent experiments.
Figure 2—figure supplement 2

Vdr expression is induced during CD4+ Th2 cell differentiation.
(A) Representative immunoblot for Vdr expression in freshly isolated (0 hr) and activated CD4+CD62L+CD44− naive T cells (48 hr) and in vitro polarized Th1, Th2, and iTreg cells. Kidney samples of wild-type (WT) and Vdr−/− mice were used as controls. (B) Representative immunoblot for Vdr expression in polarizing Th2 at the indicated days of in vitro culture. (C) Representative image of Vdr localization in in vitro polarized Th2 cells stimulated with vehicle (EtOH, [% vol/vol]) or calcitriol.
-
Figure 2—figure supplement 2—source data 1
Original file for the Western blot analysis in Figure 2—figure supplement 2A (anti-Vdr, anti-b-actin).
- https://cdn.elifesciences.org/articles/89270/elife-89270-fig2-figsupp2-data1-v2.zip
-
Figure 2—figure supplement 2—source data 2
Original file for the Western blot analysis in Figure 2—figure supplement 2B (anti-Vdr, anti-b-actin).
- https://cdn.elifesciences.org/articles/89270/elife-89270-fig2-figsupp2-data2-v2.zip
-
Figure 2—figure supplement 2—source data 3
Original file for immunfluorescence images in Figure 2—figure supplement 2C stained for 4′,6-diamidino-2-phenylindole (DAPI), anti-CD4, anti-Vdr in in vitro polarized Th2 cells in the presence of calcitriol.
- https://cdn.elifesciences.org/articles/89270/elife-89270-fig2-figsupp2-data3-v2.zip
-
Figure 2—figure supplement 2—source data 4
Original file for immunfluorescence images in Figure 2—figure supplement 2C stained for DAPI, anti-CD4, anti-Vdr in in vitro polarized Th2 cells in the absence of EtOH.
- https://cdn.elifesciences.org/articles/89270/elife-89270-fig2-figsupp2-data4-v2.zip
Figure 3 with 2 supplements
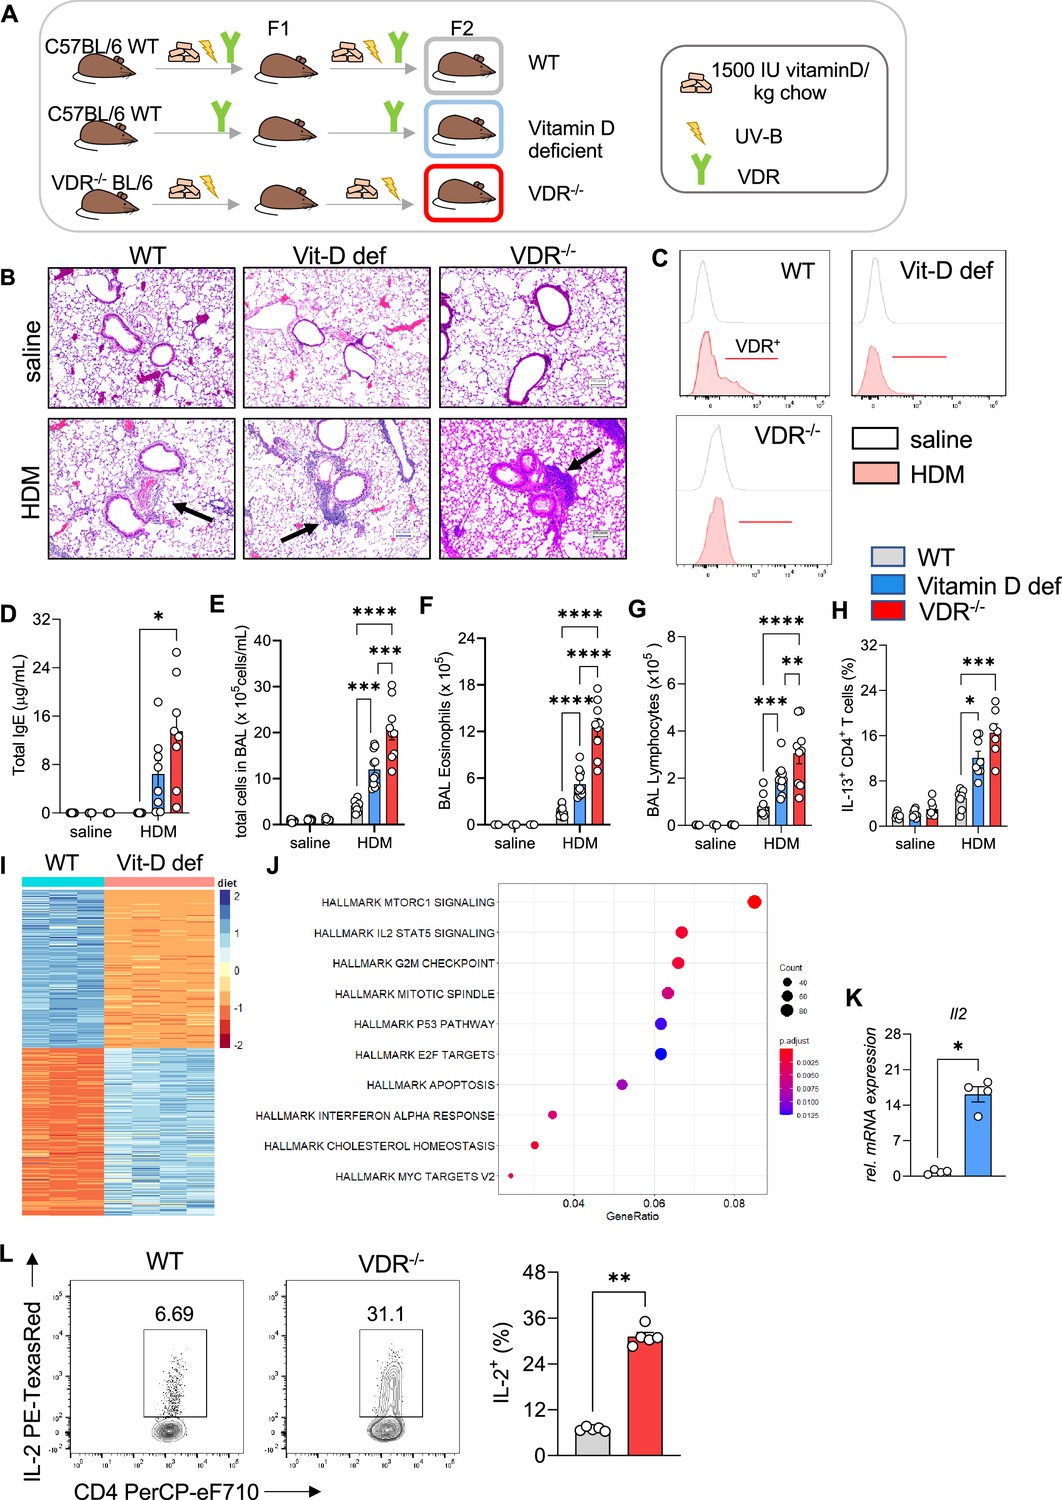
Vitamin D deficiency augments allergic airway inflammation.
(A) Schematic presentation of the different mouse strains used. (B) Representative H&E-stained lung sections from saline and house dust mite (HDM)-exposed wild-type (C57/BL6; WT), vitamin D-deficient and Vdr−/− mice (×10 magnification). Black arrows point to the peri bronchial infiltrate. (C) Representative flow plots assessing Vdr expression in lung CD4+ T cells from the indicated groups. (D) Total IgE levels detected in the sera of respective groups. Absolute numbers of (E) leukocytes, (F) eosinophils, and (G) lymphocytes in the airways of the respective groups. Data summarize results from two or three independent experiments with n ≥ 8 per group. (H) Frequencies of IL-13 producing Th2 in the lung. Data summarize results from two or three independent experiments with n > 7 per group. (I) Heat map showing differentially expressed genes between WT and vitamin D-deficient Th2 cultures identified by RNA-sequencing analysis. Analysis and visualization were performed with DESeq2. (J) Overrepresentation analysis of Hallmark gene sets in the differentially expression gene set. The x-axis represents the gene ratio in the respective gene set. Dot sizes denote the number of genes in the respective pathway. The dot color indicates the false discovery rate (FDR)-adjusted p-value. Analysis and visualization were performed with the clusterProfiler package. (K) Quantitative RT-PCR analysis of IL-2 mRNA expression in Th2 cultures from the respective groups (n = 4 per group). Gene expression levels were normalized to the house keeping gene L32 and are expressed as fold-induction compared to WT Th2 cells. (L) Flow cytometric analysis and cell frequencies of IL-2 production in WT and Vdr−/− Th2 cultures (n = 5 per group). Each symbol represents one mouse. Error bars indicate the standard error of the mean (SEM). Statistical significance was determined with: Mixed-effect analysis with Holm–Šidák’s post hoc analysis (D–H) two-tailed Mann–Whitney U-test (K, L). *p < 0.05, **p < 0.01, ***p < 0.001, ****p < 0.0001. Data summarize results from two or three independent experiments with n > 8 per group.
-
Figure 3—source data 1
Original images of H&E-stained lung section shown in Figure 3B.
- https://cdn.elifesciences.org/articles/89270/elife-89270-fig3-data1-v2.zip
-
Figure 3—source data 2
Gene set enrichment analysis shown in Figure 3J.
- https://cdn.elifesciences.org/articles/89270/elife-89270-fig3-data2-v2.xlsx
-
Figure 3—source data 3
Gene set enrichment analysis shown in Figure 3J (Hallmark gene sets).
- https://cdn.elifesciences.org/articles/89270/elife-89270-fig3-data3-v2.xlsx
Figure 3—figure supplement 1

Vitamin D deficiency does not alter CD4+ IL-10 and IL-17A expression allergic airway inflammation.
Frequencies of BAL neutrophils (A), IL-10 (B), and IL-17A (C) CD4+ T cells. Each symbol represents one mouse. Error bars indicate the standard error of the mean (SEM). Data summarize results from two or three independent experiments with n > 4 per group.
Figure 3—figure supplement 2
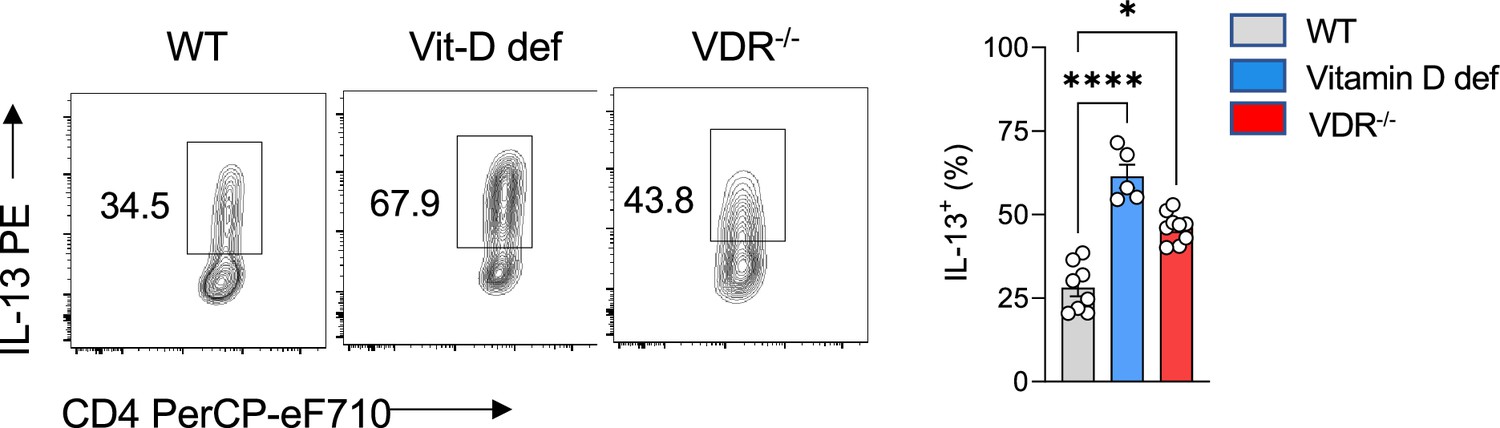
Vitamin D deficiency increases IL-13 expression in Th2 cells.
Flow cytometric analysis and frequencies of IL-13 expression in wild-type (WT), vitamin D-deficient, and Vdr−/− Th2 cultures (n = 5–9 per group). Each symbol represents one individual sample and data summarize the results from two or three independent experiments. Error bars indicate the standard error of the mean (SEM). Statistical tests: Kruskal–Wallis test with Dunn’s post hoc analysis. *p < 0.05, ****p < 0.0001.
Figure 4 with 2 supplements
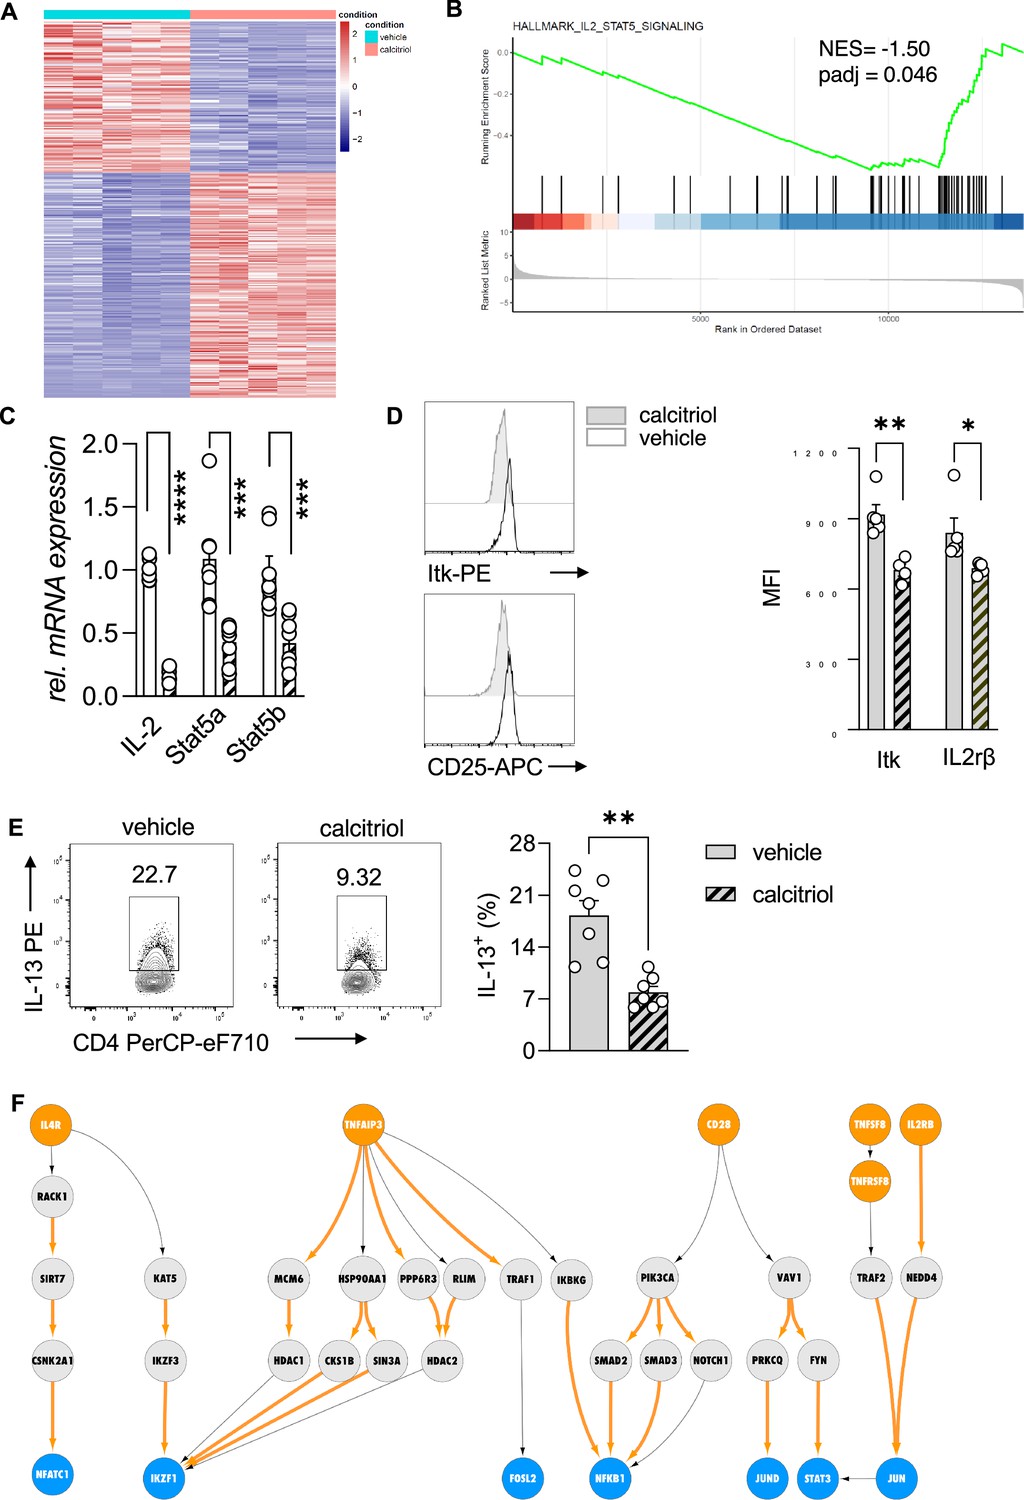
Vitamin D stimulation of polarizing Th2 cells suppresses the IL-2/Stat5 pathway.
(A) Heat map of differentially expressed genes between vehicle (EtOH [% vol/vol])- and calcitriol-treated wild-type (WT) Th2 cells. Analysis and visualization were performed with DESeq2. (B) Gene set enrichment analysis (GSEA) of differentially expressed genes. Analysis and visualization were performed with the clusterProfiler package. (C) Quantitative RT-PCR for Il-2, Stat5a, and Stat5b mRNA expression in Th2 cells exposed to either vehicle or calcitriol. Gene expression levels were normalized to the house keeping gene L32 and are expressed as fold-induction compared to control cells. (D) Flow cytometric analysis and mean fluorescence intensities of Itk and Il2rβ expression in indicated groups. (E) Flow cytometric analysis and quantification of IL-13 expression in respective groups. (F) Network analysis to visualize vitamin D-induced molecular changes in the molecular interactome of calcitriol-stimulated CD4+ Th2. Predefined set of cell membrane receptors were set as starting points (orange nodes) and annotated transcription factors were set as ending points (blue). All intermediate proteins on the Protein–Protein Interaction (PPI) are visualized as gray nodes. Molecular interactions only overrepresented in calcitriol-stimulated cells are shown as orange arrows. Each symbol in the bar graphs represents one individual sample and data summarize the results from two or three independent experiments with n ≥ 4. Error bars indicate the standard error of the mean (SEM). Statistical test: two-tailed Student’s t-test (C, E) and two-tailed Mann–Whitney U-test (D). *p < 0.05, **p < 0.01, ***p < 0.001, ****p < 0.001.
-
Figure 4—source data 1
Gene ontology enrichment analysis for Figure 4.
- https://cdn.elifesciences.org/articles/89270/elife-89270-fig4-data1-v2.xlsx
-
Figure 4—source data 2
Gene ontology enrichment analysis for Figure 4 (Hallmark gene sets).
- https://cdn.elifesciences.org/articles/89270/elife-89270-fig4-data2-v2.xlsx
-
Figure 4—source data 3
Gene set enrichment analysis for Figure 4.
- https://cdn.elifesciences.org/articles/89270/elife-89270-fig4-data3-v2.xlsx
-
Figure 4—source data 4
The subset of receptors and transcription factors selected as input for our network analysis.
- https://cdn.elifesciences.org/articles/89270/elife-89270-fig4-data4-v2.xlsx
-
Figure 4—source data 5
Protein names for the subset of receptors and transcription factors selected as input for our network analysis.
- https://cdn.elifesciences.org/articles/89270/elife-89270-fig4-data5-v2.xlsx
Figure 4—figure supplement 1
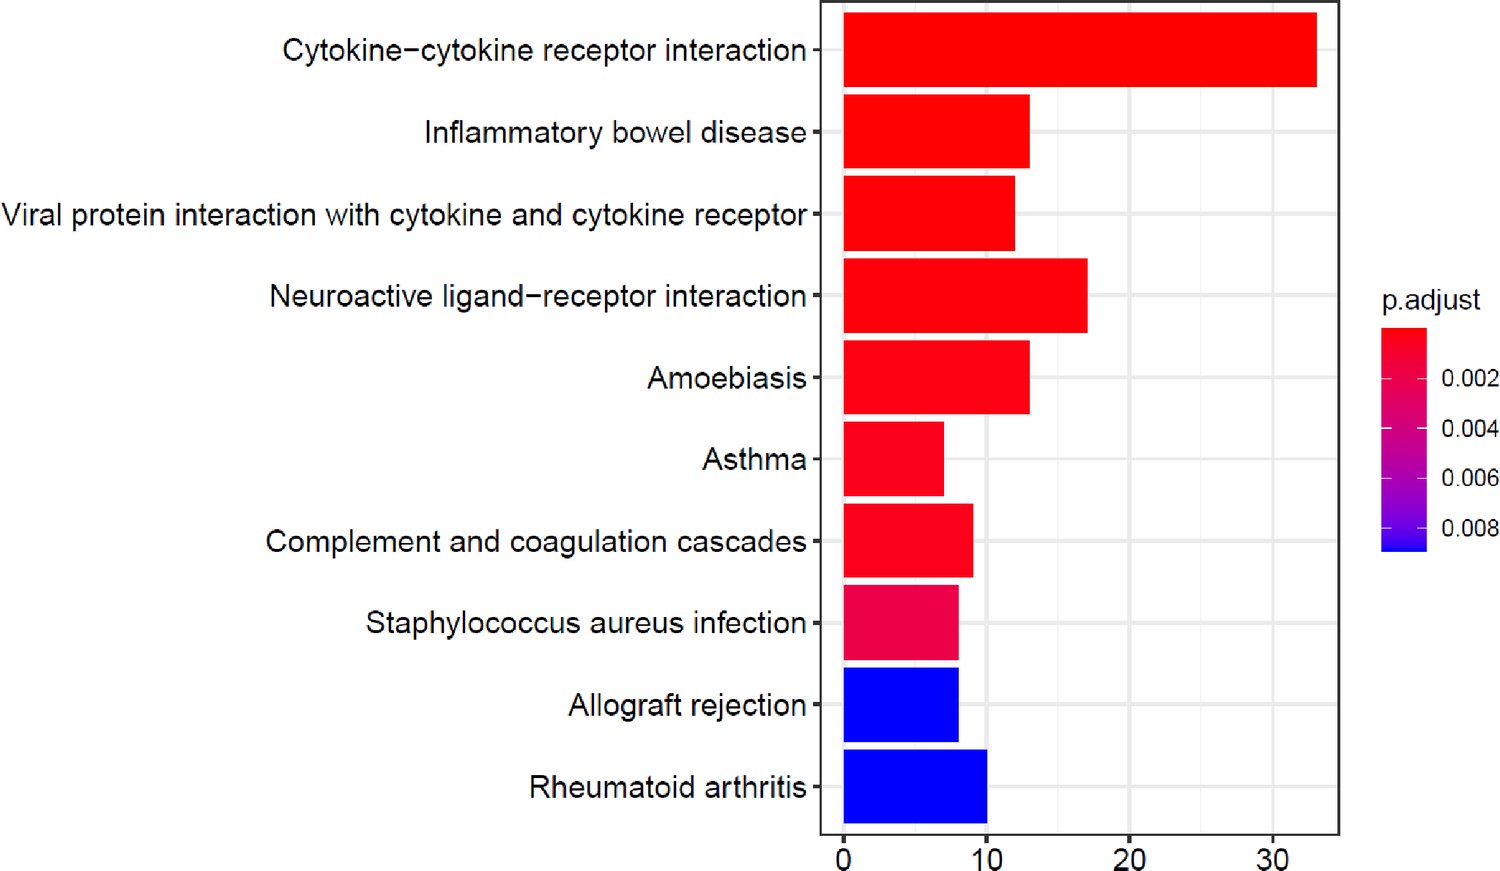
KEGG (Kyoto Encyclopedia of Genes and Genomes) pathways analysis post vitamin D stimulation.
List of KEGG pathways enriched (p-adj. <0.05) in differentially expressed (DE) genes after calcitriol stimulation. The x-axis indicates the number of genes annotated to each pathway. The bar colors indicate the false discovery rate (FDR)-adjusted p-value based on the colormap on the right side of the figure. The R package clusterProfiler was used for the enrichment analysis and visualization.
Figure 4—figure supplement 2
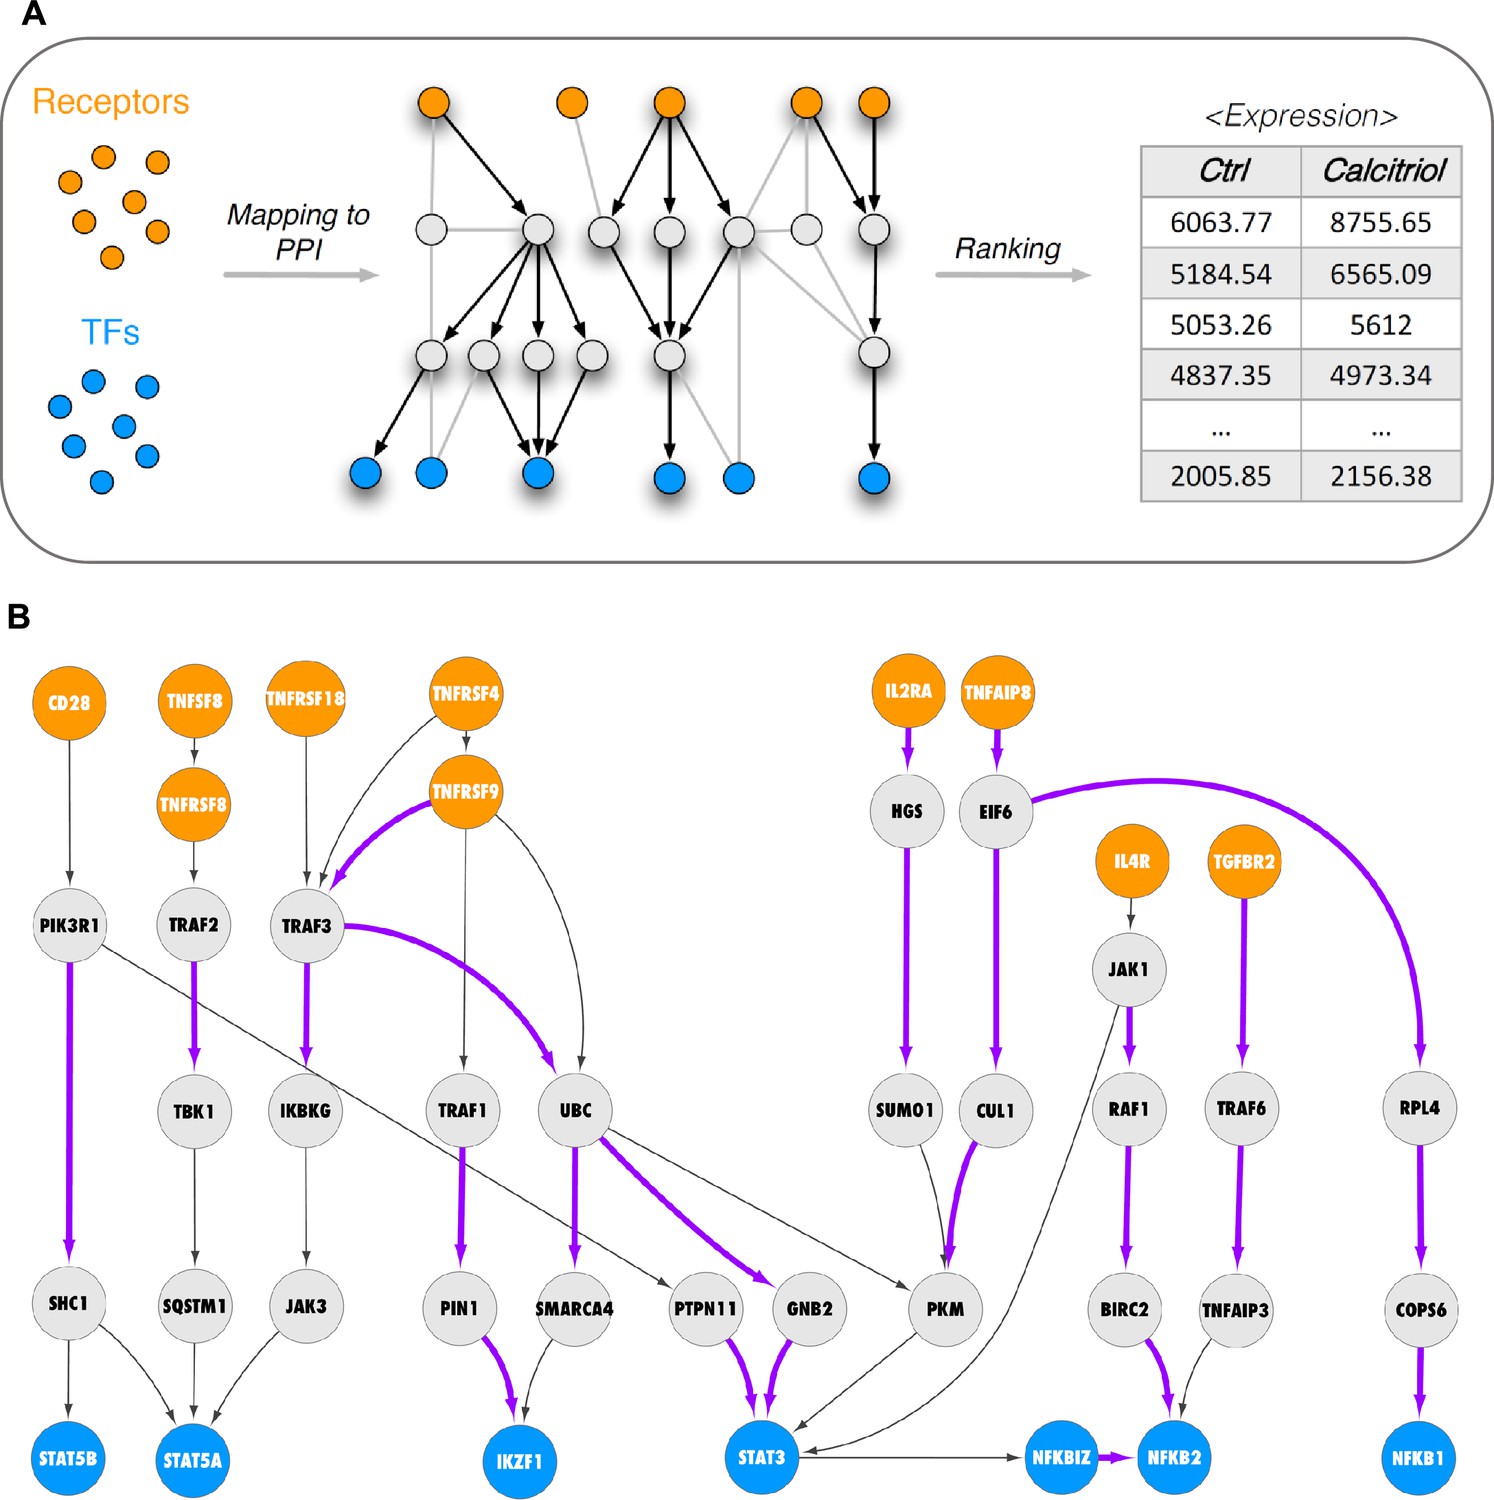
Active signaling pathways in Th2 cells.
(A) Schematic representation of the network analysis employed. (B) Network analysis to visualize active signaling paths in control stimulated Th2 cultures. Predefined set of cell membrane receptors were set as starting points (orange nodes) and annotated transcription factors were set as ending points (blue). All intermediate proteins on the Protein–Protein Interaction (PPI) are visualized as gray nodes. Molecular interactions only overrepresented in control stimulated cells are shown as purple arrows.
Figure 5 with 3 supplements
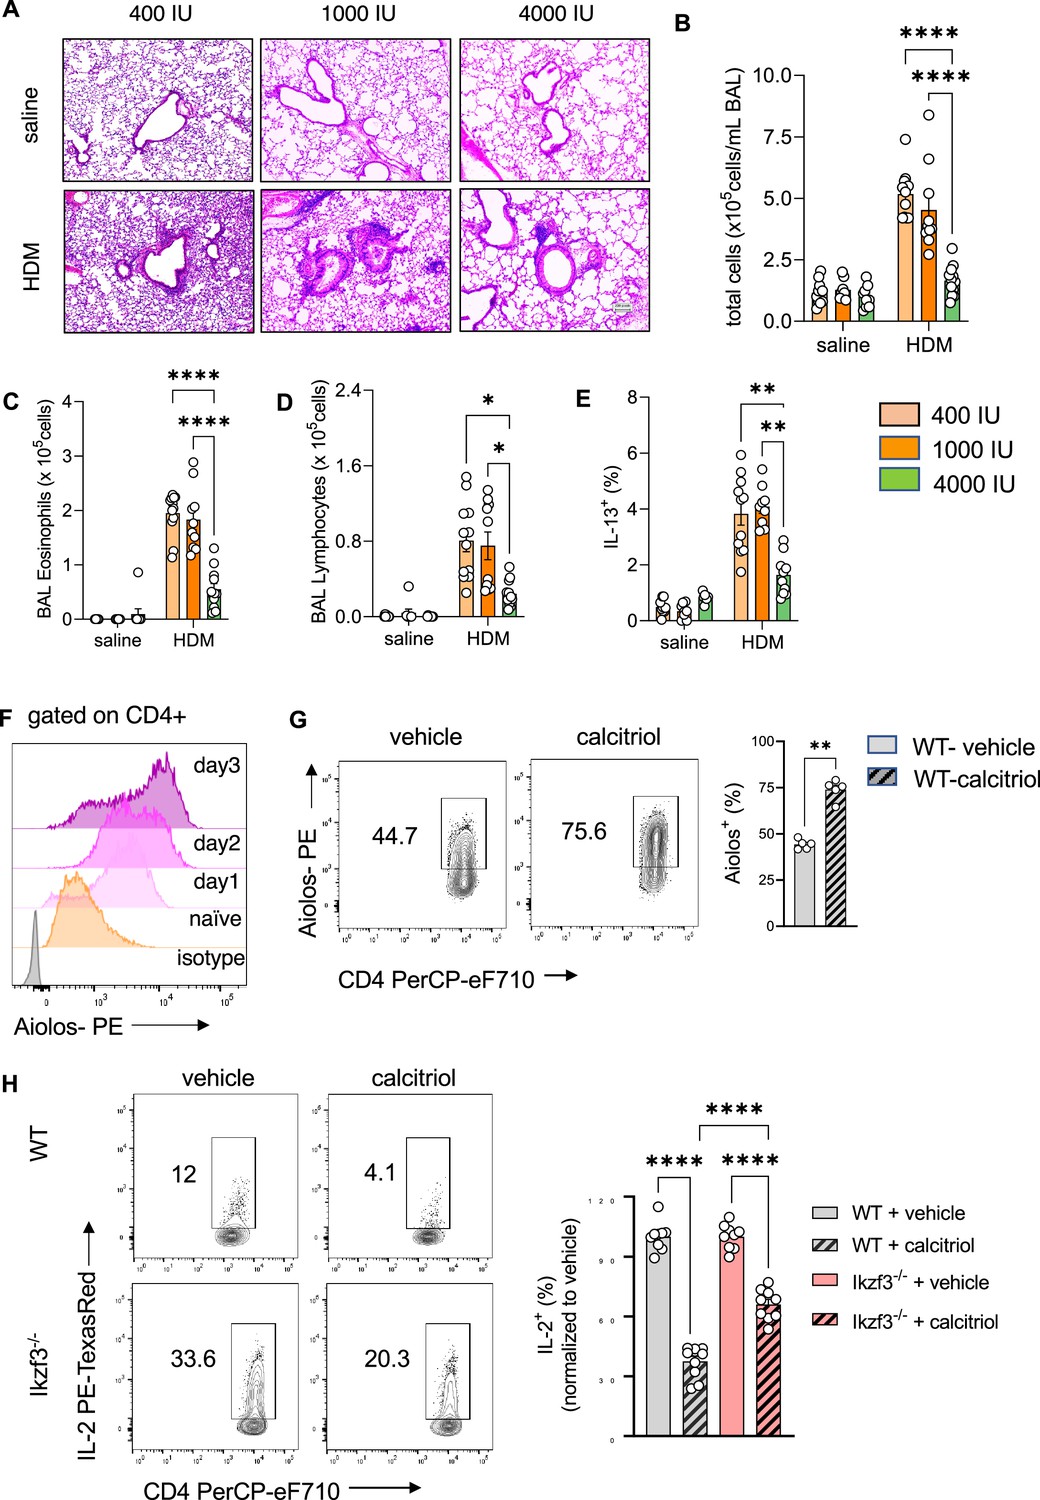
Prenatal vitamin D supplementation protects from asthma development.
(A) H&E staining of representative lung sections of indicated experimental groups. Arrowheads point to peri bronchial infiltrates. Absolute numbers of total BAL (B) leukocytes, (C) eosinophils, (D) lymphocytes, and (E) lung IL-13+ Th2 cells (n ≥ 8 per group). (F) Flow cytometric analysis of Aiolos expression in differentiating Th2 cells at indicated time points. (G) Flow cytometric analysis of Aiolos expression in control and calcitriol stimulated Th2 cells. (H) Flow cytometric analysis and frequencies of IL-2+ cells in wild-type (WT) and Ikzf3−/− cultures post indicated treatment. Each symbol represents and independent sample (n ≥ 9 per group). Flow cytometric analysis and quantification of Vdr expression in lung CD4+ T cells of the respective groups. Each symbol represents one individual mouse and data summarize the results from two to three independent experiments with n > 8 per group. Error bars indicate the standard error of the mean (SEM). Statistical significance was determined with mixed-effect analysis with Holm–Šidák’s post hoc analysis (B–E), two-tailed Mann–Whitney U-test (G) and one-way analysis of variance (ANOVA) with Holm–Šidák’s post hoc analysis (H). *p < 0.05, **p < 0.01, ****p < 0.0001.
-
Figure 5—source data 1
Original images of H&E-stained lung section shown in Figure 5A.
- https://cdn.elifesciences.org/articles/89270/elife-89270-fig5-data1-v2.zip
Figure 5—figure supplement 1
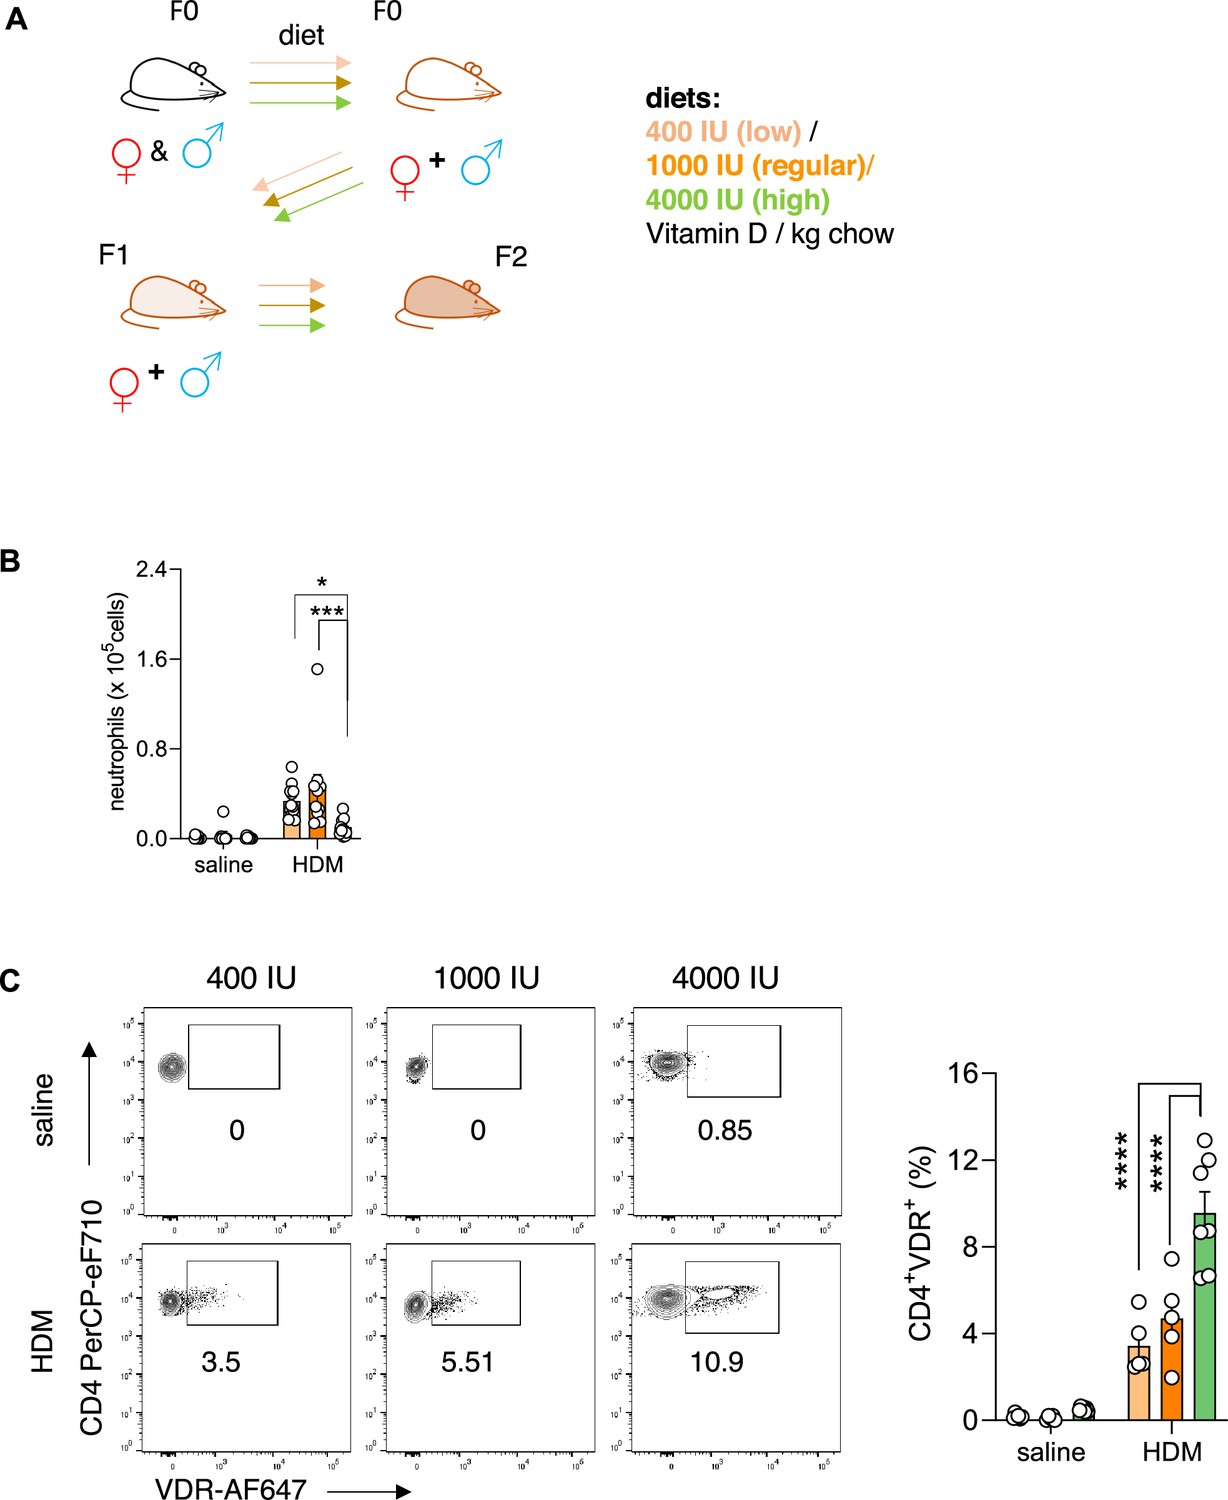
Prenatal vitamin D supplementation increases Vdr expression in CD4+ T cells.
(A) Schematic presentation of the dietary intervention protocol and breeding scheme with vitamin D. (B) Absolute neutrophil numbers in BAL (n ≥ 8 per group). (C) Flow cytometric analysis and quantification of Vdr expression in lung CD4+ T cells of the respective groups. Each symbol represents one individual mouse and data summarize the results from two to three independent experiments with n ≥ 5 per group. Error bars indicate the standard error of the mean (SEM). Statistical significance was determined with one-way analysis of variance (ANOVA) with Holm–Šidák’s post hoc analysis. *p < 0.05, ***p < 0.001, ****p < 0.0001.
Figure 5—figure supplement 2
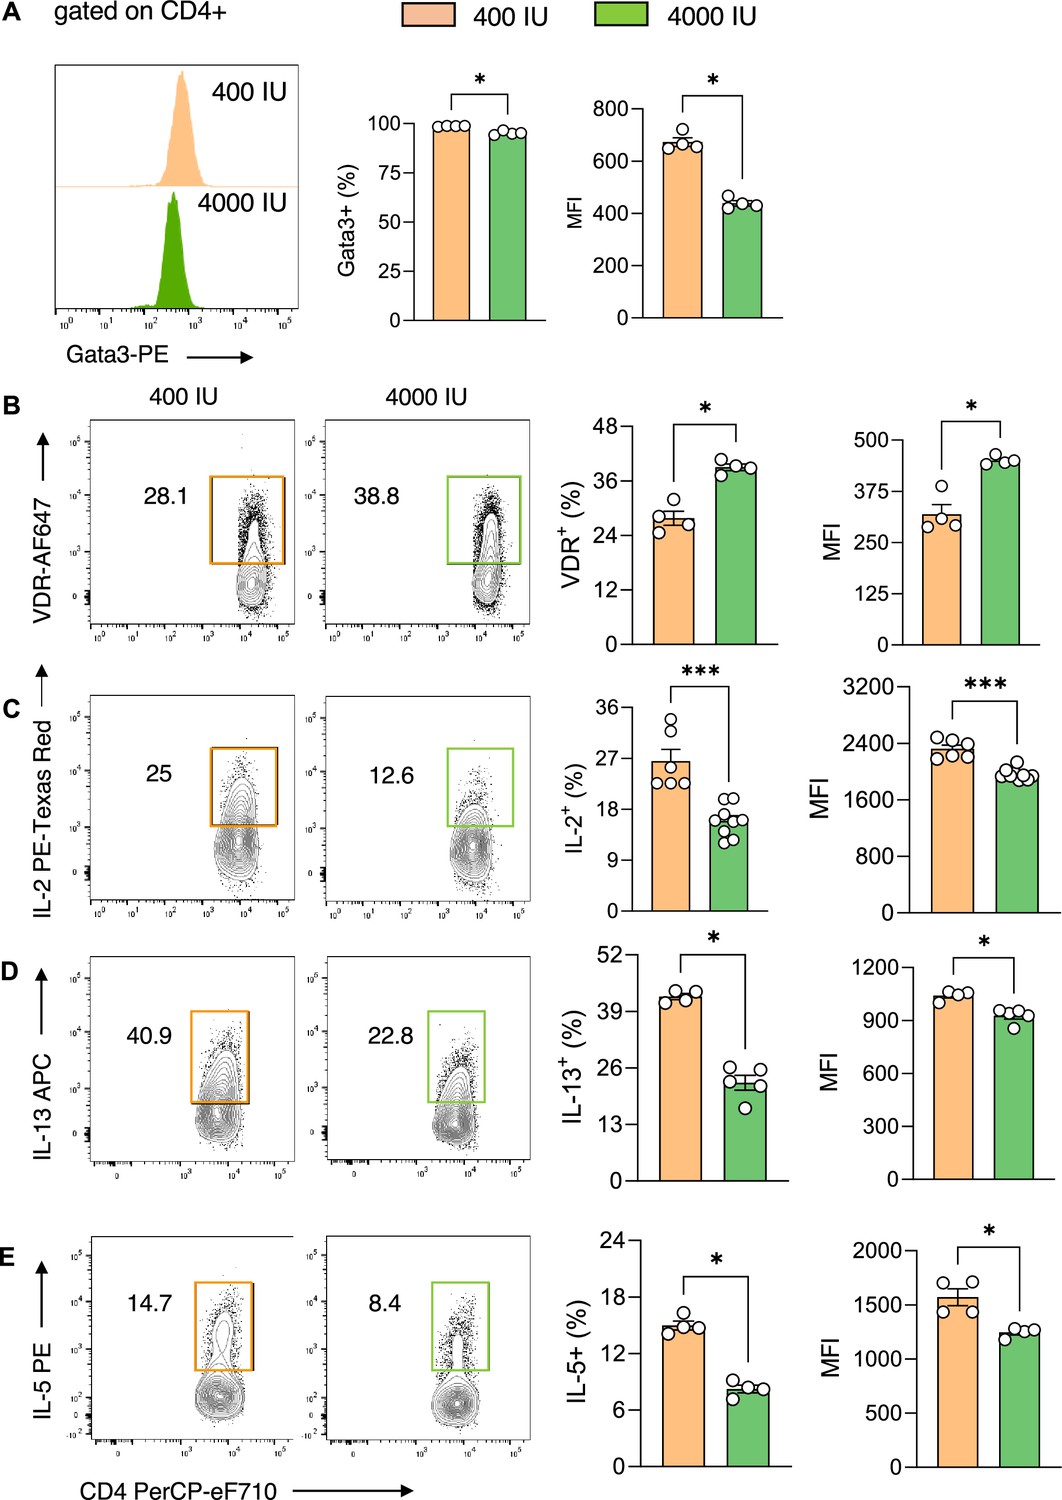
Prenatal vitamin D supplementation mitigates Th2 development and cytokine production in vitro.
Representative flow plots and cell frequencies of (A) Gata3, (B) Vdr, (C) IL-2, (D) IL-13, and (E) IL-5 expression in indicated groups. Each symbol represents one individual sample and data summarize the results from two to three independent experiments (n = 4–9 per group). Error bars indicate the standard error of the mean (SEM). Statistical test: two-tailed Mann–Whitney U-test (A–E). *p < 0.05, ***p < 0.001.
Figure 5—figure supplement 3
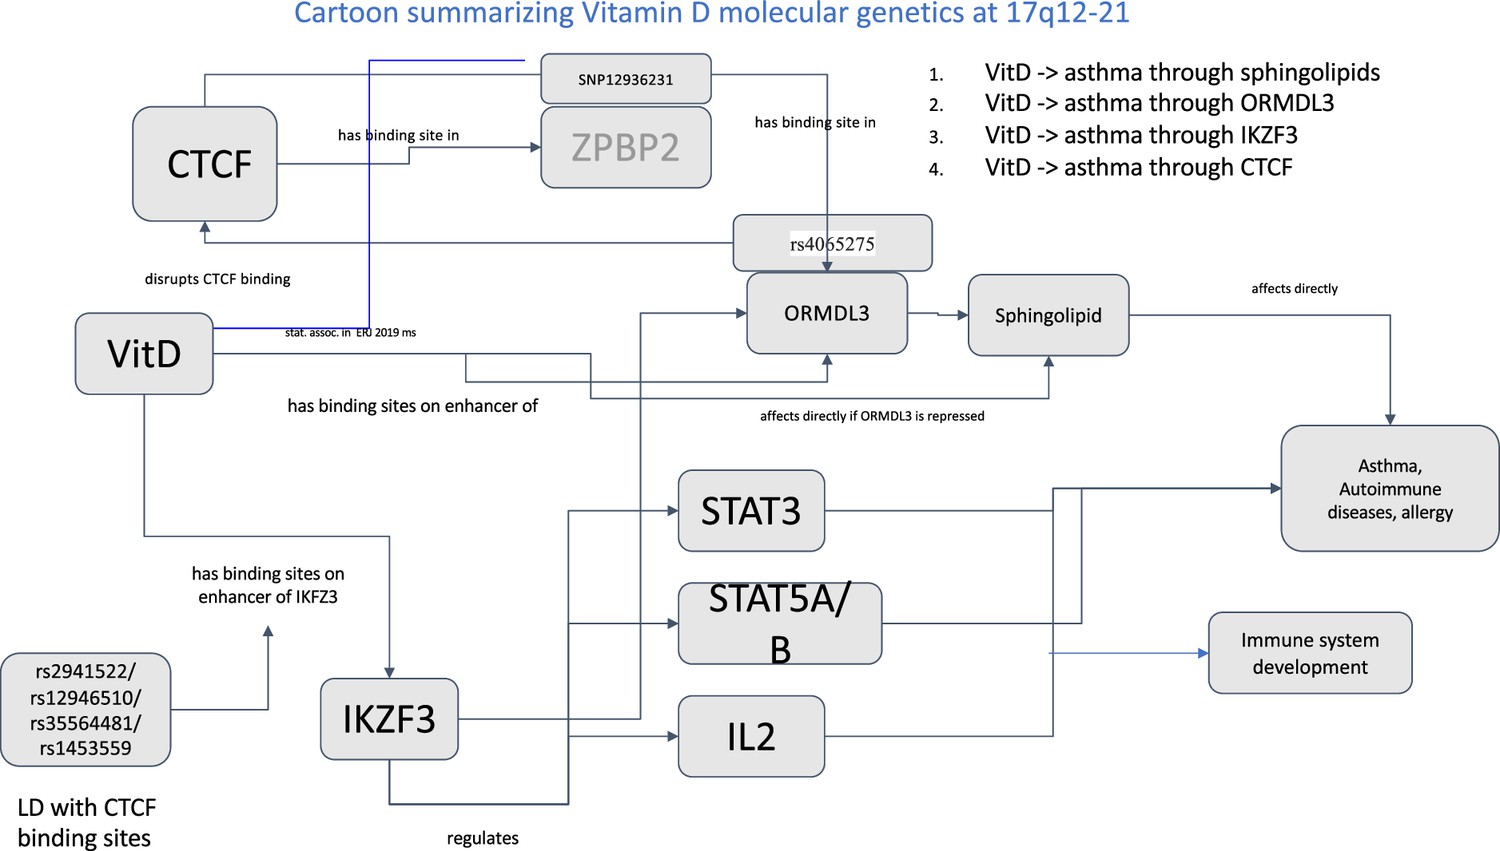
Schematic summary of vitamin D molecular genetics in the 17q12-21 region.
Additional files
-
Supplementary file 1
List of antibodies used.
- https://cdn.elifesciences.org/articles/89270/elife-89270-supp1-v2.xlsx
-
Supplementary file 2
List of reagents used.
- https://cdn.elifesciences.org/articles/89270/elife-89270-supp2-v2.xlsx
-
Supplementary file 3
List of primer sequences used.
- https://cdn.elifesciences.org/articles/89270/elife-89270-supp3-v2.xlsx
-
MDAR checklist
- https://cdn.elifesciences.org/articles/89270/elife-89270-mdarchecklist1-v2.docx
Download links
A two-part list of links to download the article, or parts of the article, in various formats.
Downloads (link to download the article as PDF)
Open citations (links to open the citations from this article in various online reference manager services)
Cite this article (links to download the citations from this article in formats compatible with various reference manager tools)
Vitamin D constrains inflammation by modulating the expression of key genes on Chr17q12-21.1
eLife 12:RP89270.
https://doi.org/10.7554/eLife.89270.4


