Touch receptor end-organ innervation and function require sensory neuron expression of the transcription factor Meis2
- Institute for Neurosciences of Montpellier, University of Montpellier, INSERM U 1298, France
- Department of Neuroscience, Max‐Delbrück Centre for Molecular Medicine, Germany
- IGFL, UMR 5242 CNRS/ENS, France
Figures
Figure 1 with 3 supplements
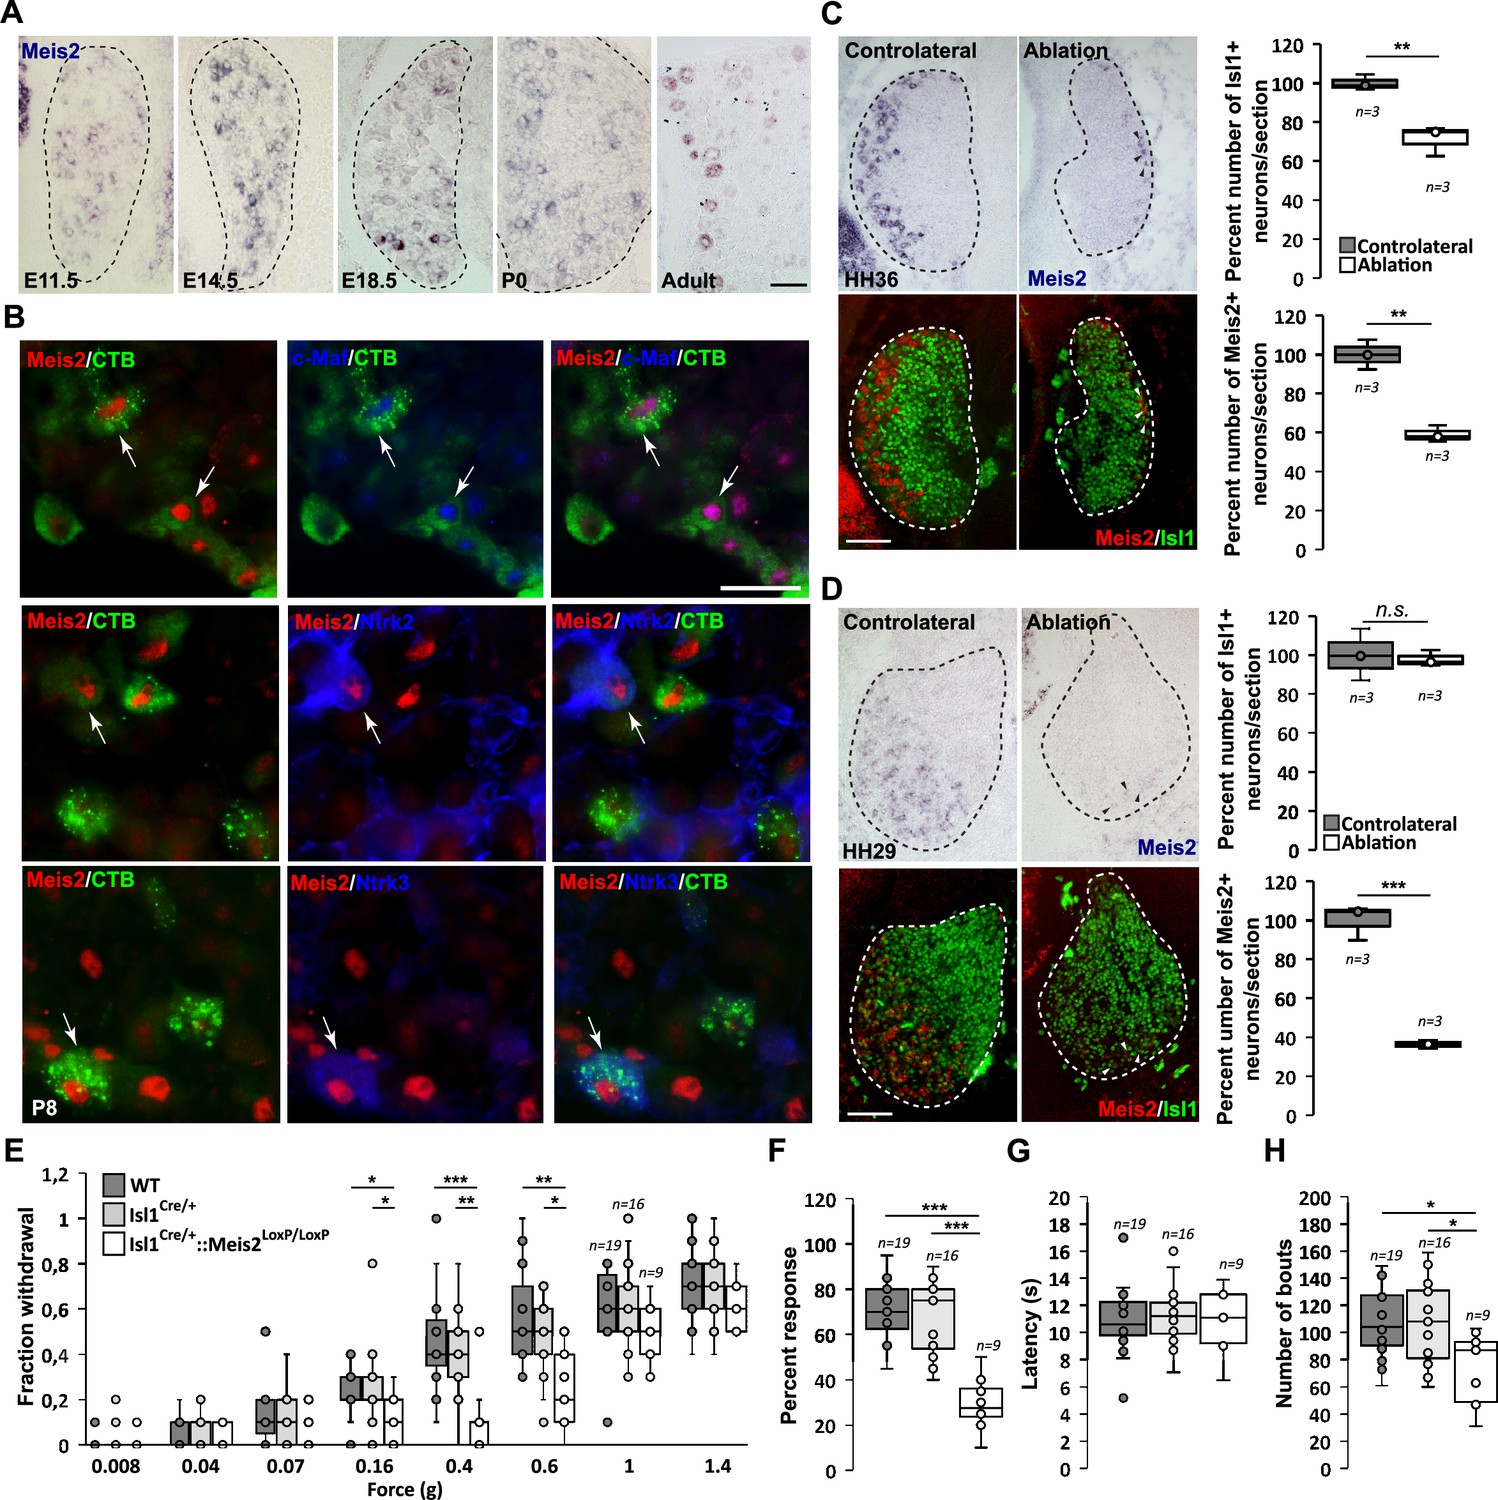
Meis2 is expressed in subclasses of dorsal root ganglia (DRG) cutaneous mechanoreceptive neurons in mouse embryos.
(A) In situ hybridization (ISH) for Meis2 mRNA showed expression in a subpopulation of DRG sensory neurons at embryonic stages E11.5, E14.5, and E18.5, at P0, and at adult stages. Dashed lines delineate the DRG. Scale bar = 50 µm. (B) IF for Meis2 (red) and c-Maf, Ntrk2, or Ntrk3 (blue) at P7 following injection of cholera toxin B subunit (CTB in green) in the skin of newborn pups. Note that Meis2+/CTB+ retro-traced sensory neurons co-expressed c-Maf, Ntrk2, or Ntrk3 (arrows). Scale bar = 50 µm. We estimated that 30.5 ± 3.5% (mean ± SEM; n = 3) of Meis2-positive neurons co-expressed Ntrk2, and that 39.5 ± 5.4% co-expressed Ntrk3. Conversely, Meis2 was co-expressed in 53.6 ± 9.4% of Ntrk2-positive neurons, and in 78.5 ± 5.0% of Ntrk3-positive neurons. Meis2 expression depends on target-derived signals (C, D). (C) Representative images of Meis2 mRNA expression (blue or pseudo-colored in red) and islet1 (green) in DRGs of Hamburger–Hamilton stage (HH) 36 chick embryos on the ablated and contralateral sides. Box plots showing the number of Islet1+/Meis2+ DRG neurons per section at stage HH36 following limb bud ablation. For Islet1-positive neurons, the contralateral side was considered as 100% of neurons per section. For Meis2-positive neurons, values represent the percentage of Meis2+ over Islet1+ neurons. (D) Representative images of Meis2 mRNA expression (blue or pseudo-colored in red) and islet1 (green) in DRGs of HH29 chick embryos on the ablated and contralateral sides. Box plots showing the quantification of Islet1+/Meis2+ neurons number per section at stage HH29 on the contralateral and ablated sides. Arrowheads point at remaining Meis2-positive VL neurons. Dashed lines encircle the DRGs. **p≤0.005; ***p≤0.0005; ns = not significant following Student’s t-test. n = 3 chick embryos. Scale bar = 100 µm. Altered touch perception in Meis2 mutant mice (E–H). (E) Box plots showing the responses following application of Von Frey filaments of different forces. Isl1+/Cre::Meis2LoxP/LoxP mice exhibited a significantly reduced sensitivity to the 0.16, 0.4, and 0.6 g Von Frey filaments but not to higher forces filaments compared to WT and Isl1+/Cre littermates. * p≤0.05; ** p≤0.005; *** p≤0.001 following Kruskal–Wallis statistical analysis. (F) Box plots showing the dynamic touch responses when the hind paw palms of individual mice were stroked with a tapered cotton swab. Analysis showed that Isl1+/Cre::Meis2LoxP/LoxP mice were less responsive to the stimulus than WT and Isl1+/Cre littermates. *** p≤0.0001 following a one-way ANOVA statistical analysis. (G) Box plots indicating that the latency to the first signs of aversive behavior in the hot plate test is similar in all groups of mice. WT, n = 19; Isl1+/Cre, n = 16; Isl1+/Cre::Meis2LoxP/LoxP, n = 9. (H) Box plots showing the number of bouts when a sticky paper tape was applied on the back skin of mice. Analysis indicated a significant decrease in the number of bouts in Isl1+/Cre::Meis2LoxP/LoxP mice compared to WT and Isl1+/Cre littermates. * p≤0.05 following a one-way ANOVA statistical analysis.
-
Figure 1—source data 1
Isl1+/Cre::Meis2LoxP/LoxP adult mice exhibit normal locomotion.
Table recapitulating different Catwalk two-paw analysis parameters in 3-month-old female mice. Several recordings were performed for each mouse. Only sequences when mice showed a constant and straight locomotion with an average speed between 25 and 55 cm s-1 were selected for analysis. Student’s t-test analysis showed no significant differences for any of the parameters.
- https://cdn.elifesciences.org/articles/89287/elife-89287-fig1-data1-v1.docx
Figure 1—figure supplement 1
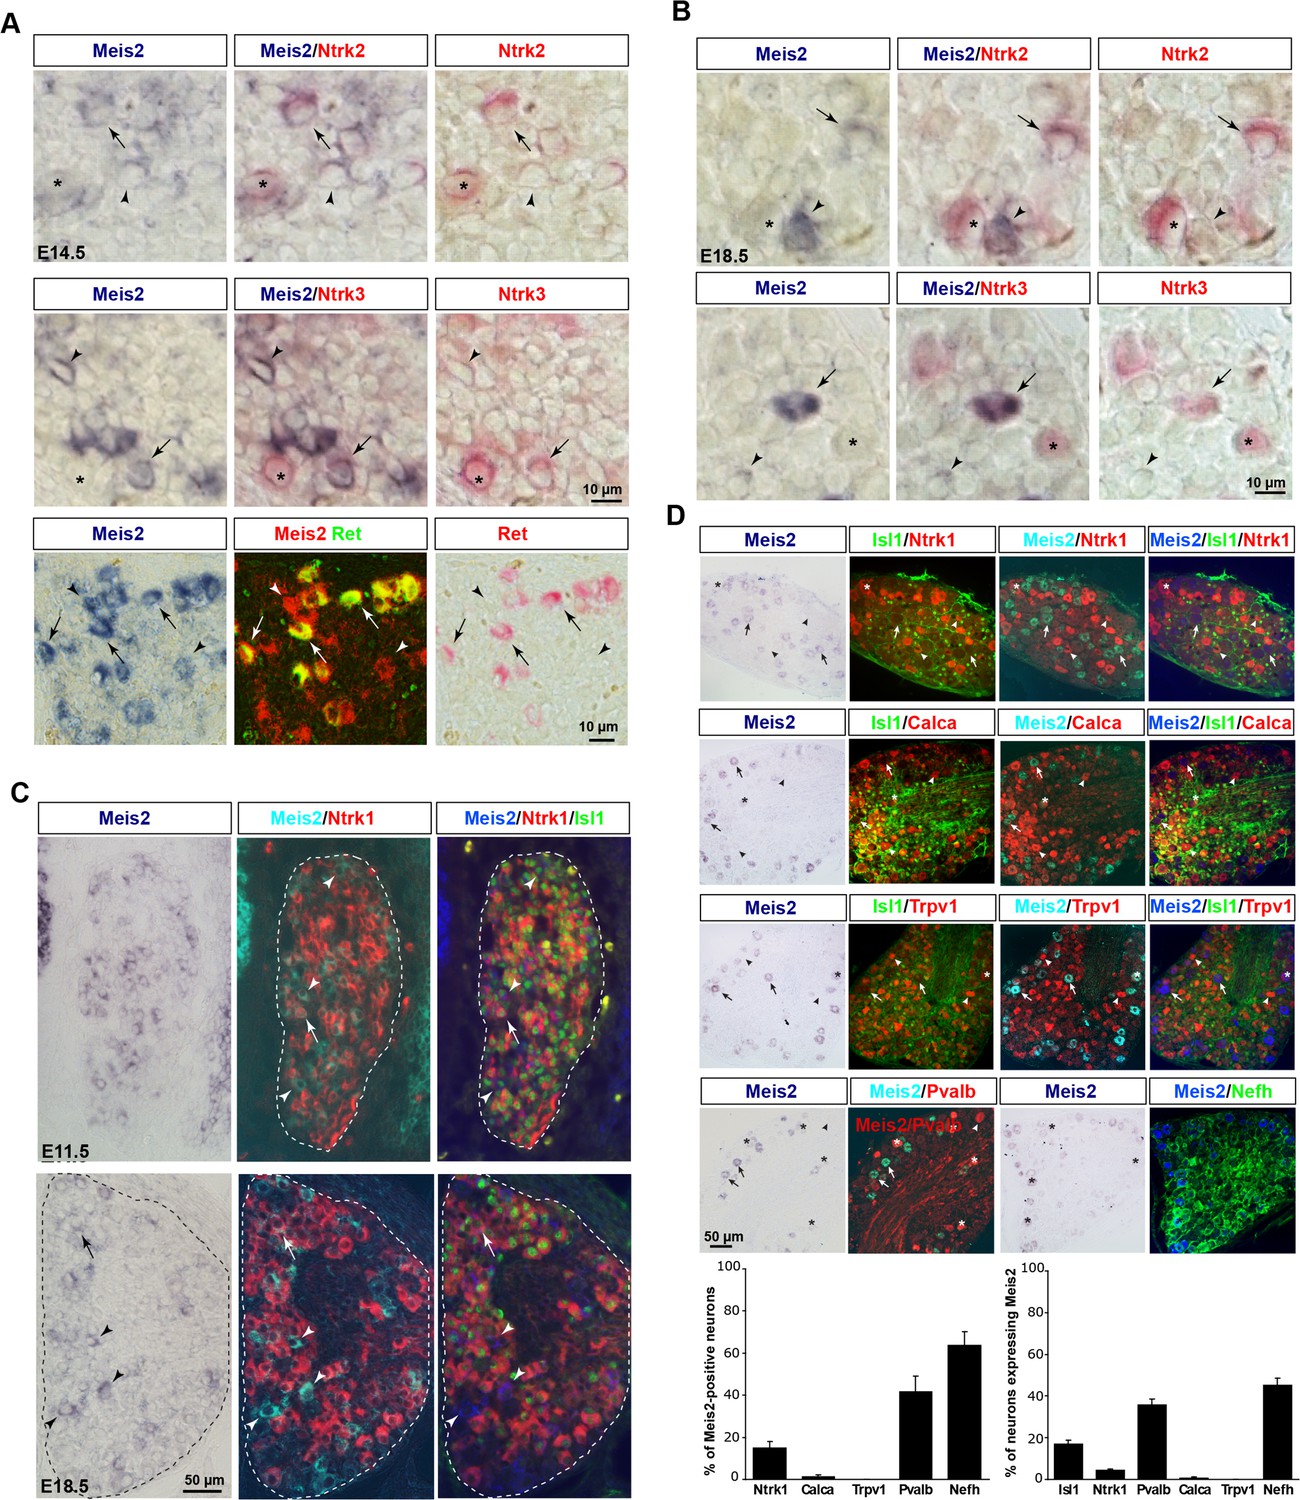
Meis2 mRNA expression in low-threshold mechanoreceptor (LTMR) neurons of mouse dorsal root ganglia (DRG).
(A) Double in situ hybridization (ISH) for Meis2 (blue) and Ntrk2, Ntrk3, or Ret (red) showed that Meis2 mRNA partly colocalizes with mRNA for Ntrk2, Ntrk3, and Ret in E14.5 mouse embryos. Arrows point at double-positive neurons. Arrowheads point at Meis2+-only neurons. Stars indicate Meis2-/Ntrk2+ or Ntrk3+ neurons. Note that all large Ret-positive neurons (pseudo-color in green) express Meis2 mRNA. Scale bar = 25 µm. We estimated that 16.0 ± 1.2% (mean ± SEM; n = 3) of Meis2-positive neurons co-expressed Ntrk2 and that 43.7 ± 2.1% co-expressed Ntrk3. Conversely, Meis2 was co-expressed in 55.9 ± 3.1% of Ntrk2-positive neurons and in 79.1 ± 3.4% of Ntrk3-positive neurons. (B) Double ISH for Meis2 (blue) and Ntrk2 or Ntrk3 (red) in E18.5 embryos. Arrows point at double-positive neurons. Arrowheads point at only Meis2+ neurons. Stars indicate Meis2-/Ntrk2+ or Ntrk3+ neurons. Scale bar = 25 µm. We estimated that 28.7 ± 2.5 of Meis2-positive neurons co-expressed Ntrk2 and that 57.8 ± 5.1 co-expressed Ntrk3. Conversely, Meis2 was co-expressed in 52.1 ± 4.5% of Ntrk2-positive neurons and 63.8 ± 5.1 ± 3.4% of Ntrk3-positive neurons. (C) Combined ISH for Meis2 mRNA with IF for Ntrk1 (red) and Islet1 (green) showed that Meis2 is expressed by Islet1-positive postmitotic neurons and is mostly excluded from the Ntrk1-positive subpopulation of DRG sensory neurons at E11.5 and E18.5. Arrowheads point at Meis2+/Ntrk1- neurons, arrows point at Meis2+/Ntrk1+ neurons. Note that the level of Meis2 mRNA expression in Ntrk1+/Meis2+ neurons is very low at the limit of detection. Dashed lines delineate the DRG. Scale bar = 50 µm. (D) ISH for Meis2 (blue) combined with IF against Ntrk1, Calca, Trpv1, Pvalb (red), and Islet1 or Nefh (green) in adult mouse lumbar DRG. Arrows point at Meis2+ neurons. Arrowheads point at Ntrk1+, Calca+, Trpv1+, or Pvalb+ neurons. Stars indicate neurons that are both positive for Meis2 and Ntrk1, Calca, Trpv1, or Pvalb. Graphs showing the percentage of Meis2+ neurons showing immunoreactivity for Ntrk1, Trpv1, Calca, Pvalb, and Nefh, and the percentage of Isl1+, Ntrk1+, Calca+, Trpv1+, Pvalb+, or Nefh+ neurons co-expressing Meis2. Error bars indicate the SEM; n=3. Scale bar = 50 µm.
Figure 1—figure supplement 2
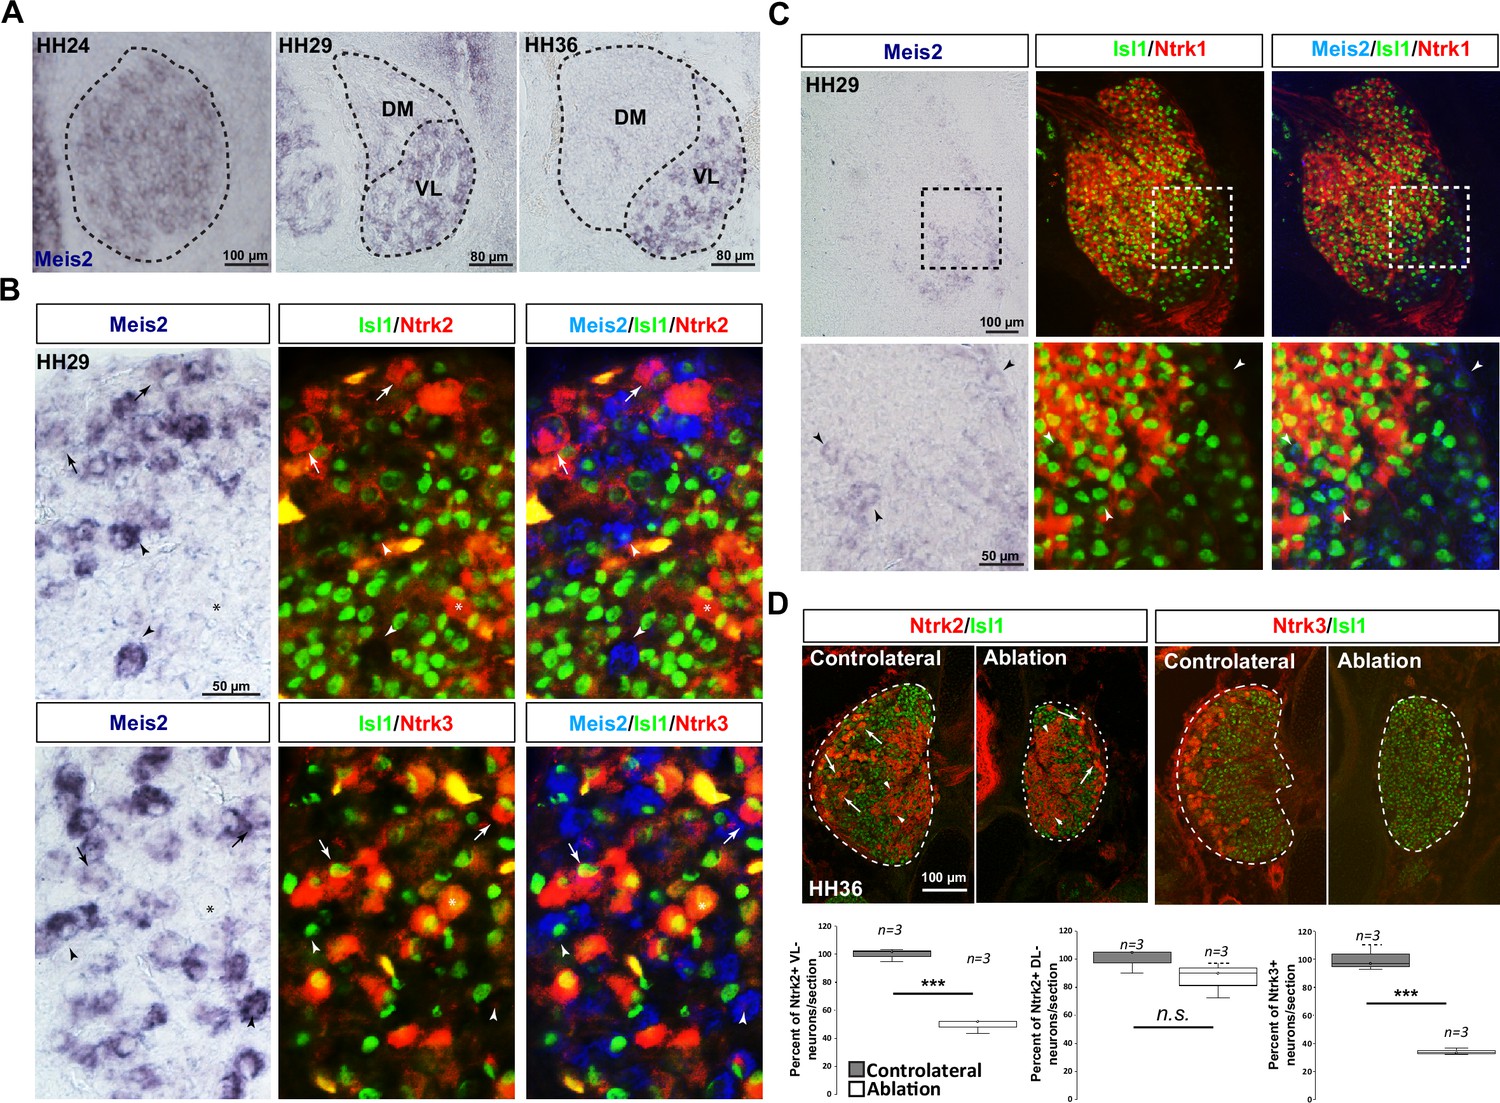
Meis2 is expressed in a subset of chick ventrolateral dorsal root ganglia (DRG) sensory neurons during embryogenesis.
(A) Developmental expression of Meis2 visualized by in situ hybridization (ISH) in chick DRG at HH24, HH29, and HH36. Dashed lines delineate the DRGs split into the ventrolateral (VL) and dorsomedial (DM) parts. In early stages after DRG condensation, Meis2 showed a broad expression in chick DRGs neurons. As differentiation progresses (HH29 and HH36), Meis2 expression becomes progressively restricted to the VL population of sensory neurons which represents the Ntrk2+ and Ntrk3+ populations of mechano- and proprioceptive neurons. Meis2-positive cells represented 16.4 ± 1.1 and 14.4 ± 1.2% (mean ± SEM; n = 3) of Islet1-positive DRG neurons at HH29 and HH36, respectively, (B) Combined ISH for Meis2 (blue) with IF against Islet1 (green) and Ntrk2 or Ntrk3 (red) in chick lumbar DRGs at HH29 showed that Meis2 expression is shared between the Ntrk2+ and Ntrk3+ subpopulations of sensory neurons. Arrowheads point at Meis2+/Islet1+/Ntrk2- and Meis2+/Islet1+/Ntrk3- neurons; arrows point at Meis2+/Islet1+/Ntrk2+ and Meis2+/Islet1+/Ntrk3+ neurons; stars indicate Meis2-/Islet1+/Ntrk2+ and Meis2-/Islet1+/Ntrk3+ neurons. We estimated that 38.4 ± 7.7 and 41.7 ± 3.0% (mean ± SEM; n = 3) of Meis2-positive neurons co-expressed Ntrk2 or Ntrk3, respectively, and inversely, that 62.1 ± 3.8 and 45.1 ± 4.7% (mean ± SEM; n = 3) of Ntrk2- and Ntrk3-positive neurons co-expressed Meis2 mRNA, respectively. (C) Combined ISH for Meis2 (blue) with IF against Islet1 (green) and Ntrk1 (red) in chick lumbar DRGs at HH29 showed that Meis2 is excluded from the Ntrk1+ population of sensory neurons. Arrowheads point at Meis2+/Islet1+/Ntrk1- neurons. Enlargement is indicated by a dashed square. (D) Representative images showing immunostaining for Ntrk2 or Ntrk3 (red) and Islet1 (green) on HH36 chick embryos DRG sections following limb ablation at HH18. Dashed lines delineate the DRGs. Arrows point at Ntrk2-positive VL neurons. Arrowheads point at Ntrk2-positive DL neurons. (C) Box plots showing the percentage of Ntrk2 and Ntrk3 VL neurons and of Ntrk2 DL neurons. *** p≤0.0005; ns = not significant following Student’s t-test. n = 3 chick embryos.
Figure 1—figure supplement 3

Mice with a conditional deletion of Meis2 gene in neural crest derivatives (Wnt1Cre) exhibited cleft palate and died at birth.
(A) Targeting vector used for the generation of a conditional knockout mouse strain for Meis2 (Meis2LoxP/LoxP). Exon 8 (first coding exon of the DNA binding homeodomain) is flanked by LoxP sites allowing deletion of Meis2 DNA binding domain. (B) Upper right: representative images showing that newborn Wnt1Cre::Meis2LoxP/LoxP pups mutant pups were smaller in size at birth compared to WT littermates and were unable to stand on their legs. Upper left: representative images showing that newborn Wnt1Cre::Meis2LoxP/LoxP pups mutant pups exhibited a cleft palate phenotype (white arrowheads). Bottom: representative images showing coronal sections of newborn WT and Wnt1Cre::Meis2LoxP/LoxP heads stained by eosin/hematoxylin treatment. Black arrows indicate the cleft palate.
Figure 2 with 1 supplement
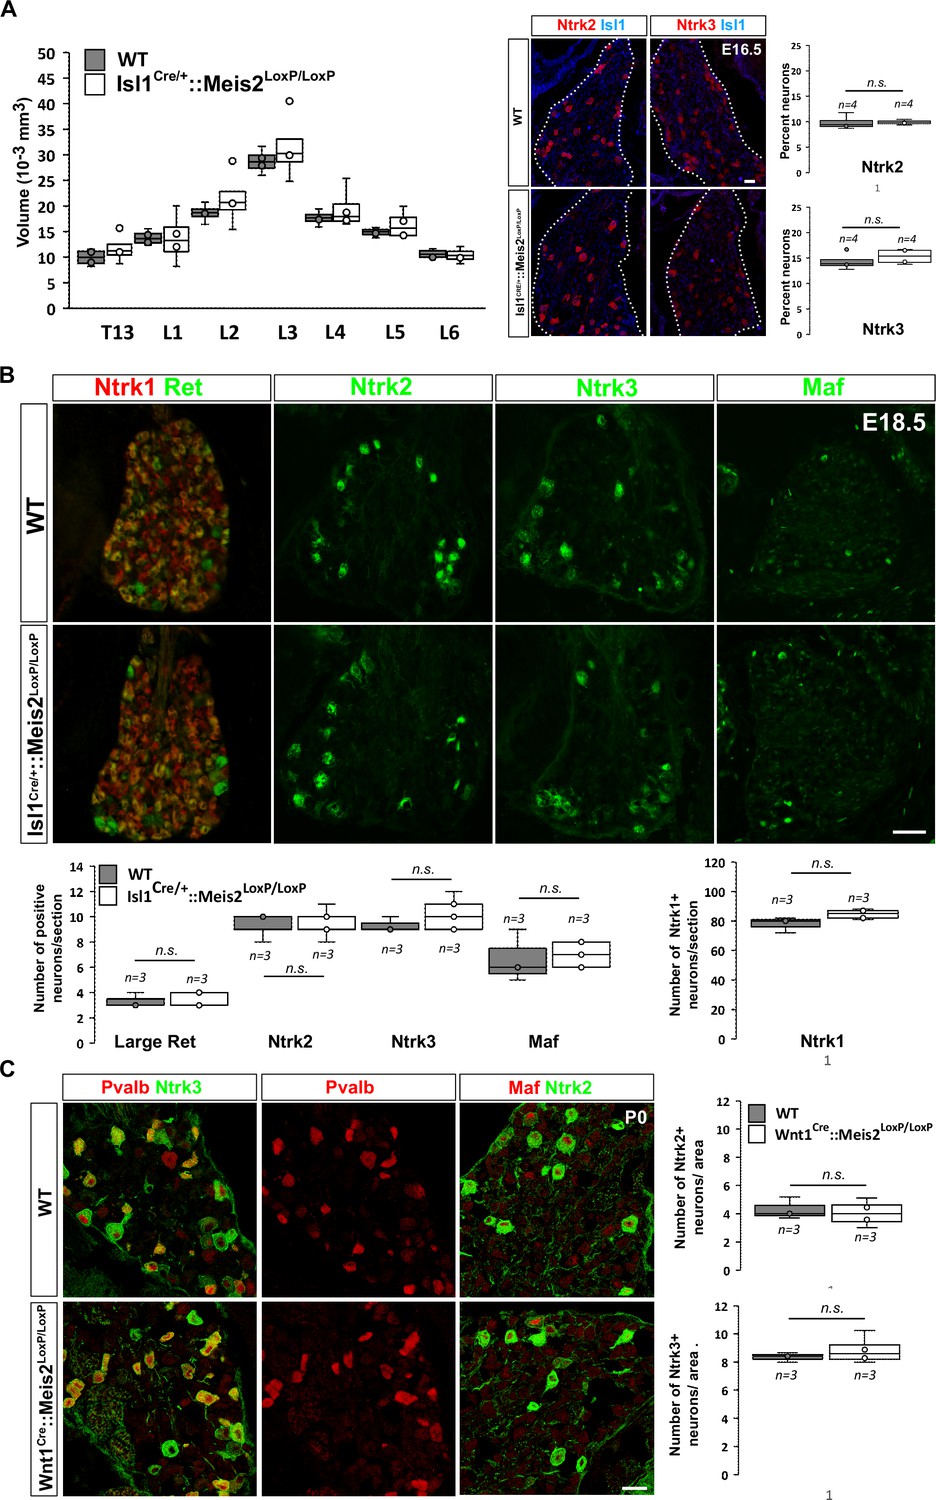
Meis2 is dispensable for low-threshold mechanoreceptor (LTMR) neuron survival and specification.
(A) Box plots showing that the dorsal root ganglia (DRG) volumes along the rostrocaudal axis are similar in embryonic day (E) 16.5 WT and Isl1Cre/+::Meis2LoxP/LoxP embryos. IF for Ntrk2 or Ntrk3 (red) and Islet1 (blue) and box plots analysis indicating that the percentage of Ntrk2+ and Ntrk3+ neurons is not affected in E16.5 Isl1Cre/+::Meis2LoxP/LoxP. Dashed lines encircle the DRGs. n = 4; n.s. = not significant. Scale bar = 20 µm. (B) Representative images showing IF for Ntrk1, Ret, Ntrk2, Ntrk3, and Maf in E18.5 WT and Isl1Cre/+::Meis2LoxP/LoxP DRGs. Box plots showing that the number of Ret+, Ntrk2+, Ntrk3+, and Maf+ LTMR neurons and of Ntrk1+ nociceptive neurons are similar in E18.5 WT and Isl1Cre/+::Meis2LoxP/LoxP DRGs. n = 3; n.s. = not significant. Scale bar = 100 µm. (C) Representative images showing IF for Ntrk2 or Ntrk3 (green) with Pvalb or Maf (red) in P0 WT and Wnt1Cre::Meis2LoxP/LoxP DRGs. Box plots showing that the number of Ntrk2+ and Ntrk3+ neurons is unchanged in P0 WT and Wnt1Cre::Meis2LoxP/LoxP DRGs. n = 3, n.s. = not significant. Scale bar = 20 µm.
Figure 2—figure supplement 1
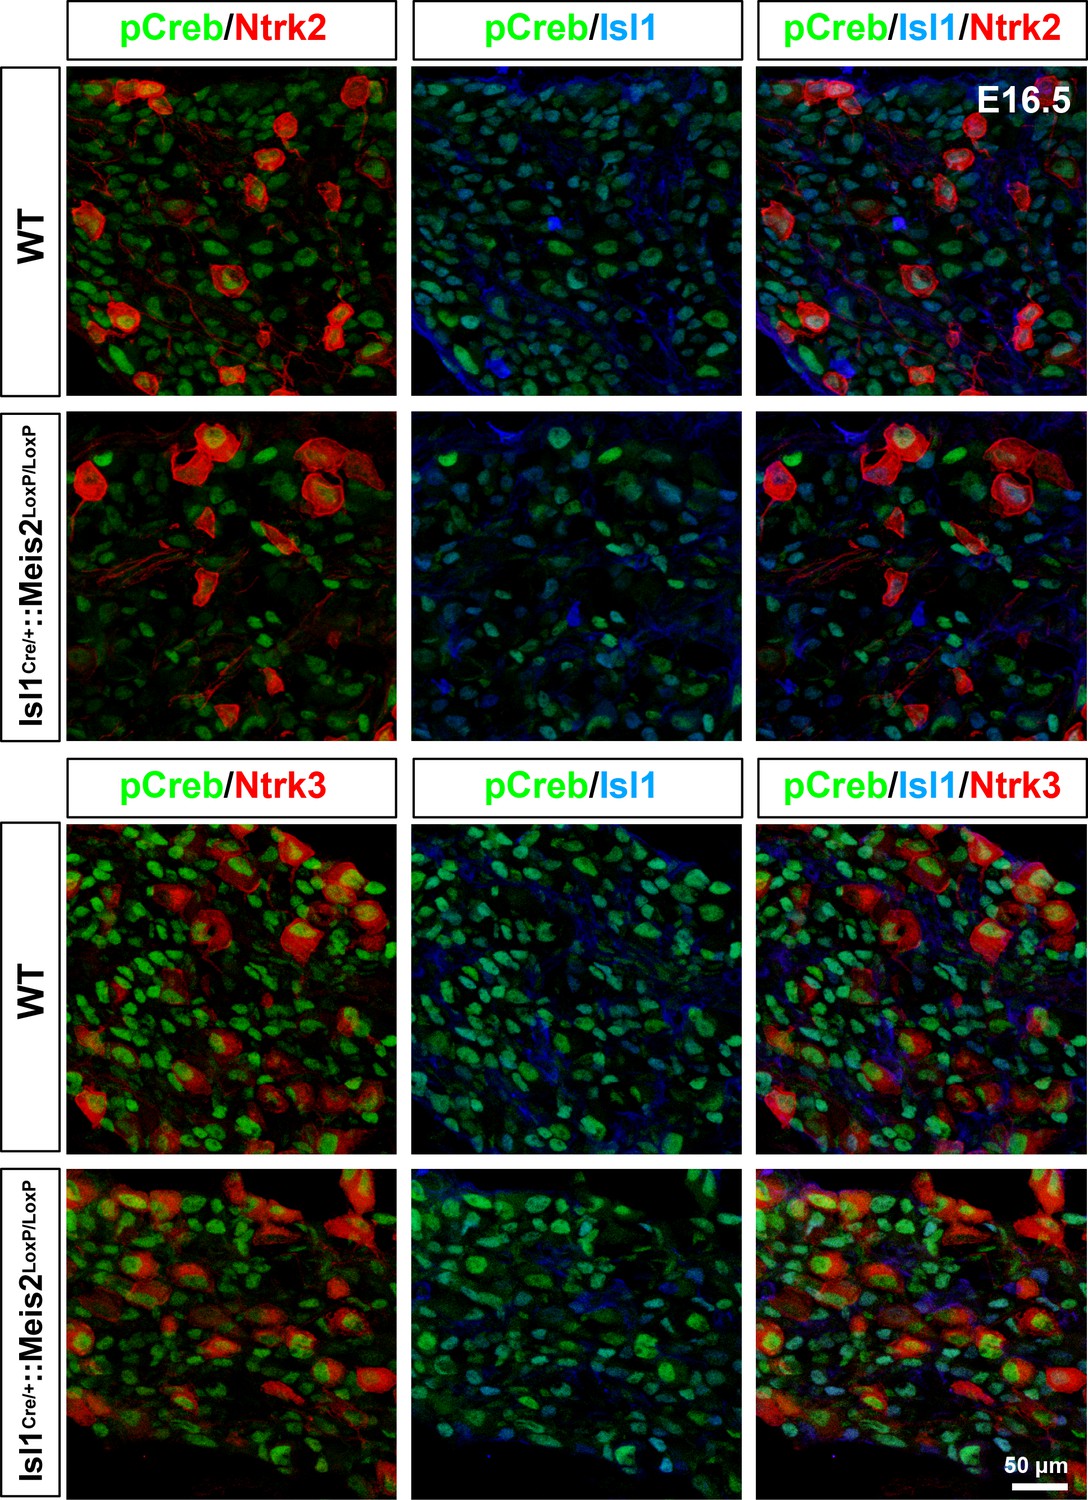
Meis2 gene inactivation does not affect phospho-Creb expression.
Representative images showing phosphor-Creb (pCreb in green), Ntrk2 or Ntrk3 (red), and Isl1 (blue) expression in WT and Isl1+/Cre::Meis2LoxP/LoxP E16.5 dorsal root ganglia (DRG) embryos.
Figure 3 with 4 supplements
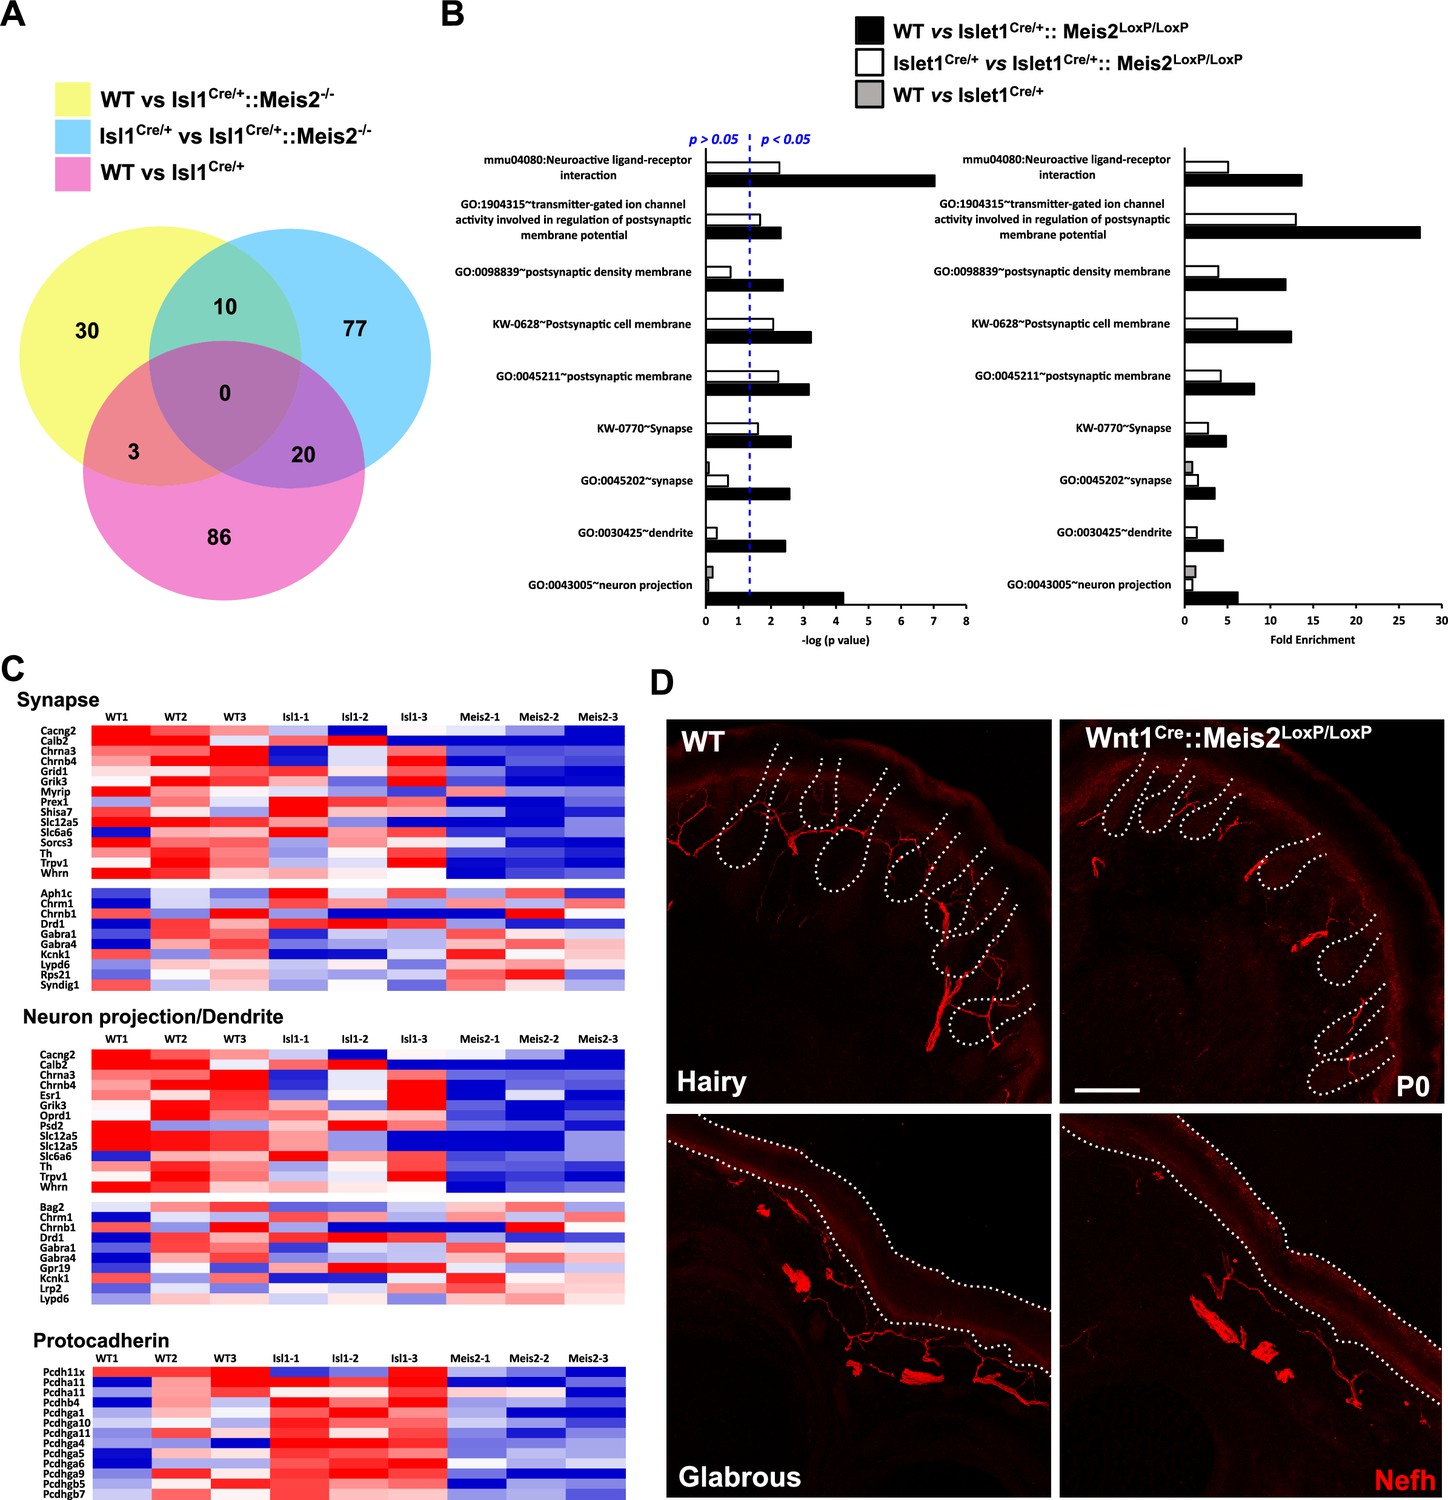
Meis2 inactivation dysregulates genes linked to neuronal projections and synaptogenesis.
(A) Venn diagram comparing the number of differentially expressed genes (DEGs) between each genotype (n = 3; p<0.05). This comparison identified 10 DEGs that were differentially expressed compared to both control genotypes (WT or Isl1+/Cre embryos), and a total of 140 genes that were differentially expressed in Meis2 mutant compared to either WT or Isl1+/Cre embryos. (B) Gene Ontology (GO) analysis for the three paired-analysis (WT vs Isl1+/Cre::Meis2LoxP/LoxP; Isl1+/Cre vs Isl1+/Cre::Meis2LoxP/LoxP, and WT vs Isl1+/Cre) datasets using DAVID and the full RNAseq gene list as background. Graphs show the comparison of the fold enrichment and the -log10(p value) of selected significant (p<0.05) GO or KEGG_PATHWAY terms associated to synapse and neuron projections whatever the number of genes. Blue dotted line indicates a p-value of 0.05. Note that following DAVID analysis GO terms associated to synapse and neuron projections were overrepresented in the WT vs Isl1+/Cre::Meis2LoxP/LoxP and the Isl1+/Cre vs Isl1+/Cre::Meis2LoxP/LoxP datasets compared to the WT vs Isl1+/Cre dataset. (C) Heat maps showing the DEGs related to the GO terms synapse, neuron projection including dendrite, and protocadherin. (D) Representative images showing a strong overall deficit of Nefh+ (red) sensory projections innervating the dermal papillae in the hairy and the foot pads in the glabrous skin of P0 Wnt1Cre::Meis2LoxP/LoxP neonates forepaw compared to WT littermates. Dashed lines delineate the hair follicle and the epidermis. Scale bar = 50 µm.
-
Figure 3—source data 1
Table showing the results of the bulk RNAseq analysis.
- https://cdn.elifesciences.org/articles/89287/elife-89287-fig3-data1-v1.xlsx
-
Figure 3—source data 2
Table showing the results of the GO terms analysis performed with AVID.
- https://cdn.elifesciences.org/articles/89287/elife-89287-fig3-data2-v1.xlsx
Figure 3—figure supplement 1
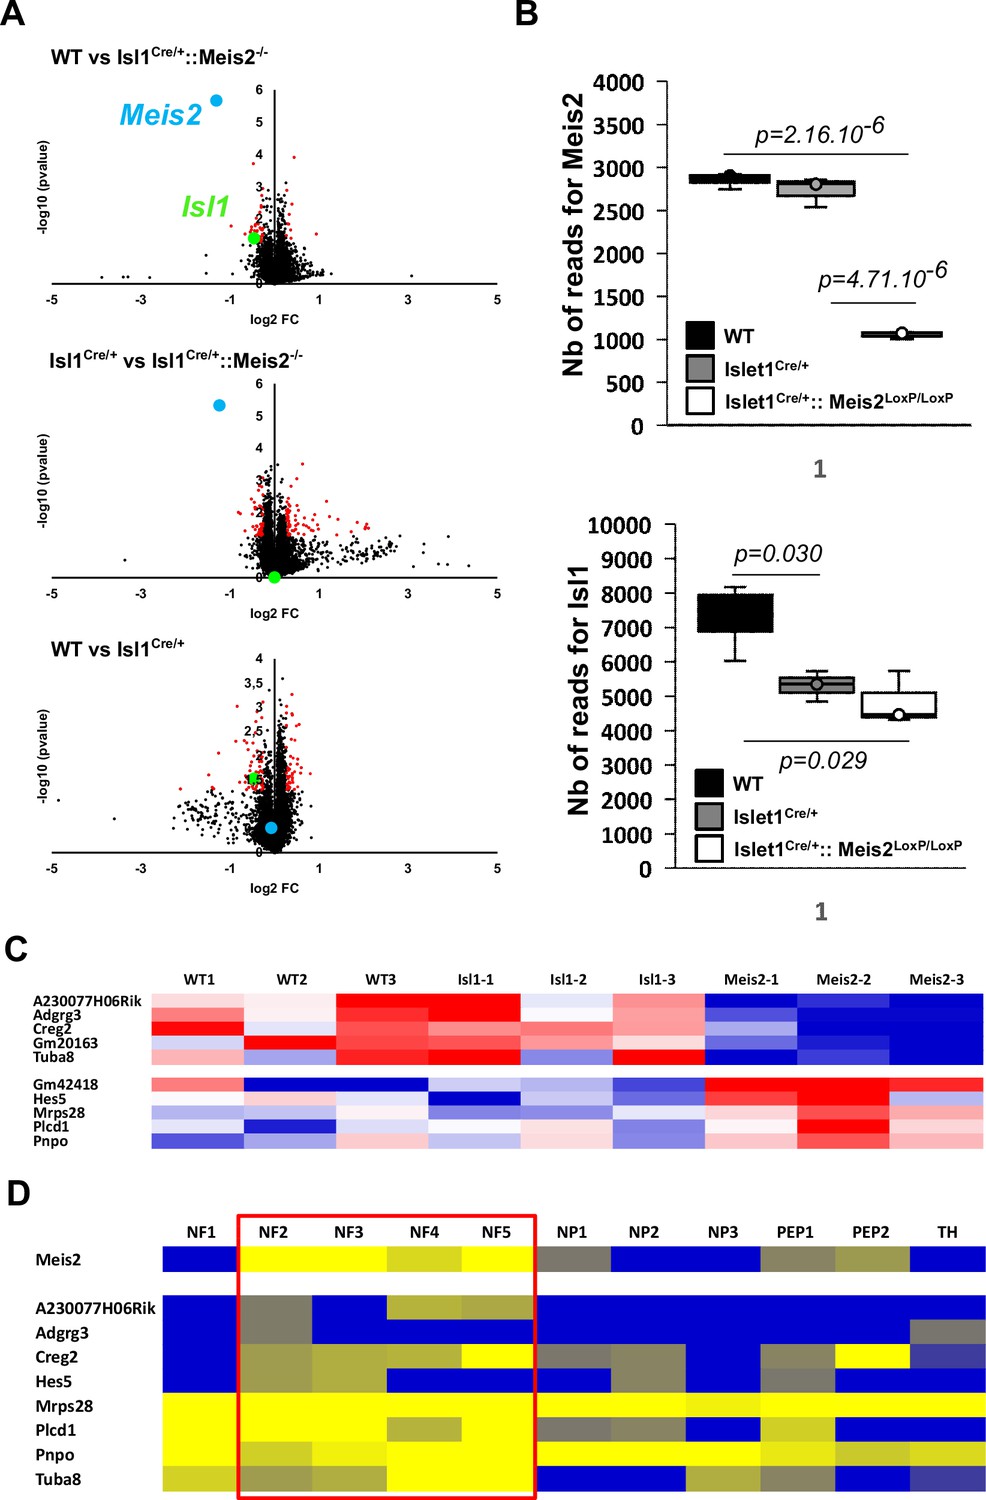
Best dysregulated genes in Meis2 mutant adult DRG.
(A) Volcano plots showing differentially expressed genes (DEGs) in red including genes with of minimal fold change of 20% (n = 3; p<0.05). Volcano plots show the comparison between the three genotypes (WT, Isl1Cre/+ and Isl1Cre/+::Meis2LoxP/LoxP). Plots reporting Meis2 and Isl1 mRNA expression are in blue and green, respectively. (B) Graphs showing the individual number of reads for Meis2 and Isl1 genes in each genotype. n = 3; p-values are indicated. (C) Heat map showing the 10 best DEGs (significantly and differentially expressed in both WT vs Isl1Cre/+::Meis2LoxP/LoxP and Isl1Cre/+ vs Isl1Cre/+::Meis2LoxP/LoxP). (D) Expression of the 10 best DEGs in the different adult dorsal root ganglia (DRG) sensory neuron subtypes according to Usoskin et al., 2015. Red frames indicate Meis2-expressing subpopulations of low-threshold mechanoreceptor (LTMR) and proprioceptive neurons. Note that all DEG are expressed in Meis2-expressing neurons.
Figure 3—figure supplement 2
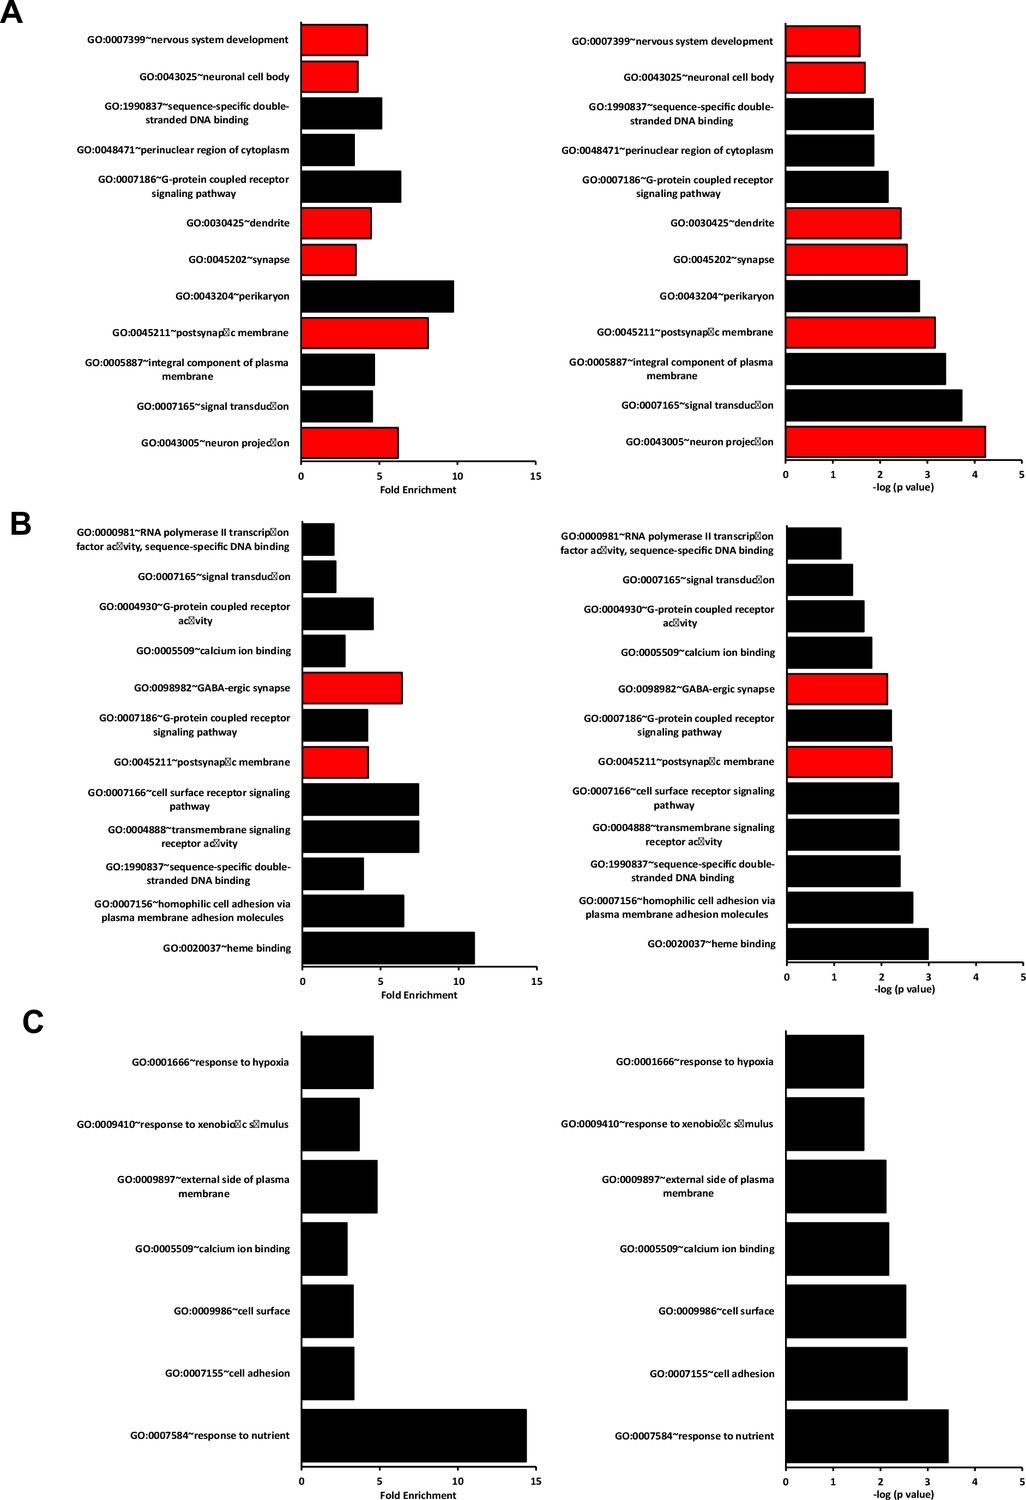
Best DAVID GO terms for each dataset in the RNAseq paired analysis.
Graphs show the fold enrichment and –log10(p value) of the first 12 best GO terms sorted according to their p-value and fold enrichment for (A) WT vs Isl1+/Cre::Meis2LoxP/LoxP, (B) Isl1+/Cre vs Isl1+/Cre::Meis2LoxP/LoxP, and (C) WT vs Isl1+/Cre. Only terms associated with more than five genes were considered. Terms associated with more than 15 genes were excluded as they referred to very generic keywords. Red bars indicate terms associated to the nervous system. Note that none of the best GO terms in the WT vs Isl1+/Cre dataset associated to the nervous system, and that most of the fold enrichment and p-values are lower in the WT vs Isl1+/Cre dataset compared to the other datasets.
Figure 3—figure supplement 3
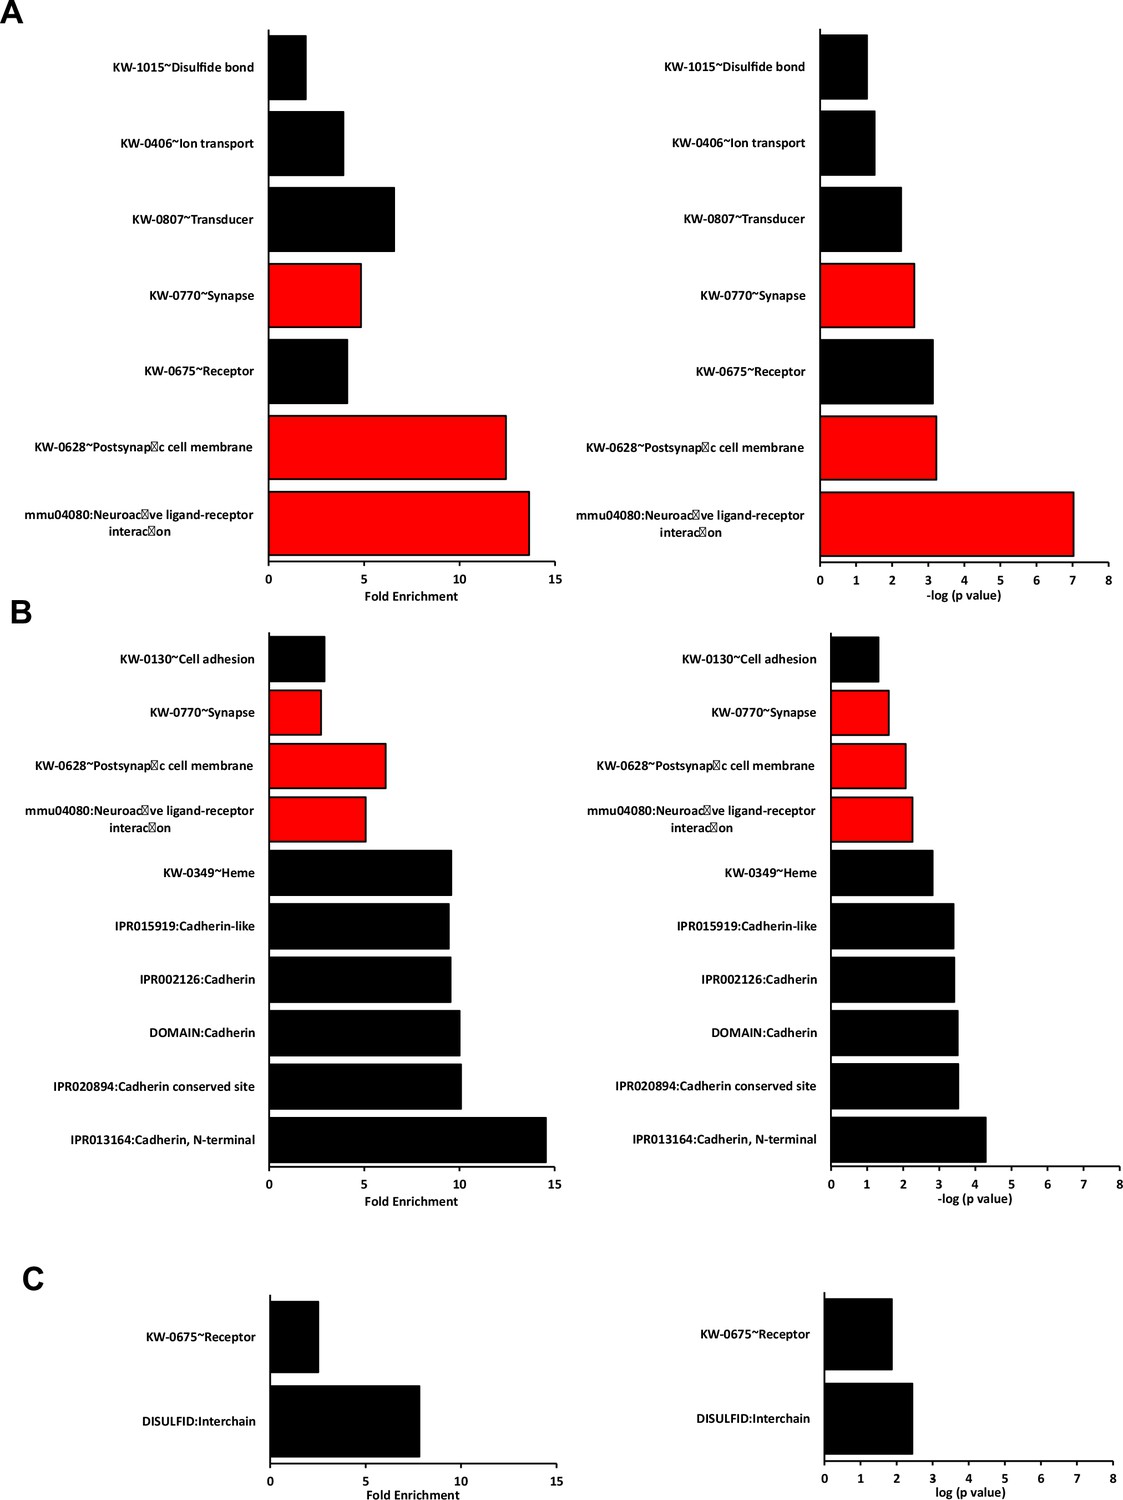
Best DAVID terms other than GO for each dataset in the RNAseq paired analysis.
Graphs show the fold enrichment and –log10(p value) of all the terms other than GO sorted according to their p-value and fold enrichment for (A) WT vs Isl1+/Cre::Meis2LoxP/LoxP, (B) Isl1+/Cre vs Isl1+/Cre::Meis2LoxP/LoxP, and (C) WT vs Isl1+/Cre. Only terms associated with more than five genes were considered. Terms associated with more than 15 genes were excluded as they referred to very generic keywords. Red bars indicate terms associated to the nervous system. Note that none of these terms in the WT vs Isl1+/Cre dataset associated to the nervous system, and that most of the fold enrichment and p-values are lower in the WT vs Isl1+/Cre dataset compared to the two other datasets.
Figure 3—figure supplement 4
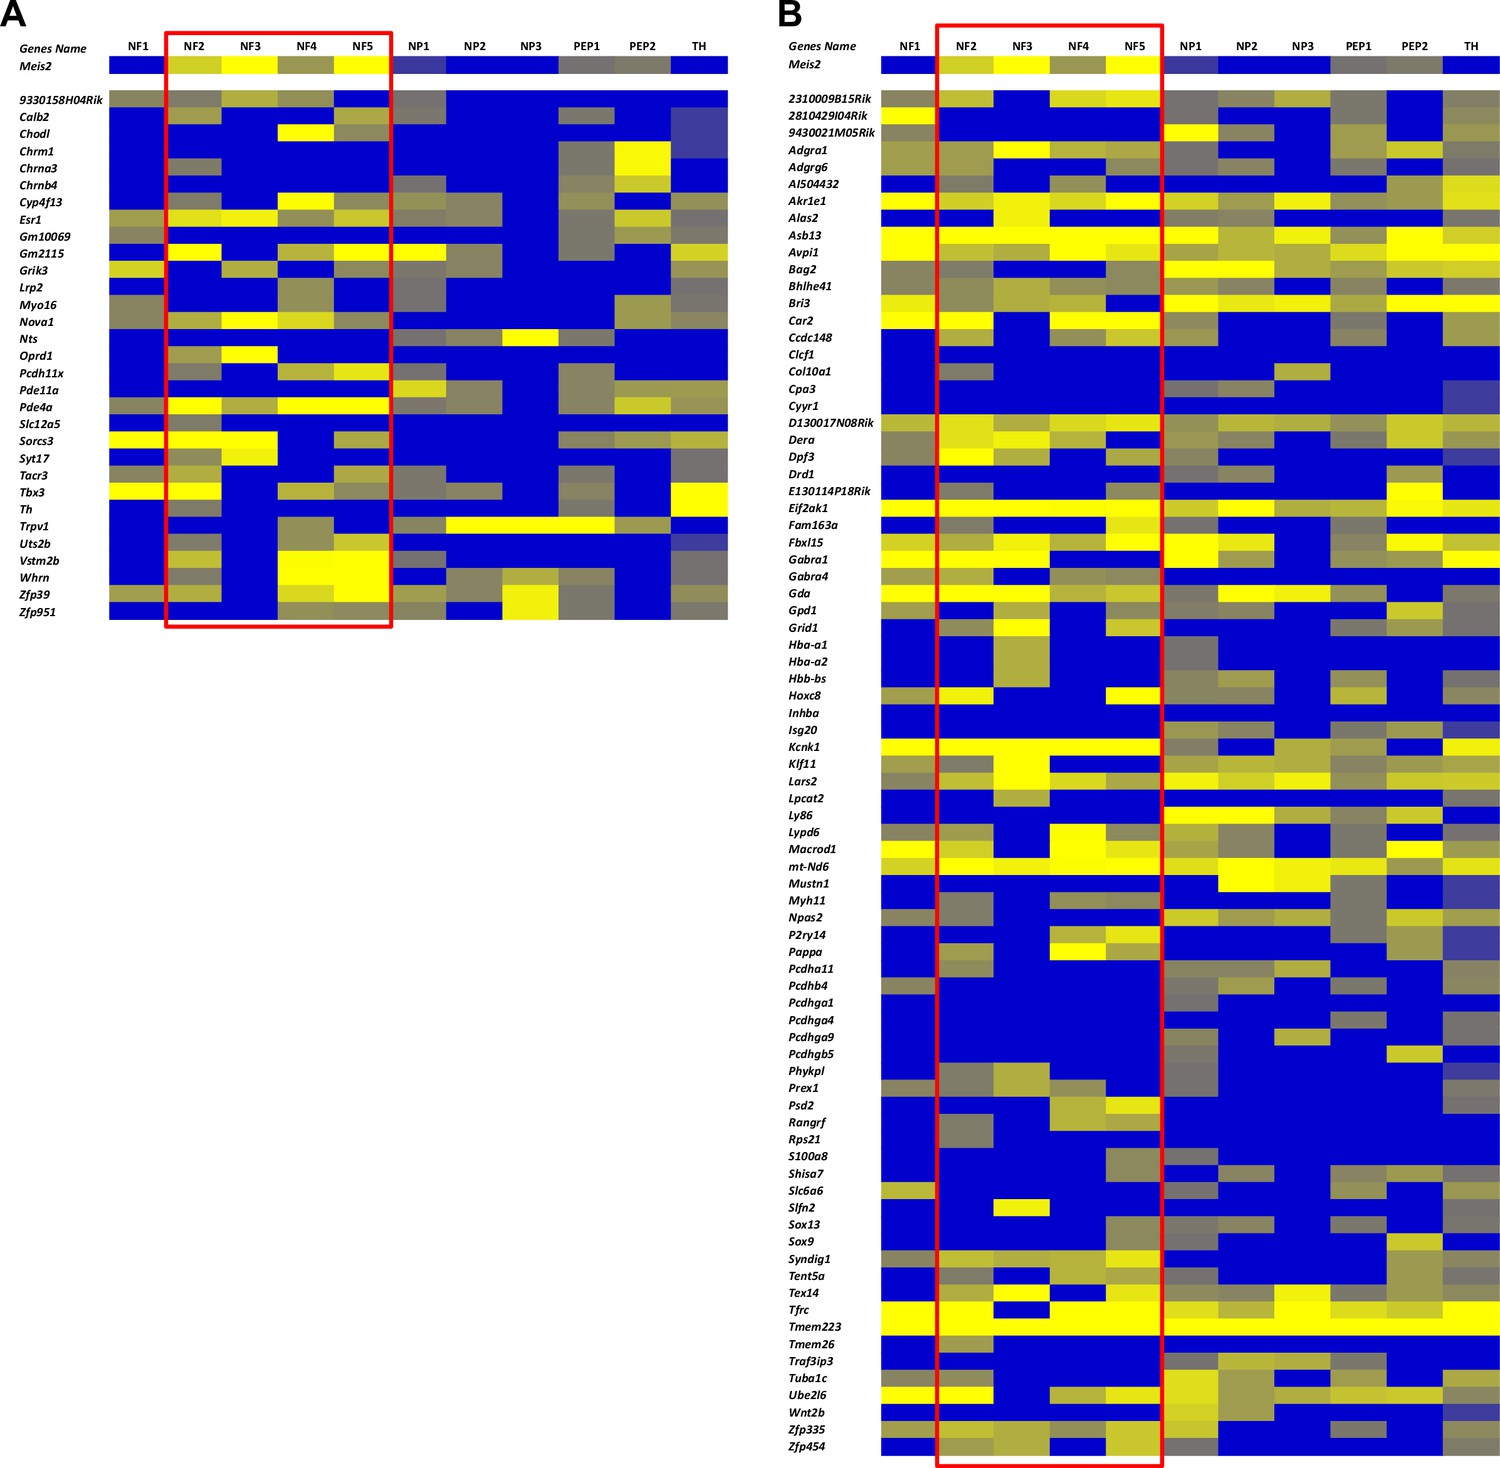
Comparison of differentially expressed genes (DEGs) in Meis2 mutant embryonic dorsal root ganglia (DRG) neurons with their expression in the different adult DRG sensory neuron subtypes.
(A) Heat map showing the expression of DEGs of the WT vs Isl1+/Cre::Meis2LoxP/LoxP (A) and the Isl1+/Cre vs Isl1+/Cre::Meis2LoxP/LoxP (B) datasets in the different adult DRG sensory neuron subtypes according to Usoskin et al., 2015. Red frames indicate Meis2-expressing subpopulations.
Figure 4
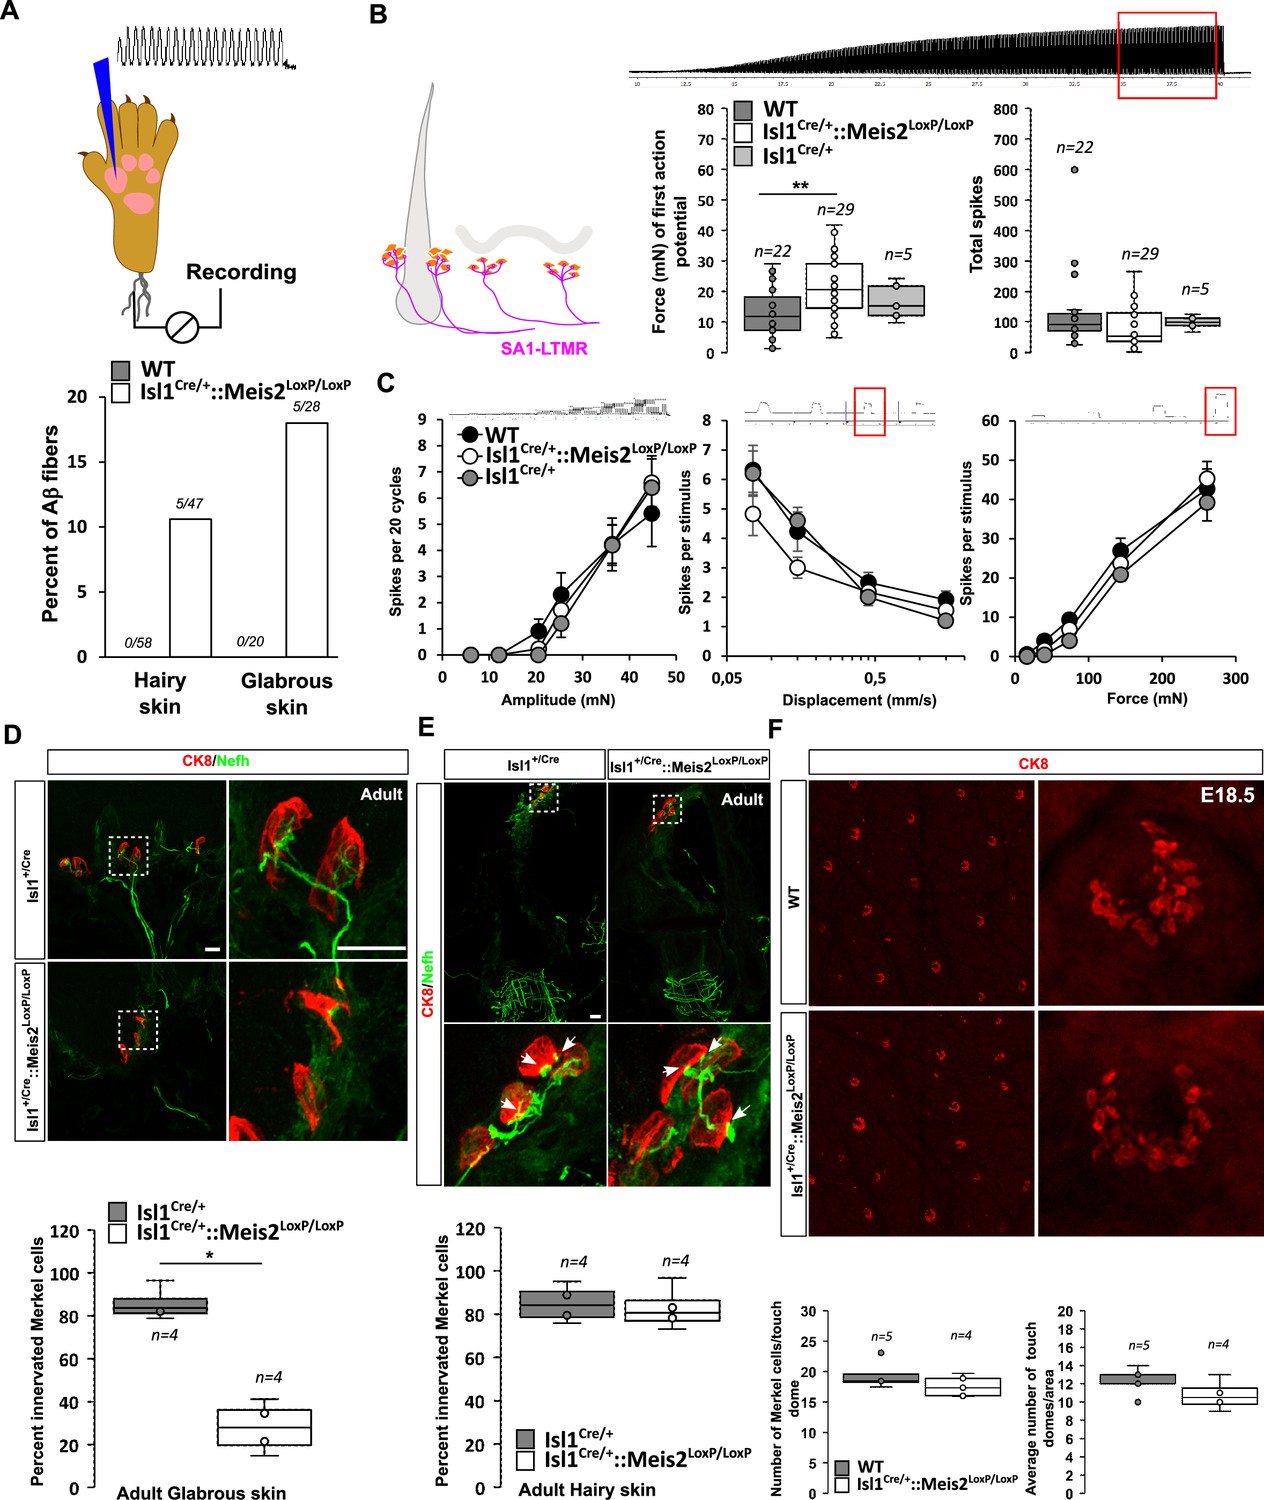
Meis2 gene inactivation compromised Merkel cell innervation in the glabrous skin and increased slowly adapting mechanoreceptor (SAM) vibration threshold.
(A) Graph showing the percentage of tap units among all recorded Aβ fibers in the nerve skin preparation both in the hairy and glabrous skins. The number of tap units over the number of recorded fibers is indicated. Note that Tap units are only present in both the hairy and glabrous skin of adult Isl1+/Cre::Meis2LoxP/LoxP mice but not in WT littermates. (B) In the hairy and glabrous skins, SAMs in Isl1+/Cre::Meis2LoxP/LoxP mice (n = 22 from six mice) had significantly increased vibration threshold compared to WT mice (n = 29 from six mice), but normal firing activity to a 25 Hz vibration. Trace shows the stimulation applied to the skin, and red squares indicate the time frame during which the number of spikes was calculated. (C) SAM responses to a ramp of 50 Hz vibration with increasing amplitude are similar in WT, Isl1+/Cre, and Isl1+/Cre::Meis2LoxP/LoxP mice. SAM responses to ramp stimuli and their static force responses were also identical in the different genotypes. Fibers from WT and Isl1+/Cre mice (n = 5) displayed similar responses. * p≤0.05; ** p≤0.005. Traces show the applied stimulus and red squares the time frame during which the parameters below were measured. (D) Confocal images of Nefh+ innervation (green) of CK8+ Merkel cells (red) in the forepaw glabrous skin of Isl1Cre/+and Isl1Cre/+::Meis2LoxP/LoxP adult mice. Dotted white squares indicate the close-up of CK8+ Merkel cells. Note the lack of Nefh+ fibers innervating Merkel cells in mutant mice. White arrows point at contact between NF200+ fibers and CK8+ Merkel cells. Scale bar = 10 µm. The box plot indicates the percentage of Merkel cells in contact with Nefh+ fibers. n = 4. * p≤0.05 in Mann–Whitney test. (E) Confocal images of Nefh+ innervation (green) and CK8+ Merkel cells (red) of guard hairs in the hairy back skin of Isl1Cre/+and Isl1Cre/+::Meis2LoxP/LoxP adult mice. Dotted white squares indicate the close-up of CK8+ Merkel cells with apparently normal Nefh+ innervation. White arrows point at contacts between Nefh+ fibers and CK8+ Merkel cells. Scale bar = 10 µm. The box plot indicates the percentage of Merkel cells contacted by Nefh+ fibers. n = 4. (F) Representative images of whole-mount staining for CK8 in the hairy back skin of WT and Isl1Cre/+::Meis2LoxP/LoxP E18.5 embryos showing no difference in the number of touch dome between genotypes. Box plots show the number of touch domes per surface area and the number of Merkel cells per touch dome. No significant differences were found between both genotypes in Mann–Whitney test. n = 5 (WT) and 4 (Isl1+/Cre::Meis2LoxP/LoxP).
Figure 5 with 3 supplements
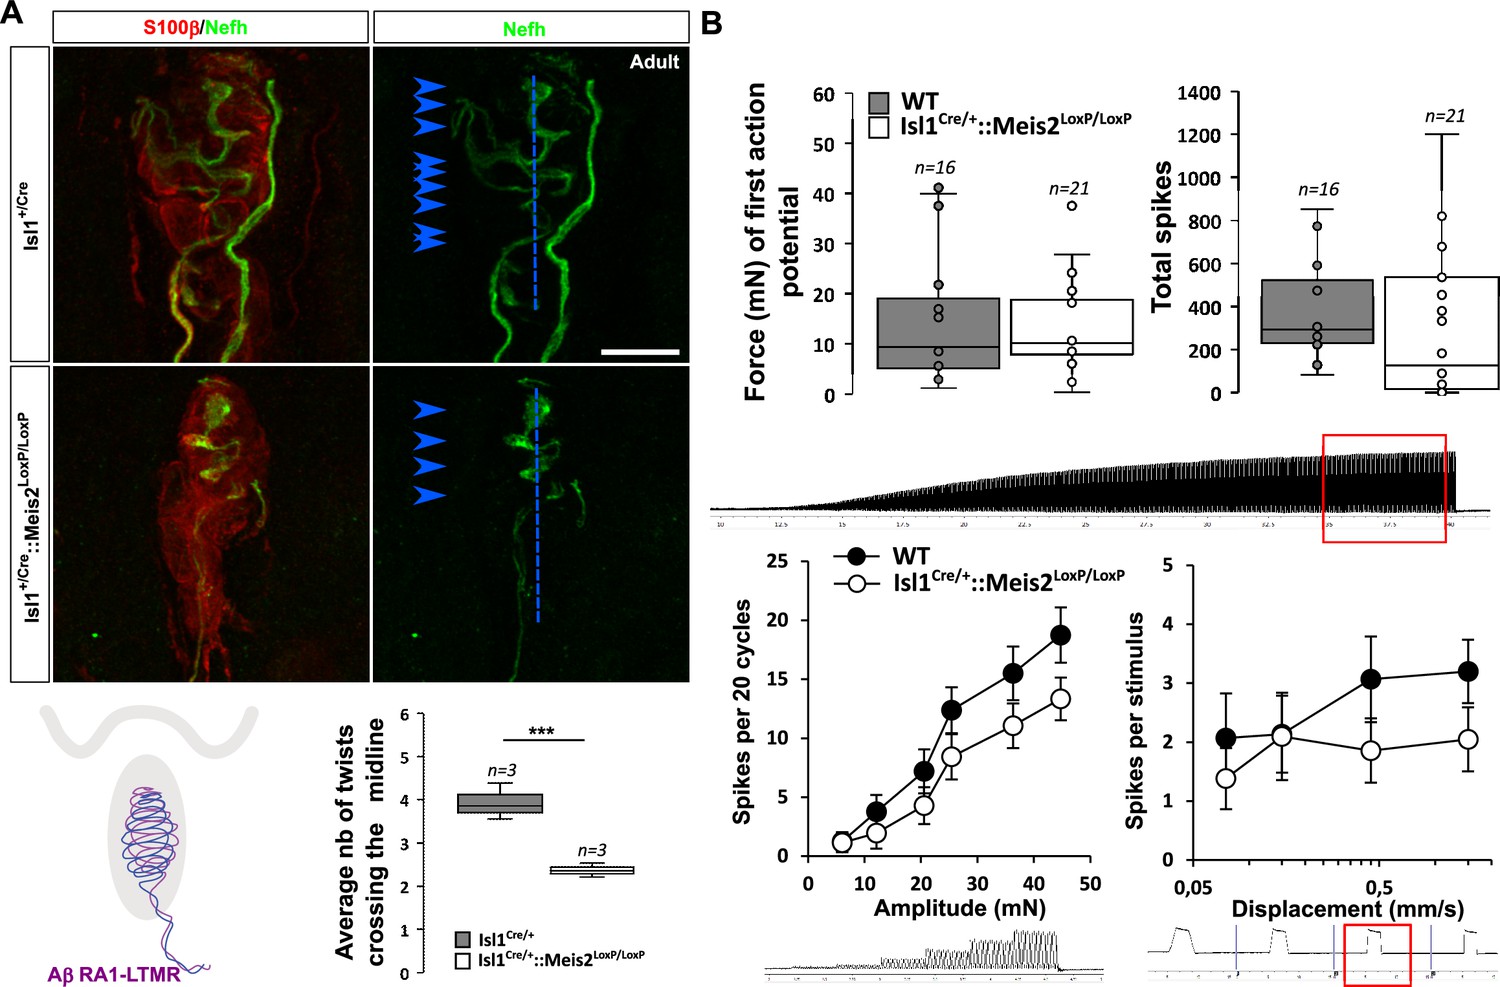
Meis2 gene inactivation affects Meissner corpuscles morphology.
(A) Representative images showing S100β+ Meissner corpuscles (red) and their innervation by Nefh+ fibers (green) in the glabrous skin of WT and Isl1+/Cre::Meis2LoxP/LoxP adult mice. Scale bar = 10 µm. The box plot shows the average number of times Nefh+ fibers cross the midline of the Meissner corpuscles. Dashed blue lines indicate the Meissner corpuscle midline. Blue arrowheads indicate sites where Nefh+ fibers cross this midline. (B) RAMs of the glabrous skin exhibited similar vibration threshold and firing activity to a 25 Hz vibration in WT (n = 16 from four mice) and Isl1+/Cre::Meis2LoxP/LoxP mice (n = 21 from six mice). Glabrous RAMs showed a nonsignificant decrease in firing activity to a ramp of 50 Hz vibration with increasing amplitude in Isl1+/Cre::Meis2LoxP/LoxP compared to WT littermates, but their response to ramp stimuli was similar in both genotypes. Traces indicate the type of stimulation and red squares the time frame during which the number of spikes was calculated. *** p≤0.001; Student’s t-test.
Figure 5—figure supplement 1
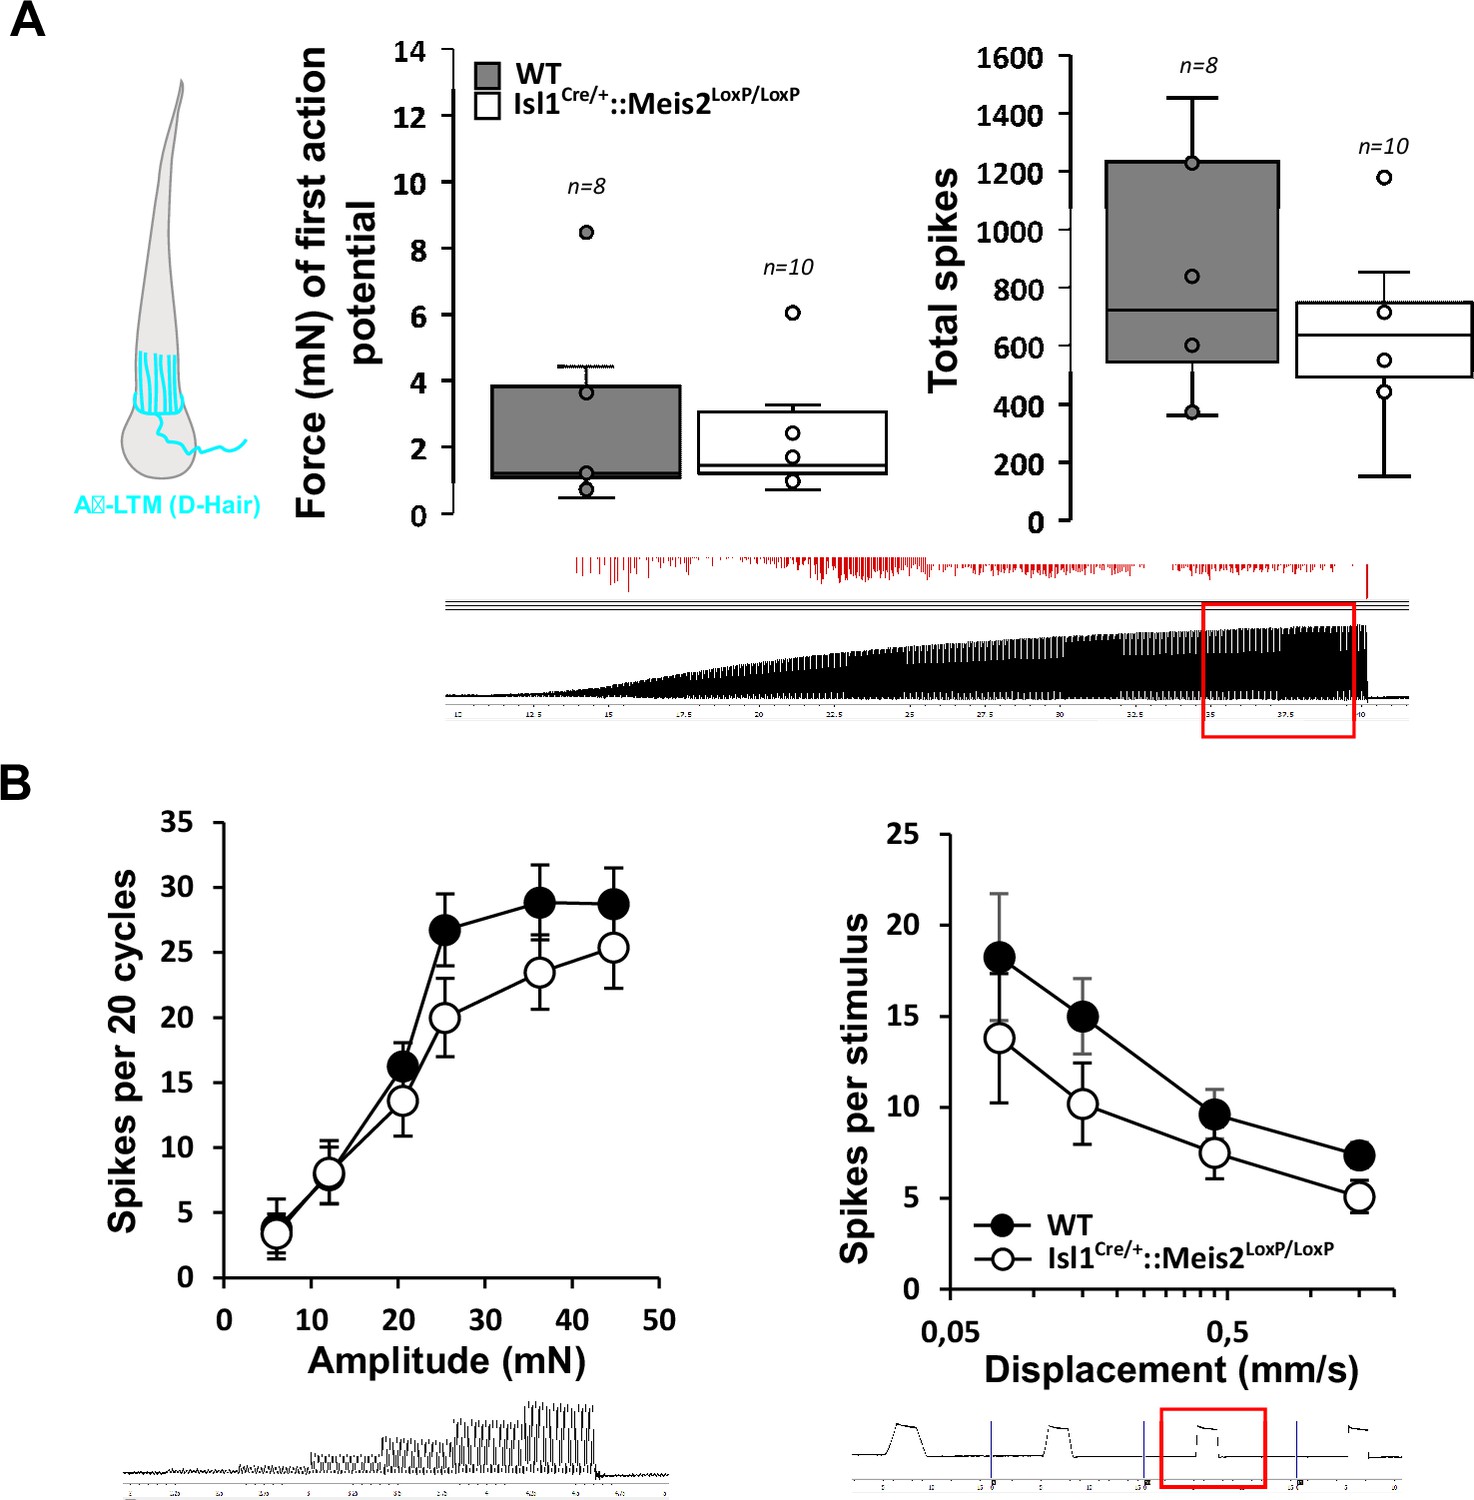
Normal electrophysiological responses of D-hair mechanoreceptors following Meis2 gene inactivation.
(A) D-hair mechanoreceptors of the hairy skin exhibited similar vibration threshold and firing activity to a 25 Hz vibration in WT (n = 8 from three mice) and Isl1+/Cre::Meis2LoxP/LoxP mice (n = 10 from three mice). (B) D-hair mechanoreceptors showed similar responses to a ramp of 50 Hz vibration with increasing amplitude and to a ramp stimuli in WT and Isl1+/Cre::Meis2LoxP/LoxP animals. Trace shows the type of stimulation and red square indicates the time frame during which the number of spikes was calculated.
Figure 5—video 1
Meissner corpuscle in WT.
3D visualization of Meissner corpuscles in adult WT glabrous skin visualized by IF against Nefh and S100β.
Figure 5—video 2
Meissner corpuscles in Isl1+/Cre::Meis2LoxP/LoxP.
3D visualization of Meissner corpuscles in adult Isl1+/Cre::Meis2LoxP/LoxP glabrous skin visualized by IF against Nefh and S100β.
Figure 6
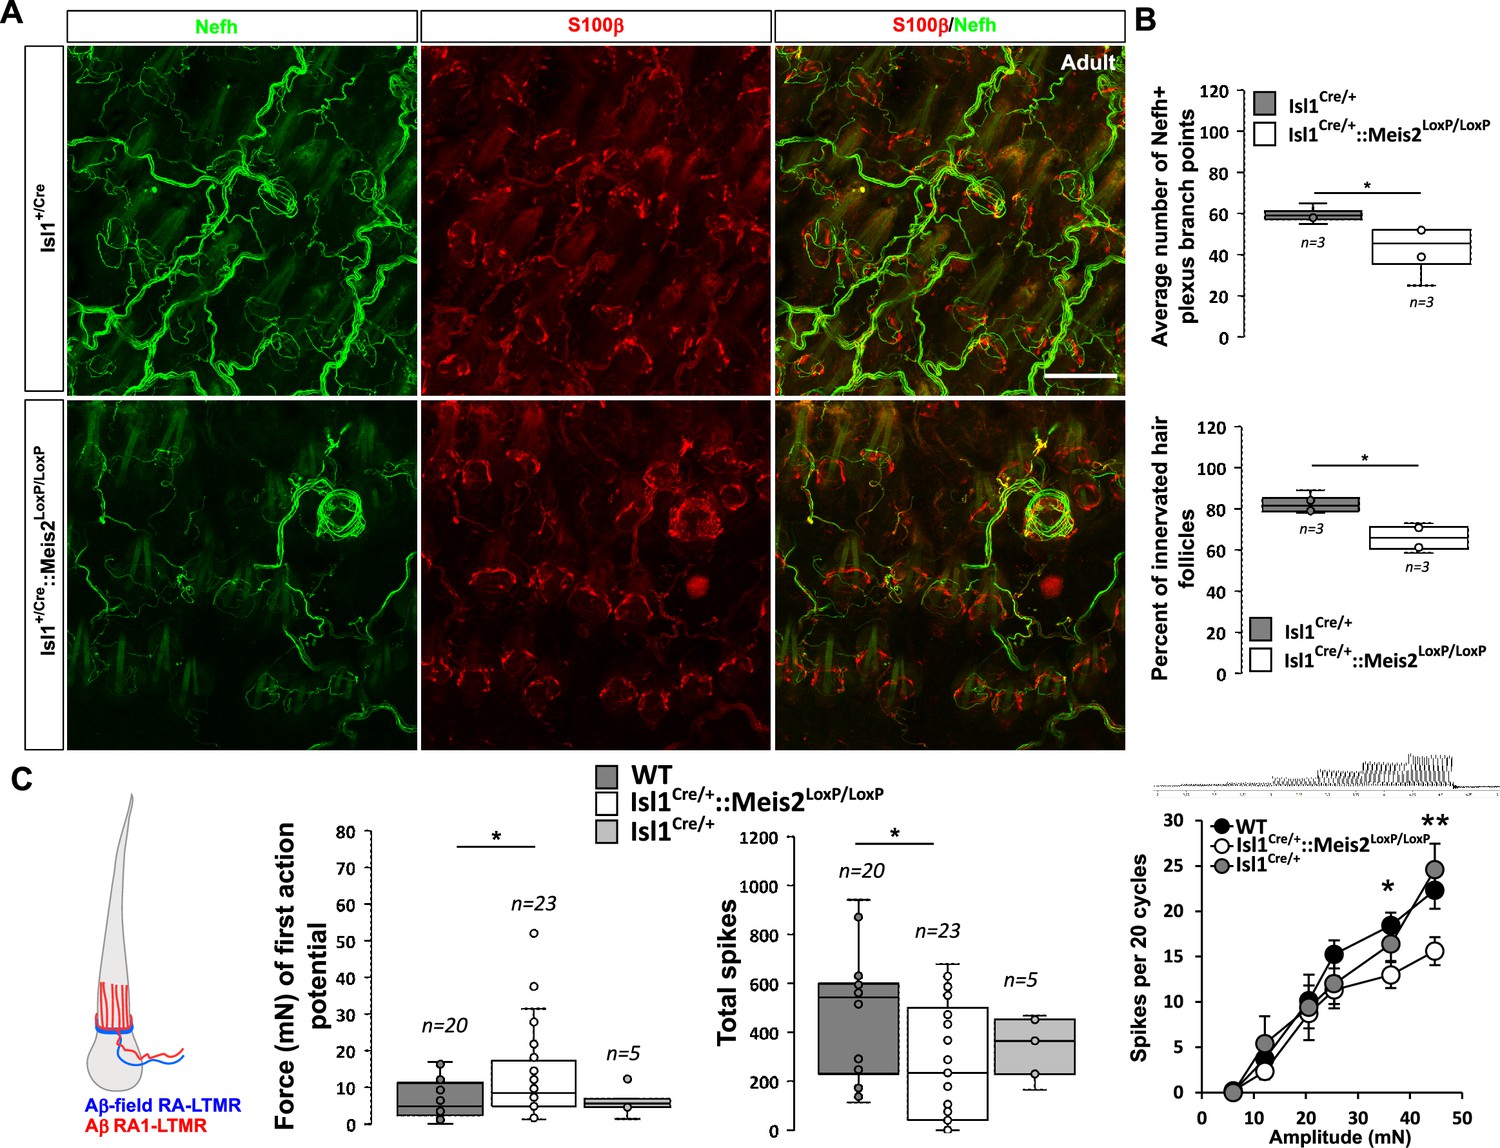
Meis2 gene inactivation affects hair follicle innervation and RAM fibers electrophysiological responses in the hairy skin.
(A) Representative images of whole-mount immunostaining for Nefh+ sensory projections (green) in the hairy skin of adult WT and Isl1+/Cre::Meis2LoxP/LoxP embryos counterstained with S100β (red) to highlight terminal Schwann cells decorating the periphery of hair follicles. Scale bar = 100 µm. (B) Box plots showing the quantification for the number of branch points in the innervation network and the number of innervated hair follicles. n = 3; *p≤0.05. (C) RAMs in the hairy skin of Isl1Cre::Meis2LoxP/LoxP mice (n = 24 from three mice) exhibited significantly increased vibration threshold and reduced firing activity to a 25 Hz vibration compared to WT mice (n = 20 from three mice). RAMs in the hairy skin of Isl1+/Cre::Meis2LoxP/LoxP mice also showed a reduced firing activity in response to a ramp of 50 Hz vibration with increasing amplitude compared to WT and Isl1+/Cre animals. Fibers recorded from Isl1+/Cre mice (n = 5) showed similar responses than those recorded from WT mice. * p≤0.05; **p≤0.005.
Additional files
Download links
A two-part list of links to download the article, or parts of the article, in various formats.
Downloads (link to download the article as PDF)
Open citations (links to open the citations from this article in various online reference manager services)
Cite this article (links to download the citations from this article in formats compatible with various reference manager tools)
Touch receptor end-organ innervation and function require sensory neuron expression of the transcription factor Meis2
eLife 12:RP89287.
https://doi.org/10.7554/eLife.89287.3


