DePARylation is critical for S phase progression and cell survival
- Department of Experimental Radiation Oncology, The University of Texas MD Anderson Cancer Center, United States
- Institute for Personalized Cancer Therapy, The University of Texas MD Anderson Cancer Center, United States
Figures
Figure 1 with 1 supplement
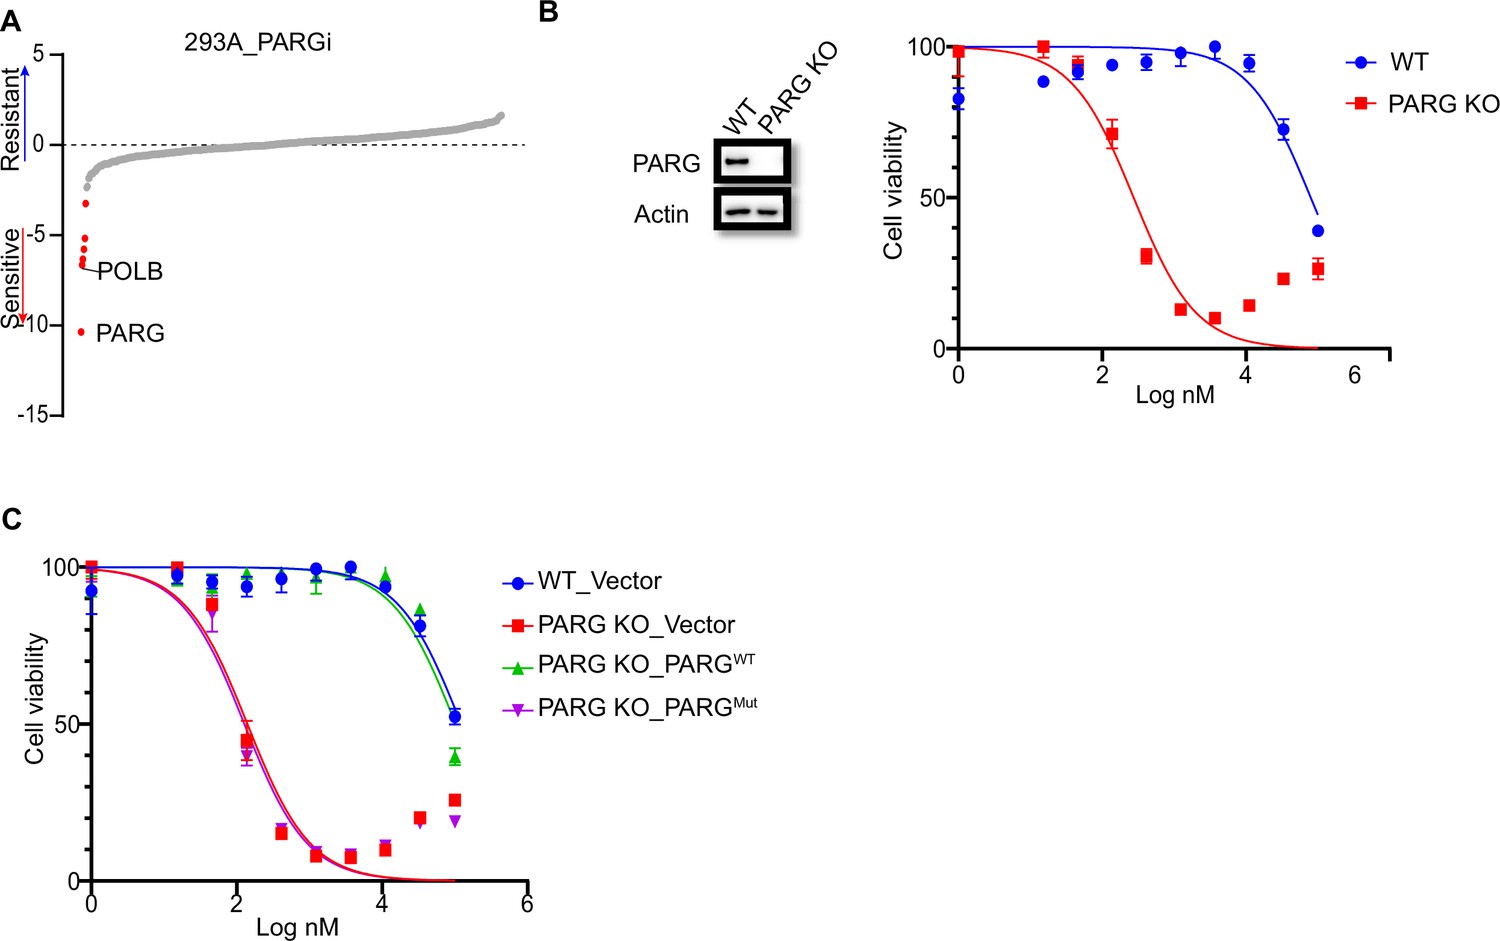
PARG loss sensitizes cells to PARGi.
(a) Ranking of co-essential genes with PARGi treatment on the basis of a DrugZ analysis of the results of CRISPR/Cas9 screening with a DDR library in HEK293A cells. The NormZ score was used to determine a possible synthetic lethality gene under PARGi treatment. Drug-sensitive genes were marked in red; drug-resistant genes were marked in blue on the basis of the false discovery rate (FDR, 0.05 cut-off). (b) HEK293A WT cells and HEK293A PARG KO cells were treated with different doses of PARGi for 72 hr. Cell viability was determined by the CellTiter-Glo assay. (c) HEK293A PARG KO cells, re-constituted with either full-length PARG or catalytic domain mutation of PARG, were treated with different doses of PARGi for 72 hr. Cell viability was determined by the CellTiter-Glo assay.
-
Figure 1—source data 1
DrugZ analysis results of CRISPR/Cas9 screening with DDR library in PARGi treated HEK293A cells.
- https://cdn.elifesciences.org/articles/89303/elife-89303-fig1-data1-v1.xlsx
-
Figure 1—source data 2
Original file for the western blot analysis in Figure 1B and Figure 1—figure supplement 1D.
- https://cdn.elifesciences.org/articles/89303/elife-89303-fig1-data2-v1.zip
-
Figure 1—source data 3
PDF containing Figure 1C, Figure 1—figure supplement 1D and original scans of the relevant western blot analysis (anti-actin and anti-PARG) with highlighted bands and sample labels.
- https://cdn.elifesciences.org/articles/89303/elife-89303-fig1-data3-v1.zip
Figure 1—figure supplement 1
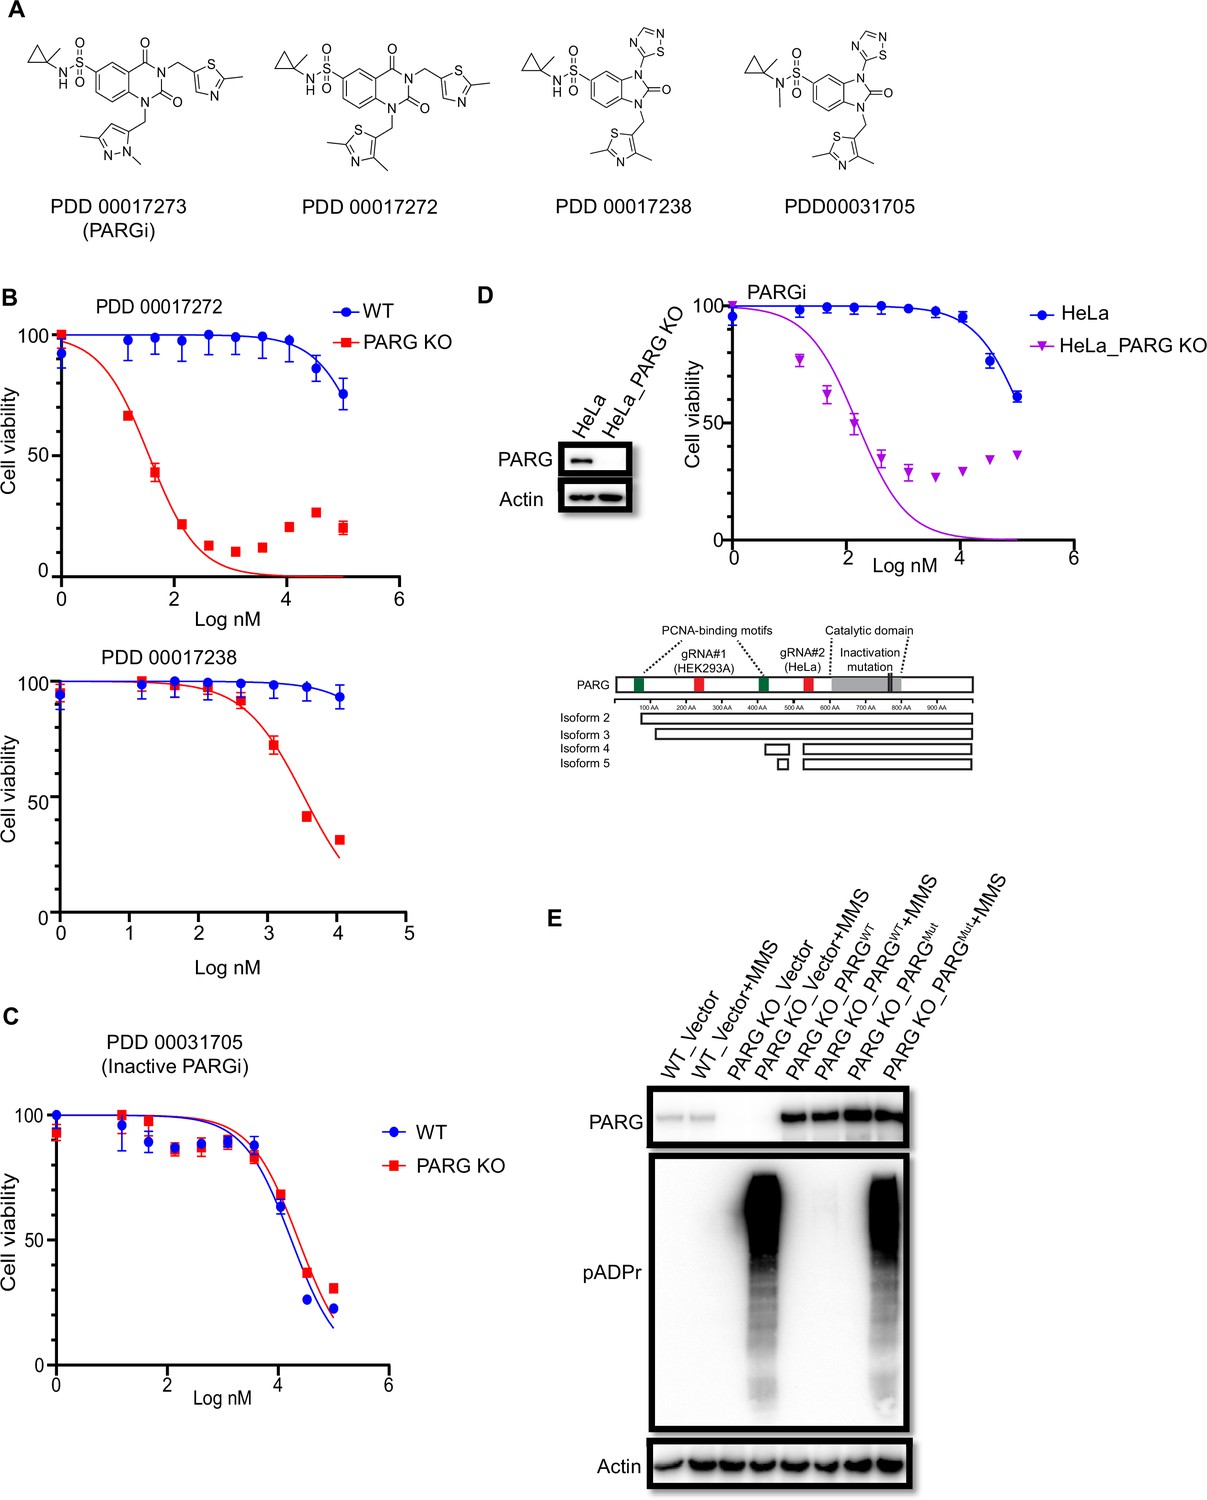
PARG KO cells are sensitive to active PARG inhibitors.
(a) Chemical structures of active and inactive PARG inhibitors (PDD 00031705). (b) Another two PARG inhibitors (PDD00017272 and PDD 00017238) were used to determine cell viability in HEK293A WT and PARG KO cells. (c) HEK293A WT cells and PARG KO cells were treated with different doses of inactive PARGi (PDD 00031705) for 72 hr. Cell viability was determined by the CellTiter-Glo assay. (d) Top: HeLa WT cells and PARG KO cells were treated with different doses of PARGi for 72 hr. Cell viability was determined by the CellTiter-Glo assay. Bottom: a schematic overview of 5 PARG isoforms based on Uniprot database annotation. The gRNAs targeting regions, the C-terminal catalytic domain, the catalytic inactive mutation, and the PCNA-interaction motif were indicated. The gRNAs used in HEK293A and HeLa cells were indicated. gRNA#1 used in HEK293A cells targets full-length PARG (i.e. isoform 1) and also isoforms 2 and 3, which are considered catalytically active isoforms according to the Uniport databse. gRNA#2 used in HeLa cells targets all five isoforms, but isoforms 4 and 5 are considered catalytically inactive according to the Uniport database. (e) HEK293A WT, PARG KO, and PARG KO cells reconstituted with WT PARG or catalytic inactivation PARG cells were treated with 0.01% MMS for 30 min. Blotting with anti-PARG and anti-pADPr antibodies was conducted to confirm the expression of PARG and PARG activity.
-
Figure 1—figure supplement 1—source data 1
Original file for the western blot analysis in Figure 1—figure supplement 1E.
- https://cdn.elifesciences.org/articles/89303/elife-89303-fig1-figsupp1-data1-v1.zip
-
Figure 1—figure supplement 1—source data 2
PDF containing Figure 1—figure supplement 1E and original scans of the relevant western blot analysis (anti-actin, anti-pADPr and anti-PARG) with highlighted bands and sample labels.
- https://cdn.elifesciences.org/articles/89303/elife-89303-fig1-figsupp1-data2-v1.zip
Figure 2 with 1 supplement
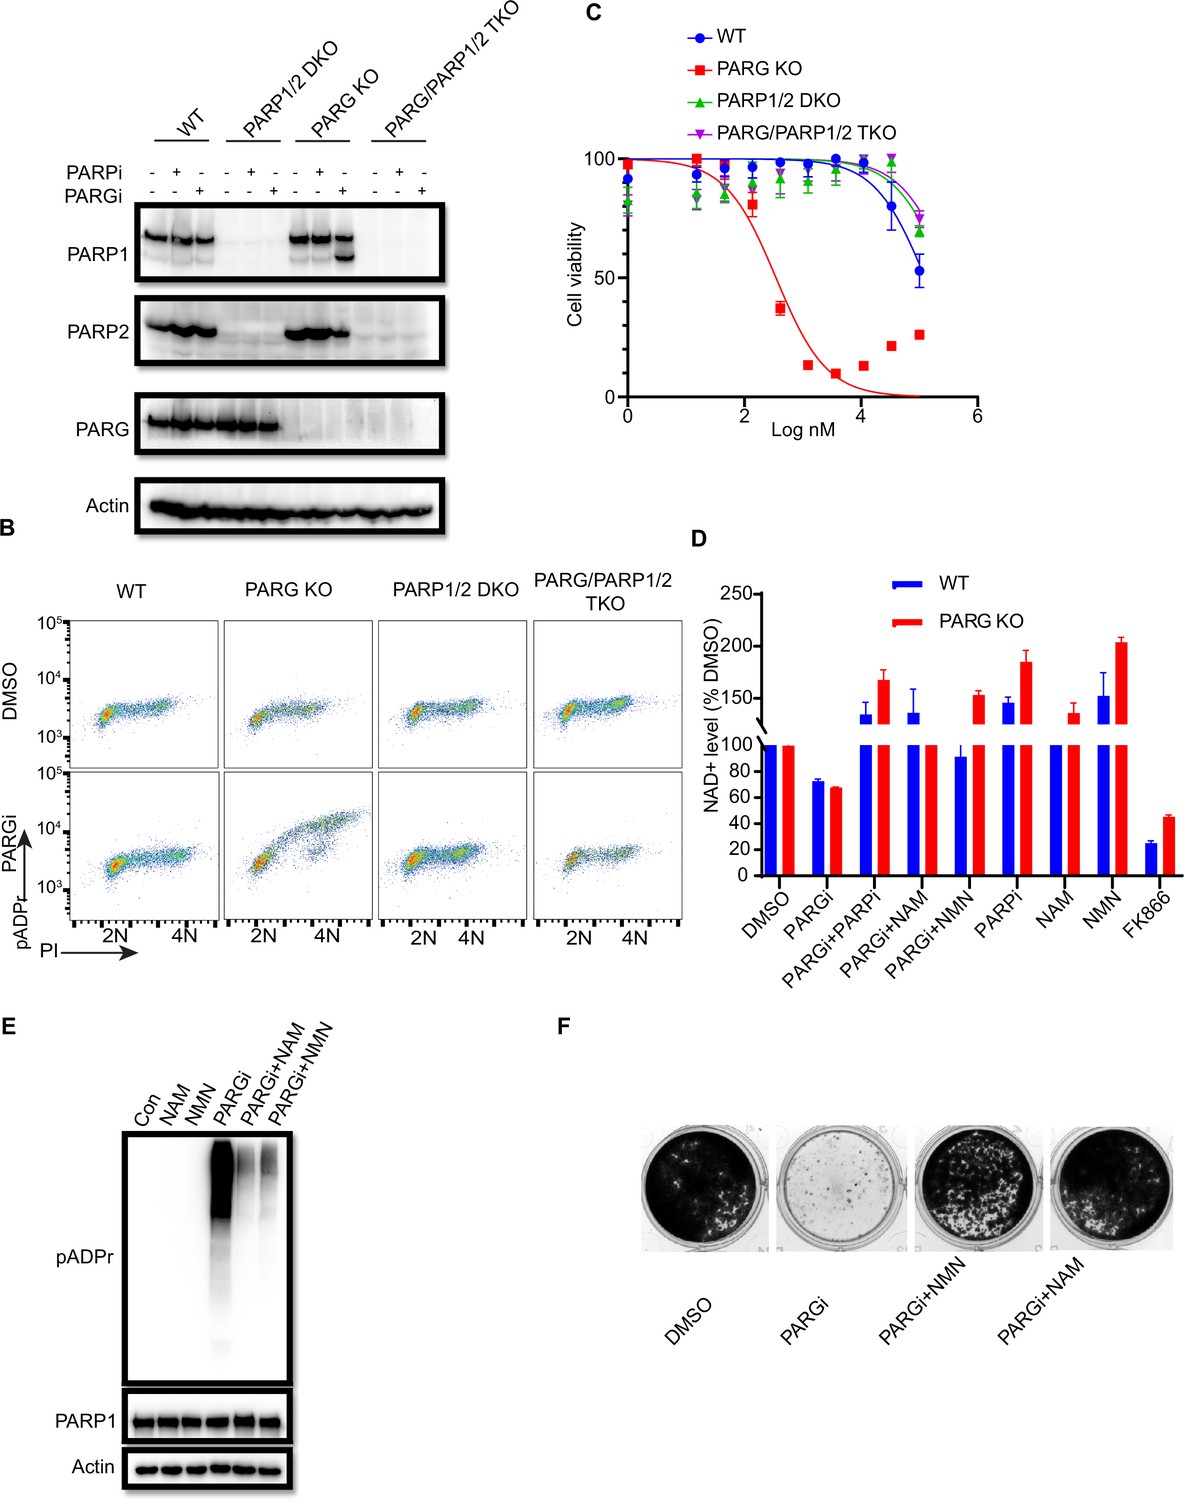
PARGi treatment induces NAD+- and PARP-dependent cell death in PARG KO cells.
(a) HEK293A WT, PARG KO, PARP1/2 DKO, and PARG/PARP1/2 TKO cells were treated with PARGi (1 µM) for 72 hr. The total cell lysates were immunoblotted with the indicated antibodies. (b) HEK293A WT, PARG KO, PARP1/2 DKO, and PARG/PARP1/2 TKO cells were treated with DMSO or 10 µM PARGi for 4 hr and then fixed and stained with anti-pADPr antibody and propidium iodide (PI). (c) HEK293A WT, PARG KO, PARP1/2 DKO clls, and PARG/PARP1/2 TKO cells were treated with different doses of PARGi for 72 hr. Cell viability was determined by the CellTiter-Glo assay. (d) Relative NAD +level in HEK293A WT and PARG KO cells with the indicated treatment for 48 hr. PARGi, 10 µM; PARPi, 10 µM; NAM, 100 µM; NMN, 1 mM; FK866, 10 nM. (e) PARG KO cells were treated with PARGi (10 µM) or PARGi and NAM (100 µM) or NMN (1 mM) for 48 hr. The total cell lysates were immunoblotted with the indicated antibodies. (f) Results of clonogenic assays conducted using HEK293A PARG KO cells treated with PARGi (500 nM) or PARGi and NAM (100 µM) or NMN (1 mM) for 7 days.
-
Figure 2—source data 1
Original file for the western blot analysis and colony formation assay in Figure 2 and Figure 2—figure supplement 1B.
- https://cdn.elifesciences.org/articles/89303/elife-89303-fig2-data1-v1.zip
-
Figure 2—source data 2
PDF containing Figure 2 and Figure 2—figure supplement 1B and original scans of the relevant western blot analysis and colony formation assay with highlighted bands and sample labels.
- https://cdn.elifesciences.org/articles/89303/elife-89303-fig2-data2-v1.zip
Figure 2—figure supplement 1

PARP-dependent pADPr and reduced NAD + may contribute to cell death induced by PARGi treatment in PARG KO cells.
(a) HEK293A WT and PARG KO cells were treated with DMSO or PARGi (10 µM) for 4 hr or 0.01% MMS for 30 min or the combination of PARGi (10 µM) for 4 hr and an additional 30 min with 0.01% MMS. The total cell lysates were immunoblotted with the indicated antibodies. (b) The total cell lysates in Figure 2a were blotted with anti-pADPr antibody. (c) Results of clonogenic assays conducted using HEK293A WT, PARG KO, PARP1/2 DKO, and PARG/PARP1/2 TKO cells treated with PARGi (1 µM) or PARPi (2 µM) or the combination of PARGi and PARPi for 7 days. (d) Relative NAD +level in HEK293A WT and PARG KO cells with the indicated treatment for different times. PARGi, 10 µM; FK866, 10 nM. (e) Results of clonogenic assays conducted using HEK293A WT and PARG KO cells with the indicated treatment for 48 hr. (f) Results of clonogenic assays were conducted using HeLa WT and PARG KO cells treated with PARGi (1 µM) or the combination of PARGi and NAM (100 µM) or NMN (1 mM) for 7 days.
-
Figure 2—figure supplement 1—source data 1
Original file for the western blot in Figure 2—figure supplement 1A.
- https://cdn.elifesciences.org/articles/89303/elife-89303-fig2-figsupp1-data1-v1.zip
-
Figure 2—figure supplement 1—source data 2
PDF containing Figure 2—figure supplement 1A and original scans of the relevant western blot analysis with highlighted bands and sample labels.
- https://cdn.elifesciences.org/articles/89303/elife-89303-fig2-figsupp1-data2-v1.zip
-
Figure 2—figure supplement 1—source data 3
Original file for the colony formation assay in Figure 2—figure supplement 1.
- https://cdn.elifesciences.org/articles/89303/elife-89303-fig2-figsupp1-data3-v1.zip
-
Figure 2—figure supplement 1—source data 4
PDF containing Figure 2—figure supplement 1 and original scans of the relevant colony formation assay with highlighted bands and sample labels.
- https://cdn.elifesciences.org/articles/89303/elife-89303-fig2-figsupp1-data4-v1.zip
Figure 3 with 1 supplement
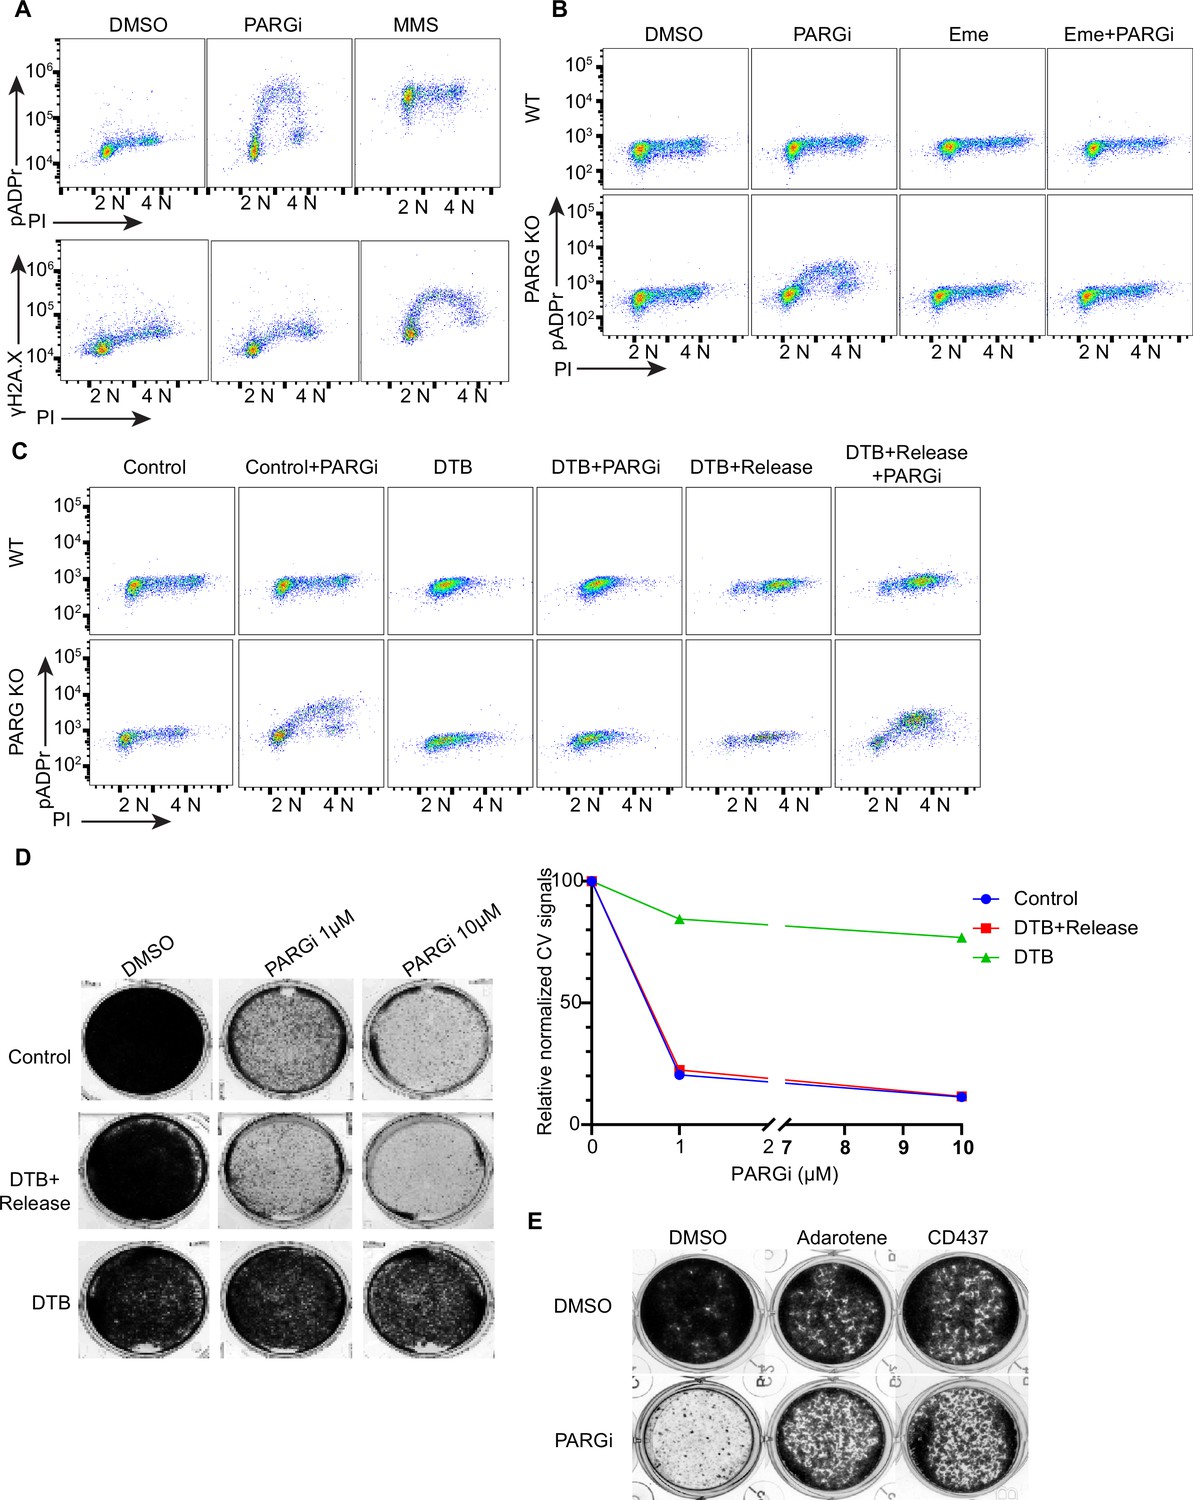
PARGi treatment induces S-phase-specific pADPr signaling in PARG KO cells.
(a) HEK293A WT and PARG KO cells were treated with DMSO or 10 µM PARGi for 4 hr or 0.01% MMS for 30 min and then fixed and stained with anti-pADPr antibody or anti-γH2A.X antibody and PI. (b) HEK293A WT and HEK293A PARG KO cells were mock-treated or pre-treated with 2 µM emetine for 90 min and then treated with PARGi for an additional 4 hr. Cells were fixed and stained with anti-pADPr antibody and PI. (c) HEK293A PARG KO cells were synchronized with double thymidine block (DTB). Cells remained with DTB or were released from DTB, treated with 10 µM PARGi for 4 hr, and then fixed and stained with anti-pADPr antibody and PI. (d) Representative images and results (left) of clonogenic assays conducted using control cells and DTB synchronized or released HEK293A PARG KO cells treated with the indicated doses of PARGi for 7 days, and quantification of crystal violet staining assay (right). (e) Results of clonogenic assays were conducted in PARG KO cells with indicated treatment for 7 days (PARGi, 1 µM; adarotene, 200 nM; CD437, 800 nM).
-
Figure 3—source data 1
Original file for the colony formation assay in Figure 3.
- https://cdn.elifesciences.org/articles/89303/elife-89303-fig3-data1-v1.zip
-
Figure 3—source data 2
PDF containing Figure 3 and original scans of the relevant colony formation assay with highlighted bands and sample labels.
- https://cdn.elifesciences.org/articles/89303/elife-89303-fig3-data2-v1.zip
Figure 3—figure supplement 1
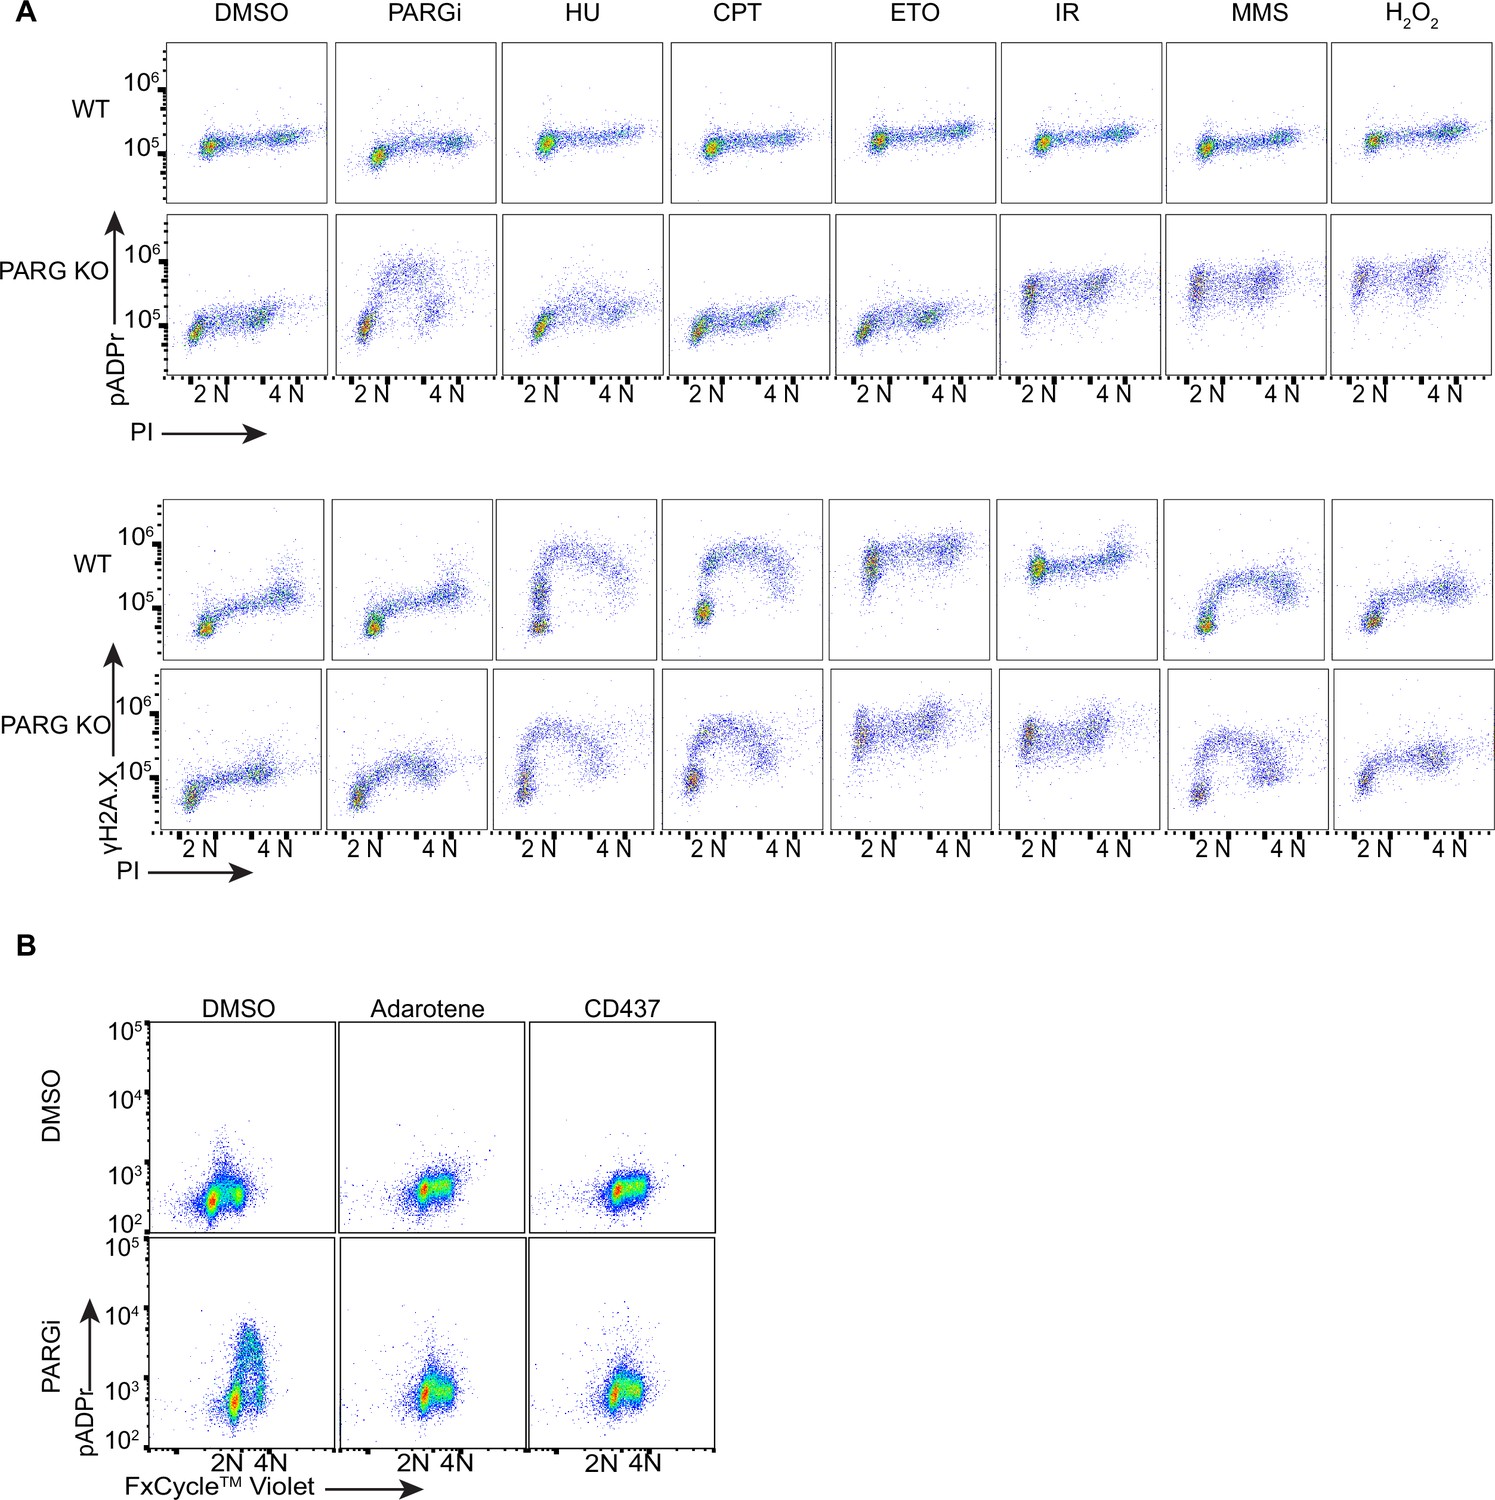
Treatment with DNA damaging agents did not induce S-phase-specific pADPr signaling.
(a) HEK293A WT and PARG KO cells were treated with DMSO, 10 µM PARGi for 4 hr, or other DNA damaging agents and then fixed and stained with PI and anti-pADPr antibody (upper panel) or anti-γH2A.X antibody (bottom panel). (b) Flow cytometry analysis of pADPr signaling in PARG KO cells which were pre-treated with DMSO, adarotene (200 nM) or CD437 (800 nM) for 16 hr, then 10 µM PARGi for another 4 hr.
Figure 4 with 1 supplement
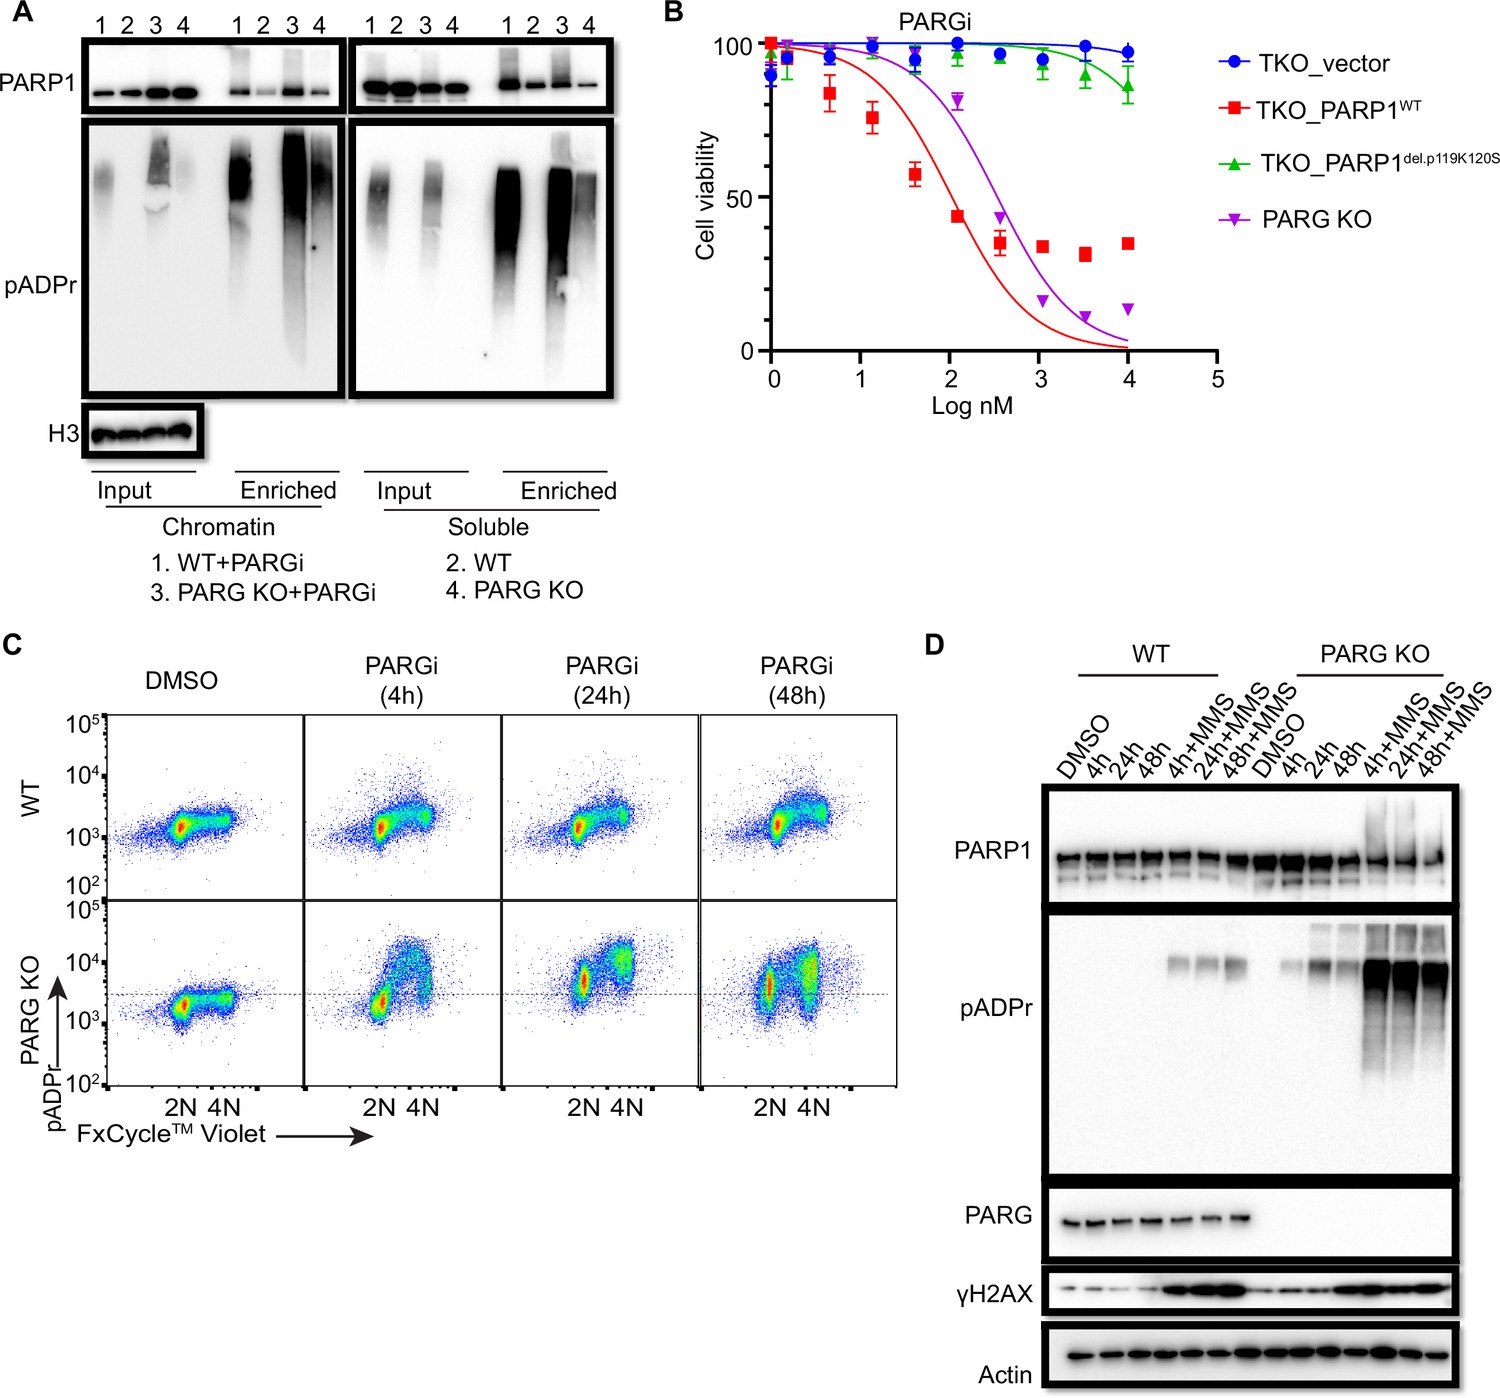
Prolonged PARGi treatment induces pADPr throughout the cell cycle and DDR in PARG KO cells.
(a) Immunoblots of chromatin-bound PARP1 and PARylated proteins in HEK293A WT and PARG KO cells treated with PARGi (10 µM) for 4 hr. PARylated proteins were enriched by Af1521 beads. (b) Sensitivity of HEK 293 A PARG/PARP1/2 TKO and PARP1 reconstitution cells to PARGi. Cells were treated with different doses of PARGi for 72 hr, and cell viability was determined by the CellTiter-Glo assay. (c) Prolonged PARGi treatment induces pADPr throughout the cell cycle in PARG KO cells. HEK293A WT and PARG KO cells were treated with PARGi (10 µM) for the indicated time and then fixed and stained with anti-pADPr antibody and violet. (d) Immunoblotting of γH2A.X signals and other indicated proteins and modifications induced by prolonged PARGi +/-MMS treatment.
-
Figure 4—source data 1
Original file for the western blot analysis in Figure 4.
- https://cdn.elifesciences.org/articles/89303/elife-89303-fig4-data1-v1.zip
-
Figure 4—source data 2
PDF containing Figure 4 and original scans of the relevant western blot analysis with highlighted bands and sample labels.
- https://cdn.elifesciences.org/articles/89303/elife-89303-fig4-data2-v1.zip
Figure 4—figure supplement 1

Uncontrolled S phase pADPr accumulation eventually leads to DNA damage and cell death.
(a) Immunoblots of soluble and chromatin-bound PARP1/2 levels in different knockout cells treated with MMS, PARPi, or both. (b) PARG/PARP1/2 TKO cells, reconstituted with PARP1 WT or trapping-deficient mutant (del.p119K120S), were treated with PARGi (10 µM) for 4 hr. The total cell lysates and PARylated proteins enriched by Af1521 beads were immunoblotted with the indicated antibodies. (c) Alkaline comet assay results of HEK293A WT and PARG KO with PARGi (10 µM) treatment for different times. The comet-tail moments from 100 cells in each condition were measured and are shown in the box plot. The center line indicates the median, the box bounds indicate the first and third quartiles, and the whiskers indicate the maximum and minimum. (d) Flow cytometry analysis of pADPr signaling in HeLa WT and PARG KO cells treated with PARGi (10 µM) for different times. (e) PARG and PARP1 expression levels in HEK293A and HeLa cells. (f) HeLa WT and PARG KO cells were treated with PARGi (10 µM) for different times or for an additional 30 min with 0.01% MMS. The total cell lysates were immunoblotted with the indicated antibodies.
-
Figure 4—figure supplement 1—source data 1
Original file for the western blot analysis in Figure 4—figure supplement 1.
- https://cdn.elifesciences.org/articles/89303/elife-89303-fig4-figsupp1-data1-v1.zip
-
Figure 4—figure supplement 1—source data 2
PDF containing Figure 4—figure supplement 1 and original scans of the relevant western blot analysis with highlighted bands and sample labels.
- https://cdn.elifesciences.org/articles/89303/elife-89303-fig4-figsupp1-data2-v1.zip
-
Figure 4—figure supplement 1—source data 3
Original images for alkaline comet assay in Figure 4—figure supplement 1.
- https://cdn.elifesciences.org/articles/89303/elife-89303-fig4-figsupp1-data3-v1.zip
Figure 5 with 1 supplement
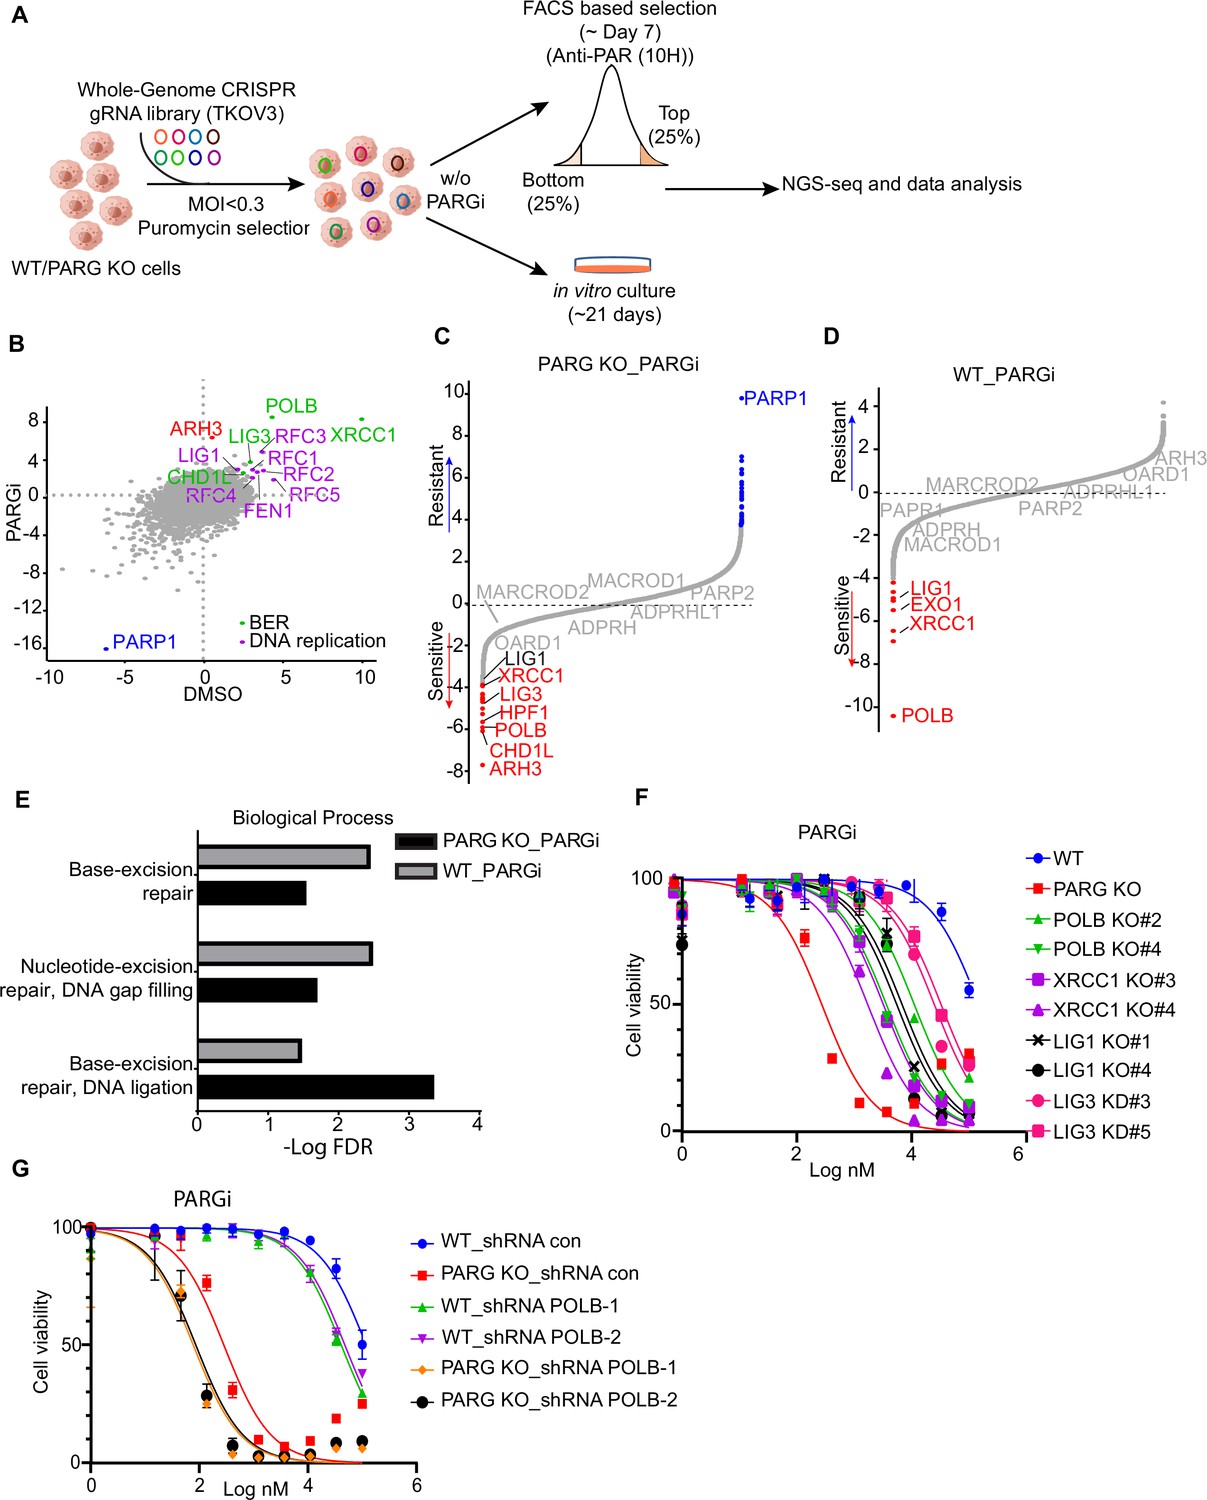
CRISPR screening identifies regulators of pADPr and cell viability.
(a) Workflow of whole-genome CRISPR screens. For FACS-based CRISPR screening, 5 days after puromycin selection, cells were treated with PARGi (10 µM) for 4 hr and then stained with anti-pADPr antibody and sorted with flow cytometry. Cells with strong signals (top 25%, TOP) and weak signals (bottom 25%, BOT) were selected. The sgRNAs from these cells were then sequenced and analyzed. For cell viability screening, cells were treated with or without PARGi for 21 days before collection. (b) Scatter plot of DrugZ scores of PARG KO cells treated with or without PARGi treatment. The genes in the same pathway were marked with specific colors. A positive score indicates an enhanced pADPr signal, while a minus score indicates a decreased pADPr signal. (c and d) Ranking of PARGi co-essential genes on the basis of a DrugZ analysis of the results of CRISPR/Cas9 screens performed with Toronto Knock Out Library (version 3) in HEK293A PARG KO cells and HEK239A cells. (e) Analysis of biological processes of PARGi co-essential genes identified in HEK293A PARG KO cells and HEK239A cells. (f) HEK293A WT cells, PARG KO, POLB KO, LIG1 KO, XRCC1 KO, and LIG3 knockdown cells were treated with different doses of PARGi for 72 hr. Cell viability was determined by the CellTiter-Glo assay. (g) The cell Viability of HEK293A WT and PARG cells under POLB knockdown to PARGi. Cells were treated with different doses of PARGi for 72 hr.
-
Figure 5—source data 1
NormZ score of FACS-based TKOv3 library screen conducted with PARG KO cells with or without PARGi.
- https://cdn.elifesciences.org/articles/89303/elife-89303-fig5-data1-v1.xlsx
-
Figure 5—source data 2
NormZ score of cell viability–based TKOv3 library screen conducted with HEK293A cells or PARG KO cells treated with PARGi.
- https://cdn.elifesciences.org/articles/89303/elife-89303-fig5-data2-v1.xlsx
Figure 5—figure supplement 1
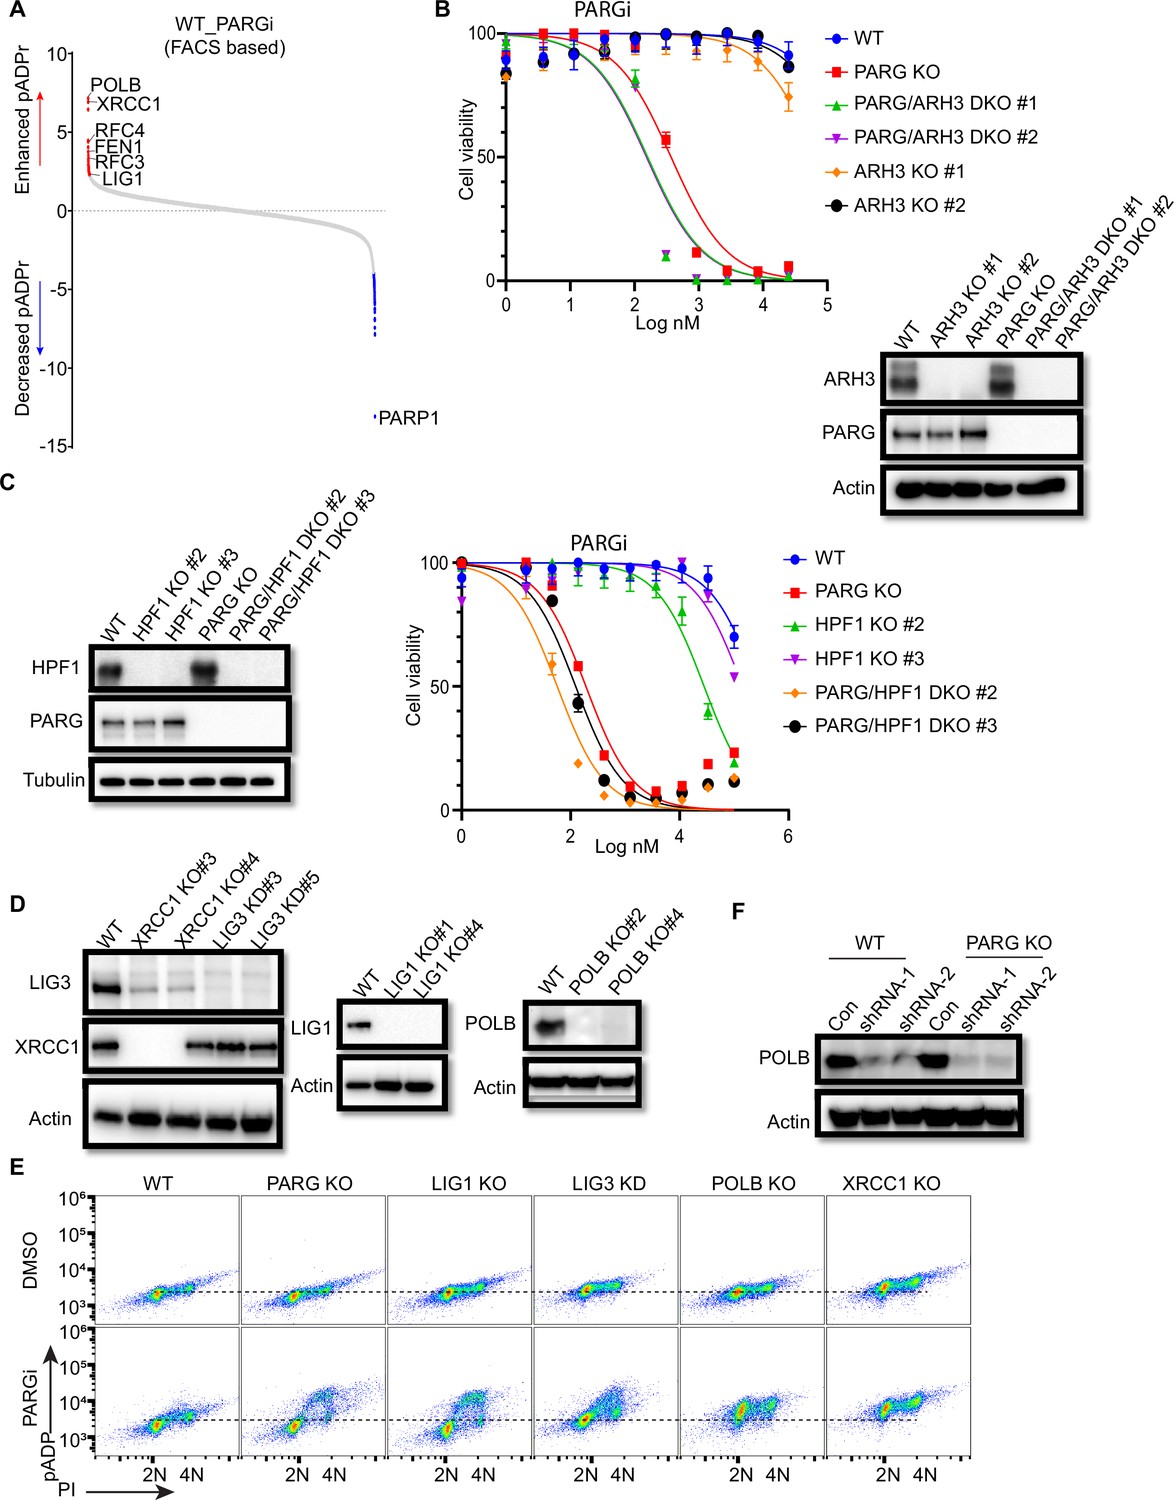
Proteins involved in pADPr regulation contribute to PARGi sensitivity.
(a) NormZ scores of sgRNA abundance between top and bottom groups in FACS-based anti-pADPr screens with HEK293A treated with PARGi (10 µM) for 4 hr. (b) ARH3 loss and (c) HPF1 loss show modestly increased sensitivity to PARGi in PARG KO cells. ARH3 or HPF knockout was confirmed by western blotting and DNA sequencing. Cell viability was measured with the CellTiter-Glo assay after 3 days. (d) XRCC1, LIG1, and POLB knockout in HEK293A was confirmed by western blotting and DNA sequencing. LIG3 knockdown was validated by western blotting, in which XRCC1 KO cells were included as controls. (e) Flow cytometry analysis of pADPr signaling in cells treated with PARGi (10 µM) for 4 hr. PARG KO, LIG1 KO, and LIG3 KD cells treated with PARGi showed S-phase-specific pAPDr signaling, while XRCC1 KO and POLB KO cells showed pAPDr signaling throughout the cell cycle. (f) POLB was knocked down by shRNA in both HEK293A WT and PARG KO cells.
-
Figure 5—figure supplement 1—source data 1
NormZ score of FACS-based TKOv3 library screen conducted with HEK293A cells treated with PARGi.
- https://cdn.elifesciences.org/articles/89303/elife-89303-fig5-figsupp1-data1-v1.xlsx
-
Figure 5—figure supplement 1—source data 2
Original file for the western blot analysis in Figure 5—figure supplement 1.
- https://cdn.elifesciences.org/articles/89303/elife-89303-fig5-figsupp1-data2-v1.zip
-
Figure 5—figure supplement 1—source data 3
PDF containing Figure 5—figure supplement 1 and original scans of the relevant western blot analysis with highlighted bands and sample labels.
- https://cdn.elifesciences.org/articles/89303/elife-89303-fig5-figsupp1-data3-v1.zip
Figure 6 with 2 supplements
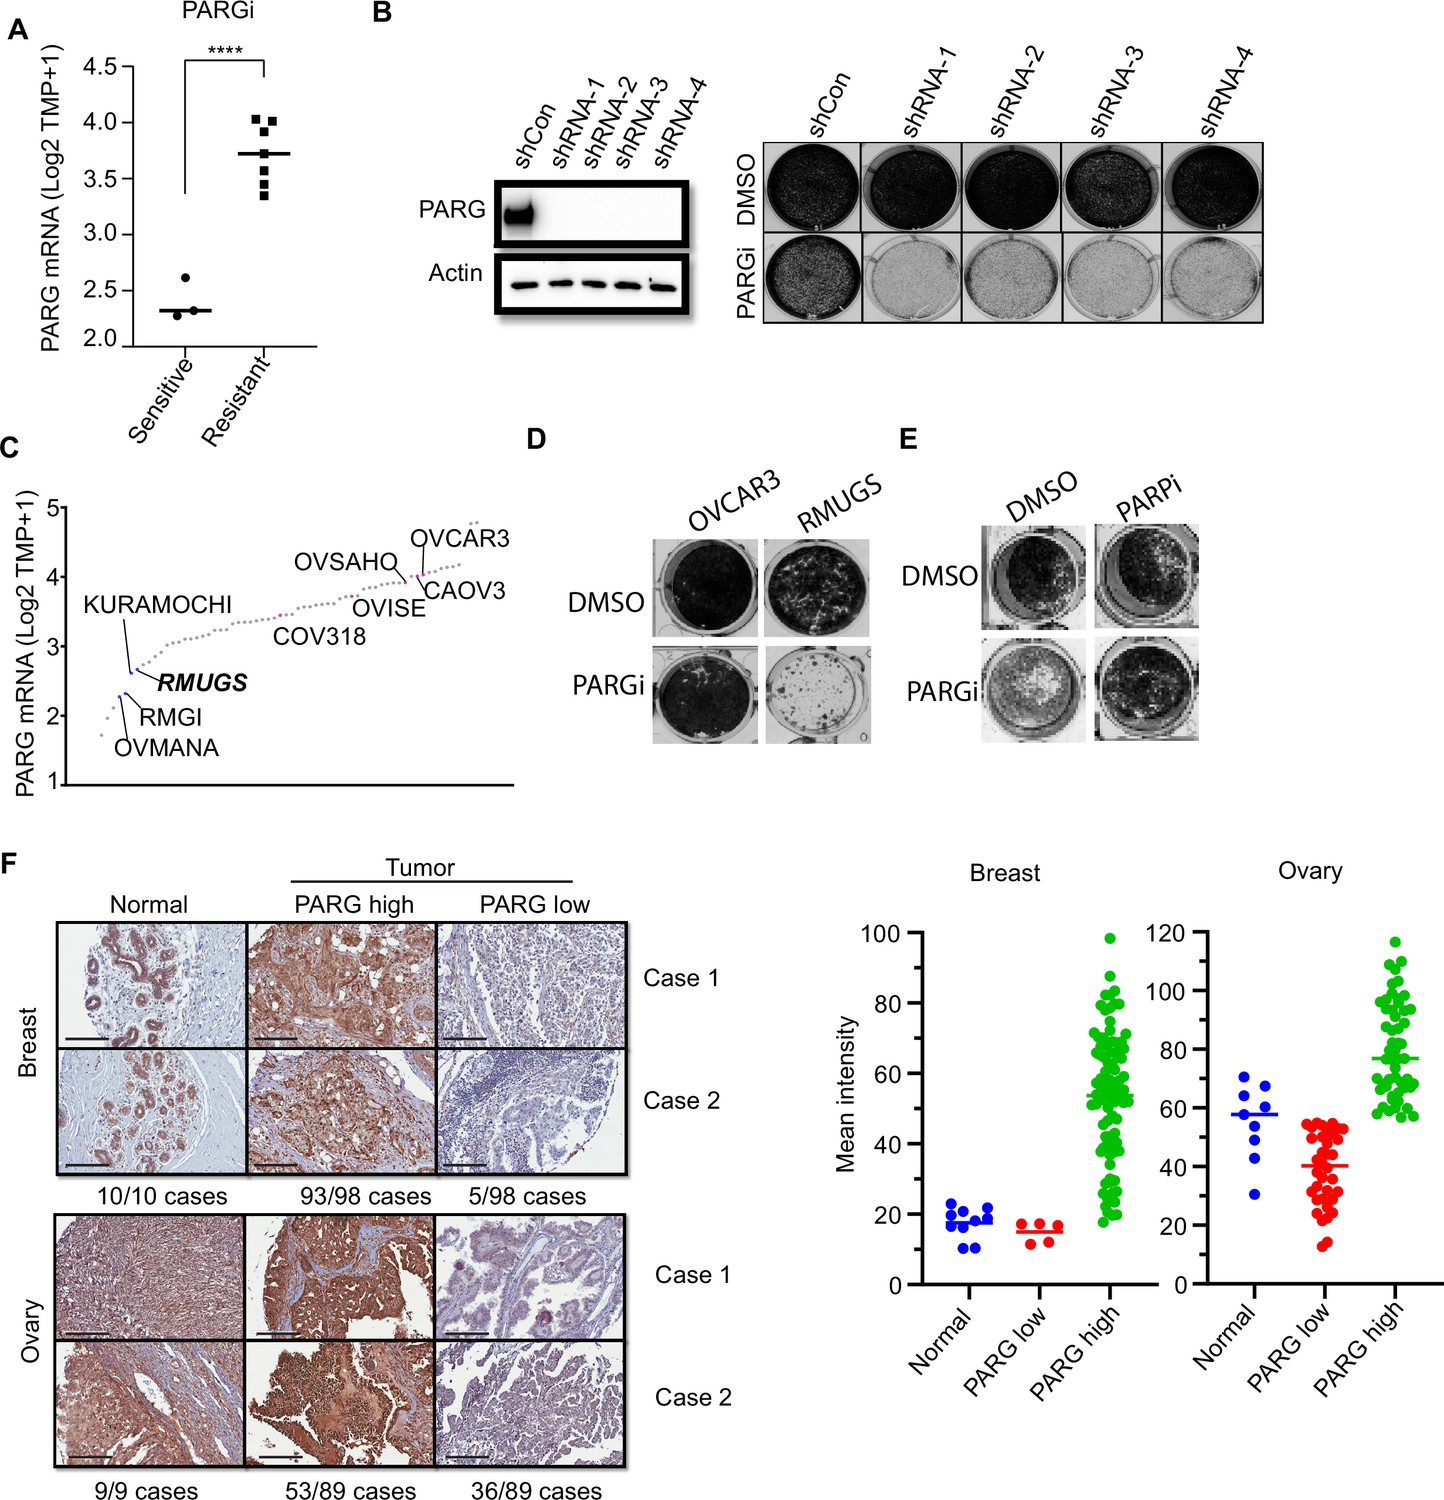
PARG expression is a potential marker for PARGi sensitivity.
(a) PARG mRNA level comparison between sensitive (RMGI, KURAMOCHI, and OVMANA) and resistant cells (COV362, COV318, OV56, OVISE, OVSAHO, CAOV3, and OVCAR3) from Pillay’s work on the basis of CCLE data. (b) Clonogenic assay results of control and PARG knockdown HeLa cells with PARGi (2 µM) treatment for 7 days. shRNA knockdown efficiency was confirmed by an immunoblot of PARG. (c) Ranked PARG expression level in ovarian cancer cell lines based on the CCLE database. The sensitive and resistant cells from Pillay’s work were labeled. (d) Clonogenic assay results of OVCAR3 and RMUGS treated with or without PARGi (2 µM). (e) Clonogenic assay results of RMUGS treated with PARGi (2 µM), PARPi (2 µM), or both. (f) Left: Representative images of PARG IHC staining in breast and ovarian tissues and tumor samples to determine the PARG expression level. The summary is listed at the bottom. Scale bar, 200 µm. Right: The scatter plot of mean immunostaining intensity of PARG in each sample. The mean of each group was plotted.
-
Figure 6—source data 1
Original file for the western blot analysis and colony formation assay in Figure 6.
- https://cdn.elifesciences.org/articles/89303/elife-89303-fig6-data1-v1.zip
-
Figure 6—source data 2
PDF containing Figure 6 and original scans of the relevant western blot analysis and colony formation assay with highlighted bands and sample labels.
- https://cdn.elifesciences.org/articles/89303/elife-89303-fig6-data2-v1.zip
Figure 6—figure supplement 1

HR deficiency renders cells sensitive to PARGi.
(a) Results of clonogenic assays conducted with RPE1 FLAG-Cas9 P53/BRCA1 DKO and PRE FLAG-Cas9 P53 KO cells with the indicated treatment for 14 days. (b) Results of clonogenic assays conducted with inducible BRCA1 depletion of HeLa cells and corresponding 53BP1 KO cells, with or without BRCA1 depletion, which were co-treated with the indicated compounds for 7 days. BRCA1 was inducibly depleted by indole-3-acetic acid (IAA) and doxycycline (Dox) co-treatment; this was confirmed by western blotting.
-
Figure 6—figure supplement 1—source data 1
Original file for the western blot analysis and colony formation assay in Figure 6—figure supplement 1.
- https://cdn.elifesciences.org/articles/89303/elife-89303-fig6-figsupp1-data1-v1.zip
-
Figure 6—figure supplement 1—source data 2
PDF containing Figure 6—figure supplement 1 and original scans of the relevant western blot analysis and colony formation assay with highlighted bands and sample labels.
- https://cdn.elifesciences.org/articles/89303/elife-89303-fig6-figsupp1-data2-v1.zip
Figure 6—figure supplement 2

PARG loss is a robust marker of PARGi sensitivity.
(a) Immunoblot of PARG in cells treated with PARG shRNA to knock down PARG. (b) Results of clonogenic assays conducted in PARG knockdown cells. PARG was knocked down in the inducible BRCA1 depletion HeLa cells and corresponding 53BP1 KO cells. BRCA1 was inducibly depleted by IAA and Dox co-treatment. Cells were cultured for 7 days with the indicated treatment.
-
Figure 6—figure supplement 2—source data 1
Original file for the western blot analysis and colony formation assay in Figure 6—figure supplement 2.
- https://cdn.elifesciences.org/articles/89303/elife-89303-fig6-figsupp2-data1-v1.zip
-
Figure 6—figure supplement 2—source data 2
PDF containing Figure 6—figure supplement 2 and original scans of the relevant western blot analysis and colony formation assay with highlighted bands and sample labels.
- https://cdn.elifesciences.org/articles/89303/elife-89303-fig6-figsupp2-data2-v1.zip
Figure 7 with 2 supplements
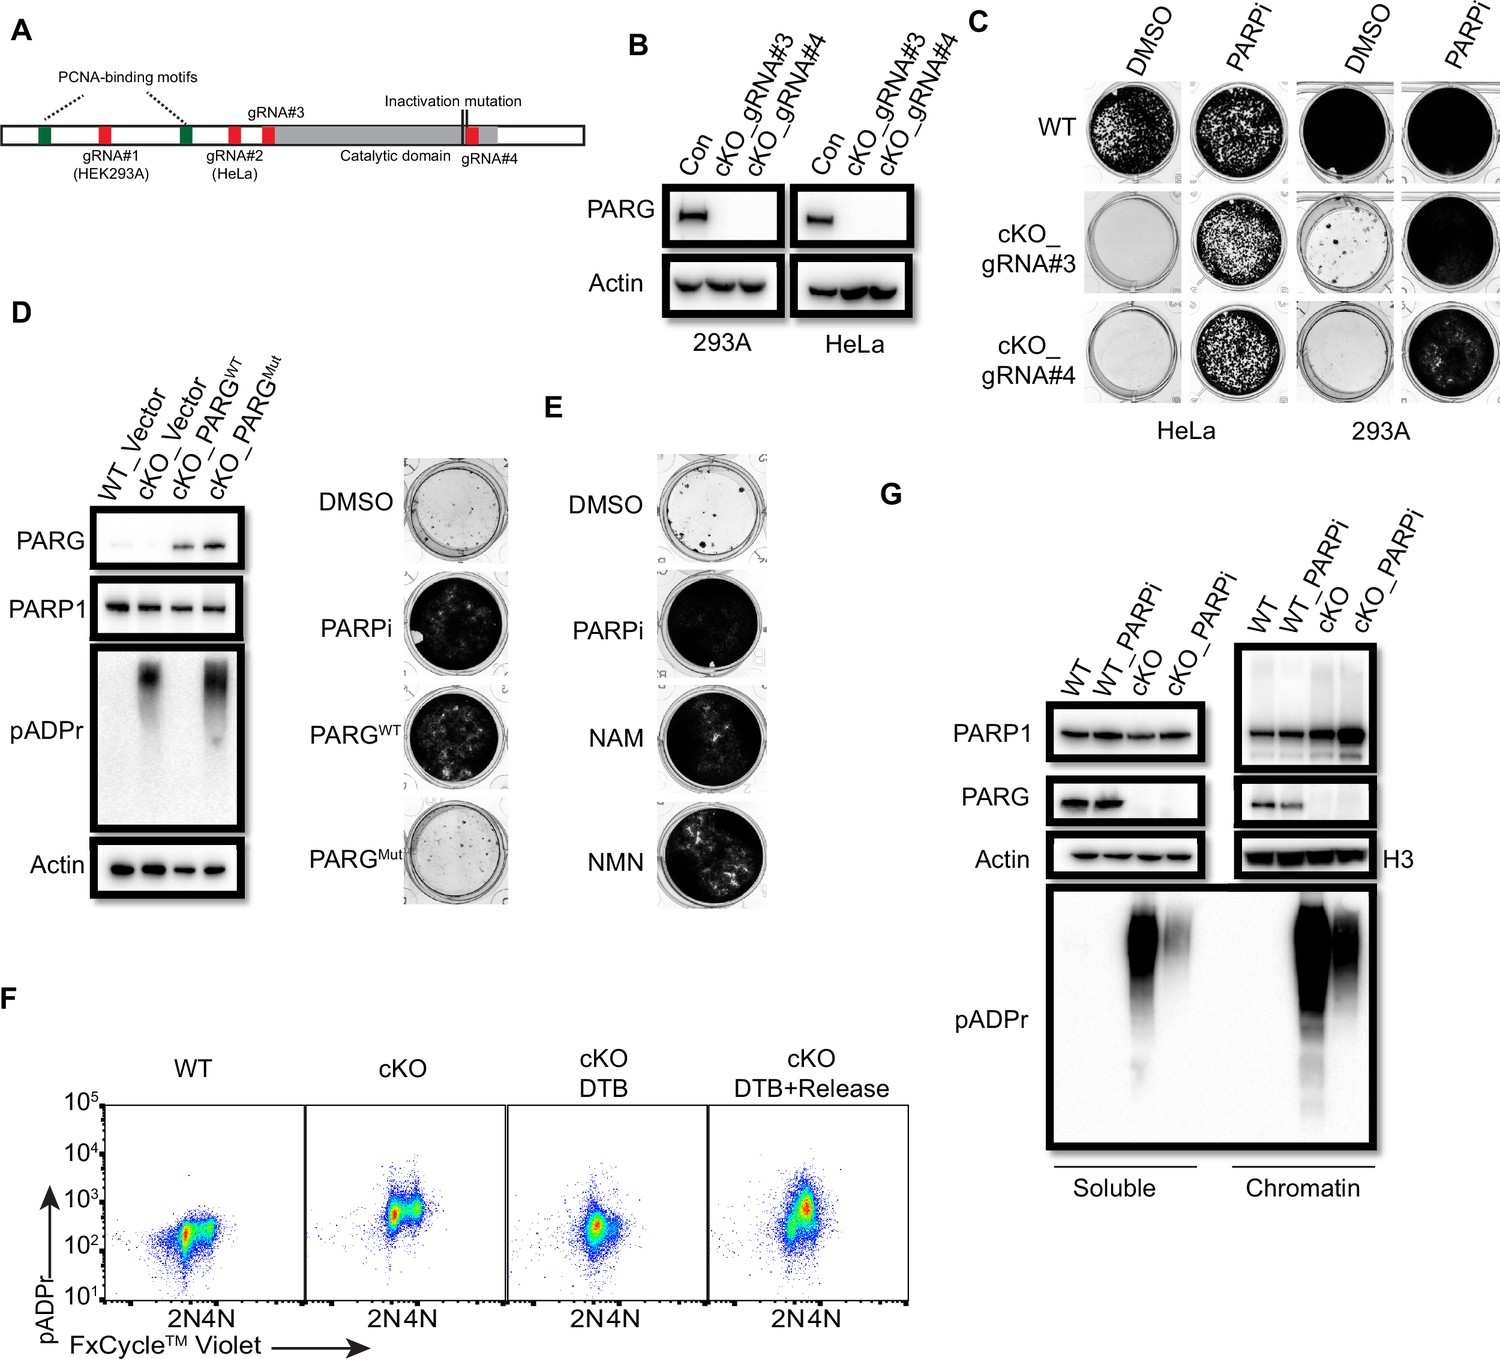
PARG is essential for cell survival.
(a) Diagram of full-length PARG was presented with the indicated gRNAs (gRNA#3 and 4) which target different regions in the C-terminal catalytic domain. The boundary of the catalytic domain was depicted based on Uniprot annotation. gRNA#1 and gRNA#2 were used previously to generate the aforementioned HEK293A- and HeLa-derived PARG KO cells, respectively; while gRNA#3 and gRNA#4 were used to generate PARG complete/conditional knockout (cKO) in the presence of olaparib in HEK293A and HeLa cells. (b) Immunoblotting was conducted to confirm the loss of PARG in PARG cKO cells derived from HEK293A and HeLa cells, which were cultured in the presence of 100 nM olaparib. (c) Clonogenic assay results of WT and PARG cKO cells treated with or without PARPi (100 nM) for 7 days. (d) Left: The immunoblots to confirm reconstitution with WT PARG or catalytic inactivation PARG in HEK293A PARG cKO cells. Right: Results of clonogenic survival assay with HEK293A PARG cKO cells reconstituted with WT or catalytic inactivation mutant of PARG for 7 days. (e) Representative clonogenic results conducted in HEK293A PARG cKO cells treated with NAM (100 µM) or NMN (1 mM) for 7 days. (f) HEK293A PARG cKO cells were synchronized with double thymidine block (DTB). Cells remained with DTB or were released from DTB for 4 hr, and then fixed and stained with anti-pADPr antibody and FxCycle Violet dye. (g) Immunoblots of soluble and chromatin-bound PARP1 and pADPr levels in HEK293A WT and PARG cKO cells treated with DMSO or olaparib (10 µM) for 2 hr.
-
Figure 7—source data 1
Original file for the western blot analysis and colony formation assay in Figure 7.
- https://cdn.elifesciences.org/articles/89303/elife-89303-fig7-data1-v1.zip
-
Figure 7—source data 2
PDF containing Figure 7 and original scans of the relevant western blot analysis and colony formation assay with highlighted bands and sample labels.
- https://cdn.elifesciences.org/articles/89303/elife-89303-fig7-data2-v1.zip
Figure 7—figure supplement 1

KO cells were validated by DNA sequencing.
gDNA sequences were provided for each KO clones. The WT reference sequence was also provided.
Figure 7—figure supplement 2

DePARylation activity of PARG is essential for cell survival.
(a) Immunoblotting of PARG using two independent antibodies that recognize the C-terminus of PARG in PARG KO cells. The immunogens and the corresponding amino acid regions were shown (left). (b) HEK293A cKO cells were validated by DNA sequencing. gDNA sequences are indicated at the top. The WT reference sequence was provided. (c) The dePARylation activity was assessed in whole cell lysates (WCLs) prepared from control wild-type (WT), PARG KO, and PARG cKO HEK293A cells. The dePARylation activity was measured with remnant pADPr recognized by anti-pADPr antibody, and normalized with the Control and the Blank samples as indicated in Materials and methods. n=4 independent measurements. (d) The PARG dePARylation activity in WCL prepared from control WT and PARG KO HEK293A was inhibited in a dose-dependent manner in the presence of PARGi. WCL prepared from PARG cKO cells was included as a control. n=3 independent measurements. (e) The PARG dePARylation activity shown in (d) is presented together with PARGi concentrations.
-
Figure 7—figure supplement 2—source data 1
Original file for the western blot in Figure 7—figure supplement 2A.
- https://cdn.elifesciences.org/articles/89303/elife-89303-fig7-figsupp2-data1-v1.zip
-
Figure 7—figure supplement 2—source data 2
PDF containing Figure 7—figure supplement 2A and original scans of the relevant western blot analysis with highlighted bands and sample labels.
- https://cdn.elifesciences.org/articles/89303/elife-89303-fig7-figsupp2-data2-v1.zip
Additional files
-
Supplementary file 1
The CRISPR-Cas9 screening results.
(a) NormZ score of DDR library screen conducted with HEK293A cells treated with PARGi. (b) NormZ score of FACS-based TKOv3 library screen conducted with HEK293A cells treated with PARGi. (c) NormZ score of FACS-based TKOv3 library screen conducted with PARG KO cells. (d) NormZ score of FACS-based TKOv3 library screen conducted with PARG KO cells treated with PARGi. (e) NormZ score of cell viability–based TKOv3 library screen conducted with HEK293A cells treated with PARGi. (f) NormZ score of cell viability–based TKOv3 library screen conducted with PARG KO cells treated with PARGi.
- https://cdn.elifesciences.org/articles/89303/elife-89303-supp1-v1.xlsx
-
MDAR checklist
- https://cdn.elifesciences.org/articles/89303/elife-89303-mdarchecklist1-v1.docx
Download links
A two-part list of links to download the article, or parts of the article, in various formats.
Downloads (link to download the article as PDF)
Open citations (links to open the citations from this article in various online reference manager services)
Cite this article (links to download the citations from this article in formats compatible with various reference manager tools)
DePARylation is critical for S phase progression and cell survival
eLife 12:RP89303.
https://doi.org/10.7554/eLife.89303.4


