Partitioning to ordered membrane domains regulates the kinetics of secretory traffic
- Department of Molecular Physiology and Biological Physics, Center for Membrane and Cell Physiology, University of Virginia, United States
- Department of Chemistry, The University of Tennessee, United States
- Broad Institute of MIT and Harvard, United States
- ICFO-Institut de Ciencies Fotoniques, The Barcelona Institute of Science and Technology, Spain
Figures
Figure 1 with 1 supplement
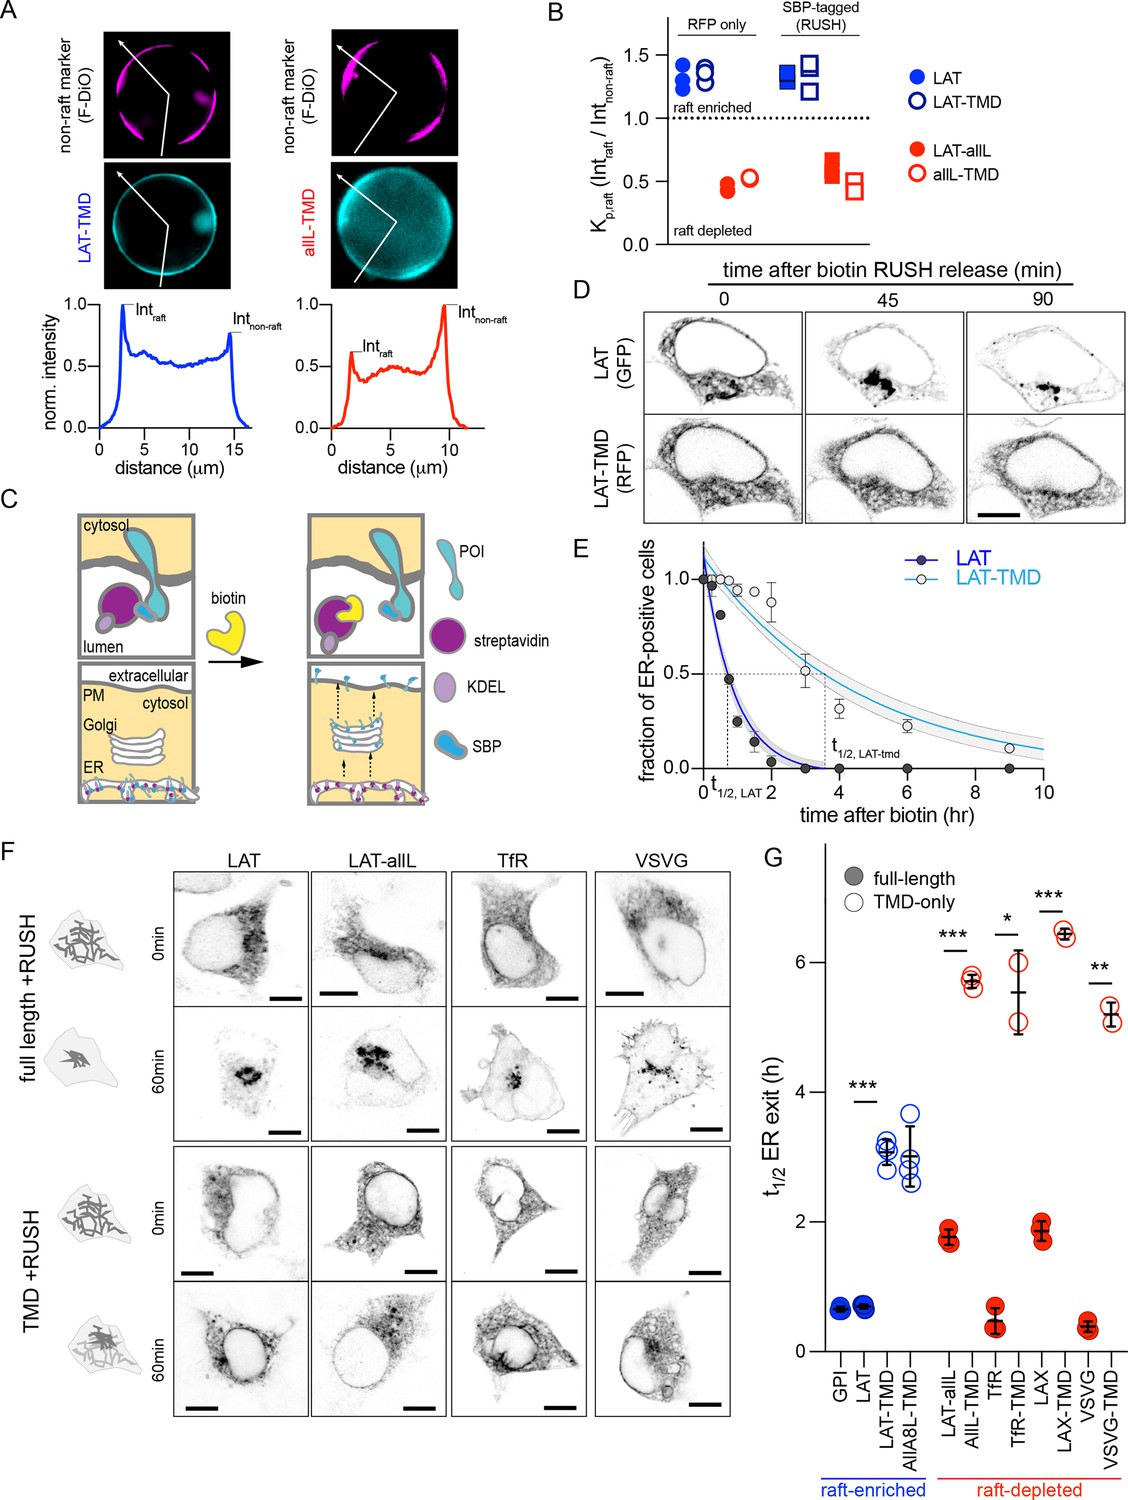
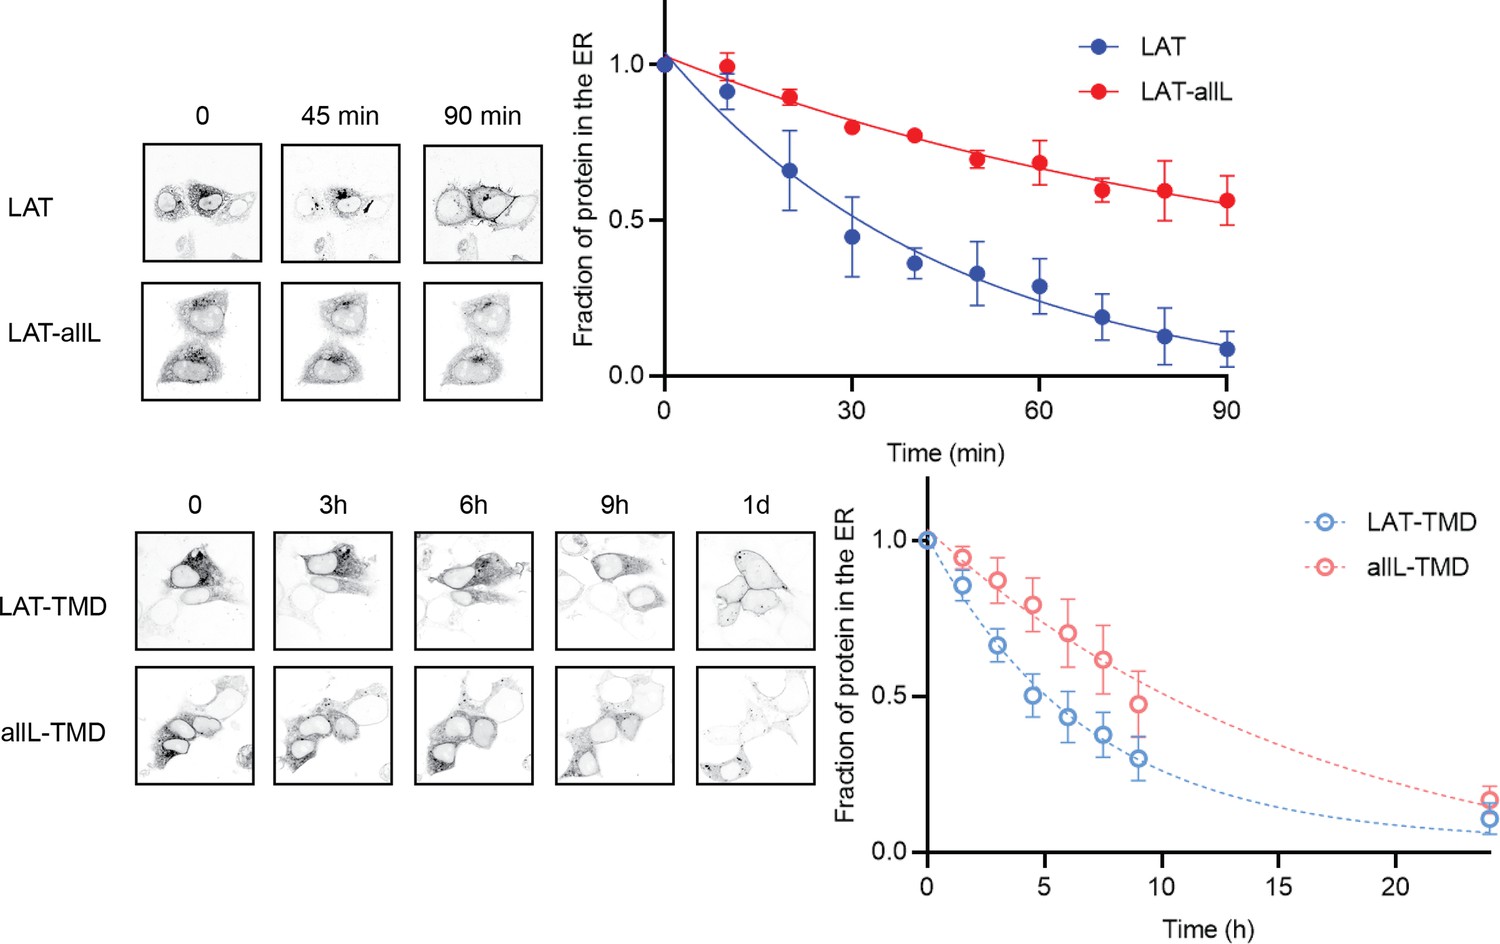
Full-length proteins exit the ER faster than TMD-only versions regardless of raft affinity.
(A) Exemplary images of GPMVs from cells expressing raft-preferring LAT-TMD (left) or non-raft-preferring allL-TMD (right). The RFP-tagged TMDs are shown in cyan; magenta shows the disordered phase marker Fast DiO (F-DiO). Bottom row shows fluorescence intensity line scans along white lines shown in cyan images, revealing protein partitioning between raft and non-raft phases. (B) The ratio of intensities in raft versus non-raft phase is the raft partition coefficient (Kp,raft). LAT-TMD and full-length LAT are enriched in the raft phase while allL-TMD (and full-length LAT with allL-TMD, LAT-allL) are largely depleted from raft phase. SBP-tagging (for RUSH assay) has no effect on raft affinity. Symbols represent 3 independent experiments with >10 GPMVs/experiment. All blue labeled constructs are not statistically different from one another, and each is P<0. 01 different from all red constructs. (C) Schematic of RUSH assay. (D) Confocal images of co-transfected LAT-EGFP and LAT-TMD-mRFP at various time points after biotin introduction. Full-length LAT exits ER faster. (E) Fraction of ER-positive cells decreases over time, allowing quantitative estimation of ER exit kinetics (t1/2). Symbols represent average +/-st.dev. from >3 independent experiments. Fits represent exponential decays with shading representing 95% confidence intervals. (F) Confocal images of various full-length and TMD-only RUSH constructs (RFP-tagged) at 0 and 60 min after biotin introduction. (G) Quantification of t1/2 for ER exit comparing full-length and TMD-only proteins (blue represents raft-enriched proteins, red = raft-depleted; see Supplementary file 1 for Kp,raft quantifications). Bars represent average ± st.dev. from three independent experiments; *p<0.05, **p<0.01, ***p<0.001. All scale bars correspond to 5 µm. Original data quantification can be found in the Source Data files.
-
Figure 1—source data 1
Exemplary images of GPMVs from cells expressing raft-preferring or non-raft-preferring TMDs.
- https://cdn.elifesciences.org/articles/89306/elife-89306-fig1-data1-v1.xlsx
-
Figure 1—source data 2
Raft partitioning coefficient of TMDs with and without the SBP-tag.
- https://cdn.elifesciences.org/articles/89306/elife-89306-fig1-data2-v1.xlsx
-
Figure 1—source data 3
Confocal images of co-transfected full-length and TMD-only versions of LAT protein at various time points after biotin introduction.
- https://cdn.elifesciences.org/articles/89306/elife-89306-fig1-data3-v1.xlsx
-
Figure 1—source data 4
Quantification of time of residency for ER exit of full-length and TMD-only proteins of raft-enriched and raft-depleted proteins.
- https://cdn.elifesciences.org/articles/89306/elife-89306-fig1-data4-v1.xlsx
Figure 1—figure supplement 1

Representative images of RUSH constructs after overnight (>10 hr) treatment with biotin.
Images show the steady-state distribution: LAT and LAT-TMD accumulate at the PM, LAT-allL and allL-TMD accumulate in punctate structures previously identified as lysosomes.
Figure 2 with 1 supplement
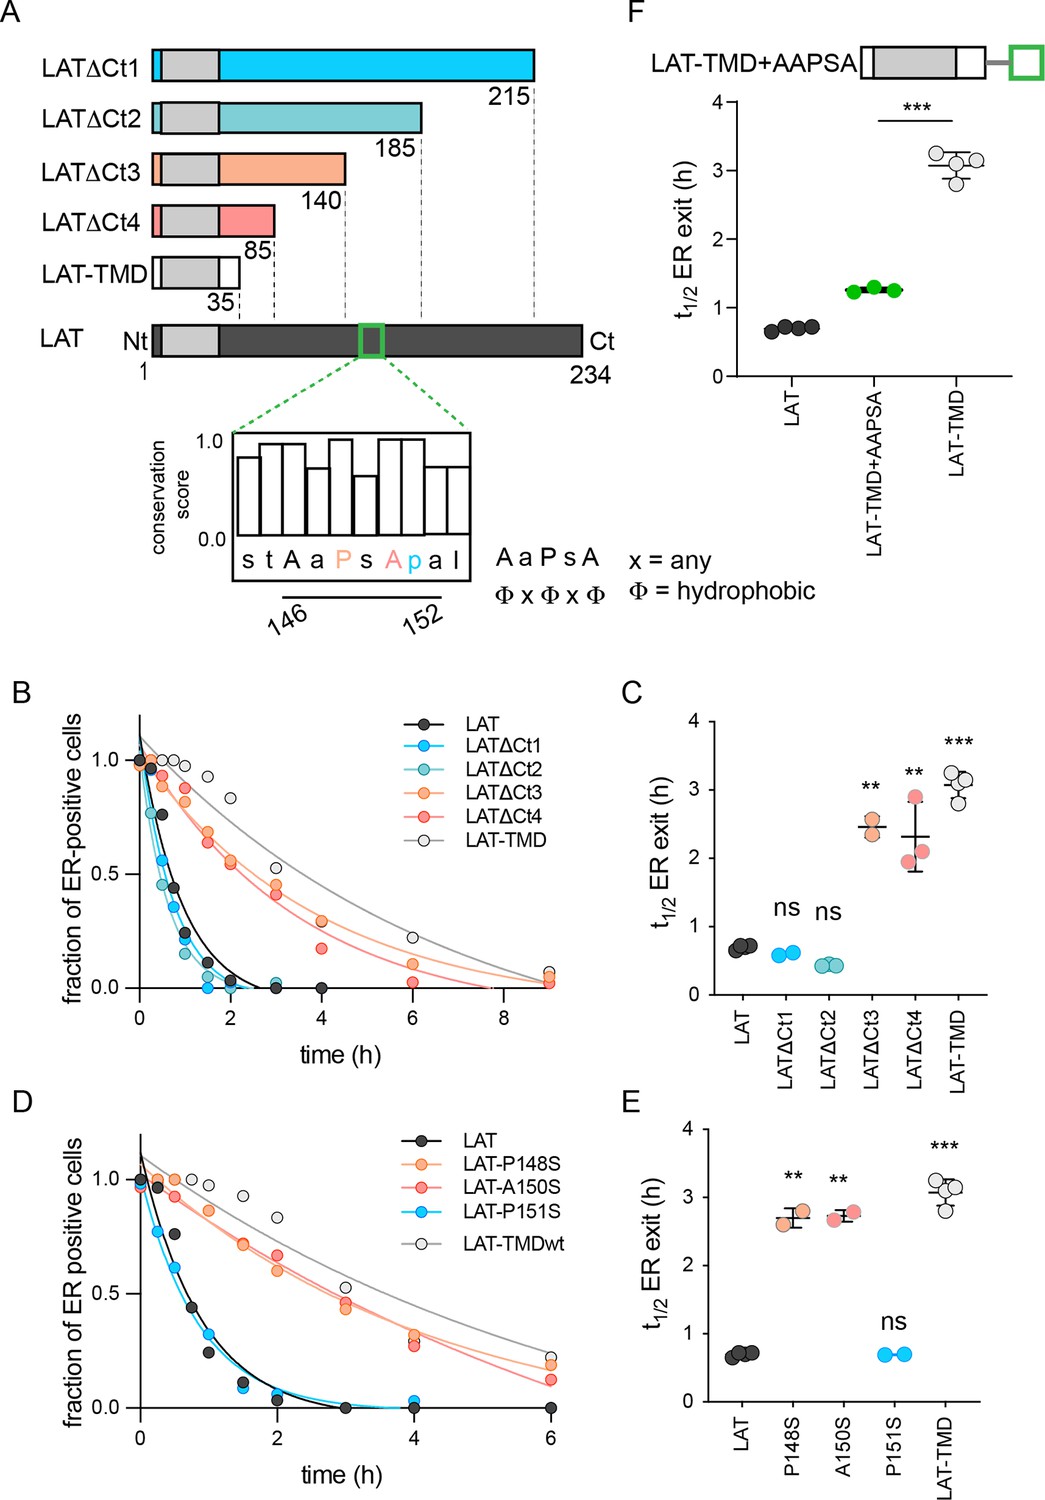
Identification of ER exit motif of LAT.
(A) Schematic of LAT and the truncated versions used here. Inset shows a putative COPII association motif and the evolutionary conservation of residues 144–153 of hLAT. (B) Temporal dependence of the fraction of ER-positive cells for LAT truncations. Deletion of a region comprised of residues 140–185 leads to slow ER exit. (C) Fitted ER exit kinetics for the constructs represented in panel C. Deletion of amino acids 140–185 slows ER exit kinetics by ~fourfold. (D) Temporal dependence of fraction of ER-positive cells with point mutations of ΦxΦxΦ motif. Mutations of key residues within the motif slow ER exit kinetics. (E) Fitted ER exit kinetics for point mutants in panel D. (F) Insertion of AaPsA motif into LAT-TMD accelerates ER exit kinetics. (B and D) show a representative experiment with exponential decay fits; points in C, E, and F represent t1/2 values of ER exit from fits of independent repeats with >20 cells/experiment. **p<0.01, ***p<0.001, nsp >0.05. Original data quantification can be found in the Source Data files.
-
Figure 2—source data 1
Quantification of the temporal dependence of the fraction of ER-positive cells on cytosolic domains.
- https://cdn.elifesciences.org/articles/89306/elife-89306-fig2-data1-v1.xlsx
-
Figure 2—source data 2
Quantification of the ER exit kinetics for the constructs represented in panel B.
- https://cdn.elifesciences.org/articles/89306/elife-89306-fig2-data2-v1.xlsx
-
Figure 2—source data 3
Quantification of the temporal dependence of the fraction of ER-positive cells point mutations in the potential COP-II recognition motif of the cytoslic tail of LAT.
- https://cdn.elifesciences.org/articles/89306/elife-89306-fig2-data3-v1.xlsx
-
Figure 2—source data 4
Quantification of the fit ER exit kinetics for point mutants in LAT protein show that changes in a single amino acid of the COP-II recognition motif slow down the full-length ER exit to the level of the TMD-only.
- https://cdn.elifesciences.org/articles/89306/elife-89306-fig2-data4-v1.xlsx
Figure 2—figure supplement 1
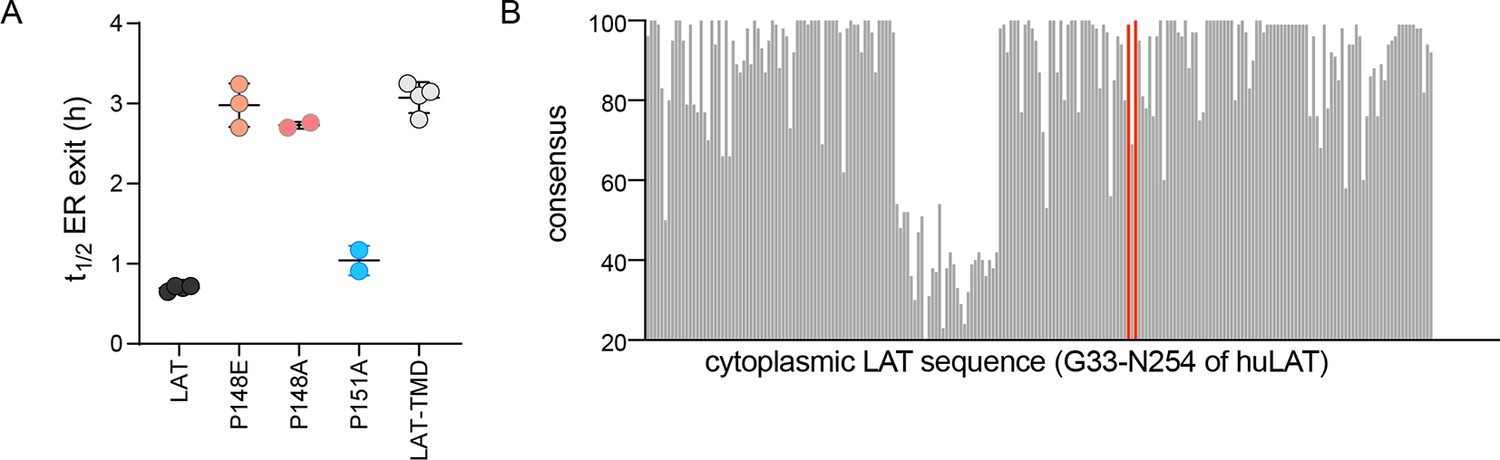
COPII binding motif mediates fast ER exit of LAT.
(A) Half-time for ER exit for point mutations in the FxFxF motif of LAT. P148 is critical for fast export from the ER, P151 is not. (B) Evolutionary conservation of cytoplasmic resides of LAT (denoted for residues G33 through the C-terminal N254 of human LAT). Red marks P148 and A150 for comparison.
Figure 3 with 2 supplements
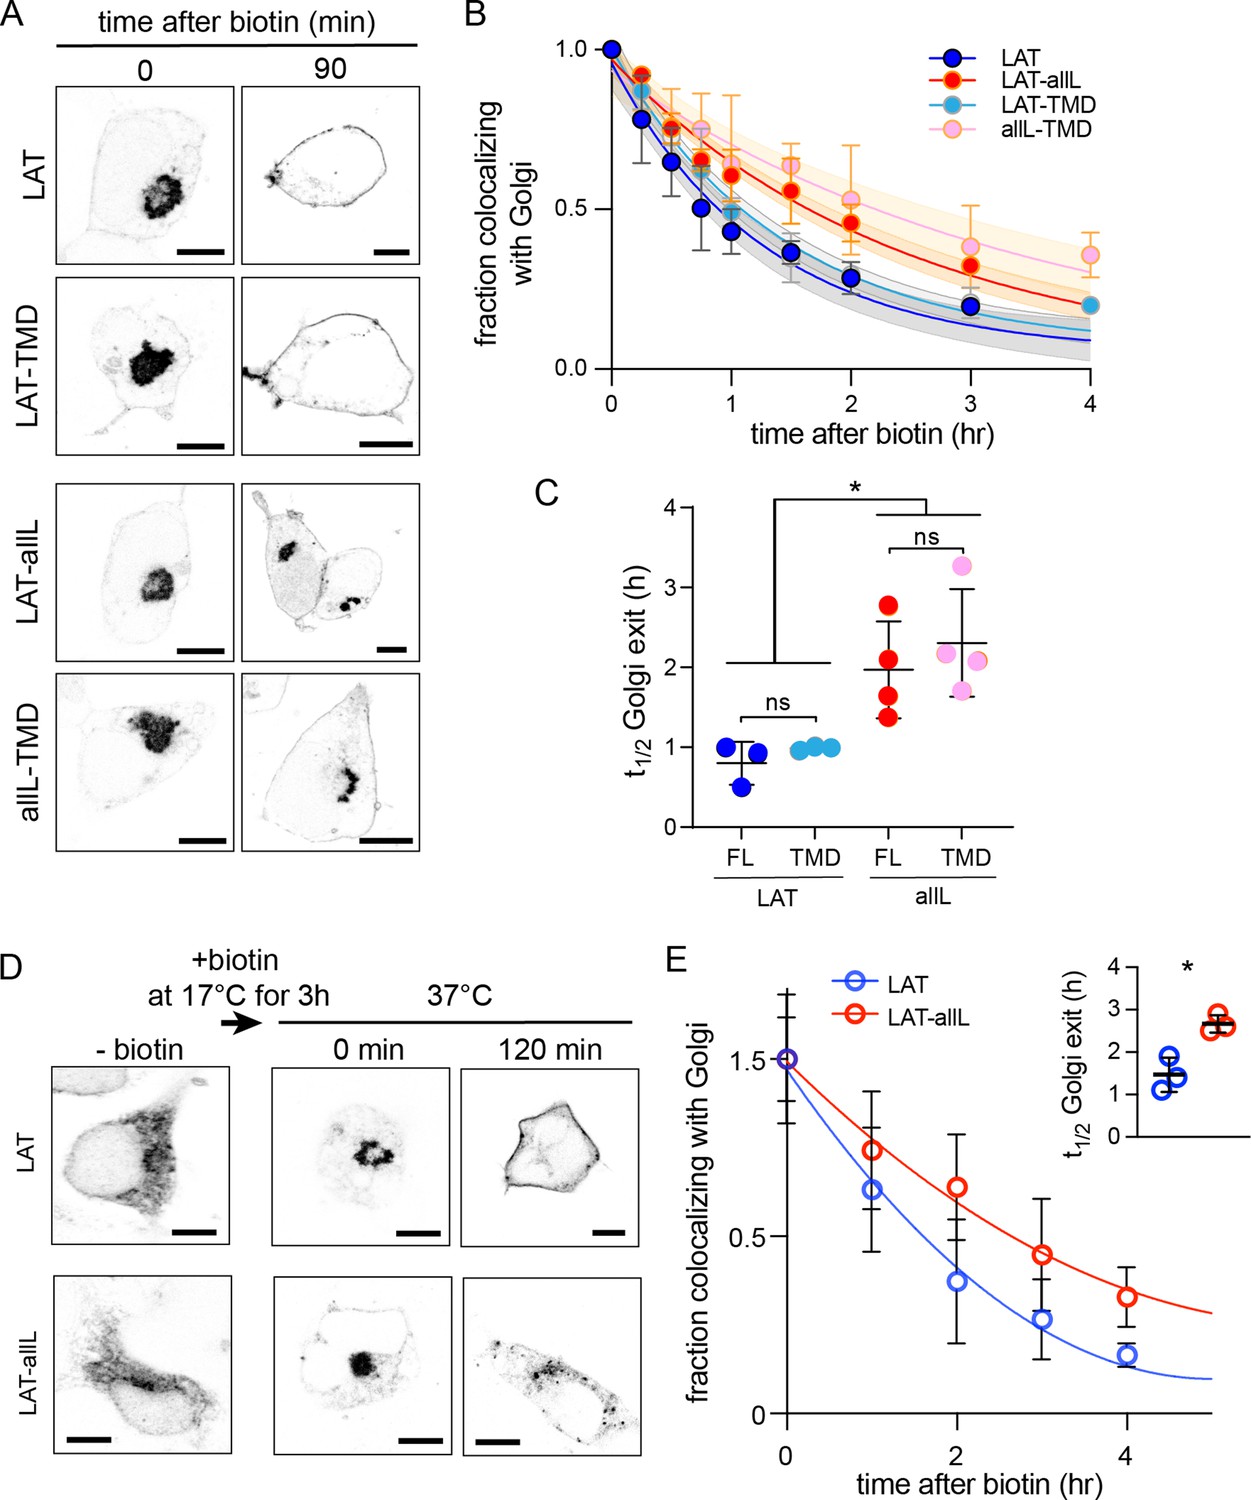
Golgi exit kinetics of LAT are dependent on its association with raft domains.
(A) Representative confocal images of Golgi RUSH experiment show notable Golgi retention of non-raft constructs (LAT-allL and allL-TMD) after 90 min of biotin addition, in contrast to raft-preferring LAT and LAT-TMD. (B) Temporal reduction of protein constructs remaining in Golgi after biotin addition (i.e. release from Golgi RUSH), quantified by immunostaining and colocalization with Golgi marker (Giantin, see Figure 3—figure supplement 2). Symbols represent average +/-st.dev. from three independent experiments with >15 cells/experiment. Fits represent exponential decays; shading represents 95% confidence intervals. (C) Golgi exit rates for raft-associated LAT constructs are ~2.5-fold faster than non-raft versions for both full-length and TMD-only. Points represent t1/2 values from fits of independent repeats with >20 cells/experiment. *p<0.05, nsp >0.05. (D) Representative confocal images of full-length LAT and LAT-allL during Golgi temperature block. Addition of biotin at 17 °C releases ER-RUSH constructs but traps them in Golgi. Removing temperature block by incubation at 37 °C leads to fast PM trafficking of LAT but not non-raft LAT-allL. (E) Fraction of proteins in Golgi for the constructs shown in D, calculated as in B. Fits represent exponential decays. (inset) Golgi exit kinetics quantified as in C. All scale bars = 5 μm. Original data quantification can be found in the Source Data files.
-
Figure 3—source data 1
Quantification of the temporal reduction of protein constructs remaining in Golgi after biotin addition.
- https://cdn.elifesciences.org/articles/89306/elife-89306-fig3-data1-v1.xlsx
-
Figure 3—source data 2
Quantification of Golgi exit rates.
- https://cdn.elifesciences.org/articles/89306/elife-89306-fig3-data2-v1.xlsx
-
Figure 3—source data 3
Quantification of the time residency of constructs in Golgi calculated from the kinetics.
- https://cdn.elifesciences.org/articles/89306/elife-89306-fig3-data3-v1.xlsx
-
Figure 3—source data 4
Quantification of the temporal kinetics after temperature block in the Golgi.
- https://cdn.elifesciences.org/articles/89306/elife-89306-fig3-data4-v1.xlsx
Figure 3—figure supplement 1

Fraction of RUSH-VSVG in Golgi after biotin addition.
Inset represents repeats quantifications of the half-time of Golgi exit. Symbols represent average +/-st.dev. from three independent experiments.
Figure 3—figure supplement 2

Example of quantification of Golgi residence for protein of interest (POI).
Top panels are representative images, bottom panels are corresponding masks to calculate the fraction of POI in Golgi. Giantin was used as Golgi marker to create the mask for that organelle. Cells mask represents the cell border from the POI channel after background subtraction.
Figure 4 with 1 supplement
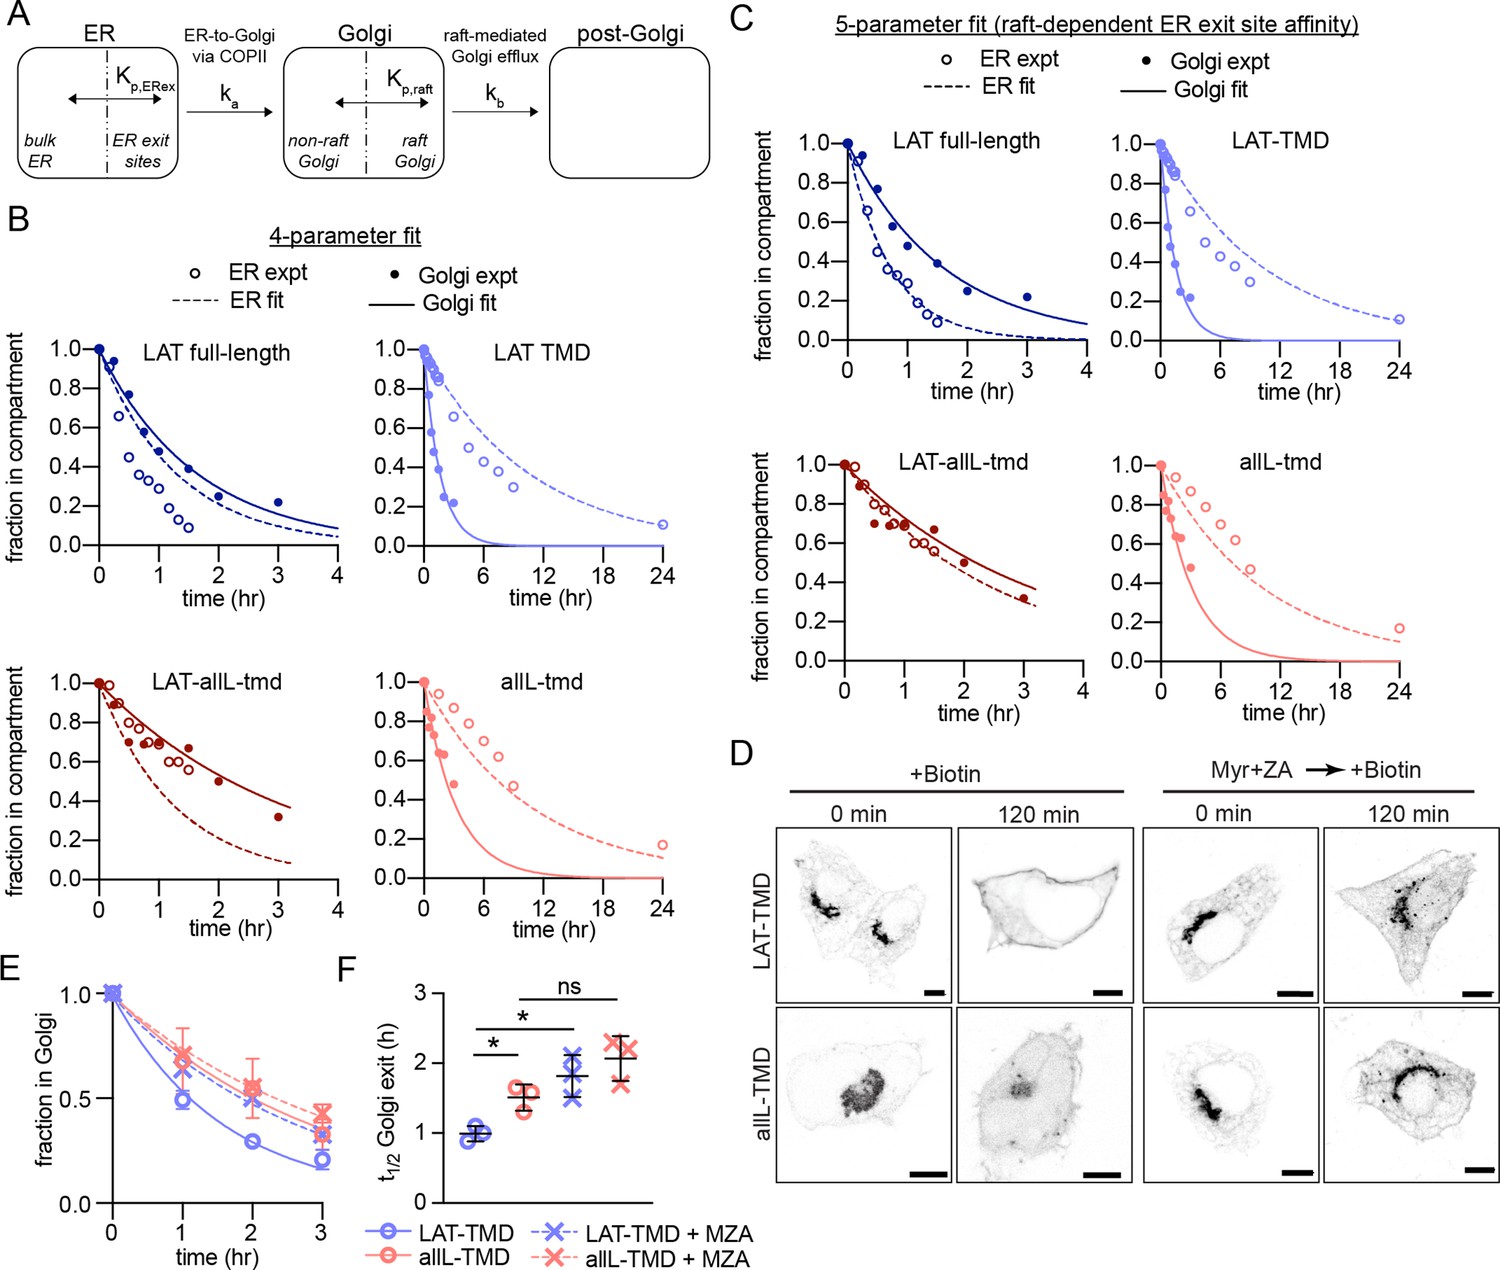
Kinetic model describing secretory traffic of LAT-based constructs.
(A) Schematic of kinetic model. (B) Global fit of model with four free parameters to ER and Golgi RUSH data for four experimental constructs. (C) Global fit of model with five free parameters (different Kp,ERex for LAT and LAT-allL). (D) Representative confocal images of Golgi RUSH experiments show notable Golgi retention for raft-preferring LAT after 2 day pre-treatment with Myr +ZA. Scale bars = 5 μm. (E) Temporal dependence of the fraction of protein constructs remaining in Golgi after biotin addition (to release from Golgi RUSH). Symbols represent average +/-st dev from three independent experiments with >15 cells/exp. (F) Golgi exit rate for the raft-probe LAT-TMD is reduced when raft lipid synthesis is inhibited by Myr-ZA treatment. Points represent t1/2 values of Golgi exit from fits of independent repeats with >20 cells/experiment. **p<0.01, nsp >0.05. Original data quantification can be found in the Source Data files.
-
Figure 4—source data 1
Quantification of the temporal dependence of the fraction of protein constructs remaining in Golgi after biotin addition with and without treatments to abolish raft formation.
- https://cdn.elifesciences.org/articles/89306/elife-89306-fig4-data1-v1.xlsx
-
Figure 4—source data 2
Quantification of the Golgi exit rate when raft lipid synthesis is inhibited by Myr-ZA treatment.
- https://cdn.elifesciences.org/articles/89306/elife-89306-fig4-data2-v1.xlsx
Figure 4—figure supplement 1
Representative images of the experiments measuring ER exit kinetics within individual cells, used for the kinetic modeling.
Images show localization of RUSH constructs within a set of cells after biotin addition. Fraction in ER was quantified by making a mask of the protein at time 0 (i.e. before biotin addition) and calculating the remaining intensity within the mask (relative to total cellular intensity) at each subsequent time point. Top panels show full-length LAT and LAT-allL, bottom panels are LAT-TMD and allL-TMD. Symbols represent average +/-st.dev. from three independent experiments with multiple cells per experiment.
Figure 5
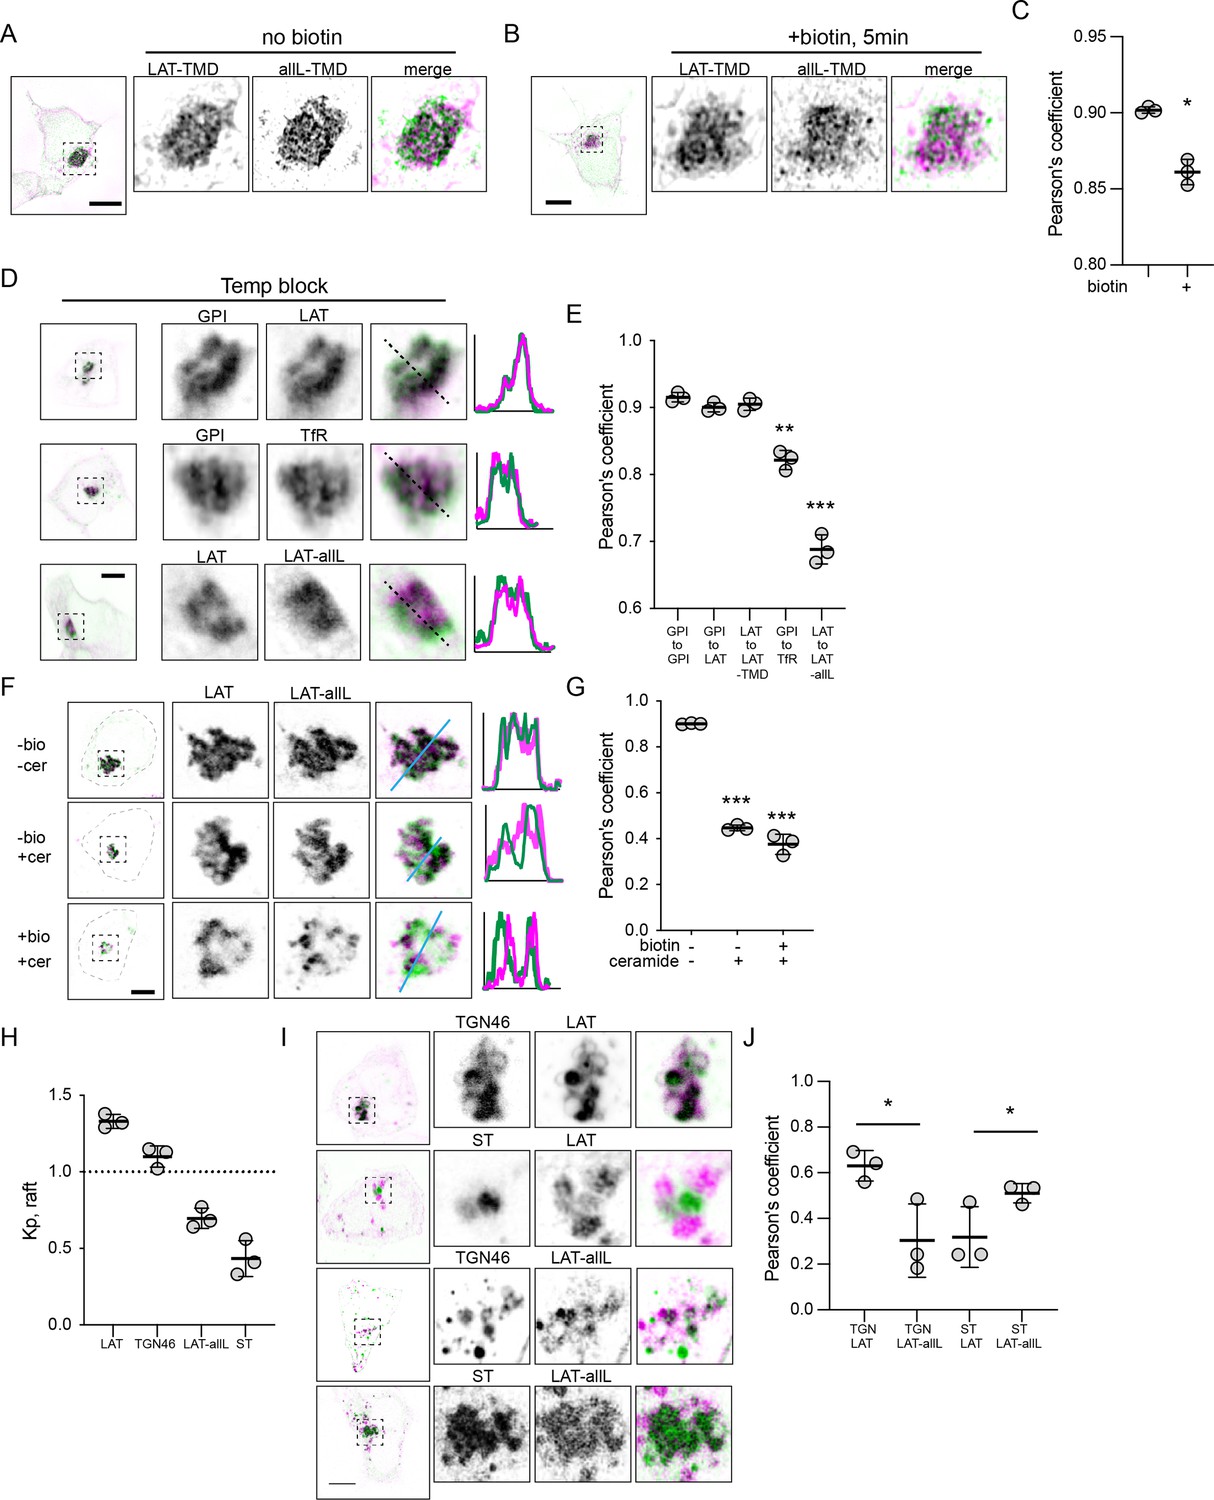
Raft probes segregate from non-raft in Golgi.
(A) Raft vs non-raft probes trapped in Golgi by Golgi-RUSH (i.e. without biotin) and imaged by structured-illumination microscopy (SIM). (B) SIM images of localization of raft vs non-raft probes after 5 min of biotin addition to release Golgi RUSH. (C) Quantification of colocalization from SIM images by Pearson’s coefficient in A and B. Symbols represent average +/-st. dev. from three independent experiments with >15 cells/experiment. (D) Confocal images of cellular localization of co-transfected probes in cells grown at 20 °C to accumulate probes in Golgi. (E) Quantification of colocalization under the conditions represented in D. Significances shown are relative to LAT-to-LAT-TMD. (F) Images of cellular localization of co-transfected Golgi-RUSH probes after treatment with biotin or C6-Cer. (G) Quantification of colocalization under the conditions represented in F. Significances shown are relative to -biotin/-Cer. (H) Quantification of raft affinity (Kp,raft) of TGN46 and ST, representatives of different Golgi sub-compartments. (I) Representative images of raft probes relative to Golgi sub-compartment markers under C6-Cer treatment. (J) Quantification of colocalization of proteins represented in I. Symbols in all quantifications are average +/-st. dev. from three independent experiments with >15 cells/experiment. *p<0.05. Original data quantification can be found in the Source Data files.
-
Figure 5—source data 1
Quantification of colocalization from SIM images by Pearson’s coefficient of raft and non-raft versions in absence or presence of biotin.
- https://cdn.elifesciences.org/articles/89306/elife-89306-fig5-data1-v1.xlsx
-
Figure 5—source data 2
Quantification of colocalization of several proteins after releasing them from the ER and provoke their block in the Golgi by temperature.
- https://cdn.elifesciences.org/articles/89306/elife-89306-fig5-data2-v1.xlsx
-
Figure 5—source data 3
Quantification of the Pearson's coefficient after biotin treatment.
- https://cdn.elifesciences.org/articles/89306/elife-89306-fig5-data3-v1.xlsx
-
Figure 5—source data 4
Quantification of the raft partition coefficients of LAT, TGN46, LAT-allL, and ST.
- https://cdn.elifesciences.org/articles/89306/elife-89306-fig5-data4-v1.xlsx
-
Figure 5—source data 5
Quantification of co-localizations.
- https://cdn.elifesciences.org/articles/89306/elife-89306-fig5-data5-v1.xlsx
Author response image 1
Additional files
-
Supplementary file 1
Raft affinity (Kp,raft) values for constructs used in this study.
- https://cdn.elifesciences.org/articles/89306/elife-89306-supp1-v1.docx
-
MDAR checklist
- https://cdn.elifesciences.org/articles/89306/elife-89306-mdarchecklist1-v1.pdf
Download links
A two-part list of links to download the article, or parts of the article, in various formats.
Downloads (link to download the article as PDF)
Open citations (links to open the citations from this article in various online reference manager services)
Cite this article (links to download the citations from this article in formats compatible with various reference manager tools)
Partitioning to ordered membrane domains regulates the kinetics of secretory traffic
eLife 12:RP89306.
https://doi.org/10.7554/eLife.89306.3


