Suggestion of creatine as a new neurotransmitter by approaches ranging from chemical analysis and biochemistry to electrophysiology
- Laboratory of Neurochemical Biology, PKU-IDG/McGovern Institute for Brain Research, Peking-Tsinghua Center for Life Sciences, School of Life Sciences, Department of Chemical Biology, College of Chemistry and Chemical Engineering, Department of Molecular and Cellular Pharmacology, School of Pharmaceutical Sciences, Peking University, China
- Chinese Institute for Brain Research (CIBR), China
- Chinese Institutes of Medical Research, Capital Medical University, China
- Changping Laboratory, Yard 28, Science Park Road, Changping District, China
- Institute of Molecular Physiology, Shenzhen Bay Laboratory, China
- Research Unit of Medical Neurobiology, Chinese Academy of Medical Sciences, China
Figures
Figure 1 with 2 supplements

Presence of creatine (Cr) in synaptic vesicles (SVs) from the mouse brain.
(A) Representative raw traces from capillary electrophoresis-mass spectrometry (CE-MS) of indicated molecules from samples immunoisolated by the control immunoglobulin G (IgG) (blue) at 0–2°C, the monoclonal anti-synaptophysin (anti-Syp) antibody at 0–2°C (red), and the anti-Syp antibody at room temperature (RT, green). Q1/Q3 for identifying targets are indicated. (B–G) Quantification of the amounts of indicated molecules. The amount of a molecule was divided by the amount of the anti-Syp antibody bound to magnetic beads. Note glutamate (Glu) (B), gamma-aminobutyric acid (GABA)(C), acetylcholine (ACh) (D), 5-hydroxytryptamine (5-HT) (E), Cr (F), but not alanine (G) was higher in SVs pulled down by the anti-Syp antibody at 0–2°C than those pulled down by the IgG control or those pulled down at the RT. n = 10 (B–E, G) or 14 (F) samples per group, *** p<0.001, ns, not significant. One-way ANOVA with Tukey’s correction.
-
Figure 1—source data 1
Data for Figure 1B-G.
- https://cdn.elifesciences.org/articles/89317/elife-89317-fig1-data1-v1.xlsx
Figure 1—figure supplement 1
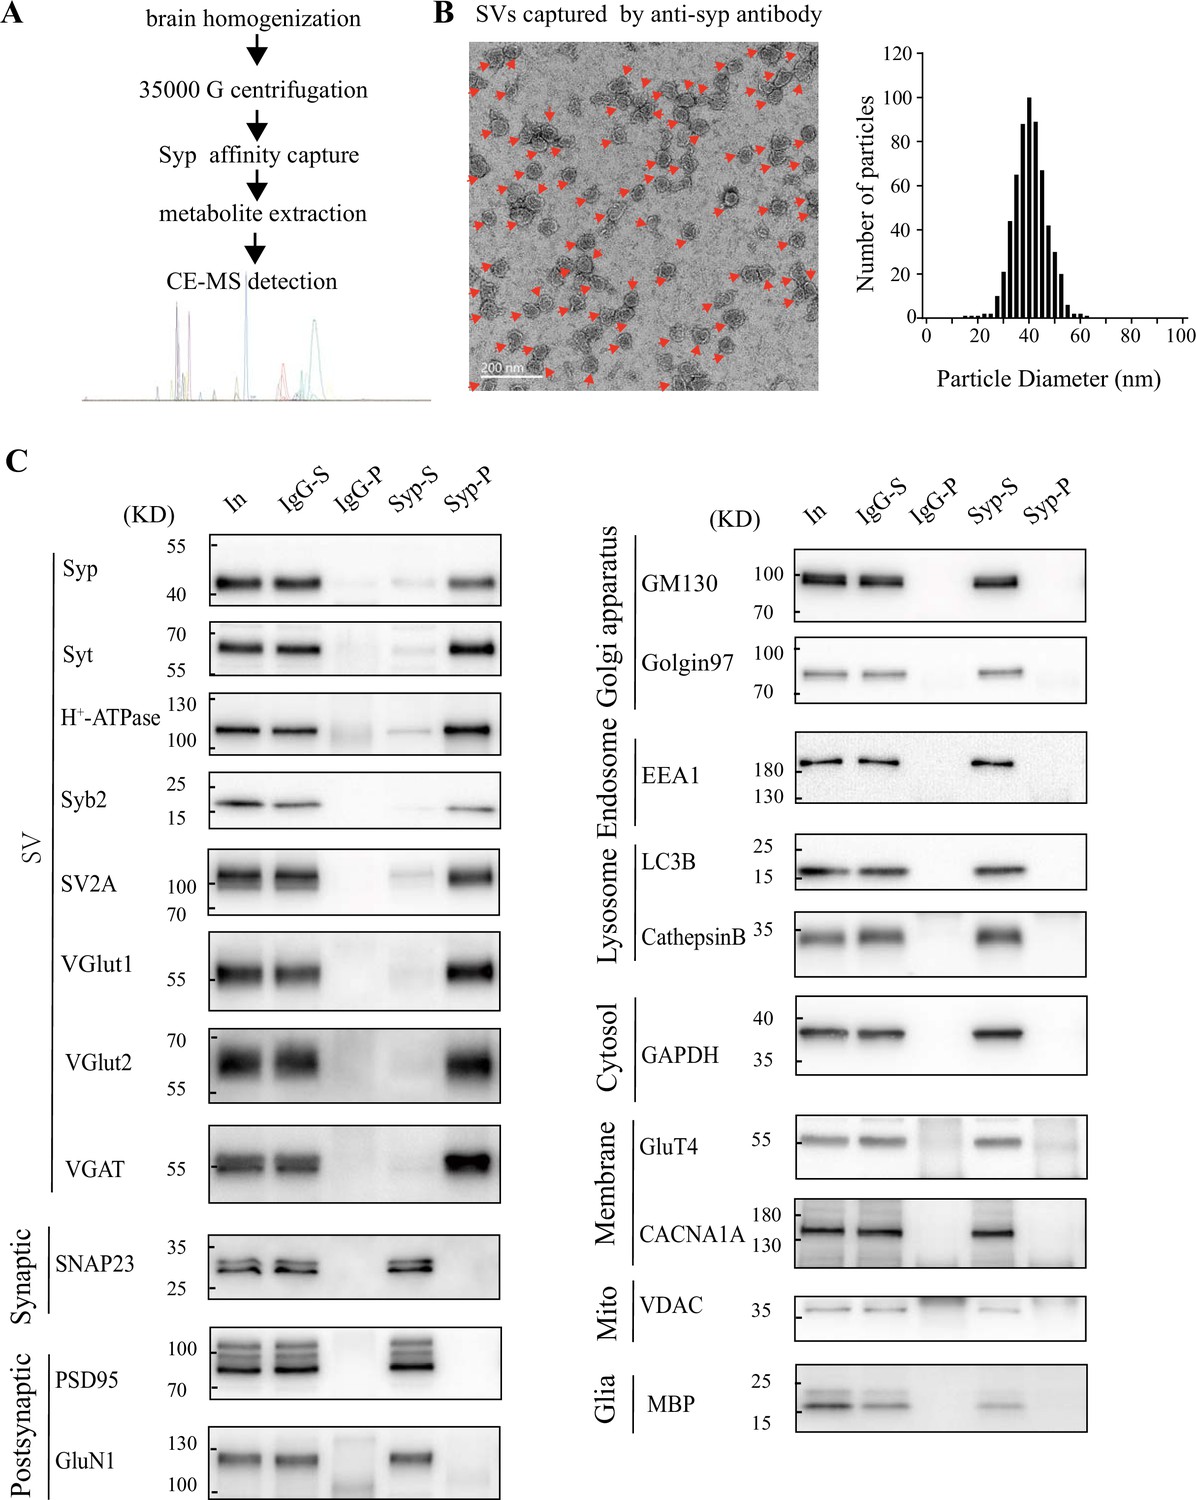
Validation of synaptic vesicle (SV) purification from the mouse brain.
(A) A diagram for SV purification and SV content analysis. Brain homogenates were centrifugated at 35,000 × g for 25 min and supernatants containing SVs were collected as the starting material. Following immunopurification by the anti-Syn antibody, SVs were broken by water to release their contents. Metabolites were analyzed by capillary electrophoresis-mass spectrometry (CE-MS). (B) Electronic microscopy (EM) of SVs captured by the anti-Syn antibody. Arrows point to SVs, the size each being 40.4 ± 0.26 nm, with size distribution shown on the right. (C) Analysis of SV purity by immunoblotting. Markers for SVs (Syp, syt, H+-ATPase, syb2, SV2A, VGLU1, VGLU2 and VGAT) were effectively pulled down by beads coated with the anti-Syn antibody but not by those coated with immunoglobulin G (IgG). Non-SV markers present in supernatants, including those for the lysosome (LAMP1, cathepasinB, LC3B), the Golgi apparatus (GM130, Golgi 97), the early endosome (EEA1), the cytoplasma (GAPDH), synaptic membrane (SNAP23) and postsynaptic components (PSD95, GluN1), the mitochondria (VDAC), the cytoplasmic membrane (CACNA1A), axonal membrane (GluT4), and glia membrane (MBP), could not be pulled down by either the anti-Syp antibody or IgG.
-
Figure 1—figure supplement 1—source data 1
Particle diameter of SVs for Figure 1—figure supplement 1B.
- https://cdn.elifesciences.org/articles/89317/elife-89317-fig1-figsupp1-data1-v1.xlsx
-
Figure 1—figure supplement 1—source data 2
Original western blot files for Figure 1—figure supplement 1C.
- https://cdn.elifesciences.org/articles/89317/elife-89317-fig1-figsupp1-data2-v1.zip
-
Figure 1—figure supplement 1—source data 3
Labelled western blot files for Figure 1—figure supplement 1C.
- https://cdn.elifesciences.org/articles/89317/elife-89317-fig1-figsupp1-data3-v1.zip
Figure 1—figure supplement 2
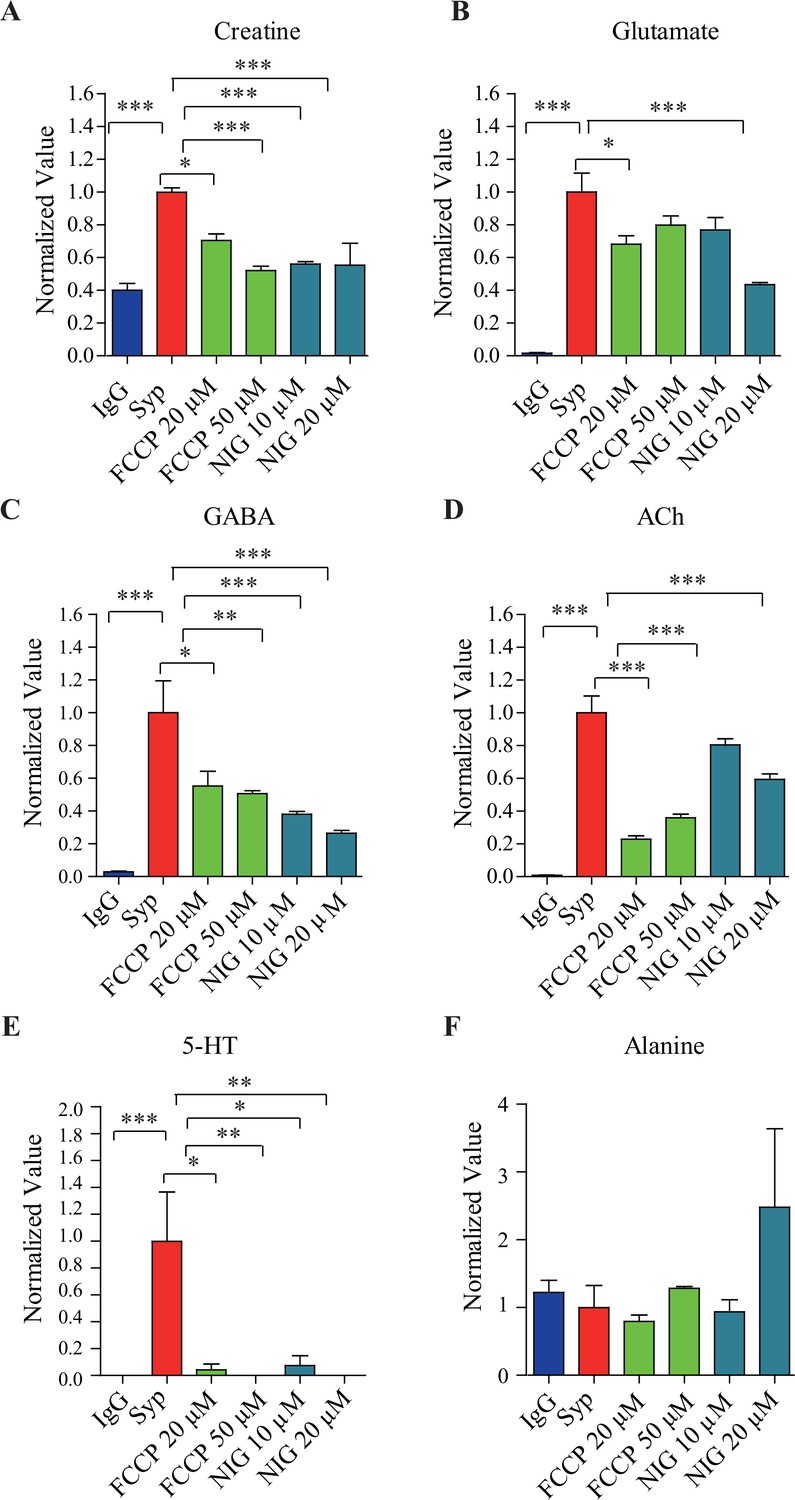
Effects of pharmacological inhibitors on synaptic vesicle (SV) contents.
(A) Creatine (Cr), (B) glutamate (Glu) ,(C) gamma-aminobutyric acid (GABA), (D) acetylcholine (ACh), (E) 5-hydroxytryptamine (5-HT), and (F) alanine. *p<0.5, **p<0.05, ***p<0.01, one-way ANOVA with Tukey’s correction (n = 4 per group). Data were normalized to average amount of molecules pulled down by the anti-Syp antibody. NIG, nigericin.
-
Figure 1—figure supplement 2—source data 1
Data for Figure 1—figure supplement 2A–E.
- https://cdn.elifesciences.org/articles/89317/elife-89317-fig1-figsupp2-data1-v1.xlsx
Figure 2 with 4 supplements
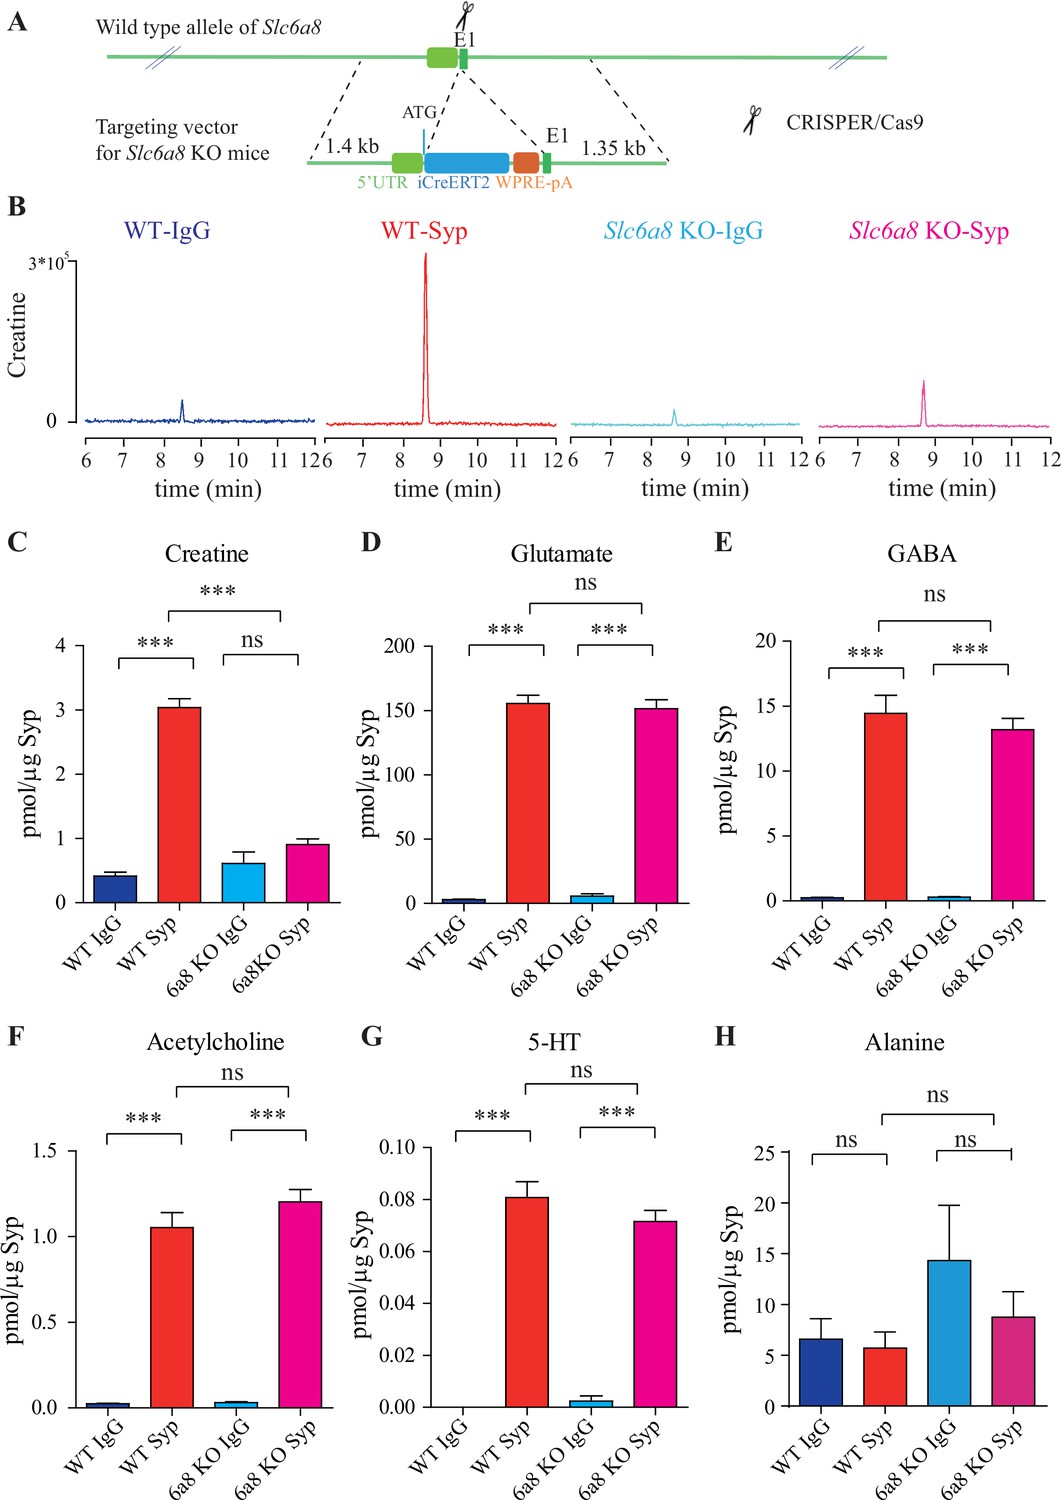
Slc6a8 and creatine (Cr) in synaptic vesicles (SVs).
(A) A schematic illustration of the strategy for generating Slc6a8 knockouts using CRISPR/Cas9. An iCreERT2-WPRE-pA cassette (~3.5 kb) was inserted immediately downstream of ATG in the Slc6a8 gene, substituting bp 4 to bp 51 in exon 1 (E1). (B) Representative raw traces of Cr immunoisolated by control immunoglobulin G (IgG) from WT mice (blue), the anti-synaptophysin (anti-Syp) antibody from WT mice (red), IgG from Slc6a8 KO mice (blue), and the anti-Syp antibody from Slc6a8 KO mice (red). (C–H) Quantification of indicated molecules. Note the selective reduction of Cr in SVs from Slc6a8 KO mice. n = 14 samples per group. ***p<0.001, ns, not significant. One-way ANOVA with Tukey’s correction.
-
Figure 2—source data 1
Data for Figure 2C–H.
- https://cdn.elifesciences.org/articles/89317/elife-89317-fig2-data1-v1.xlsx
Figure 2—figure supplement 1
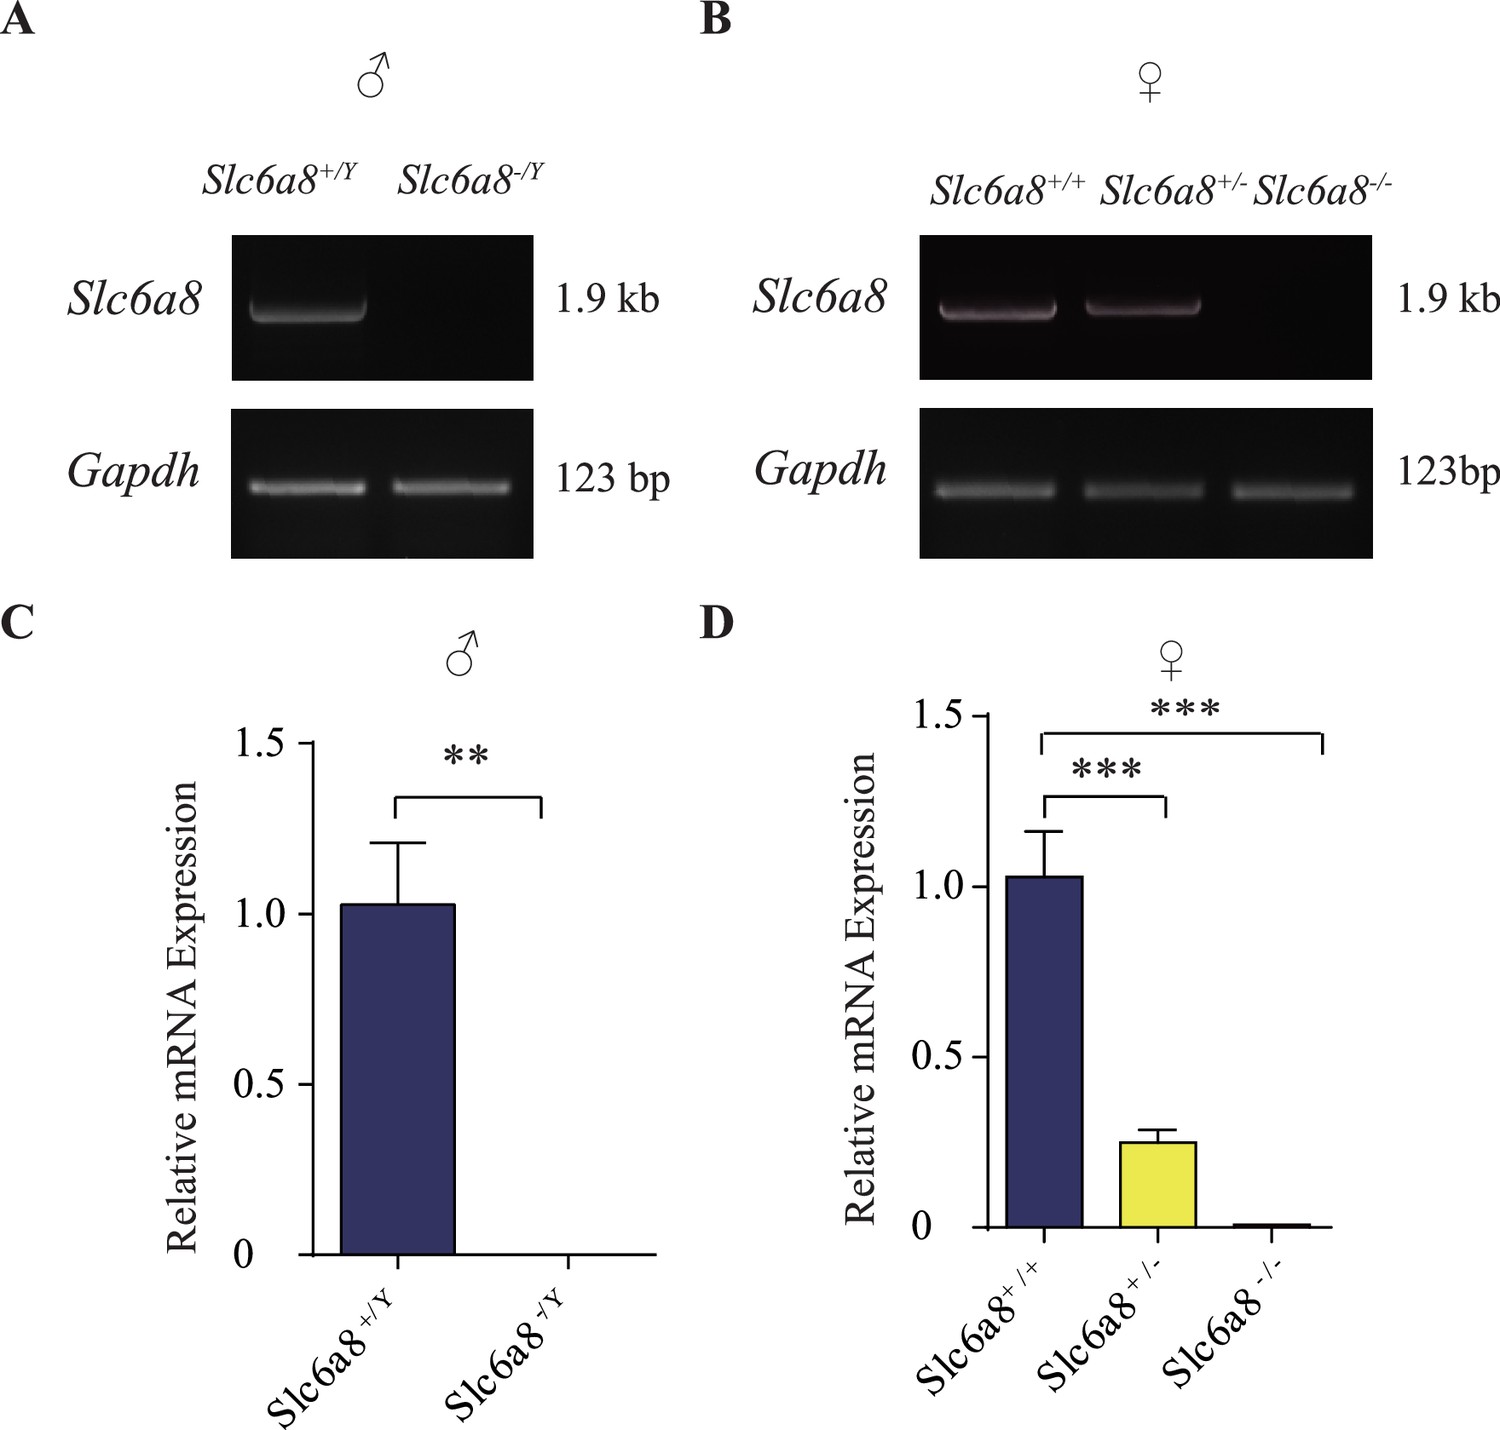
Validation of SLC6A8 knockout mice.
(A) Reverse polymerase chain reaction (RT-PCR) analysis of full-length coding sequences showing absence of Slc6a8 mRNA expression in brains from hemizygous (Slc6a8-/Y) male knockout mice. GAPDH serves as the control. (B) Detection of Slc6a8 mRNA expression in female mice, showing reduced expression in heterozygous (Slc6a8+/-) and loss of Slc6a8 expression in homozygous (Slc6a8-/-) knockout mice. (C, D) Quantitative RT-PCR analysis. The average values of Slc6a8 mRNA/Gapdh in WT mice (Slc6a8+/Y males in C and Slc6a8+/+ females in D) were set to 1. **p<0.01 in (C), Student’s t-test. *** in (D), p<0.001, one-way ANOVA with Tukey’s correction (n = 4 mice per group, with three repeats for each mice).
-
Figure 2—figure supplement 1—source data 1
Original gels for Figure 2—figure supplement 1A and B.
- https://cdn.elifesciences.org/articles/89317/elife-89317-fig2-figsupp1-data1-v1.zip
-
Figure 2—figure supplement 1—source data 2
Labelled gels for Figure 2—figure supplement 1A and B.
- https://cdn.elifesciences.org/articles/89317/elife-89317-fig2-figsupp1-data2-v1.zip
-
Figure 2—figure supplement 1—source data 3
Data for Figure 2—figure supplement 1C and D.
- https://cdn.elifesciences.org/articles/89317/elife-89317-fig2-figsupp1-data3-v1.xlsx
Figure 2—figure supplement 2
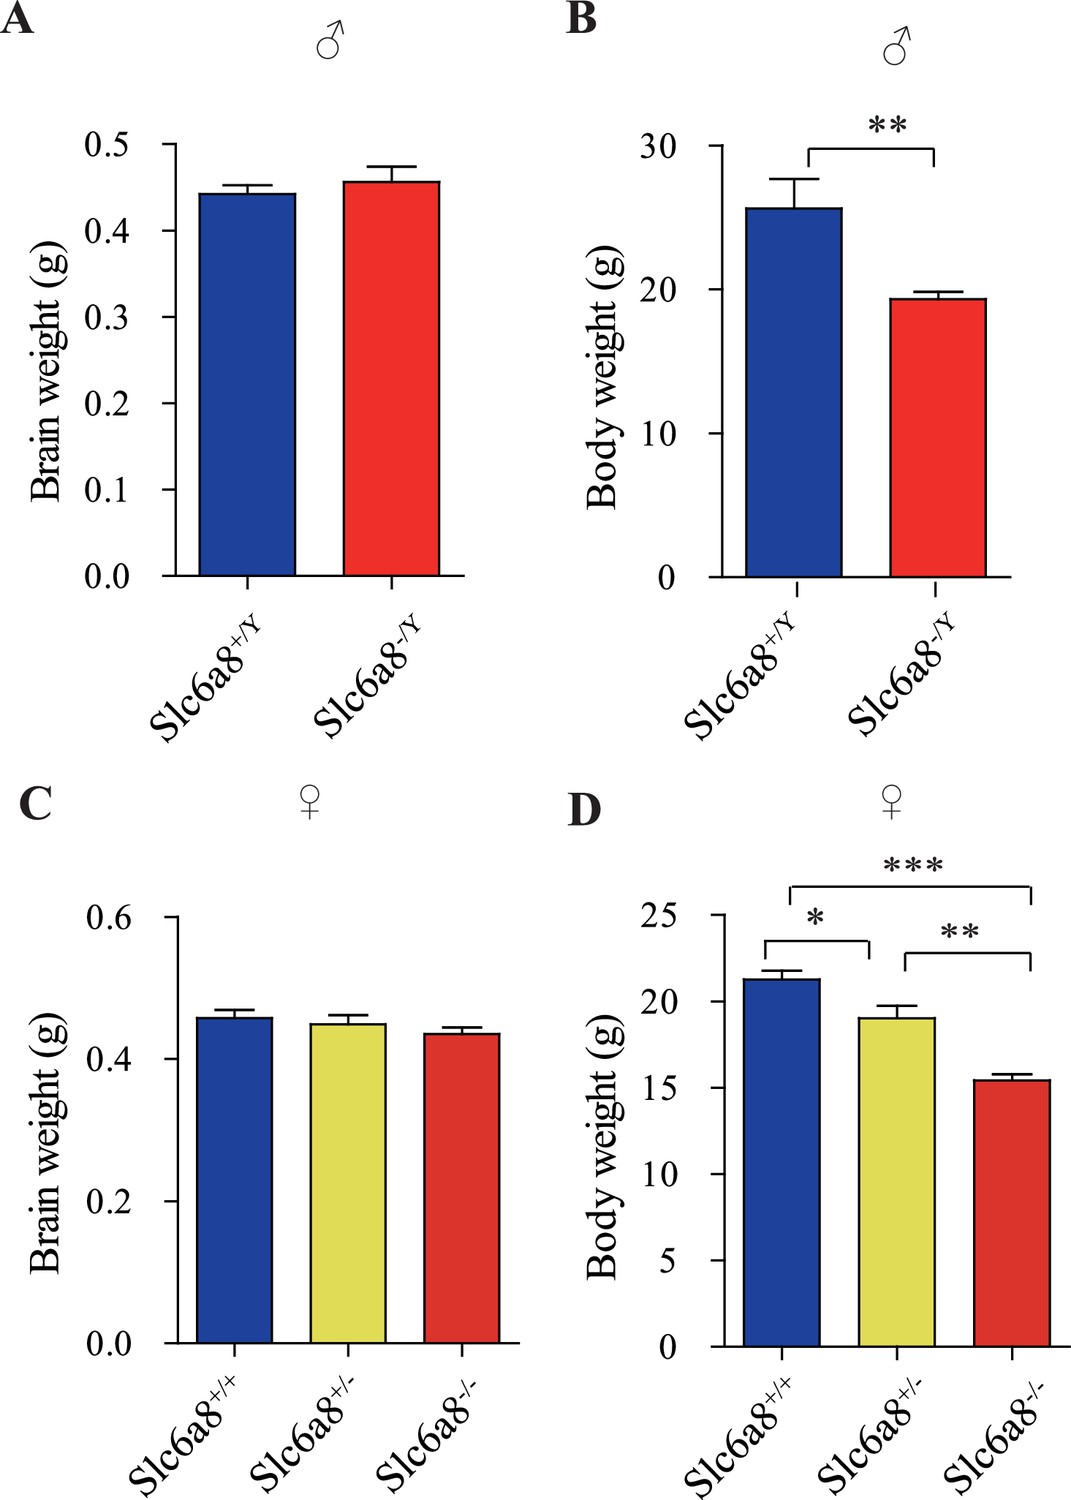
Brain and body weights of Slc6a8 knockout mice.
(A) Brain weights of male mice. (B) Body weights of male mice. (C) Brain weight of female mice. (D) Body weights of female mice. **p<0.01 in (B), Student’s t-test. *p<0.05, **p<0.01, *** in (E), p<0.001, one-way ANOVA with Tukey’s correction (n = 5 mice per group, 7 weeks old).
-
Figure 2—figure supplement 2—source data 1
Data for Figure 2—figure supplement 2A–D.
- https://cdn.elifesciences.org/articles/89317/elife-89317-fig2-figsupp2-data1-v1.xlsx
Figure 2—figure supplement 3
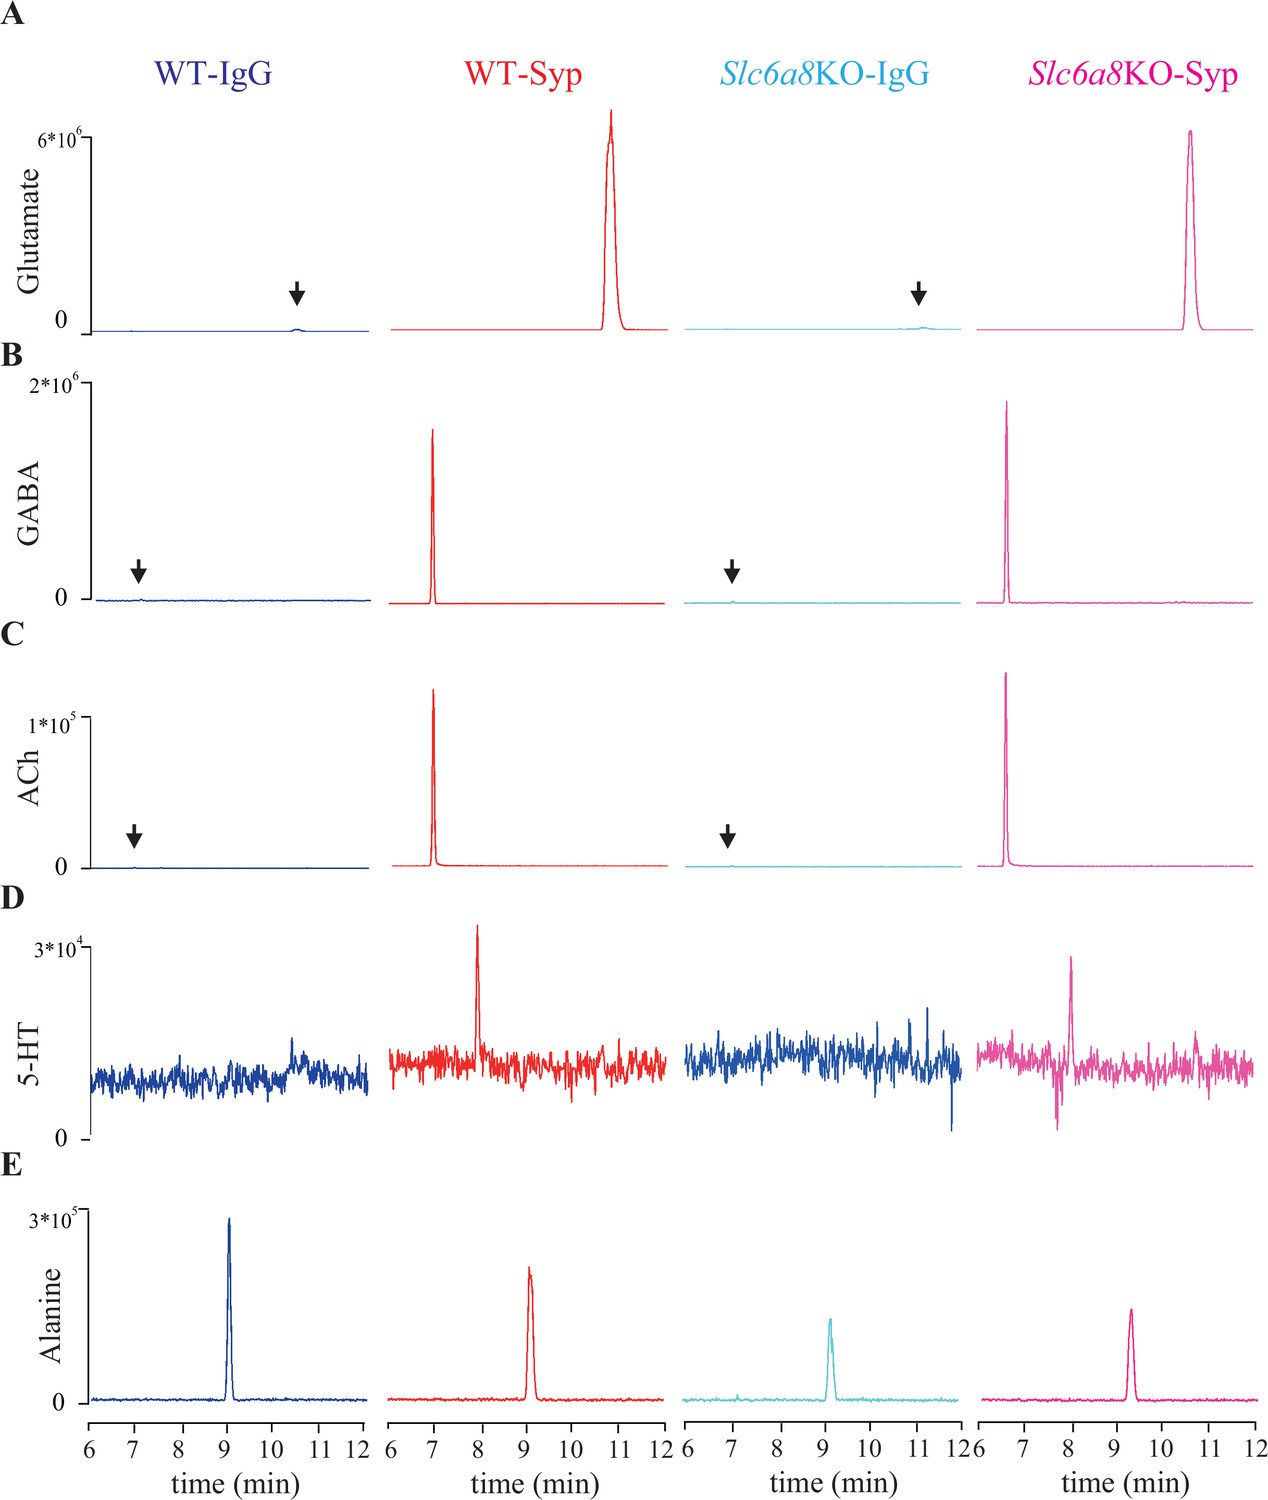
Representative capillary electrophoresis-mass spectrometry (CE-MS) data of molecules.
(A–E) Molecules pull-down from WT mice by immunoglobulin G (WT-IgG), anti-synaptophysin antibody (WT-Syp), and those from knockout mice (Slc6a8 KO-IgG, Slc6a8 KO-Syp). (A) Glutamate (Glu). (B) Gamma-aminobutyric acid (GABA). (C) Acetylcholine (ACh). (D) 5-Hydroxytryptamine (5-HT). (E) Alanine. Vertical: signal amplitude; abscissa: retention time.
Figure 2—figure supplement 4
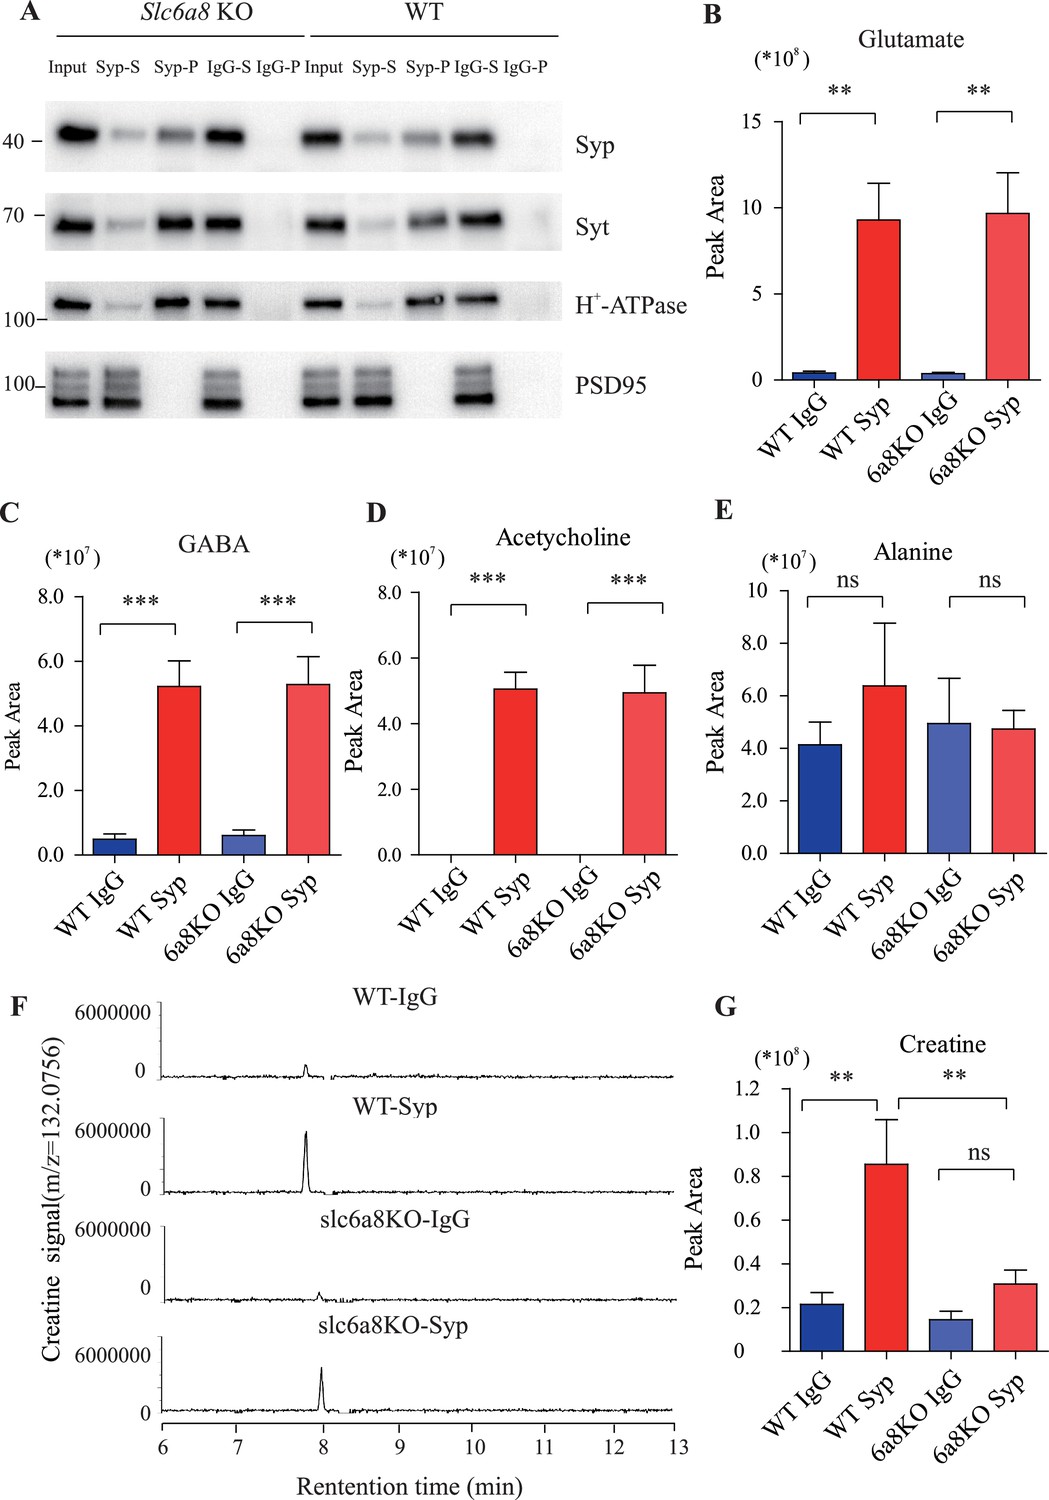
Proteins and small molecules detected in synaptic vesicles (SVs) from WT and Slc6a8 KO mice.
(A) Immunoblotting analysis of SV markers synaptophysin (Syp), syt, H-ATPase, and postsynaptic components (PSD95). (B–D) Peak areas of capillary electrophoresis-mass spectrometry (CE-MS) signals for neurotransmitters: glutamate (Glu), gamma-aminobutyric acid (GABA), and acetylcholine (ACh). These neurotransmitters are enriched in SVs and not affected by Slc6a8 genotypes. (E) Alanine was not enriched in SVs of either WT or Slc6a8 KO mice. (F) Representative raw example traces of creatine (Cr). (G) Cr in SVs was lower in Slc6a8 KO mice than that in WT mice. **p<0.01, ***p<0.001, one-way ANOVA with Tukey’s correction (n = 8 samples per group).
-
Figure 2—figure supplement 4—source data 1
Original western blot files for Figure 2—figure supplement 4A.
- https://cdn.elifesciences.org/articles/89317/elife-89317-fig2-figsupp4-data1-v1.zip
-
Figure 2—figure supplement 4—source data 2
Labelled western blot files for Figure 2—figure supplement 4A.
- https://cdn.elifesciences.org/articles/89317/elife-89317-fig2-figsupp4-data2-v1.zip
-
Figure 2—figure supplement 4—source data 3
Data for Figure 2—figure supplement 4B–E, and G.
- https://cdn.elifesciences.org/articles/89317/elife-89317-fig2-figsupp4-data3-v1.xlsx
Figure 3 with 3 supplements
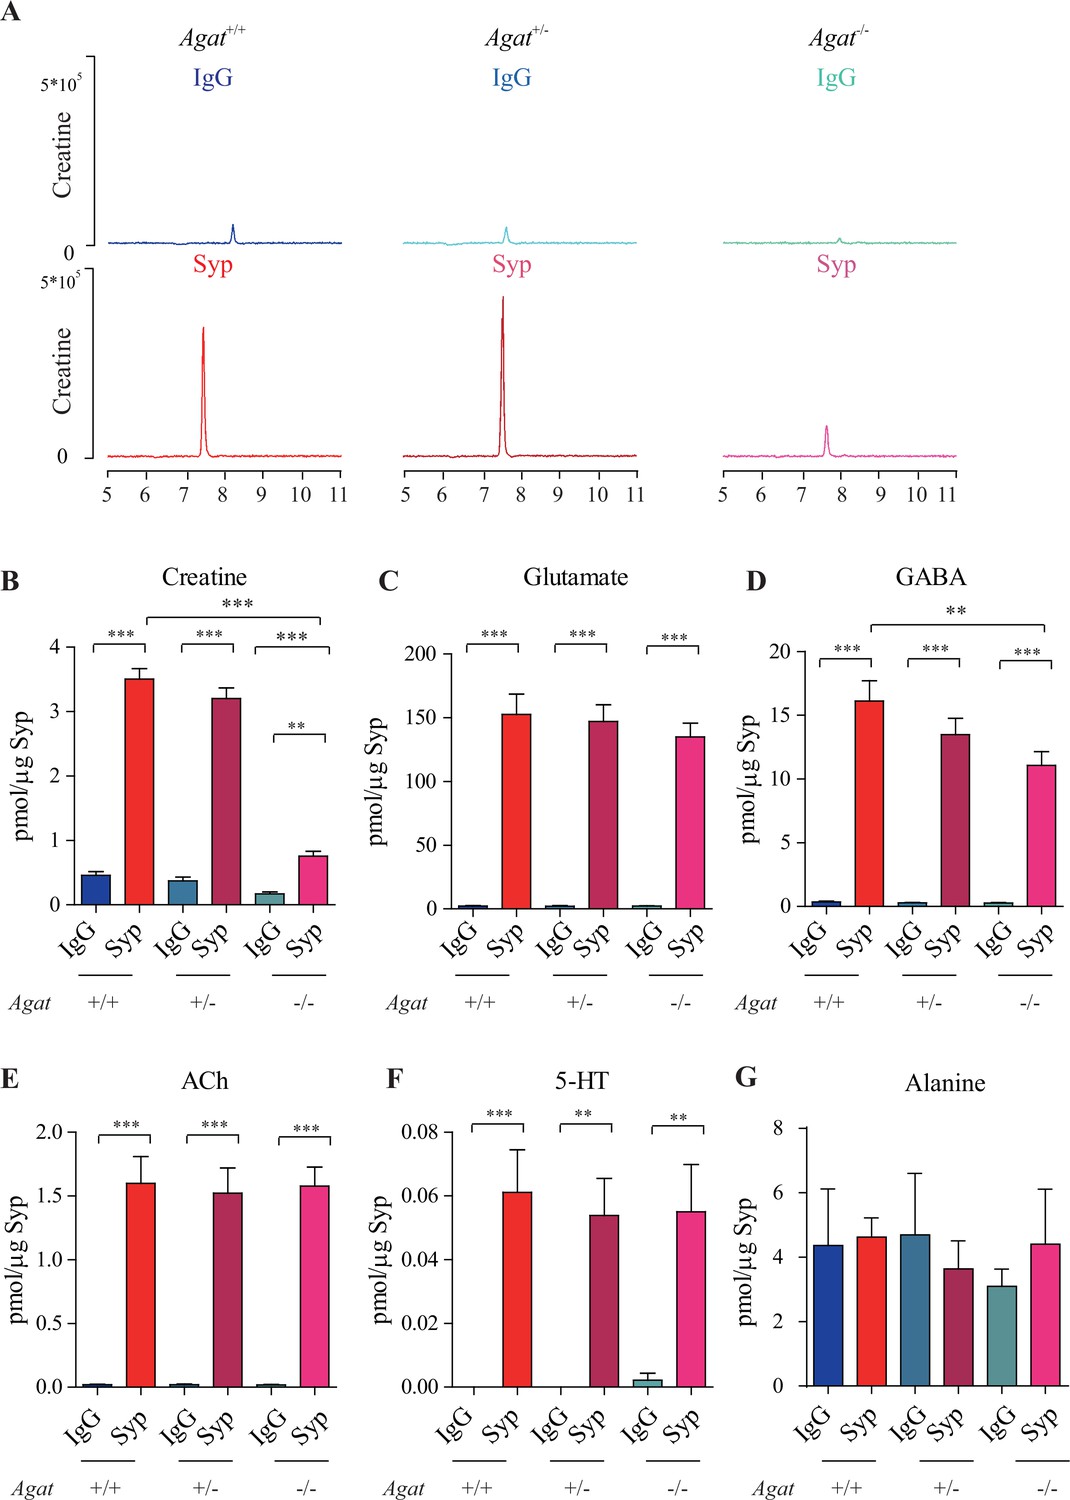
Reduction of synaptic vesicle (SV) creatine (Cr) in Agat knockout mice.
(A) Representative raw traces of Cr, pulled down by immunoglobulin G (IgG) or anti-synaptophysin (anti-Syp) from Agat+/+, Agat +/-, and Agat-/- mice. (B–G) Quantification of indicated molecules. Cr was significantly decreased in Agat-/- mice compared to Cr in Agat+/+ or Agat +/- mice (B). Gamma-aminobutyric acid (GABA) was significantly decreased in SVs from Agat-/- mice compared to Agat+/+ mice (D) but the difference was smaller than that of Cr. Glutamate (Glu) (C), acetylcholine (ACh) (E), 5-hydroxytryptamine (5-HT) (F), and alanine was not different among Agat+/+, Agat +/-, and Agat-/-mice. n = 10 samples per group. ***p<0.001, ns, not significant. One-way ANOVA with Tukey’s correction.
-
Figure 3—source data 1
Data for Figure 3B–G.
- https://cdn.elifesciences.org/articles/89317/elife-89317-fig3-data1-v1.xlsx
Figure 3—figure supplement 1
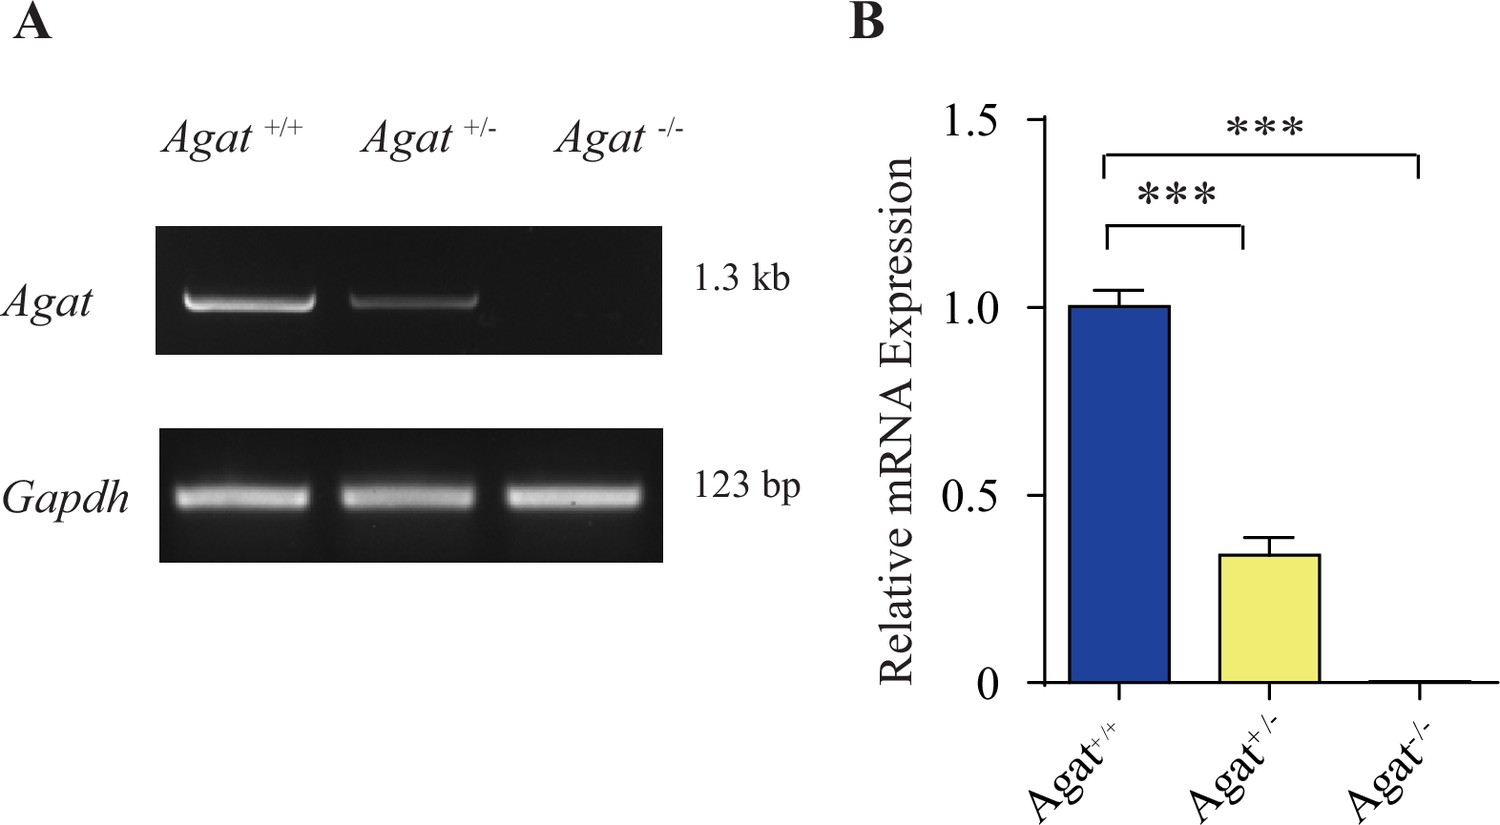
Validation Agat-KO first mice.
(A) Reverse polymerase chain reaction (RT-PCR) analysis of the entire coding region showing the absence of Agat mRNA in Agat-/- mice and decreased expression in Agat+/-. (B) Quantitative RT-PCR analysis. ***p<0.001, one-way ANOVA with Tukey’s correction (n = 4 mice per group, with three repeats for each mice).
-
Figure 3—figure supplement 1—source data 1
Original gels for Figure 3—figure supplement 1A.
- https://cdn.elifesciences.org/articles/89317/elife-89317-fig3-figsupp1-data1-v1.zip
-
Figure 3—figure supplement 1—source data 2
Labelled gels for Figure 3—figure supplement 1A.
- https://cdn.elifesciences.org/articles/89317/elife-89317-fig3-figsupp1-data2-v1.zip
-
Figure 3—figure supplement 1—source data 3
Data for Figure 3—figure supplement 1B.
- https://cdn.elifesciences.org/articles/89317/elife-89317-fig3-figsupp1-data3-v1.xlsx
Figure 3—figure supplement 2

Brain and body weights of Agat+/+, Agat+/-, and Agat-/- mice.
(A) Brain weights of male mice. (B) Body weights of male mice. *p<0.05, ***p<0.001, one-way ANOVA with Tukey’s correction, ns, not significant (n = 5 mice per group, 7 wk).
-
Figure 3—figure supplement 2—source data 1
Data for Figure 3—figure supplement 2A and B.
- https://cdn.elifesciences.org/articles/89317/elife-89317-fig3-figsupp2-data1-v1.xlsx
Figure 3—figure supplement 3
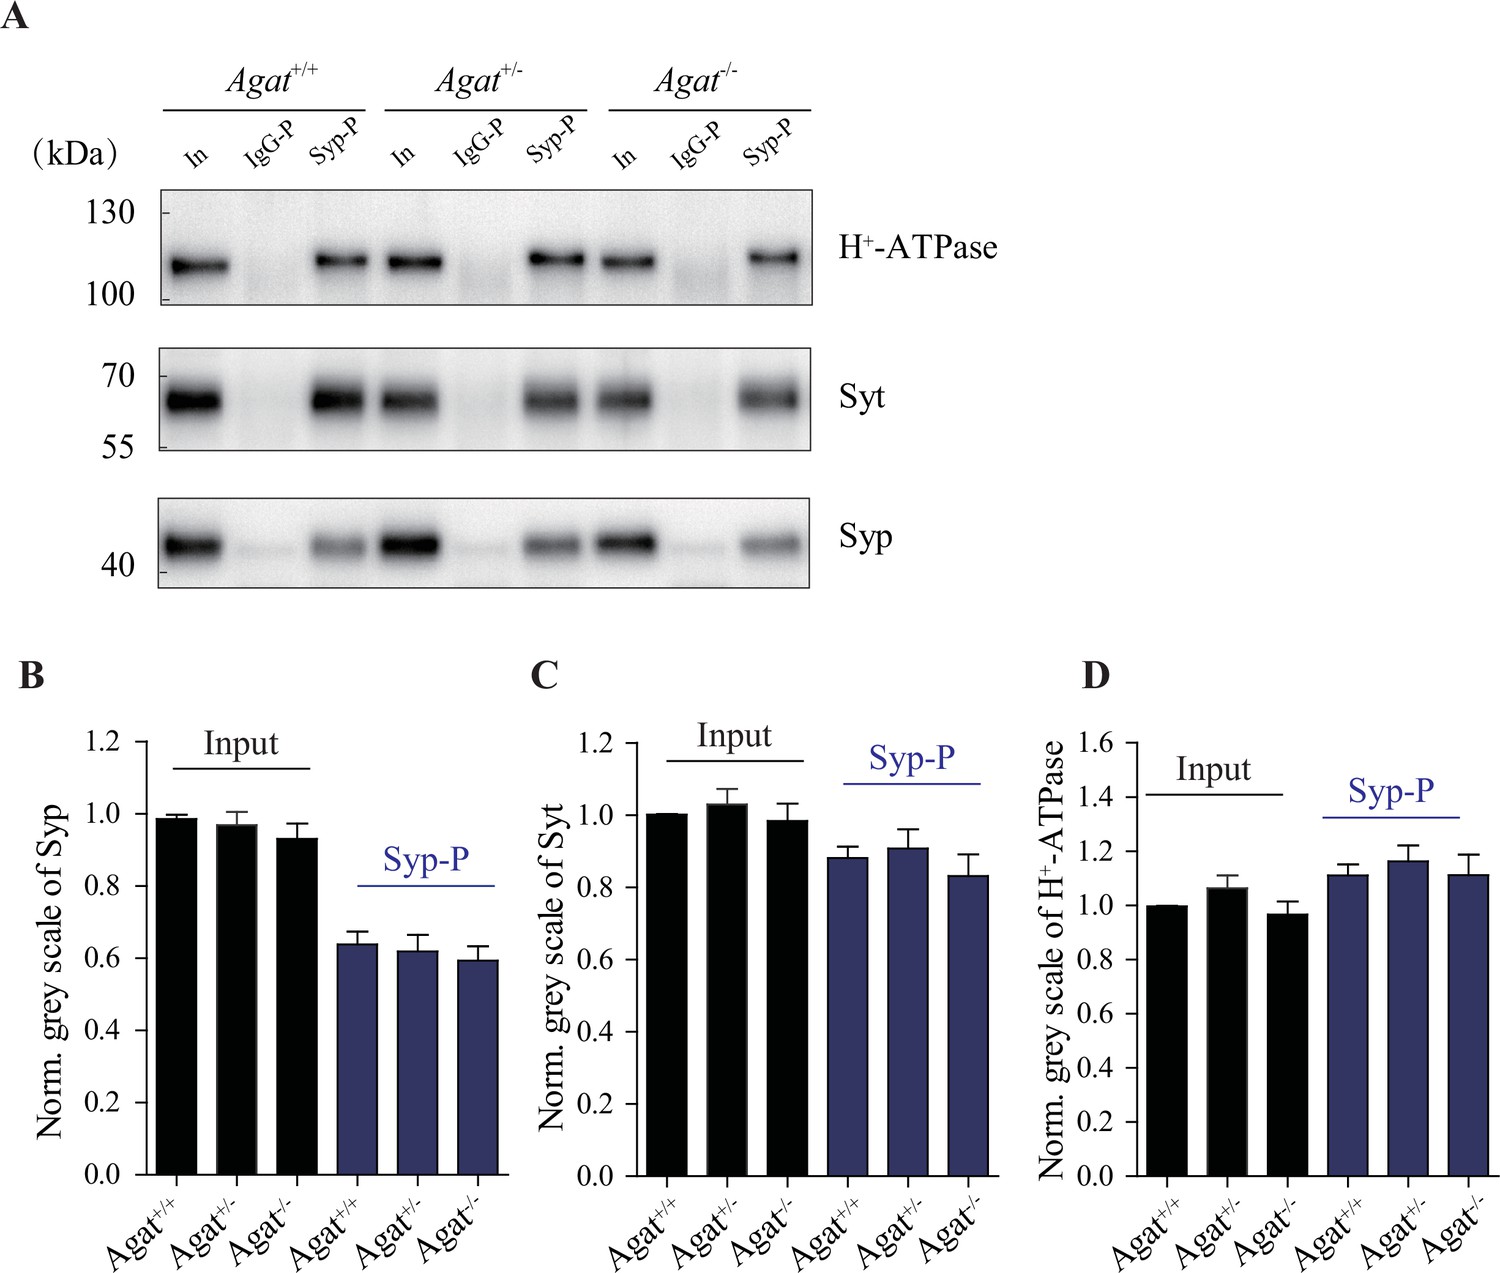
Similar amounts of synaptic vesicles (SVs) pulled down from Agat+/+, Agat+/-, and Agat-/- mice.
(A) Representative western analysis of SV markers H+-ATPase, Syt, and synaptophysin (Syp) from input, samples pulled down by immunoglobulin G (IgG) (IgG-P) and anti-Syp antibody (Syp-P). (B–D) Quantification of protein band densities for Syp (B), Syt (C), and H+-ATPase (D) (+/- = 20 per group).
-
Figure 3—figure supplement 3—source data 1
Original western blot files for Figure 3—figure supplement 3A.
- https://cdn.elifesciences.org/articles/89317/elife-89317-fig3-figsupp3-data1-v1.zip
-
Figure 3—figure supplement 3—source data 2
Labelled western blot files for Figure 3—figure supplement 3A.
- https://cdn.elifesciences.org/articles/89317/elife-89317-fig3-figsupp3-data2-v1.zip
-
Figure 3—figure supplement 3—source data 3
Data for Figure 3—figure supplement 3B–D.
- https://cdn.elifesciences.org/articles/89317/elife-89317-fig3-figsupp3-data3-v1.xlsx
Figure 4
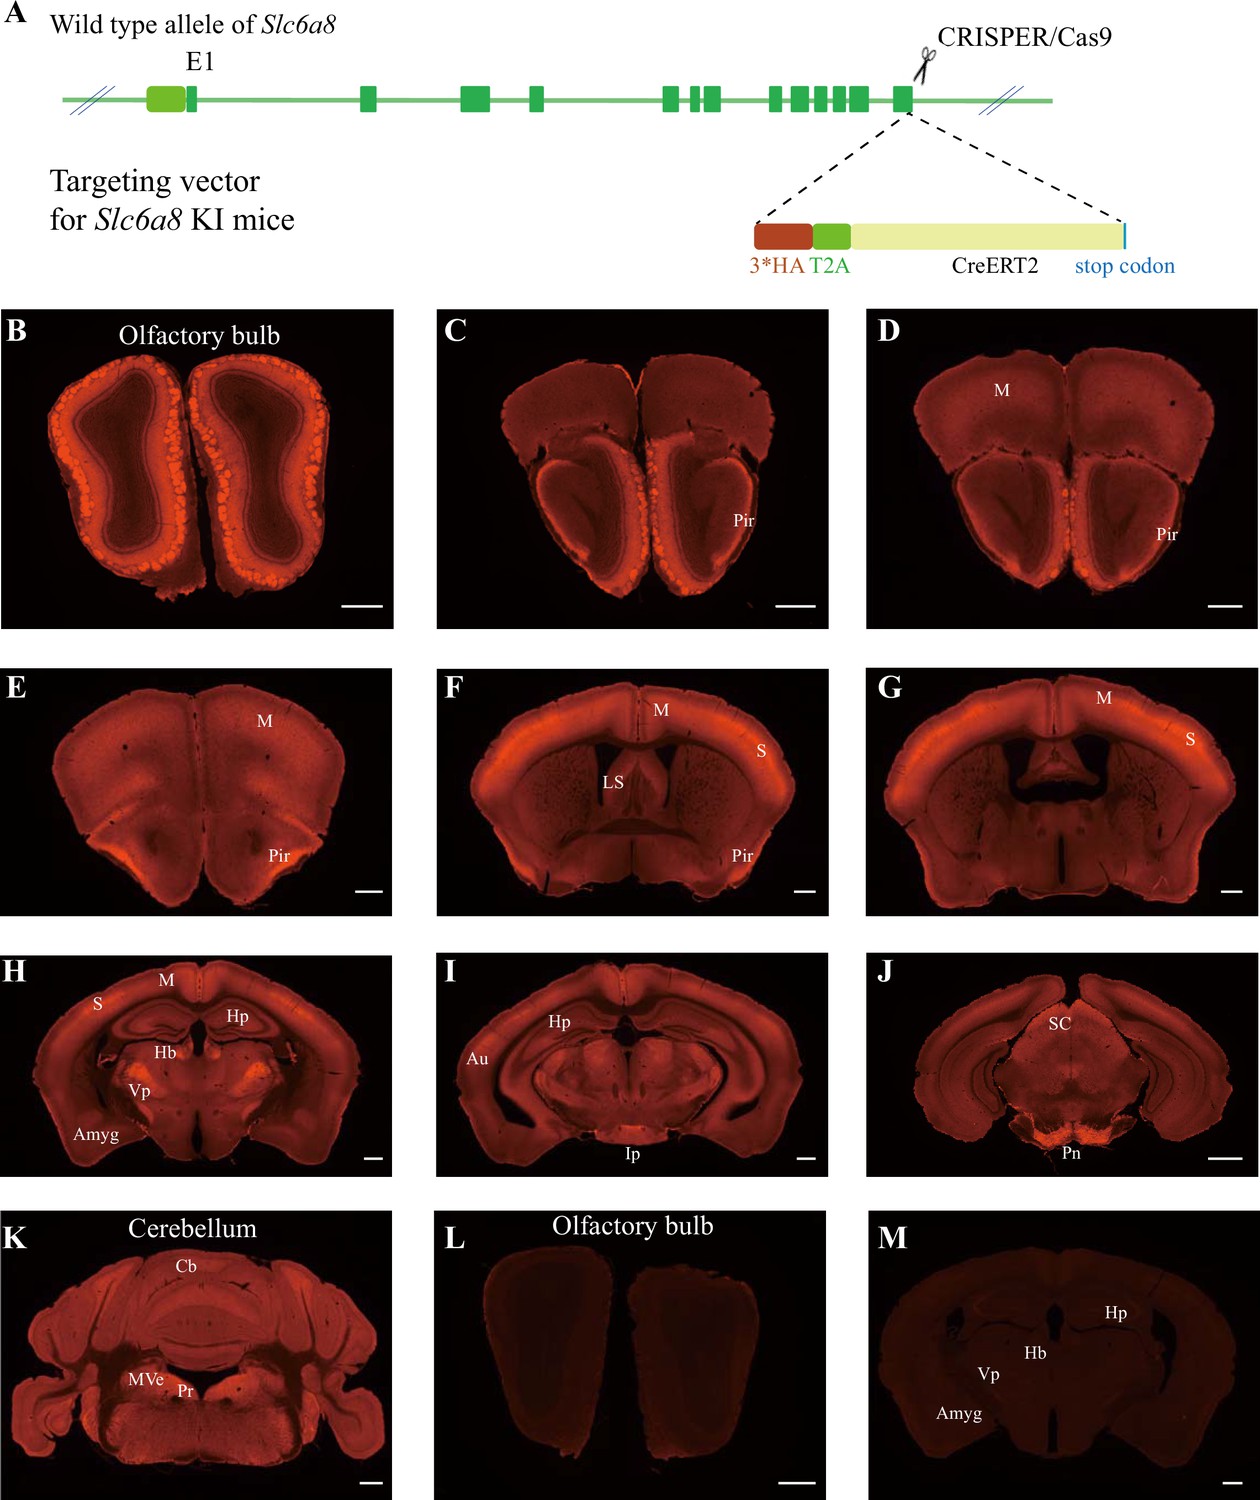
Expression pattern of SLC6a8.
(A) A diagram illustrating the generation of Slc6a8HA KI mice. 3*HA, T2A, and CreERT2 were inserted in-frame, before the stop codon, to the C terminus of SLC6A8 protein. (B–K) Low-magnification photomicrographs of coronal sections immunohistochemically labeled with the anti-HA antibody in Slc6a8HA mice. (I, M) immunostaining with the anti-HA antibody in control WT mice. Pir, piriform cortex; M, motor cortex; LS, lateral septum; Hp, hippocampus; Hb, habenular nucleus; Vp, ventral posterior nucleus of thalamus; Auauditory cortex; Amyg, amygdala; Ip, interpeduncular nucleus; Pn, pontine nucleus; Cb, cerebellum; Pr, prepositus; SC, superior colliculus; MVe, medial vestibular nucleus. Scale bar: 500 μm.
Figure 5
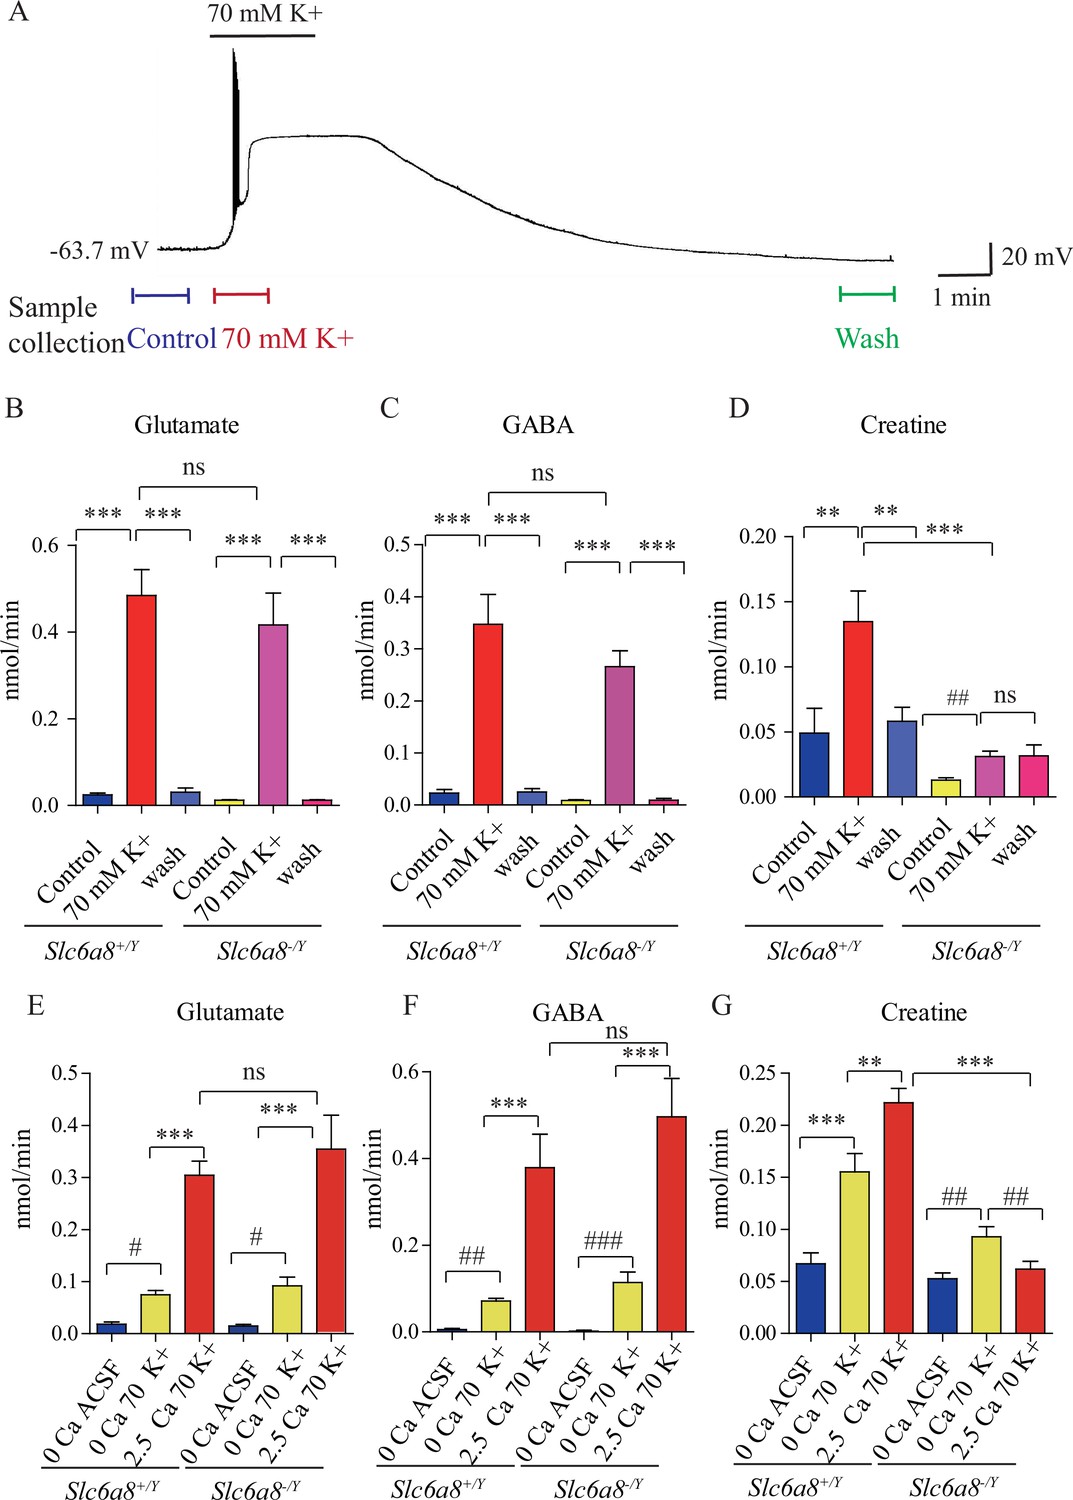
Creatine (Cr) release in brain slices from WT and Slc6a8 knockout mice.
(A) Neuronal depolarization induced by 70 mM K+ and time points for collecting the release sample. ‘Control’ samples were collected 1.5 min to 0.5 min before K+ stimulation, ‘70 mM K+’ artificial cerebrospinal fluid (ACSF) samples were collected during 70 mM K+ stimulation, and ‘wash’ samples were collected 10 min after washout with ACSF. Efflux of glutamate (Glu) (B), gamma-aminobutyric acid (GABA) (C), or Cr (D) from WT or Slc6a8 KO male mice (n = 7 samples per group). Note that a small amount of Cr released in Slc6a8 KO mice did not return to the baseline after 10 min of washing. (E–G) Ca2+-dependent release of Glu, GABA, and Cr in WT and Slc6a8 KO mice (n = 5 samples per group). ***p<0.001, ns, not significant. One-way ANOVA with Tukey’s correction. #p<0.05, ##p<0.01, paired t-test.
-
Figure 5—source data 1
Data for Figure 5B–G.
- https://cdn.elifesciences.org/articles/89317/elife-89317-fig5-data1-v1.xlsx
Figure 6

Creatine (Cr) release in WT and arginine:glycine amidinotransferase (AGAT) knockout mice.
(A) A schematic diagram illustrating the strategy of Agat knockout first. With the Agat gene (also known as Gatm) shown in the upper part, and the gene targeting strategy in the lower part. The homologous arm is approximately 10 kb. A targeting cassette, containing Frt-flanked lacZ and neomycin, was inserted downstream of exon 2. At the same time, exon 3 of Agat was flanked by two loxP sites. K+-induced release of glutamate (Glu) (C) and gamma-aminobutyric acid (GABA) (D) were not significantly different among Agat+/+, Agat+/-, and Agat-/- mice, whereas that of Cr (B) was significantly lower in AGAT-/- mice than those in Agat+/+ and Agat+/--.
-
Figure 6—source data 1
Data for Figure 6B–D.
- https://cdn.elifesciences.org/articles/89317/elife-89317-fig6-data1-v1.xlsx
Figure 7 with 3 supplements
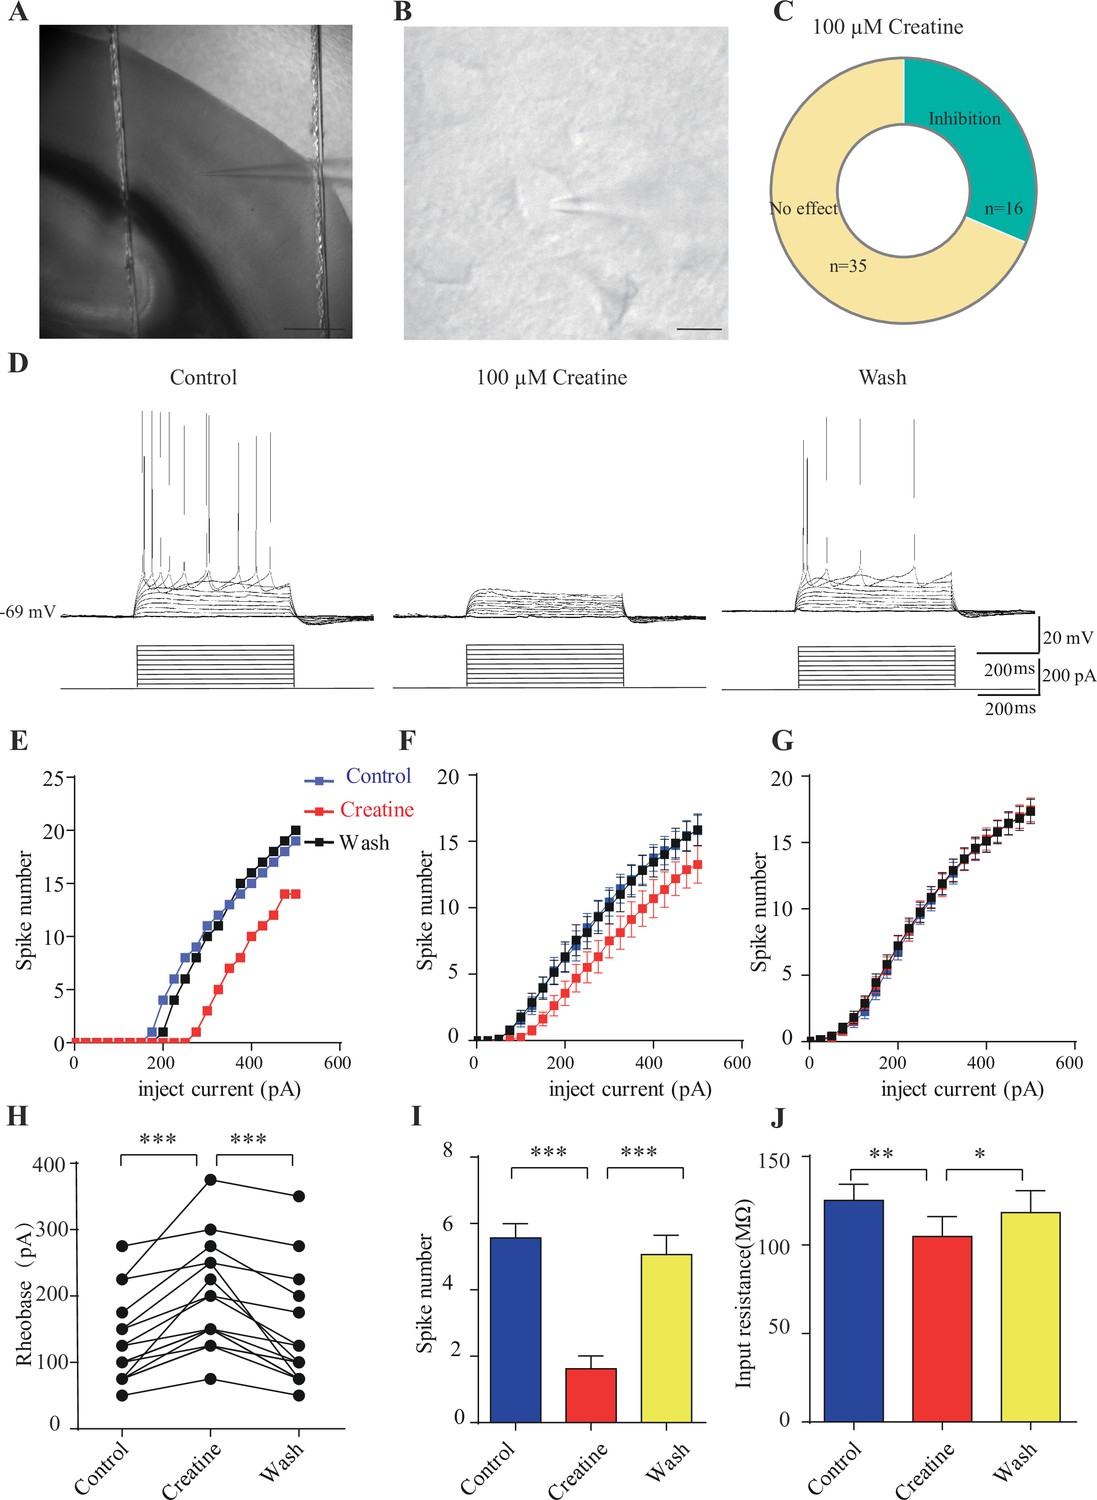
Inhibitory effects of creatine (Cr) on cortical neurons.
(A) A photograph showing recording at layer 4 in the somatosensory cortex. Scale bar: 10 μm. (B) Patch-clamp recording of a pyramidal neuron. Scale bar: 10 μm. (C) Ratios of Cr-responsive and -unresponsive neurons in the region. (D) Representative raw electrophysiological traces showing inhibition of evoked firing by Cr, with the lower panel showing the stimulus protocol. (E) Evoked spike numbers in response to different current injections from (D). (F) Relationship between evoked spike numbers and different current injections to neurons that were inhibited by Cr (n = 16). (G) The same for Cr-unresponsive neurons (n = 35). (H) Rheobase for Cr-responsive neurons. (I) Evoked spike number when these neurons were injected with current of rheobase + 50 pA. (J) input resistance. *p<0.05; **p<0.01; ***p<0.001, paired t-test.
-
Figure 7—source data 1
Data for Figure 7E–J.
- https://cdn.elifesciences.org/articles/89317/elife-89317-fig7-data1-v1.xlsx
Figure 7—figure supplement 1
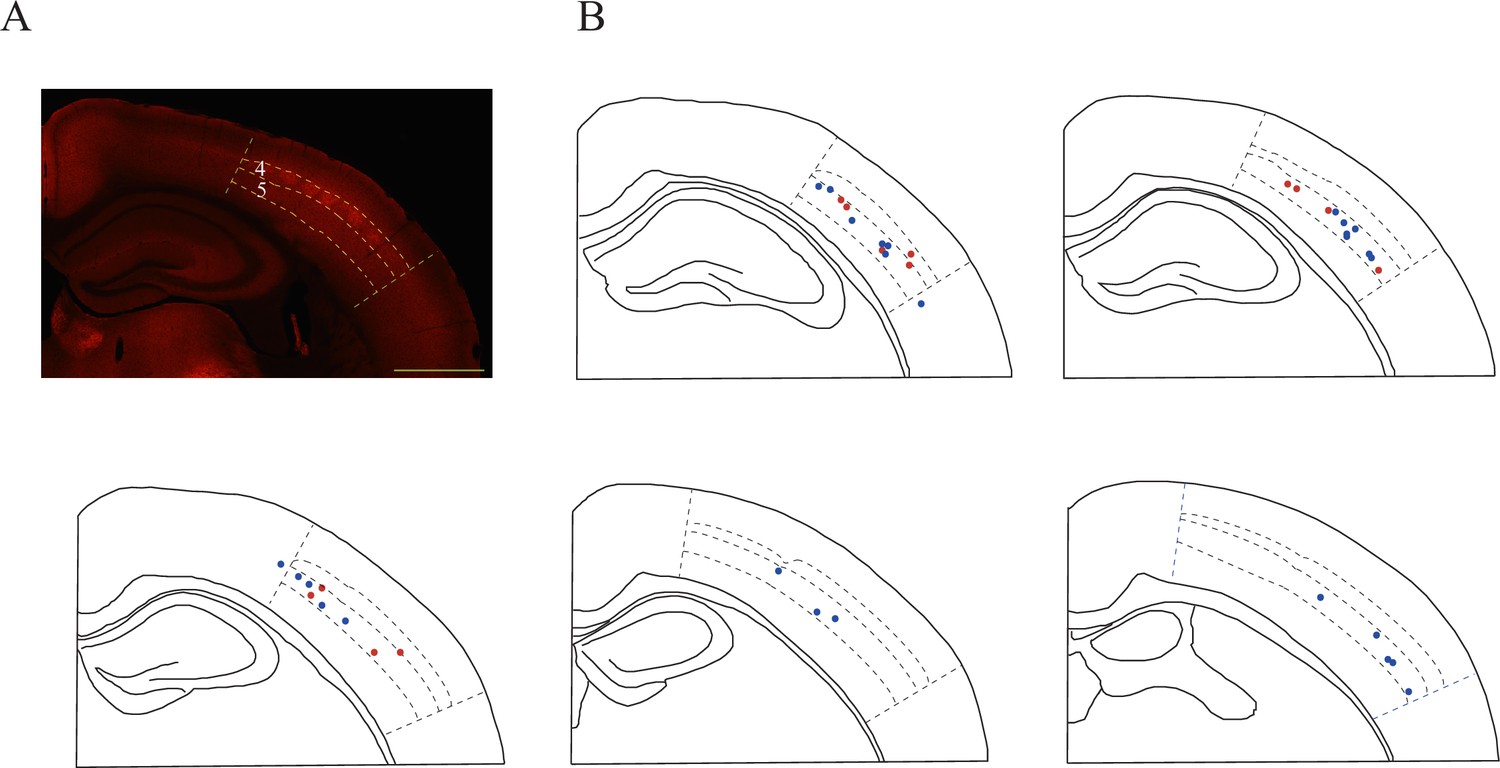
Layer distribution of recording sites in the somatosensory cortex.
(A) High levels of SLC6A8-HA signal observed in the somatosensory cortex, especially in layer 4. (B) Recording sites. Red denotes the responsive neurons and blue the unresponsive neurons.
Figure 7—figure supplement 2
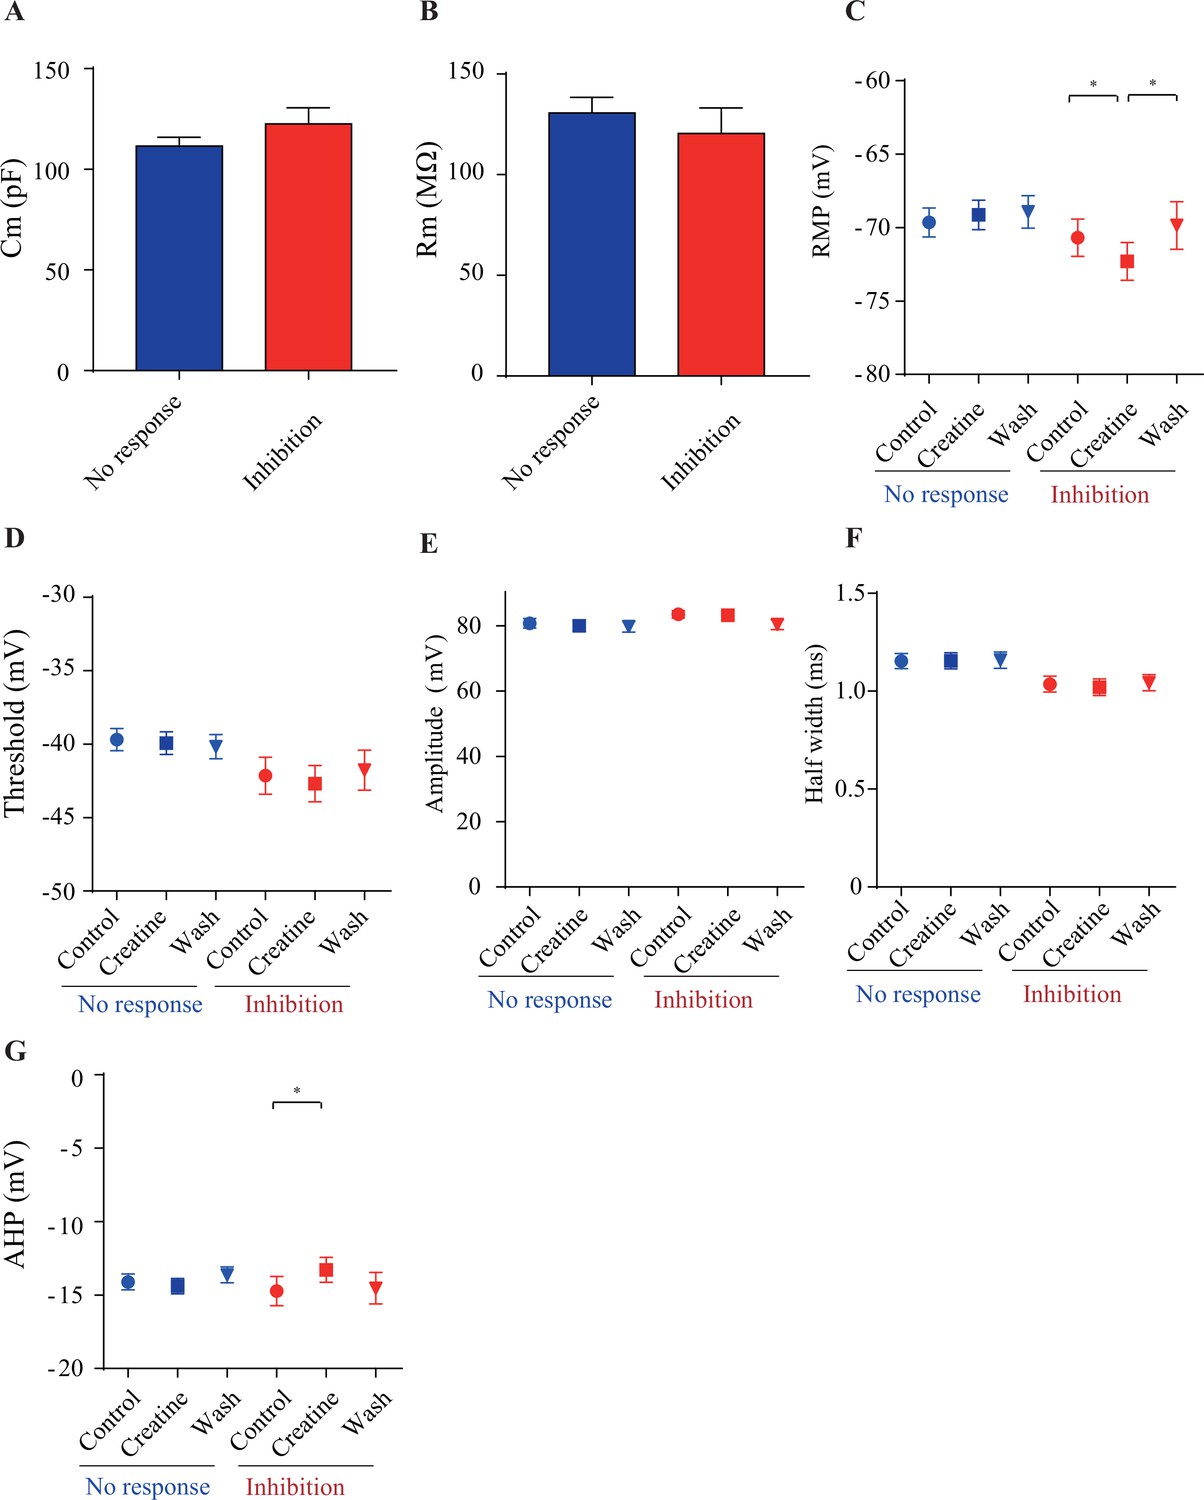
Electrophysiological parameters of creatine (Cr)-responsive (blue) and Cr-nonresponsive neurons (red).
There was no significant difference between the two groups of neurons in membrane capacitance (Cm) (A) and membrane resistance (Rm) (B), resting membrane potential (RMP) (C), spike threshold (D), spike amplitude (E), half width of spike (F), and amplitude of afterhyperpolarization (AHP) (G). While no electrical parameters detected were changed by Cr in non-responsive neurons (n = 35), RMP (C) was slightly inhibited by Cr and AHP (G) was slightly elevated (n = 16) in Cr-responsive neurons (*p<0.05, paired t-test).
-
Figure 7—figure supplement 2—source data 1
Data for Figure 7—figure supplement 2A–G.
- https://cdn.elifesciences.org/articles/89317/elife-89317-fig7-figsupp2-data1-v1.xlsx
Figure 7—figure supplement 3
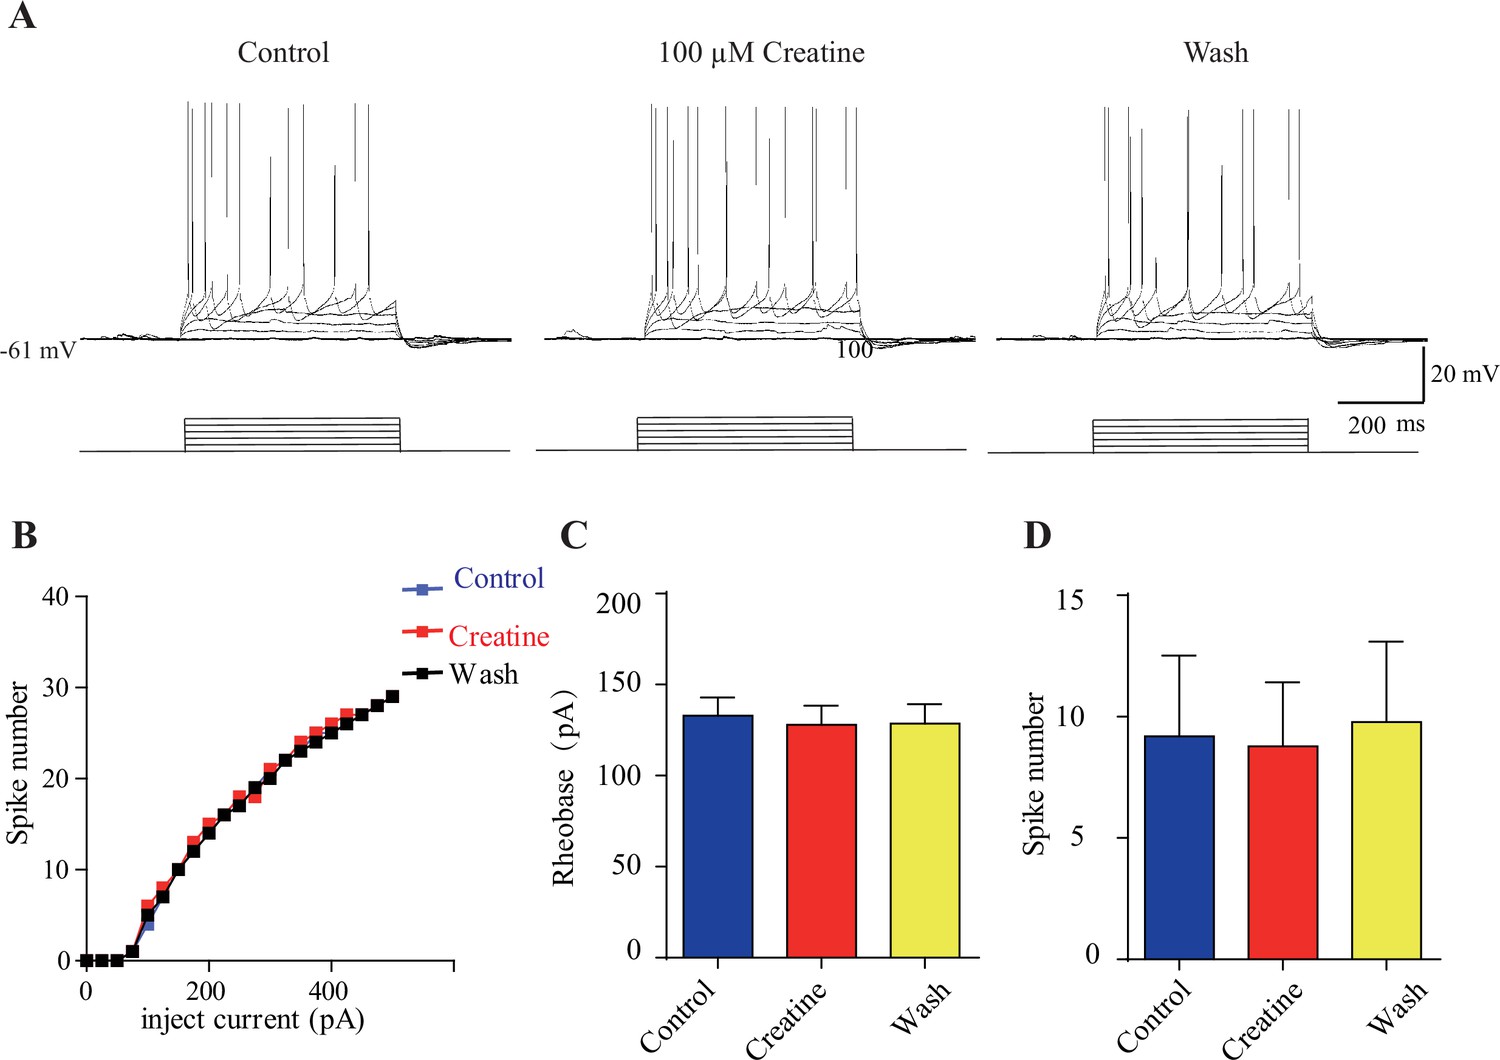
Electrophysiological data of creatine (Cr)-unresponsive neurons.
(A) Representative raw traces. (B) I-V curve of this same neuron. No effect of 100 μM Cr on rheobase current and evoked spike number at a current of 50 pA above rheobase current was observed. (C, D) Rheobase and spike number were not changed during Cr application.
-
Figure 7—figure supplement 3—source data 1
Data for Figure 7—figure supplement 3B–D.
- https://cdn.elifesciences.org/articles/89317/elife-89317-fig7-figsupp3-data1-v1.xlsx
Figure 8
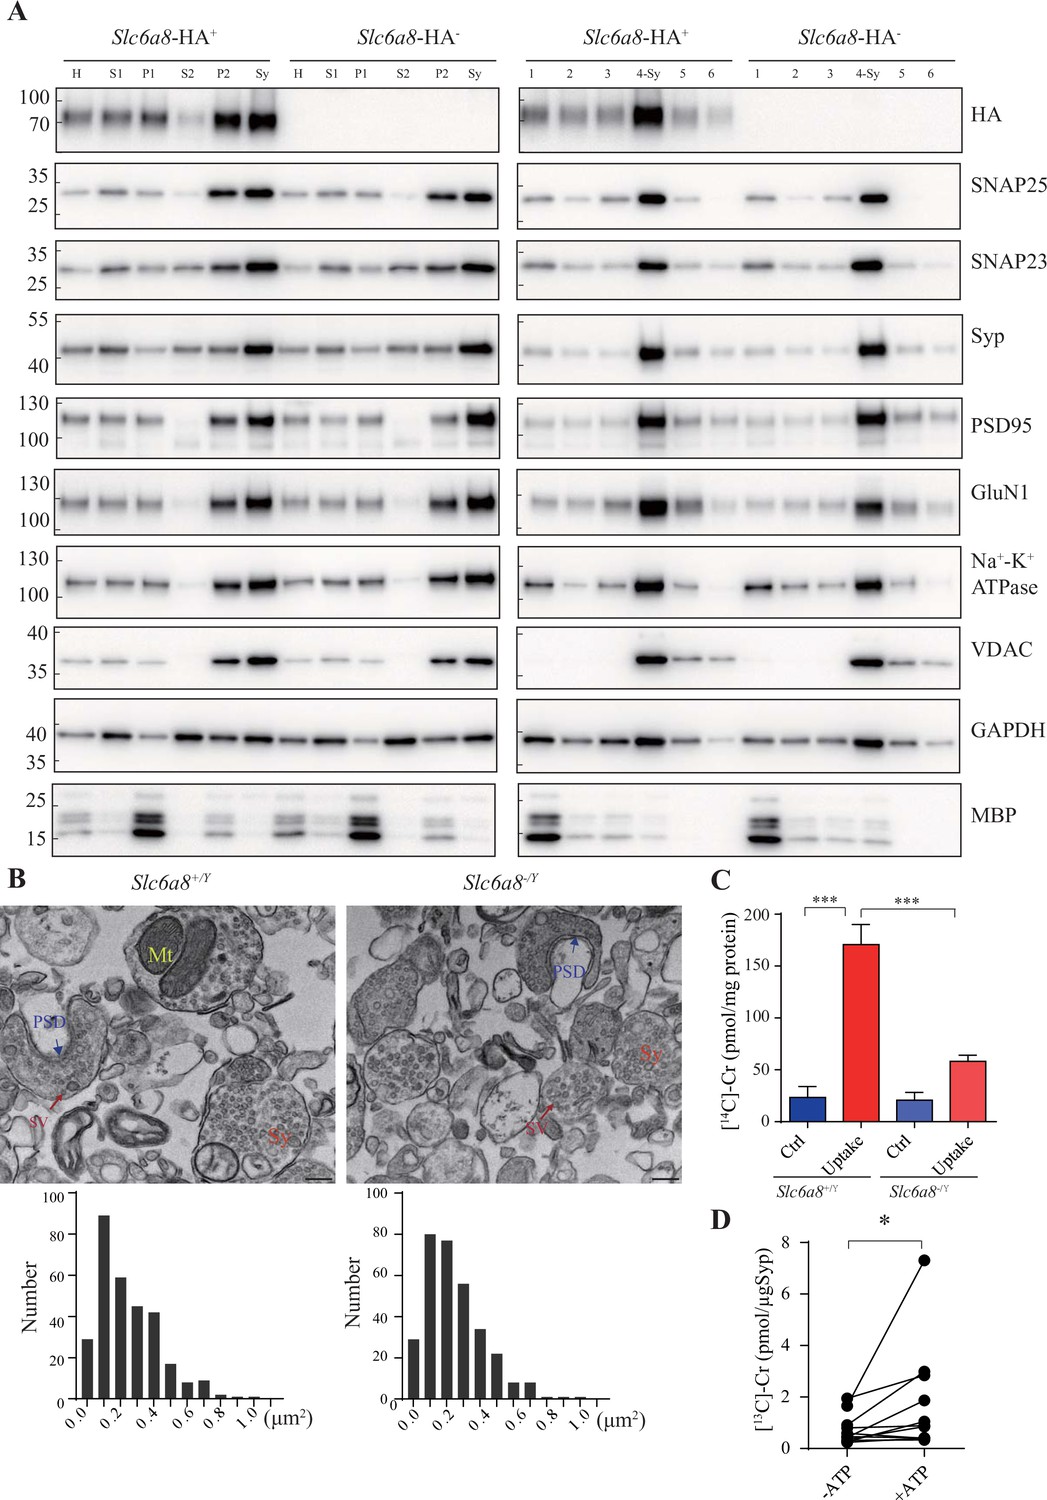
Creatine (Cr) uptake into synaptosomes and synaptic vesicles (SVs).
(A) Markers for subcellular organelles detected in synaptosomes prepared from WT mice or mice with Slc6a8 gene fused in frame to the HA epitope. SLC6A8-HA was enriched in synaptosomes (Sy or 4-Sy) or crude synaptosomes (P2) (see ‘Materials and methods’), as were other markers for the subcellular organelles in synaptosomes but not the marker for myelin (MBP). (B) Representative electron micrographs and histograms of size distribution in synaptosomes isolated from WT (Slc6a8+/Y) and Slc6a8 KO (Slc6a8-/Y) mice by Ficoll density-gradient centrifugation. Sy, synaptosome; Mt, mitochondria; PSD, postsynaptic density. Bar, 20 nm. (C) Cr uptake into synaptosomes (n = 5 per group). The two left columns were results from WT mice and the two right columns from Slc6a8 knockout mice. The control baseline was [14C]-Cr uptake at 0°C at 10 min. Cr uptake into synaptosomes at 37°C measured at 10 min was observed in WT synaptosomes. Uptake into Slc6a8 knockout synaptosomes was significantly reduced compared to the WT synaptosomes. ***p<0.001, one-way ANOVA with Tukey’s correction. (D) uptake of [13C]-Cr into immunoisolated SVs in the presence or absence of ATP (n = 11 samples per group). *p<0.05, paired t-test.
-
Figure 8—source data 1
Original western blot files for Figure 8A.
- https://cdn.elifesciences.org/articles/89317/elife-89317-fig8-data1-v1.zip
-
Figure 8—source data 2
Labelled western blot files for Figure 8A.
- https://cdn.elifesciences.org/articles/89317/elife-89317-fig8-data2-v1.zip
-
Figure 8—source data 3
Labelled western blot files for Figure 8A.
- https://cdn.elifesciences.org/articles/89317/elife-89317-fig8-data3-v1.zip
Additional files
Download links
A two-part list of links to download the article, or parts of the article, in various formats.
Downloads (link to download the article as PDF)
Open citations (links to open the citations from this article in various online reference manager services)
Cite this article (links to download the citations from this article in formats compatible with various reference manager tools)
Suggestion of creatine as a new neurotransmitter by approaches ranging from chemical analysis and biochemistry to electrophysiology
eLife 12:RP89317.
https://doi.org/10.7554/eLife.89317.4


