PI(3,4,5)P3 allosteric regulation of repressor activator protein 1 controls antigenic variation in trypanosomes
- Institute of Parasitology, McGill University, Sainte-Anne-de-Bellevue, Canada
- Division of Experimental Medicine, Department of Medicine, McGill University, Canada
Figures
Figure 1 with 2 supplements
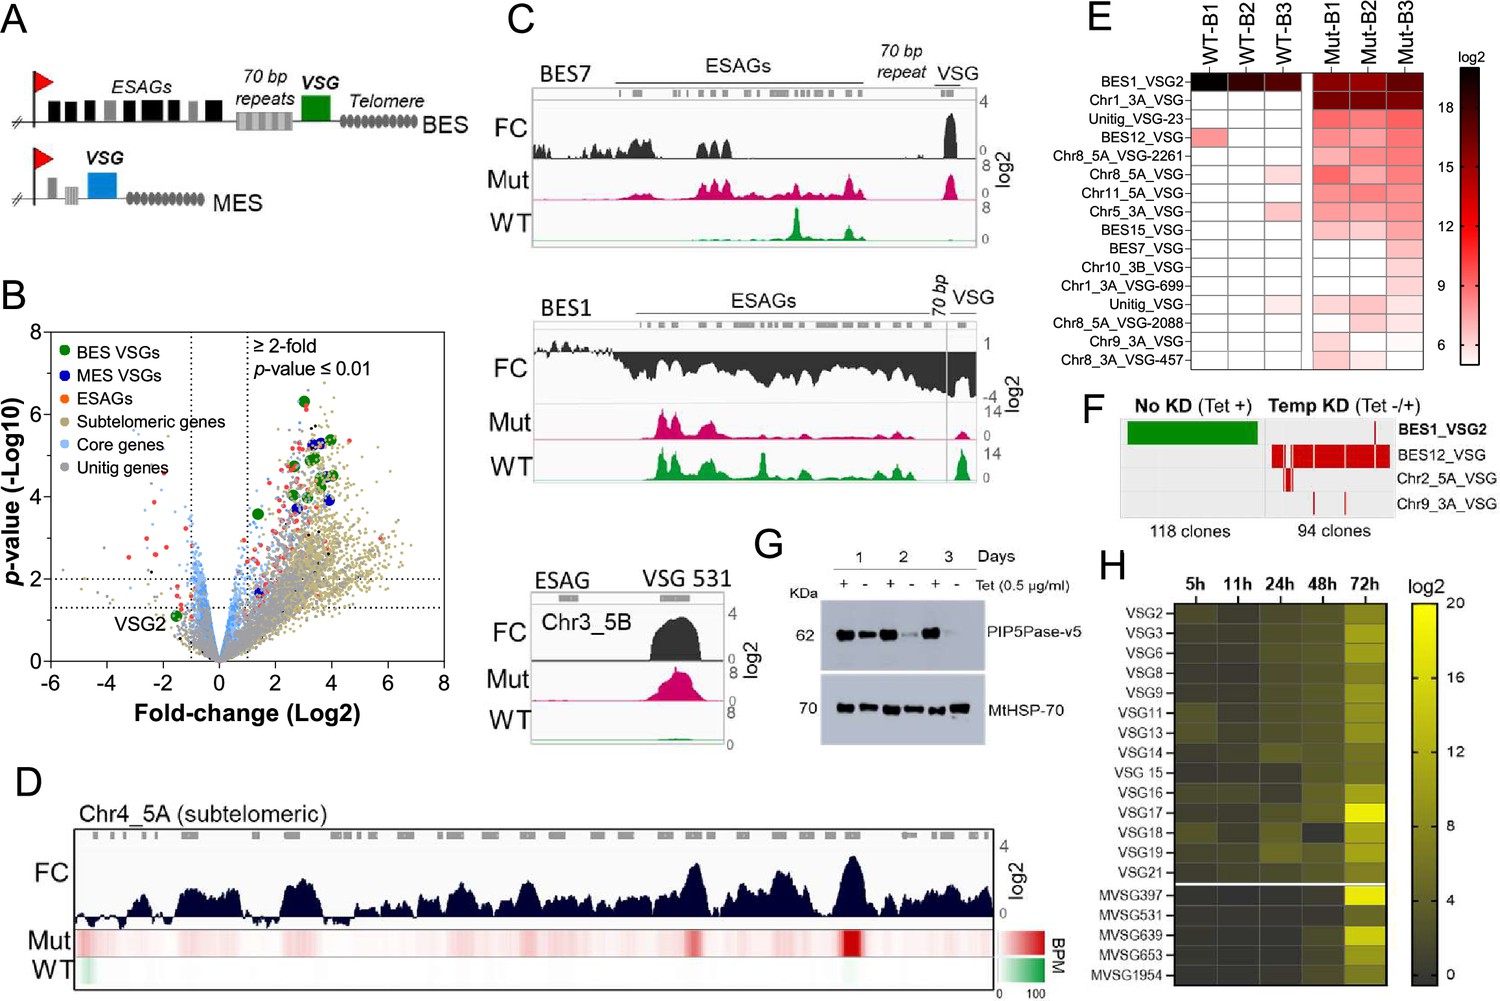
PIP5Pase activity is essential for VSG gene silencing and switching.
(A) Diagram of bloodstream-form ESs (BES, top) and metacyclic-form ESs (MES, bottom). (B) RNA-seq analysis of T. brucei bloodstream forms comparing 24 hr exclusive expression of Mut to WT PIP5Pase. FC, fold-change. Horizontal dotted lines indicate p-values at 0.05 and 0.01. Vertical dotted lines, FC at twofold. Unitig genes, genes not assembled in the reference genome. (C–D) RNA-seq read coverage and FC (Mut vs WT) of silent BES7 (C, top), the active BES1 (C, middle), a silent MES (C, bottom), and chromosome 4 subtelomere (D). Heat-map in D shows RNA-seq bins per million (BPM) reads. Gray rectangles represent genes. A 99.9% reads mapping probability to the genome (mapQ >30) retained alignments to subtelomeric regions. (E) VSG-seq analysis of T. brucei bloodstream forms after temporary (24 hr) exclusive expression of Mut PIP5Pase, and re-expression for 60 hr of WT PIP5Pase. B1-B3, biological replicates. The color shows normalized read counts per million. A 3’-end conserved VSG sequence was used to capture VSG mRNAs (Mugnier et al., 2015). See Supplementary file 3 for data and gene IDs of VSGs. (F) VSG-seq from isolated clones after PIP5Pase temporary knockdown (24 hr) followed by its re-expression (Tet -/+) and cloning for 5–7 days. Clones of non-knockdown (tet +) cells were analyzed as controls. BES1_VSG2 (Tb427_000016000), BES12_VSG (Tb427_000008000), Chr2_5 A_VSG (Tb427_000284800), Chr9_3 A_VSG (Tb427_000553800). (G) Western blot of V5-tagged PIP5Pase knockdown in T. brucei procyclic forms. The membrane was stripped and reprobed with anti-mitochondrial heat shock protein 70 (MtHSP70). (H) Expression analysis of ES VSG genes after knockdown of PIP5Pase in procyclic forms by real-time PCR. Data are the mean of three biological replicates.
Figure 1—figure supplement 1
Clonal VSG-seq to identify VSG switching.
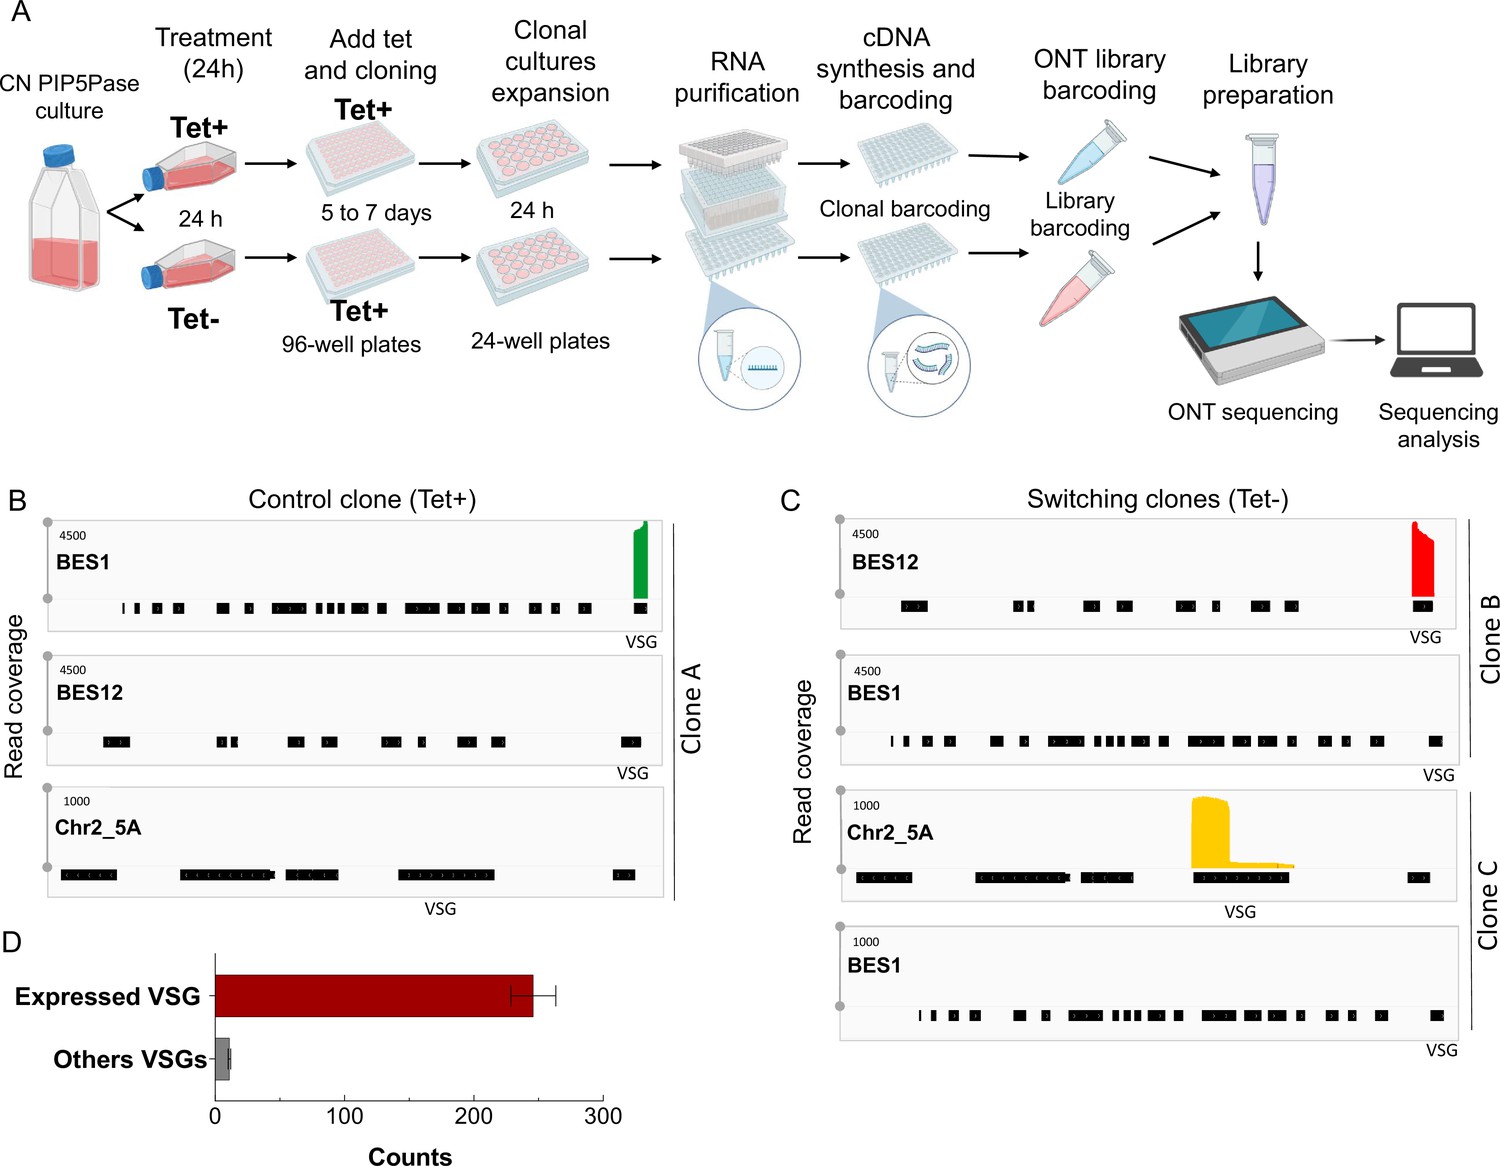
(A) Diagram of the clonal VSG-seq approach. CN PIP5Pase cells were treated with tet + (express PIP5Pase) or tet – (knockdown PIP5Pase) for 24 hr. After, tet was added back to restore PIP5Pase expression and cells were cloned in 96-well plates by limiting dilution. Clones were collected between 5–7 days and expanded in 24-well plates for 24 h. Then, RNAs were isolated and cDNA synthesized using splice leader forward primer and a reverse primer hybridizing to the 3’ end of VSG genes (conserved region) to capture all VSGs (Mugnier et al., 2015). The 3’-end VSG primers have a 6 bp barcode sequence unique to each clone (see Methods). cDNAs were pooled for nanopore barcoding to multiplex libraries. Libraries were sequenced in MinION. Fastq sequences were split using clonal barcodes and mapped against T. brucei’s genome. (B) VSG-seq read coverage for a Tet + control culture (clone A) that expresses VSG2, BES1 (green). Silent BES12 or subtelomeric region of Chr2_5 A is shown as a comparison. (C) VSG-seq read coverage of Tet - cultures (clone B and clone C), indicating VSG switching (red or orange) to other VSG genes from the initially expressed VSG2 (BES1). (D) Mean of VSG-seq read counts from VSG genes expressed by the T. brucei clones compared to read counts mapped to other VSG genes. The number of read counts to a specific VSG was used to determine which VSG is expressed by each clone. Data show the mean ± SDM of 212 clones.
Figure 1—figure supplement 2
PIP5Pase is essential for procyclic forms growth and localizes in the cell nucleus.
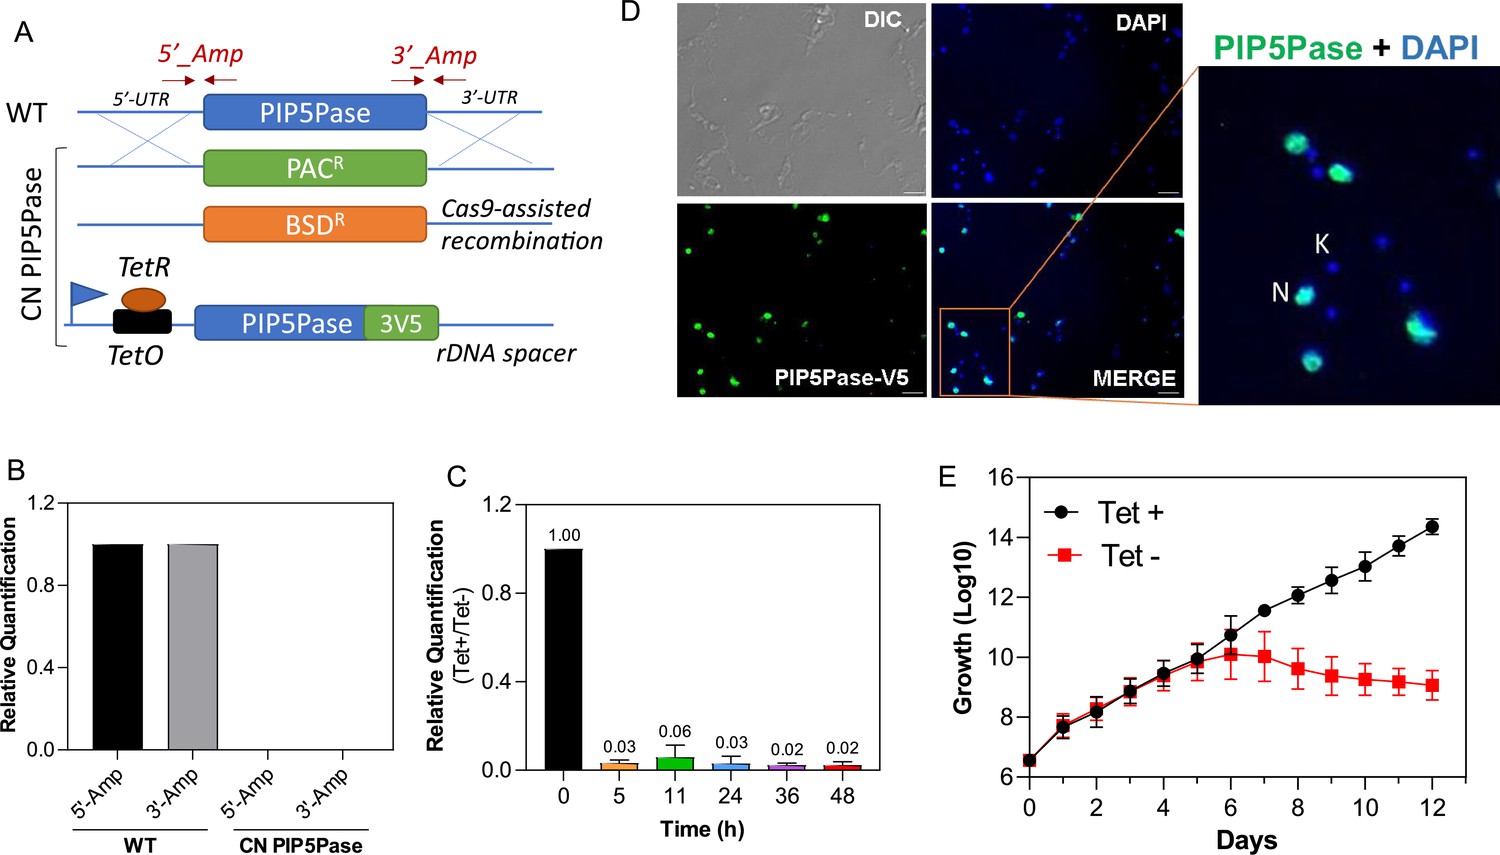
(A) Diagram of procyclic forms PIP5Pase CN cell line. Constructs containing drug resistance markers flanked by ~500 bp of the 5’-untranslated region (UTR) and 3’-UTR of the PIP5Pase gene were used for homologous recombination and replacement of endogenous PIP5Pase alleles in T. brucei 29.13 procyclic cells. SaCas9 with guides targeting the PIP5Pase gene was used to cleave the PIP5Pase alleles and increase recombination rates. A tet-regulatable V5-tagged PIP5Pase allele (using pLEW100-3V5 vector) was inserted in the silent ribosomal spacer, for controlled PIP5Pase gene expression. Arrows indicated by 5’_Amp and 3’_Amp show hybridization sites of primes used to verify the constructs’ recombination. (B) Real-time PCR amplification from genomic DNA of T. brucei 29.13 (WT) or CN PIP5Pase cell line. Primers 5’_Amp and 3’_Amp, indicated in A, were used in amplification. The Tubulin gene was used as endogenous control. (C) Real-time PCR amplification of PIP5Pase from cDNA of CN PIP5Pase cell line growing in the presence of tet (tet +, 0.5 µg/mL for 24 hr) or after removal of tet from medium (Tet -) for several time points (indicated in graph x-axis). Tubulin was used as endogenous control. The data shown are the mean ± SDM of three biological replicates. (D) Subcellular localization of V5-tagged PIP5Pase in procyclic forms using T. brucei CN PIP5Pase (100 ng/mL of tet). PIP5Pase-V5 was detected with α-V5 monoclonal antibodies (mAb) followed by goat α-mouse IgG-AlexaFluor 488 (green). DAPI stains DNA (blue). DIC (Differential image contrast). N, nuclear DNA; K, kinetoplast DNA. (E) Cumulative growth curve of T. brucei CN PIP5Pase (0.5 µg/mL of tet). The data shown are the mean ± SDM of three biological replicates.
Figure 2 with 3 supplements
ChIP-seq analysis of RAP1-HA in T. brucei.
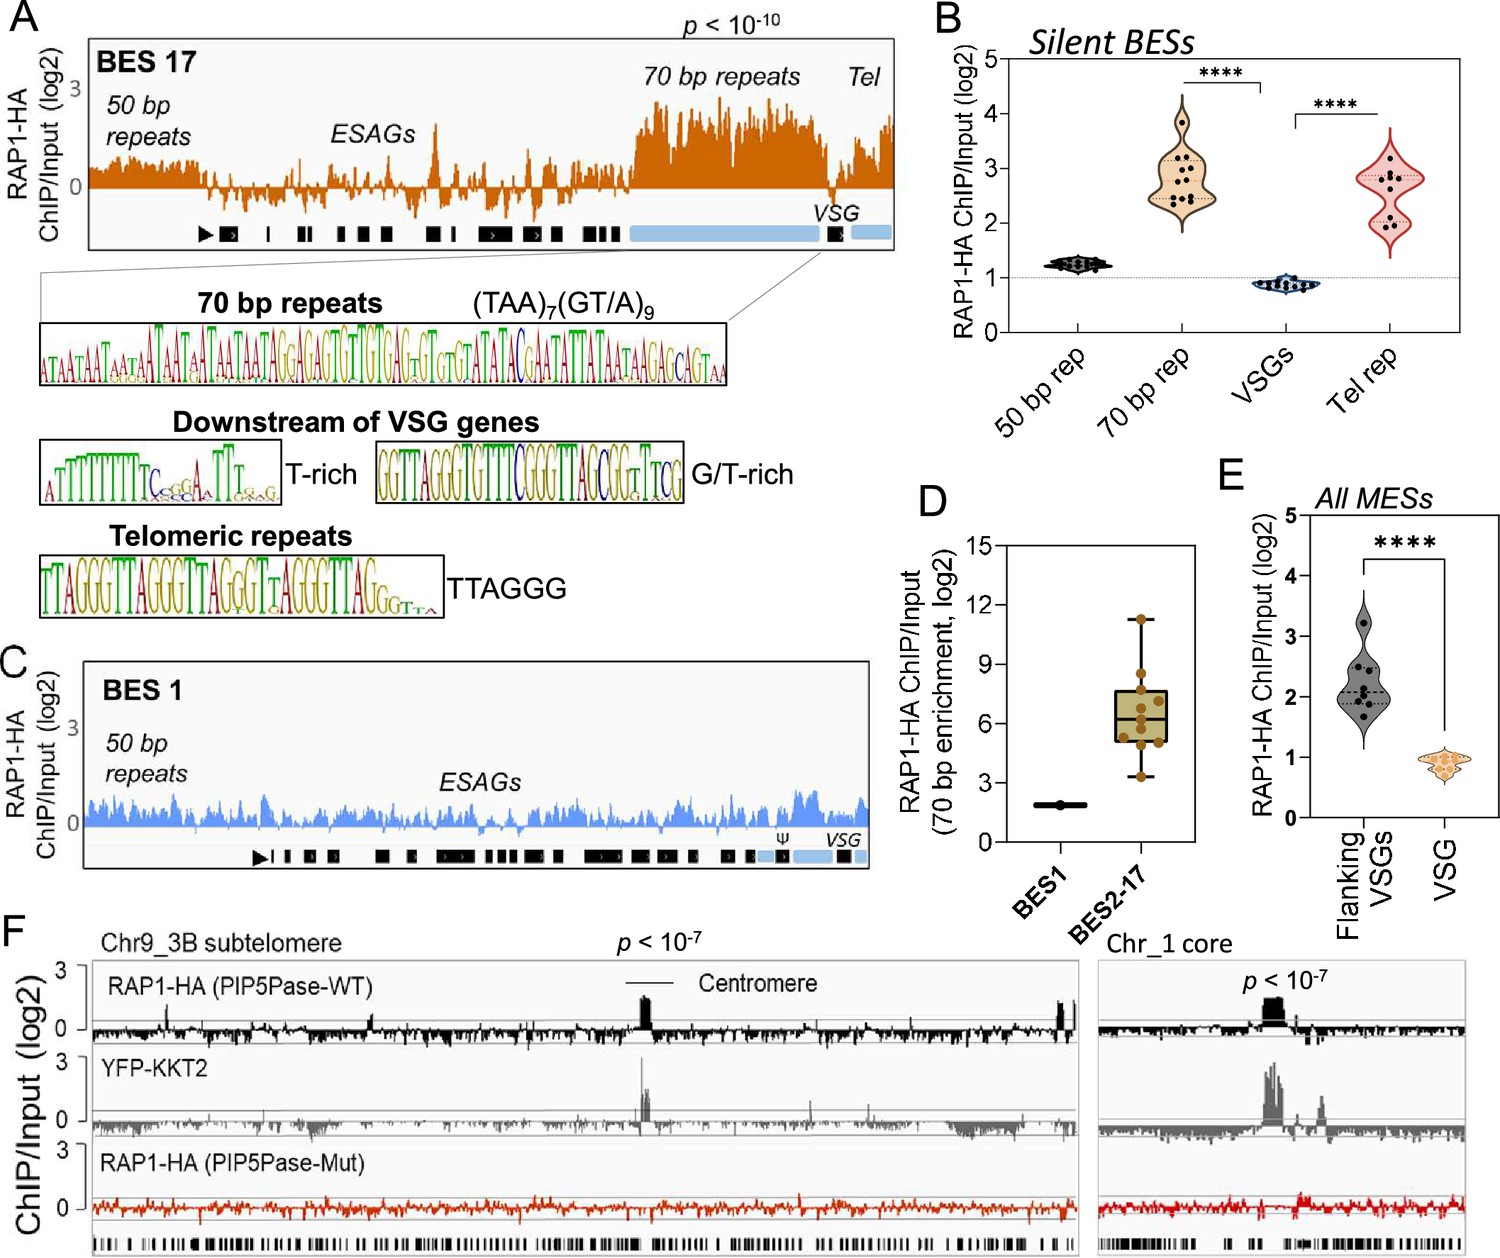
(A) RAP1-HA binding sites on the silent BES17. Data show fold-change comparing ChIP vs Input. Below is the sequence bias of RAP1-HA bound regions. Black rectangles, ES genes; black triangle, ES promoter; cyan rectangle, 70 bp and telomeric repeats. (B) RAP1-HA binding to selected regions in silent BES sequences. Each dot represents the mean of a silent BES. (C) RAP1-HA enrichment to the active BES1 (fold-change comparing ChIP vs Input). See Supplementary file 4 for additional read mapping and filtering analysis. (D) Comparison of RAP1-HA binding to 70 bp in silent and active ESs. (E) RAP1-HA enrichment over all MESs. Flanking VSGs, DNA sequences upstream or downstream of VSG genes in MESs. (F) RAP1-HA binding to subtelomere 3B of chromosome (Chr) 9 (left) or chromosome 1 core (right). Yellow fluorescent protein (YFP)-tagged KKT2 protein ChIP-seq from Akiyoshi and Gull, 2014 is shown. RAP1-HA ChIP-seq in cells expressing Mut PIP5Pase is shown below. p-values (p) were calculated using Model-based Analysis of ChIP-Seq (MACS) from three biological replicates. Data show fold-change of ChIP vs Input analysis. See Supplementary files 2 and 4 for detailed statistics. ****, p-value <0.0001 using two-tailed unpaired t-test.
Figure 2—figure supplement 1
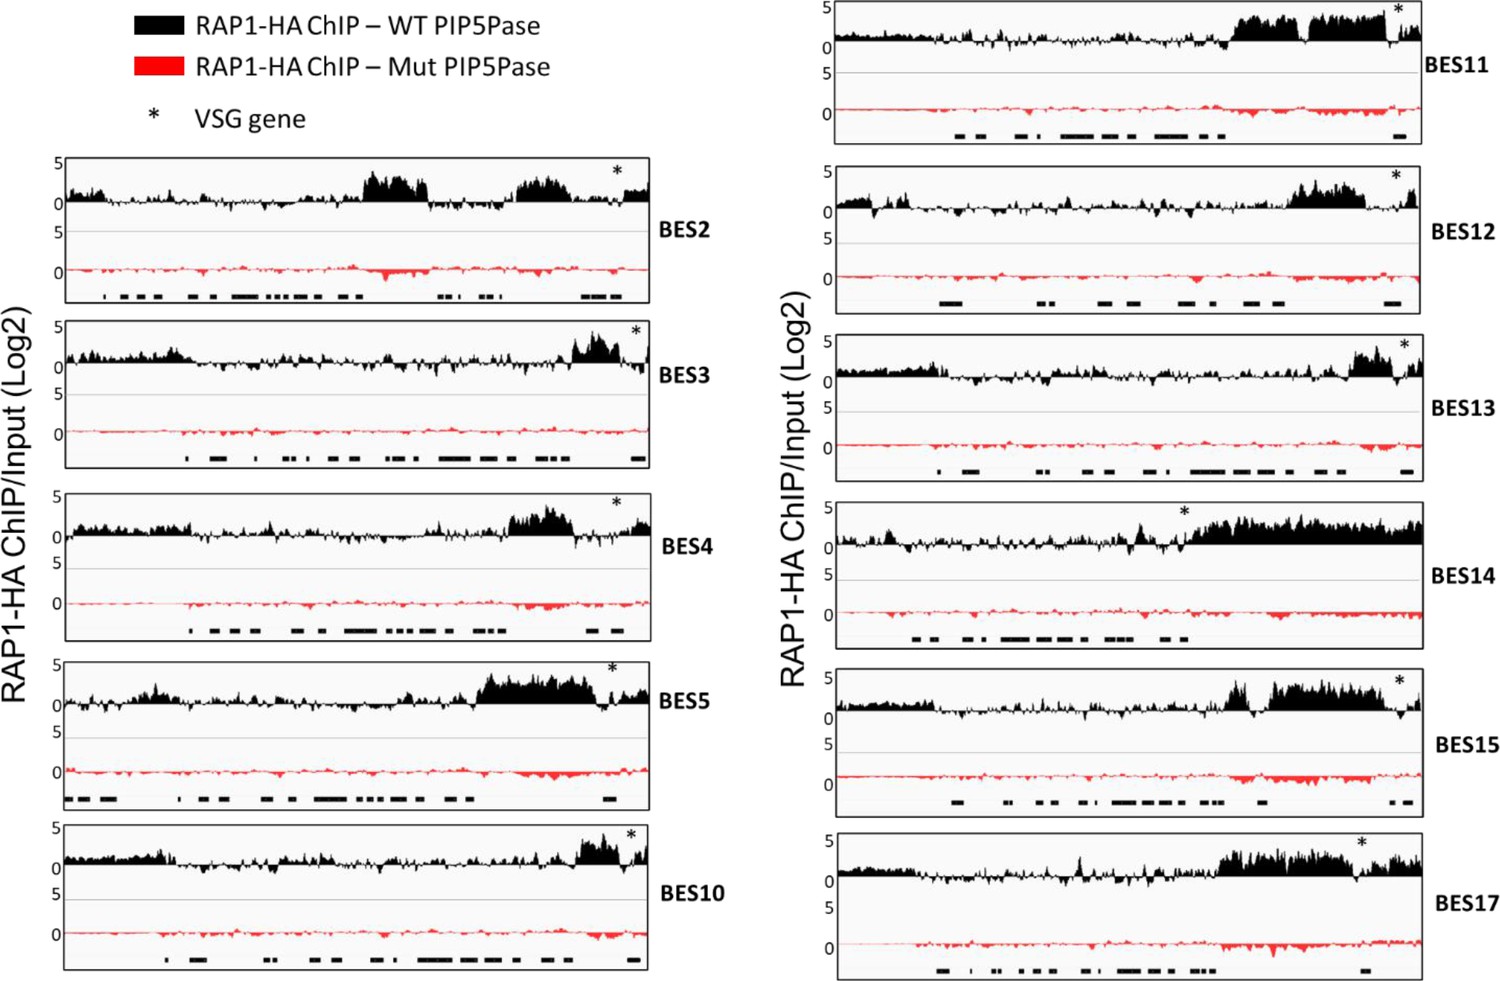
RAP1-HA binding to silent telomeric ESs by ChIP-seq in cells expressing WT or Mut PIP5Pase.
BES1 and BES7 are included in the main manuscript (Figure 2 and Figure 5). Black boxes below indicate ES genes. The asterisks indicate the location of the VSG gene. The data shown is a fold-change comparison of RAP1-HA ChIP versus the input. For statistical analysis, see Supplementary file 4.
Figure 2—figure supplement 2

ChIP-seq of RAP1-HA binding to a silent (BES17) vs the active ES (BES1) after multiple alignment filtering parameters.
*All alignments include primary and secondary alignments; supplementary alignments were removed. Primary MAPQ10 and MAPQ20 are primary alignments filtered for mapping quality ≥10 (≥90% probability of correct alignment) and ≥20 (≥99% probability of correct alignment), respectively. Note no significant enrichment of RAP1-HA on BES1. Increased stringency in alignment filtering removes reads from telomeric repeats. See Supplementary file 4 for statistics.
Figure 2—figure supplement 3

MES Chr11_5 A data are included in the main manuscript (Figure 5).
The black boxes below indicate MES VSG genes, and the triangle indicates the MES promoter. The data shown is a fold-change comparison of RAP1-HA ChIP versus the input. For statistical analysis, see Supplementary file 4.
Figure 3 with 1 supplement
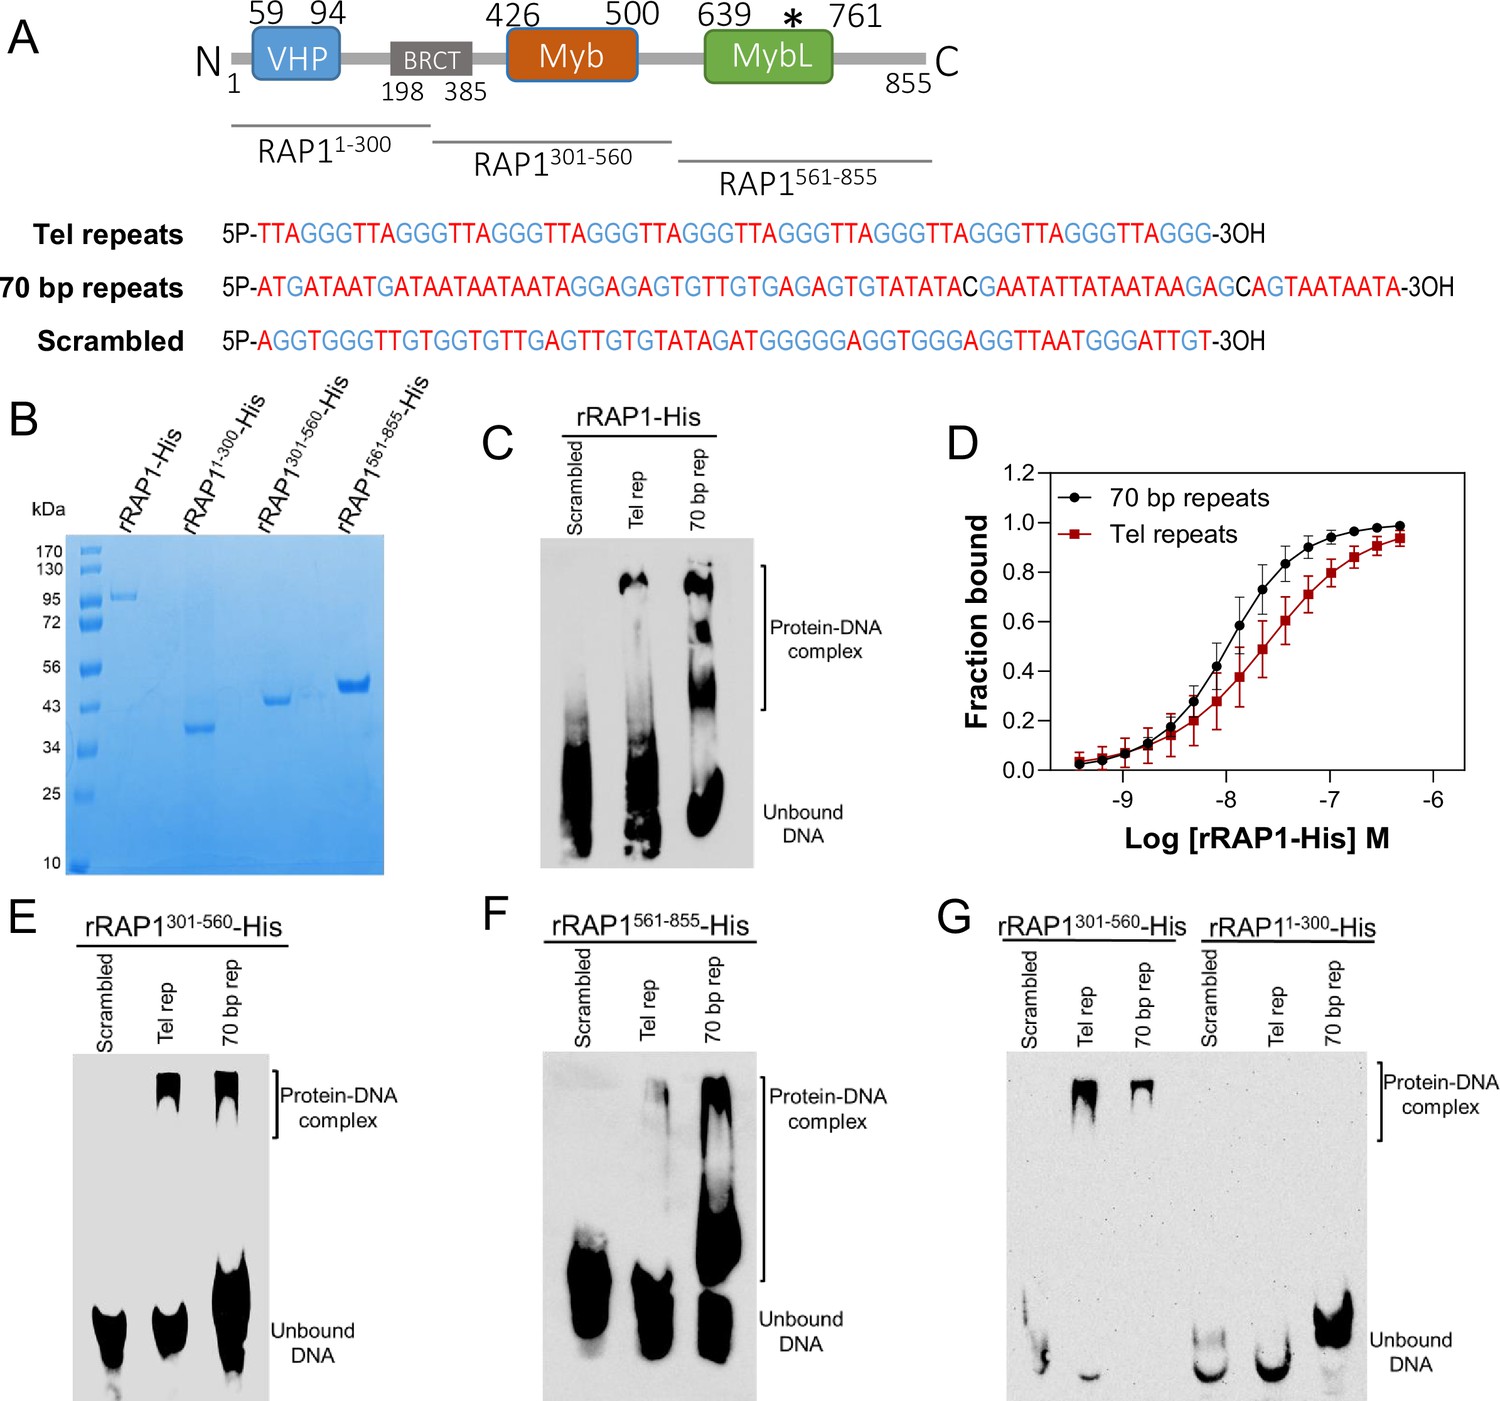
rRAP1-His binds to telomeric and 70 bp repeats via its Myb and MybL domain.
(A) Top, RAP1 diagram shows VHP, BRCT, Myb and MybL domains. Numbers indicate residue positions; asterisk, nuclear targeting sequence. Bottom, telomeric (10 repeats), 70 bp (one repeat), or scrambled (generated from telomeric repeats) sequences used in binding assays. (B) His-tagged rRAP1, rRAP11-300, rRAP301-560, and rRAP1561-855 resolved in 10% SDS/PAGE and Coomassie-stained. (C) EMSA of His-tagged rRAP1 with biotinylated telomeric repeats (Tel rep), 70 repeats (70 bp rep), or scrambled sequences resolved in 6% native/PAGE and developed with Streptavidin-HRP. (D) MST binding kinetics of rRAP1-His with Cy5-labelled telomeric repeats or 70 bp repeats. Data shown are the mean ± SDM of four biological replicates. (E–G) EMSA of rRAP1301-560-His (E), rRAP1561-855-His (F), or rRAP11-300-His (G) with telomeric, 70 bp repeats, or scrambled sequences resolved in 6% native/PAGE. rRAP1301-560-His were used as a positive control in G.
Figure 3—figure supplement 1

Recombinant His-tagged RAP1 (rRAP1-His) binds to 70 bp, telomeric repeats, and PI(3,4,5)P3.
(A) MST assay of rRAP1-His (full length), rRAP1301-360-His, and rRAP1561-855-His binding to telomeric repeats (Tel rep), 70 bp repeats (70 bp rep), or a scrambled DNA sequence derived from telomeric repeats (see Supplementary file 6 for sequences). The data shown are the mean ± SDM of at least three biological replicates. Fnorm Δ, change in normalized fluorescence. (B) Western blot of rRAP1-His binding assay with biotin-conjugated PI(3,4,5)P3, PI(4,5)P2, and Ins(1,4,5)P3. STV, streptavidin beads. rRAP1-His was detected with anti-His tag antibodies. (C–D) Gel shift assays of rRAP1301-560-His binding to biotinylatelomeric repeats (C) or 70 bp repeats (D) with and without PI(3,4,5)P3. (E–F) rRAP1561-855-His binding to biotinylated telomeric repeats (E) or 70 bp repeats (F) with and without PI(3,4,5)P3. PI(3,4,5)P3 concentrations used are indicated in the image. Samples were resolved in 6% native polyacrylamide gels, transferred to nylon membranes, and probed with streptavidin-HRP.
Figure 4 with 1 supplement
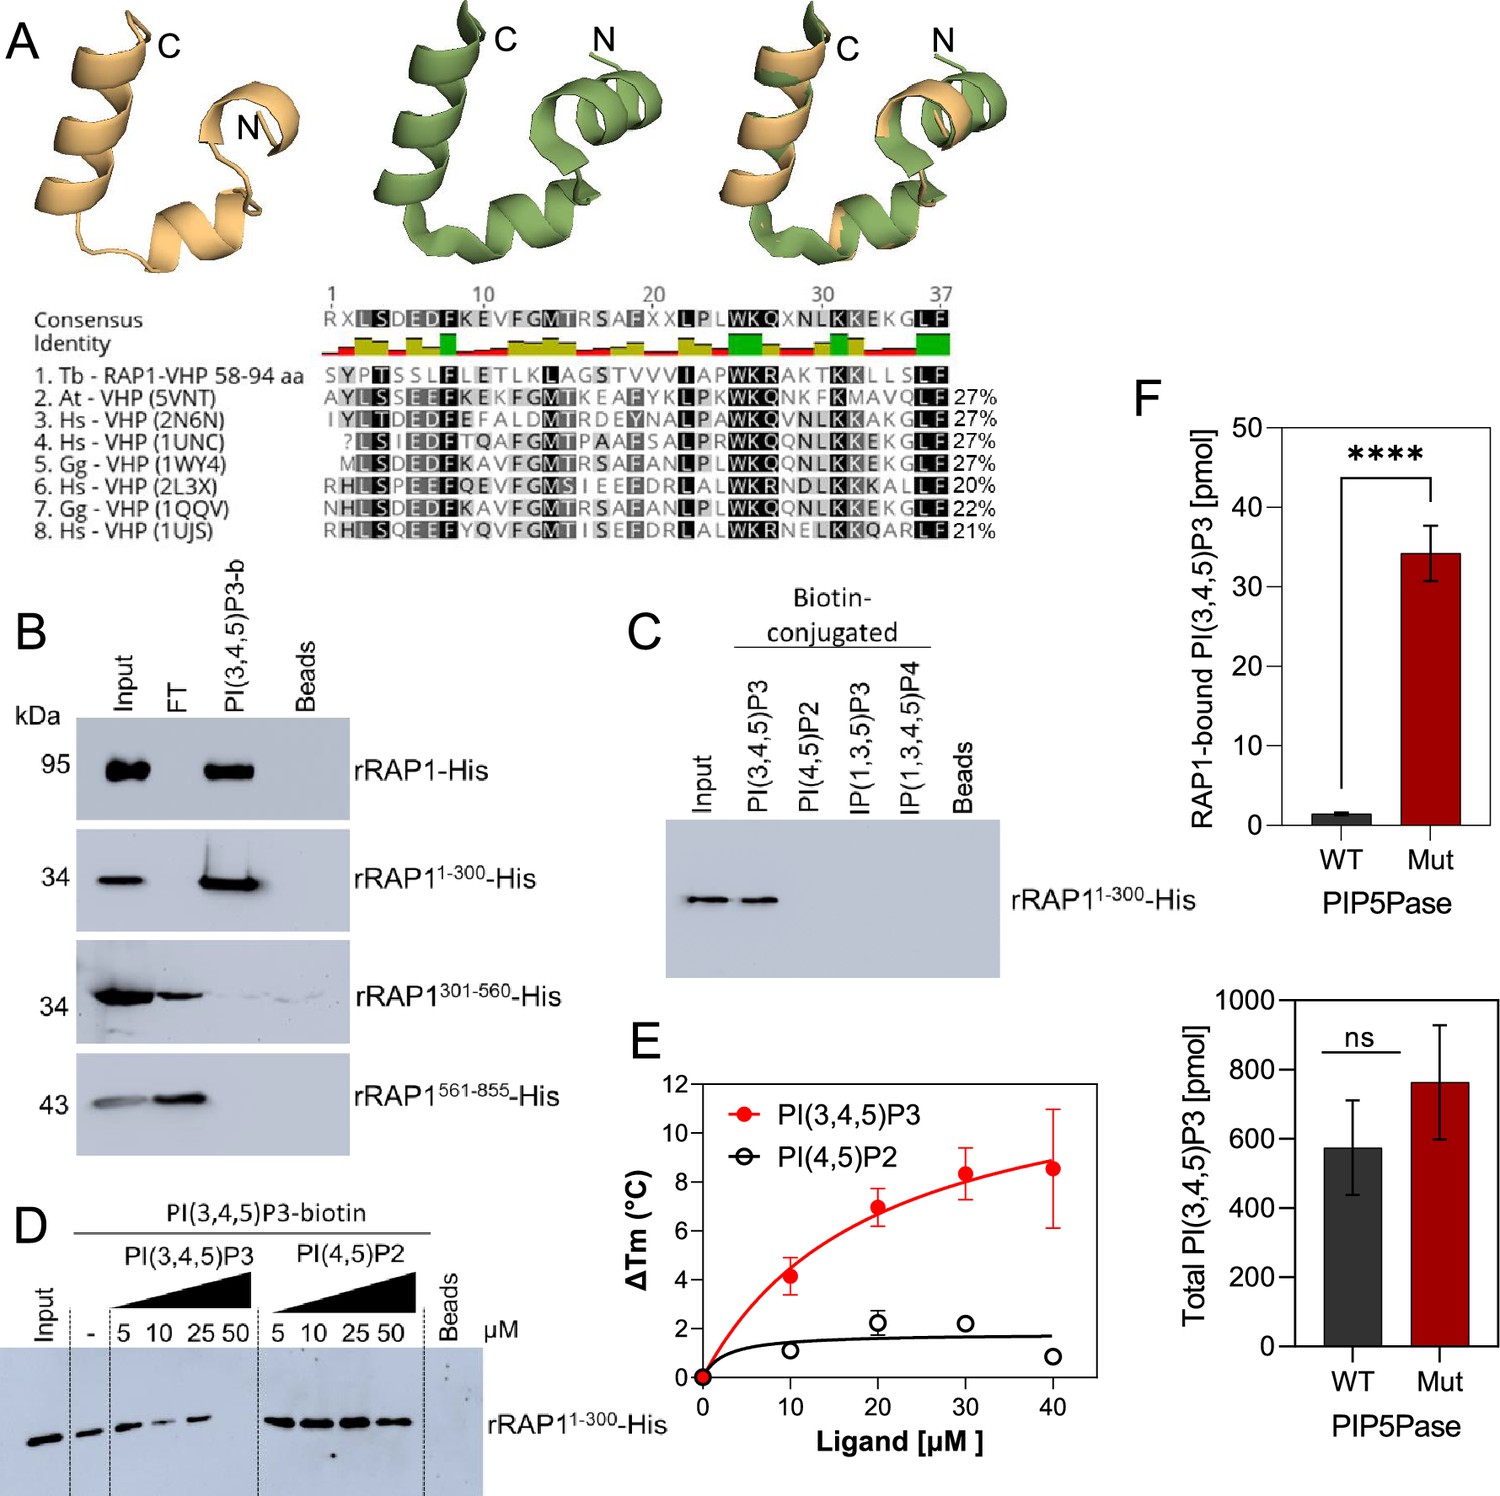
rRAP1-His binds to PI(3,4,5)P3 through its N-terminus.
(A) Modeling and alignment of RAP1 VHP domain. Left, RAP1 modeled structure; middle, VHP domain structure of human supervillin protein (PDB accession number 2K6N); and right, superposition of T. brucei RAP1 modeled VHP and human supervilin VHP domains. Alignment of T. brucei RAP1 VHP with human (Hs), Arabidopsis thaliana (At), and Gallus gallus (Gg) VHP domains from Villin proteins. PDB accession numbers are indicated in parenthesis. % of aa identity to T. brucei sequence are shown. (B) Binding assays with rRAP1-His, rRAP11-300-His, rRAP301-560-His, or rRAP1561-855-His and PI(3,4,5)P3-biotin. Beads, Streptavidin-beads; FT, flow-through. Proteins were resolved in 10% SDS/PAGE and Western developed with α-His mAbs. (C) Binding of His-tagged rRAP11-300 to biotinylated phosphoinositides or IPs. (D) Binding of rRAP11-300-His to PI(3,4,5)P3-biotin in presence of unlabelled PI(3,4,5)P3 or PI(4,5)P2. For C and D, proteins were analyzed as in B. (E) Binding kinetics of rRAP1-His with unlabelled PI(3,4,5)P3 or PI(4,5)P2. ΔTm, change in melting temperature. Data show the mean ± SDM of three biological replicates. (F) Quantification of RAP1-bound PI(3,4,5)P3 (top) or total cellular PI(3,4,5)P3 (bottom) levels in T. brucei exclusively expressing WT or Mut PIP5Pase. Data show the mean ± SDM of four biological replicates. ****, p-value <0.0001 using two-tailed unpaired t-test.
Figure 4—figure supplement 1
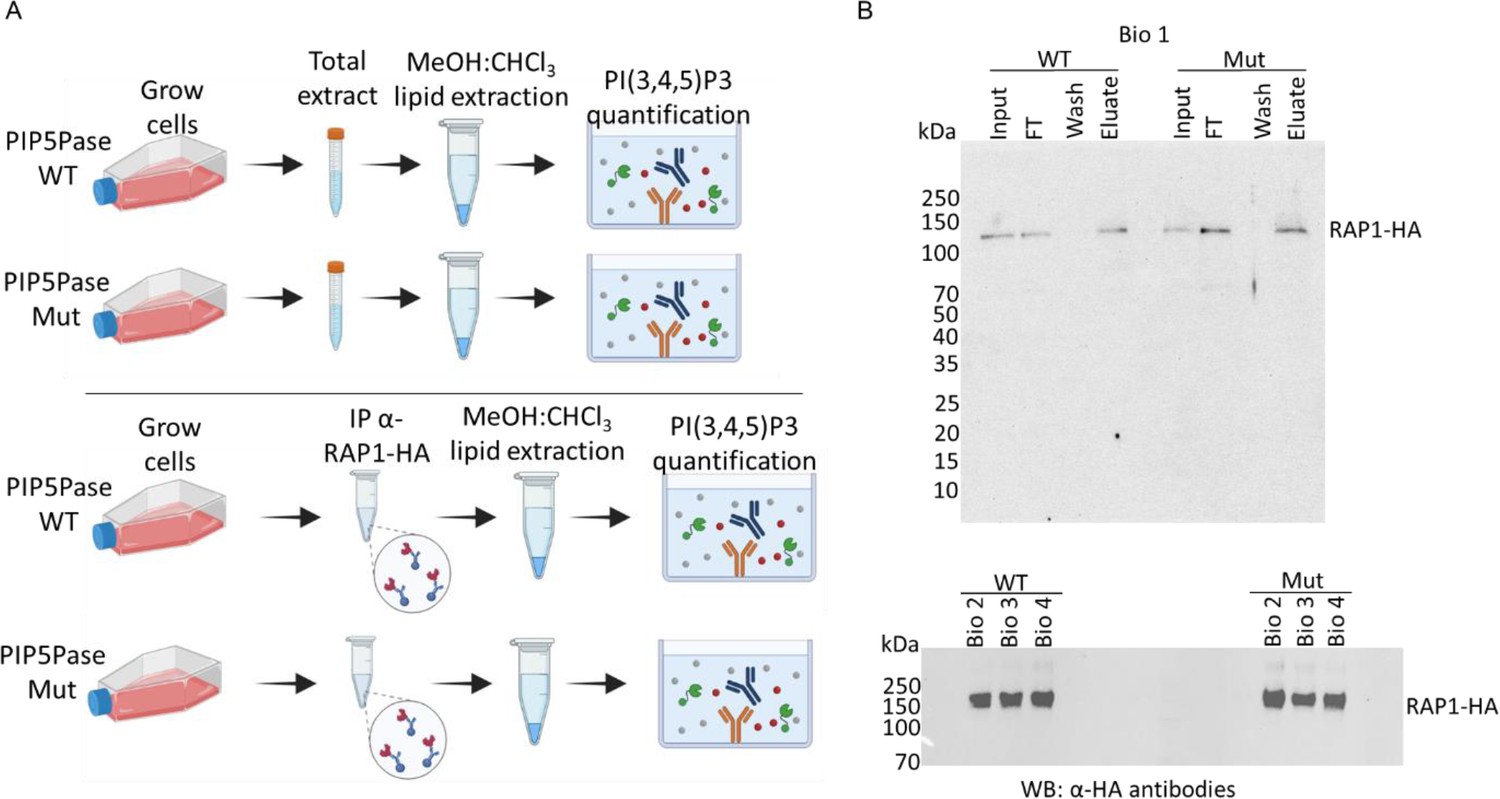
Quantification of PI(3,4,5)P3 from T. brucei bloodstream form total cell extract or associated with RAP1-HA.
(A) Top, a diagram showing acidic lipids extraction and PI(3,4,5)P3 quantification from T. brucei total cell extracts (PIP5Pase WT and Mut); bottom, diagram of acidic lipids extraction from immunoprecipitated RAP1-HA eluates (PIP5Pase WT and Mut). PI(3,4,5)P3 was quantified using a competitive ELISA assay. (B) Top, Western blot of RAP1-HA immunoprecipitation from T. brucei bloodstream forms (PIP5Pase WT and Mut) using anti-HA mAbs. The Western shows biological replicate 1 with input, flowthrough (FT), wash, and eluate. Bottom, Western blot of immunoprecipitated RAP1-HA (eluates) from biological replicates 2, 3, and 4 (PIP5Pase WT and Mut. WT, cells expressing WT PIP5Pase; Mut, cells expressing mutant PIP5Pase; IP, immunoprecipitation; Bio, biological replicates; kDa, kilodalton).
Figure 5 with 1 supplement
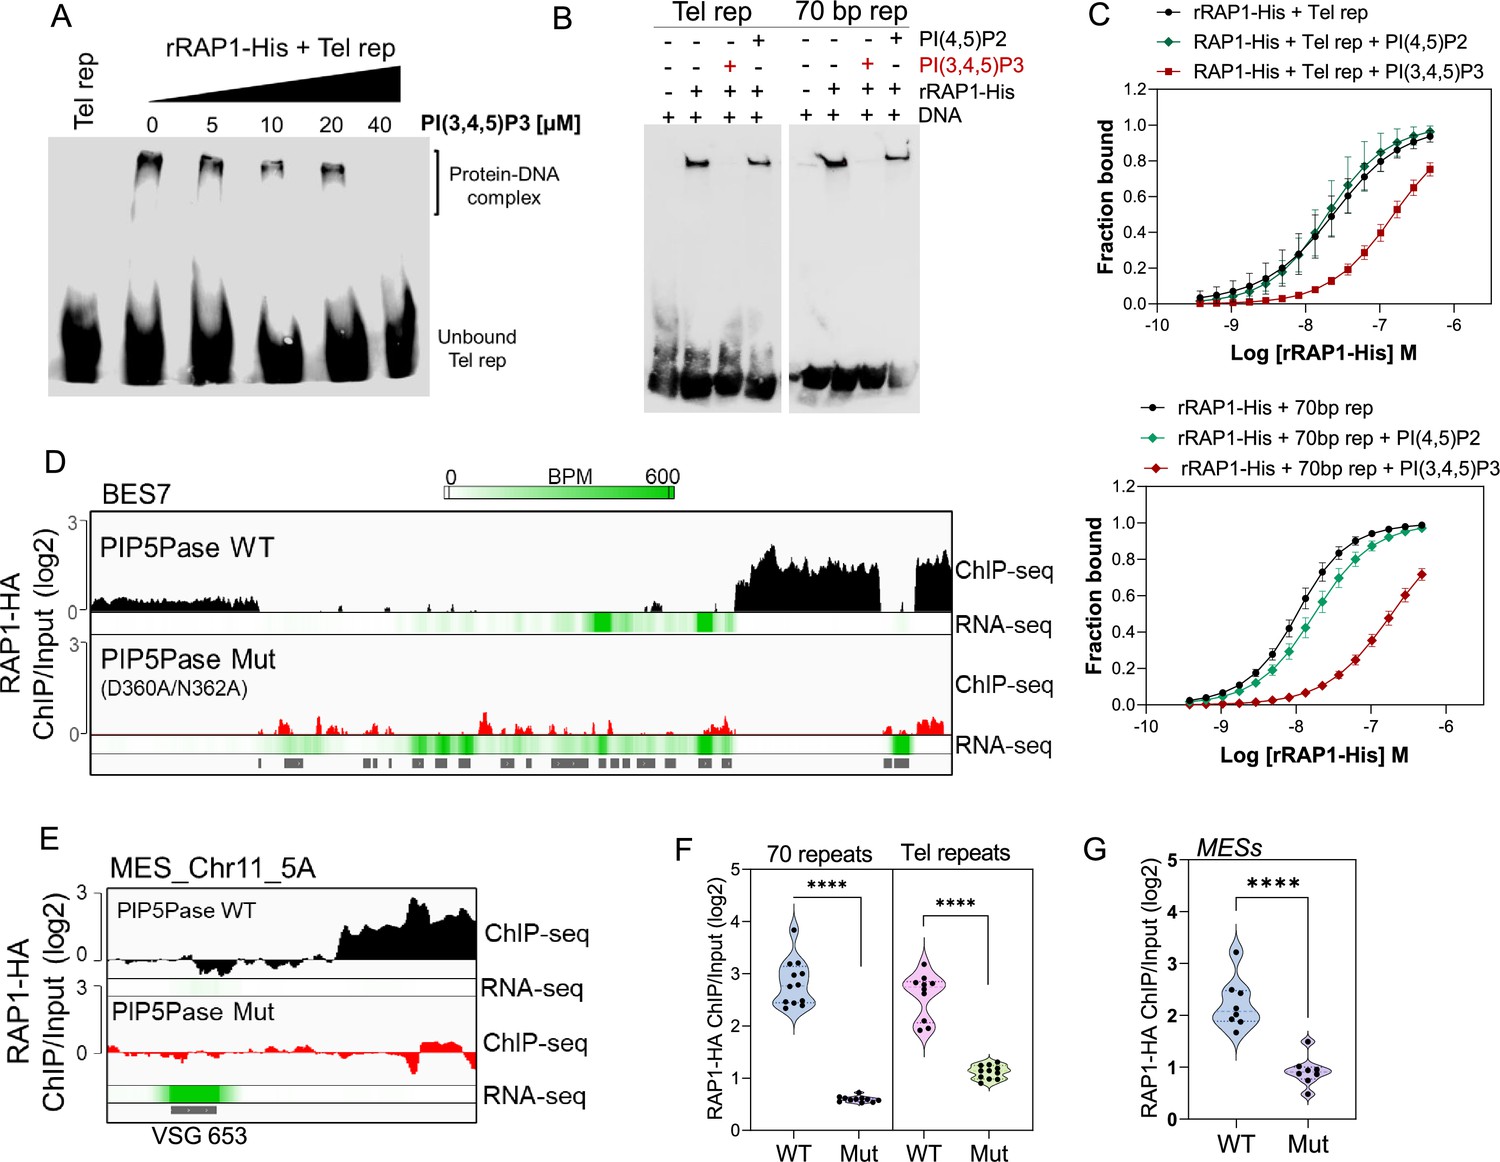
PIP5Pase controls rRAP1-His binding to telomeric ESs via PI(3,4,5)P3.
(A) EMSA of rRAP1-His with biotinylated telomeric repeats and increasing concentrations of PI(3,4,5)P3. (B) EMSA of rRAP1-His with biotinylated telomeric repeats (left) or 70 bp repeats (right) and 30 µM of PI(3,4,5)P3 or PI(4,5)P2. For A-B, samples were resolved in 6% native/PAGE, transferred to nylon membranes, and developed with streptavidin-HRP. (C) MST binding kinetics of rRAP1-His with Cy5-labelled telomeric repeats (top) or 70 bp repeats (bottom) with 30 µM of PI(3,4,5)P3 or PI(4,5)P2. Data show the mean ± SDM of four biological replicates. (D–E) ChIP-seq of RAP1-HA binding to BES7 (D) or (MES_Chr11_5 A) (E) from cells that exclusively express WT or Mut PIP5Pase for 24 hr. RNA-seq comparing exclusive expression of Mut vs WT PIP5Pase for 24 hr is shown. (F–G) Violin plots show RAP1-HA mean enrichment over 70 bp or telomeric repeats from all silent BESs (F) or MESs (G). Each dot represents an ES. BPM, bin per million. ChIP-seq and RNA-seq were performed in three biological replicates. ****, p<0.0001 using two-tailed unpaired t-test.
Figure 5—figure supplement 1

PI(3,4,5)P3 control of VSG expression and model of VSG switching and developmental silencing.
(A) Left, PIP5Pase dephosphorylates PI(3,4,5)P3 to PI(3,4)P2, and thus prevents its interaction with RAP1. RAP1 binds to ES DNA via Myb and MybL domains to maintain silent ESs. Right, Inactivation of PIP5Pase (e.g. mutation of catalytic site) results in the accumulation of PI(3,4,5)P3, which binds RAP1 N-terminus. The binding results in the displacement of RAP1 from ES DNA, thus resulting in VSG transcription. (B) PIP5Pase inactivation may result in the derepression of multiple ESs, of which one is selected for monogenic expression in the ESB by unknown mechanisms; however, it may involve proteins that associate with the active ES such as VEX1, VEX2, and ESB1. Recombination of VSG genes may also occur during this process. The remaining derepressed ESs return to repression once PI(3,4,5)P3 levels are depleted, for example PIP5Pase reactivation. The system may similarly function to repress the active ES during developmental silencing of VSG genes and parasites differentiation from bloodstream forms to the insect stage procyclic forms. The location of RAP1, PIP5Pase, and telomeres near nuclear lamina reflects RAP1 and PIP5Pase immunofluorescence (Cestari and Stuart, 2015), telomere analysis by fluorescence in situ hybridization (Cestari and Stuart, 2015), and PIP5Pase and RAP1 protein interaction analysis with nuclear lamina proteins, e.g., NUP1 (Cestari et al., 2019).
Tables
Table 1
Binding kinetics of rRAP1 to telomeric repeats, 70 bp repeats, and phosphoinositides.
Data show the mean ± standard deviation of the mean (SDM).
| Interactions | Kd [M]±SDM |
|---|---|
| rRAP1-His+Telomeric repeats | 24.1x10⁻⁹ ± 2.0x10⁻⁹ |
| rRAP1-His+70 bp repeats | 10.0x10⁻⁹ ± 0.33x10⁻⁹ |
| rRAP1-His+PI(3,4,5)P3 | 19.7x10⁻⁶ ± 2.8x10⁻⁶ |
| rRAP1-His+PI(4,5)P2 | No binding |
| rRAP1-His+Telomeric repeats+PI(3,4,5)P3 | 154.6x10⁻⁹ ± 14.2 x10⁻⁹ |
| rRAP1-His+Telomeric repeats+PI(4,5)P2 | 19.4x10⁻⁹ ± 1.5 x10⁻⁹ |
| rRAP1-His+70 bp repeats+PI(3,4,5)P3 | 187.7x10⁻⁹ ± 29.9x10⁻⁹ |
| rRAP1-His+70 bp repeats+PI(4,5)P2 | 17.5x10⁻⁸ ± 0.9 x10⁻⁹ |
Additional files
-
Supplementary file 1
RNA-seq analysis of T. brucei bloodstream form cells expressing mutant vs wildtype PIP5Pase.
Gene expression analysis by RNA-seq using Oxford nanopore sequencing of T. brucei bloodstream forms exclusively expressing mutant (D360A/N362A) compared to wildtype PIP5Pase. cDNA was synthesized from poly-A enriched RNAs. The data combines three biological replicates. LogFC, log2 fold-change; LogCPM, log2 counts per million; FDR, false discovery rate, calculated using the Benjamini-Hochberg method.
- https://cdn.elifesciences.org/articles/89331/elife-89331-supp1-v1.xlsx
-
Supplementary file 2
Statistical analysis of RAP1-HA ChIP-seq in T. brucei expressing WT PIP5Pase.
Location of ChIP-seq peaks and statistical analysis were obtained using Model-based Analysis of ChIP-Seq (MACS3) set for broad peaks search. The q-values (false discovery rate) are adjusted p-values by the Benjamini-Hochberg method. Fold enrichment is calculated for the region against random Poisson distribution with background lambda. Pileup indicates the mean value across all values in the entire peak region. Data for BESs, MES, and centromeres were included in Supplementary file 4, hence not included in this dataset. Three biological replicates comparing RAP1-HA ChIP versus Input were included in the analysis.
- https://cdn.elifesciences.org/articles/89331/elife-89331-supp2-v1.xlsx
-
Supplementary file 3
VSGs identified in VSG-seq experiments (related to Figure 1E).
Data compares VSGs expressed in cells expressing WT (wild type) or Mut (Mutant, D360A/N362A) PIP5Pase. Mutant PIP5Pase was temporarily knocked down for 24 h followed by re-expression for 60 h. Values are counts per million in log2.
- https://cdn.elifesciences.org/articles/89331/elife-89331-supp3-v1.docx
-
Supplementary file 4
Analysis of RAP1-HA binding sites on BESs, MES, and centromeres by ChiP-seq comparing ChIP vs Input.
Location of peaks and statistical analysis were obtained using Model-based Analysis of ChIP-Seq (MACS3). The q-values (false discovery rate) are adjusted p-values by the Benjamini-Hochberg method. The location of centromeres was obtained by analysis of ChIP-seq data from the kinetoplastid kinetochore protein 2 (KKT2) generated by Akiyoshi and Gull, 2014; accession numbers SRX372731 and SRX372732 mapped to the T. brucei 427–2018 genome reference. FE, fold enrichment for the region against random Poisson distribution with background lambda; Pileup, mean value across all values in the entire peak region.
- https://cdn.elifesciences.org/articles/89331/elife-89331-supp4-v1.docx
-
Supplementary file 5
Oxford nanopore sequencing metrics for RNA-seq and ChIP-seq.
RNA-seq in cells expressing WT or Mut (D360A/N362A) PIP5Pase, and ChIP-seq of RAP1-HA in cells expressing WT or Mut PIP5Pase.
- https://cdn.elifesciences.org/articles/89331/elife-89331-supp5-v1.docx
-
Supplementary file 6
List of oligonucleotides used in this study.
Oligonucleotides used for cloning RAP1 recombinant DNA, synthesis of telomeric and 70 bp repeats, synthesis of CRISPR guide RNAs, and clonal VSG-seq library preparation. BCA_Rd, nanopore barcode adaptor and random 6 nucleotide sequence. Oligonucleotide modifications, e.g., 5’-biotin (5Biosg) or 5’-Cy5 fluorescence modification (5Cy5) are indicated. Oligonucleotides are shown from 5’ to 3’.
- https://cdn.elifesciences.org/articles/89331/elife-89331-supp6-v1.docx
-
MDAR checklist
- https://cdn.elifesciences.org/articles/89331/elife-89331-mdarchecklist1-v1.pdf
Download links
A two-part list of links to download the article, or parts of the article, in various formats.
Downloads (link to download the article as PDF)
Open citations (links to open the citations from this article in various online reference manager services)
Cite this article (links to download the citations from this article in formats compatible with various reference manager tools)
PI(3,4,5)P3 allosteric regulation of repressor activator protein 1 controls antigenic variation in trypanosomes
eLife 12:RP89331.
https://doi.org/10.7554/eLife.89331.4


