Temporally resolved early bone morphogenetic protein-driven transcriptional cascade during human amnion specification
- Department of Cell Biology, Neurobiology and Anatomy, Medical College of Wisconsin, United States
- Division of Biostatistics, Institute for Health and Equity, Medical College of Wisconsin, United States
- Department of Pediatrics, Medical College of Wisconsin, United States
- Versiti Blood Research Institute, United States
- Wisconsin National Primate Research Center, United States
- Department of Obstetrics and Gynecology, University of Wisconsin - Madison School of Medicine and Public Health, United States
- Department of Comparative Biosciences, University of Wisconsin - Madison School of Veterinary Medicine, United States
Figures
Figure 1 with 1 supplement
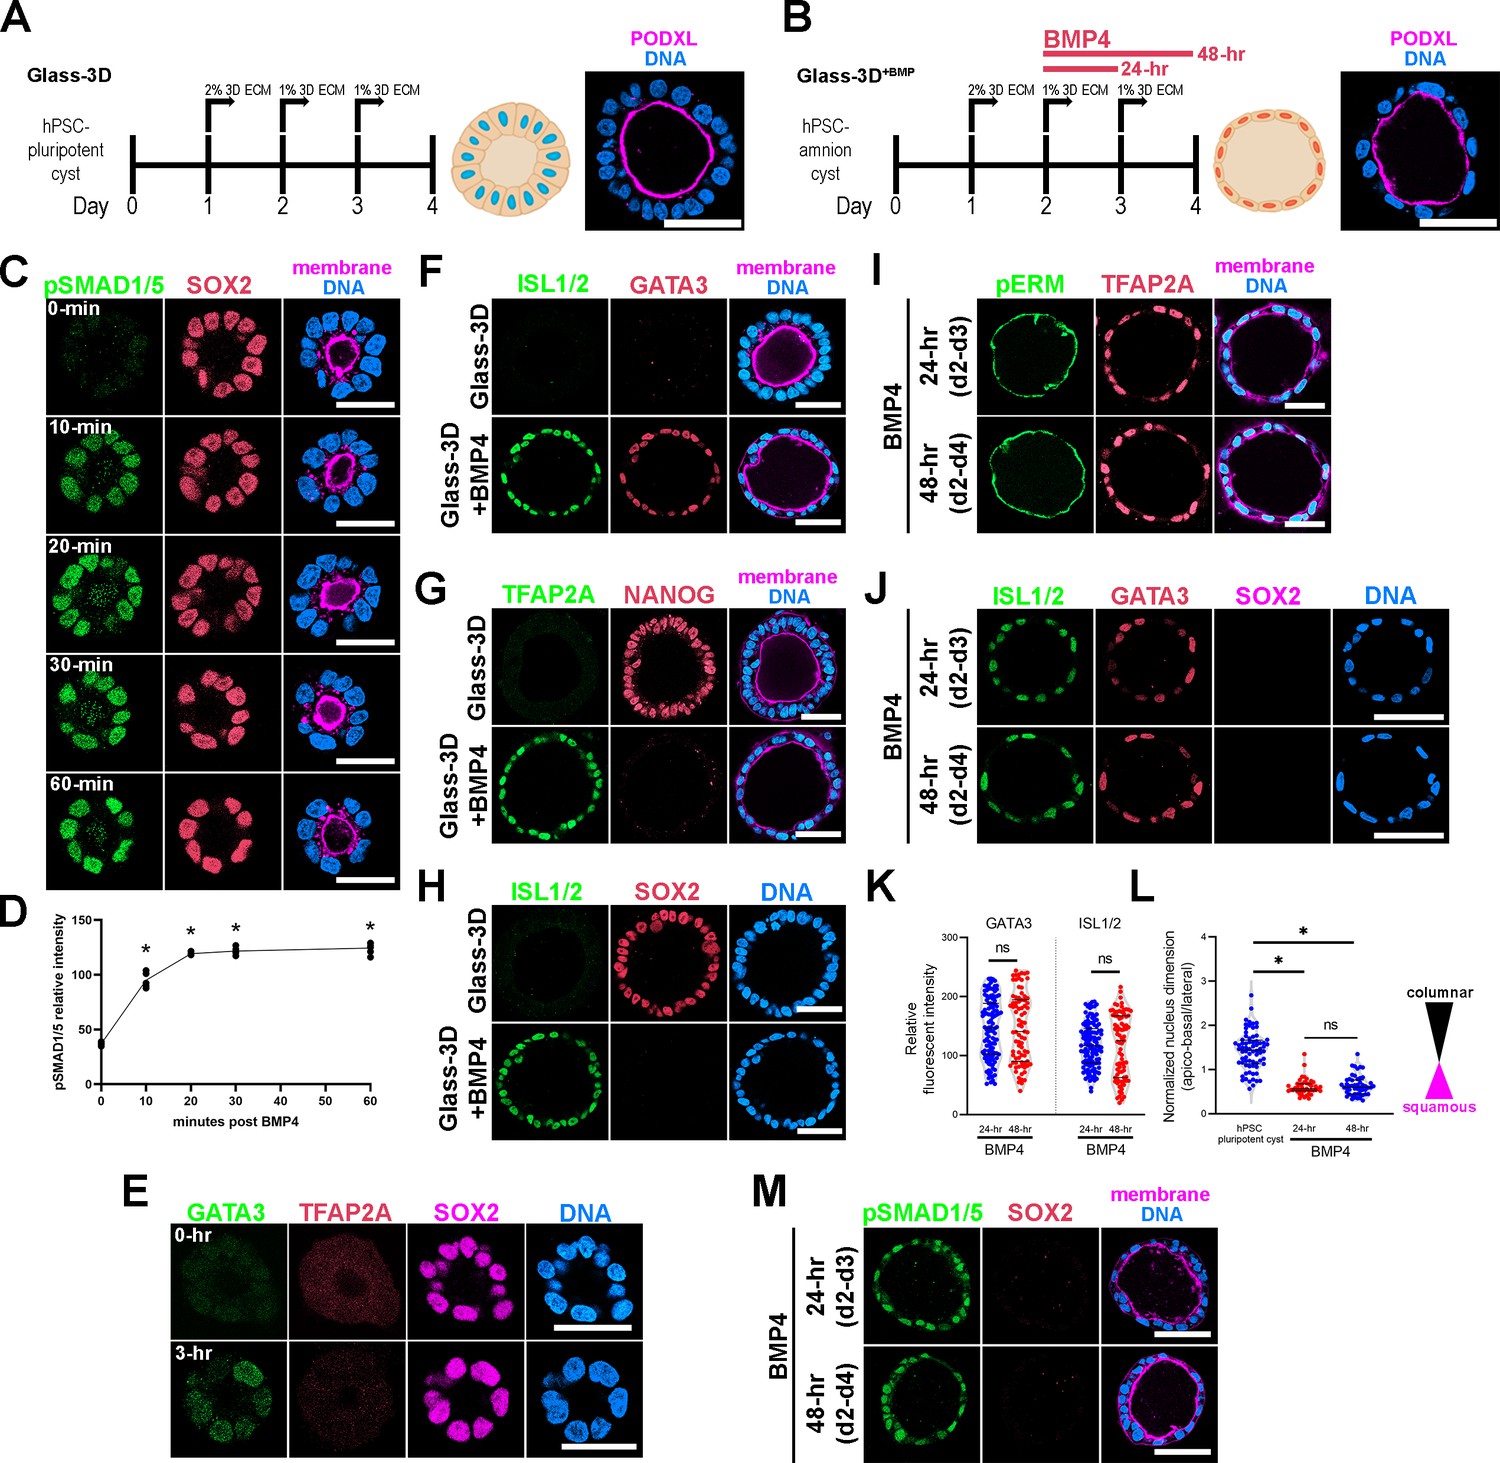
Highly penetrant amniogenesis in a Glass-3D+BMP culture system.
(A,B) Human pluripotent stem cells (hPSC)-derived pluripotent cyst (hPSC-pluripotent cyst, Glass-3D in A) and amnion cyst (Glass-3D+BMP in B) assays: immunofluorescence (IF) images show hPSC-pluripotent (A) and -amnion (B) cysts stained for PODXL (lumen, magenta) and DNA (nuclear shape, blue). BMP4 treatment (20 ng/mL) leads to uniformly squamous amnion cysts by day 4. (C) Confocal optical sections of d2 cysts harvested prior to (0 min) and 10, 20, 30, and 60 min after BMP4 treatment, stained with indicated markers. Staining for phosphorylated SMAD1/5 reveals a prominent nuclear pSMAD1/5 enrichment within 10 min of BMP4 treatment in all cells. (D) Quantification of nuclear pSMAD1/5: five independent samples were counted, more than 50 cells were counted per sample. * indicates statistically significant changes (p<0.05) compared to 0 min timepoint. (E) Abundant GATA3 expression (in green), but not TFAP2A (red), is seen by 3 hr after BMP4 treatment while SOX2 expression is maintained. (F–H) Pluripotency (NANOG, SOX2) and amnion (ISL1/2, GATA3, TFAP2A) marker expression analyses of d4 cysts grown in the Glass-3D (top) or in Glass-3D+BMP (bottom) conditions. (I, J) Confocal micrographs of d4 cysts grown in the Glass-3D+BMP system stained for phosphorylated EZRIN, RADIXIN, and MOESIN (pERM), an apical membrane marker, as well as with indicated amnion markers (top – cysts were treated with BMP4 for 24 hr between d2 and d3; bottom – treated with BMP4 for 48 hr from d2 to d4). (K, L) Quantification of GATA3 and ISL1/2 fluorescent intensities in 24 (blue, n=115 cells) and 48 hr (red, n=76 cells) BMP4 treatment samples (K), as well as of nuclear aspect ratios of d4 hPSC-cyst (black, n=63 cells), and 24 (blue, n=45 cells) and 48 hr (red, n=52) BMP4-treated cysts (harvested at d4), (L). (M) pSMAD1/5 staining (green) shows similar nuclear enrichment between 24 and 48 hr BMP4 treatment at d4 (also stained with indicated markers). Scale bars = 50 μm. BMP, bone morphogenetic protein.
Figure 1—video 1
All optical sections of Glass-3D+BMP human pluripotent stem cell (hPSC)-amnion shown in Figure 1B.
Figure 2 with 1 supplement
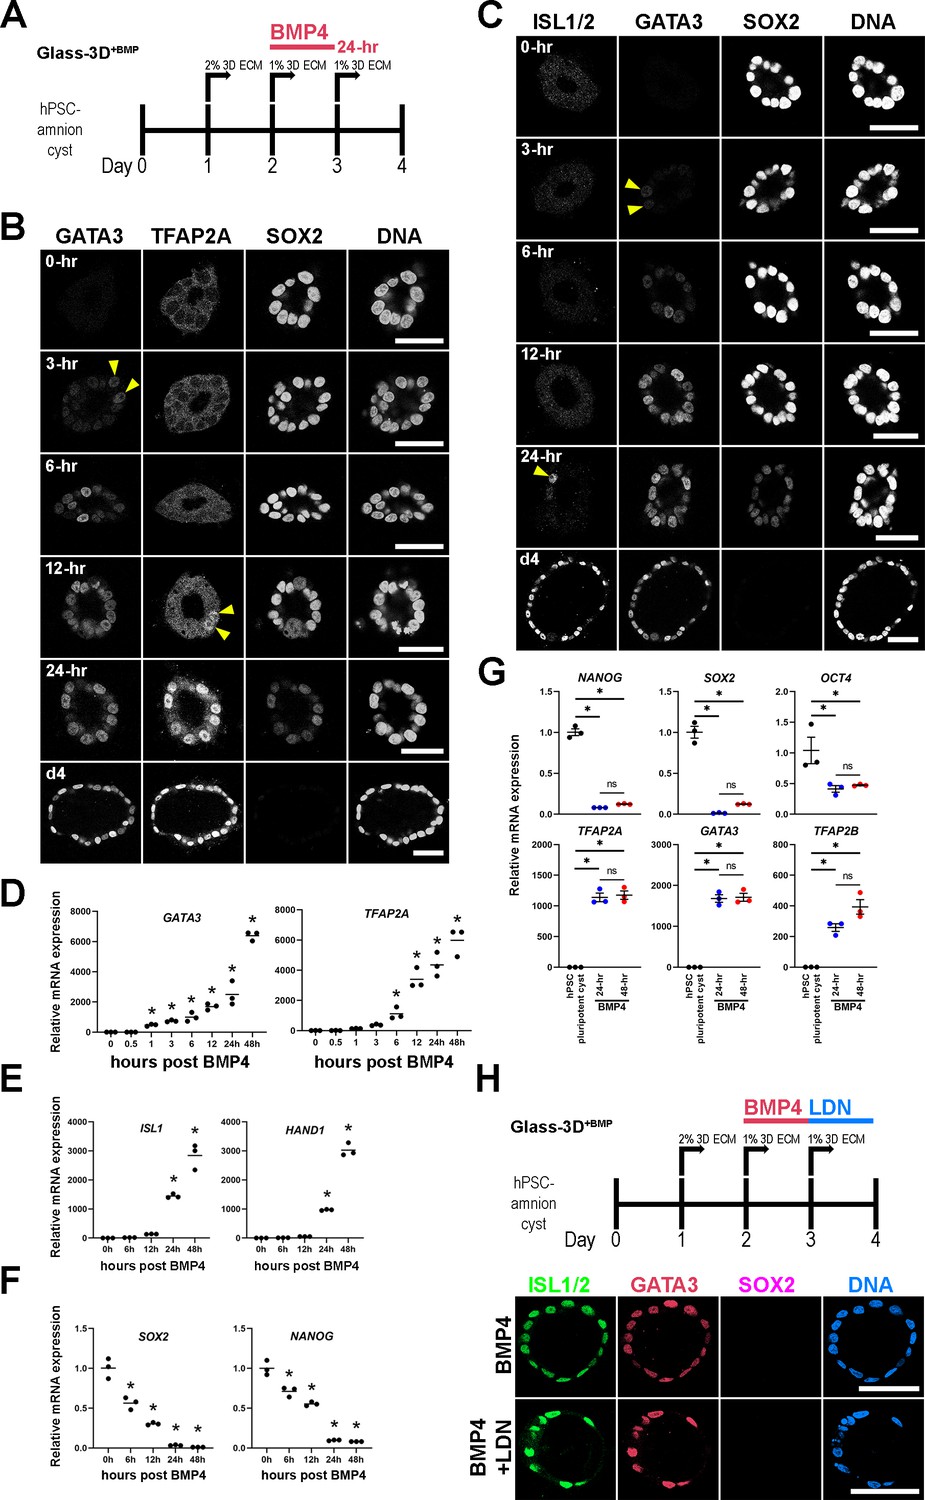
Time-course analysis of Glass-3D+BMP human pluripotent stem cell (hPSC)-amnion development.
(A) Timeline of the Glass-3D+BMP hPSC-amnion assay. Twenty four hr BMP treatment is sufficient to generate uniformly squamous hPSC-amnion cysts. (B,C) Optical sections of time-course Glass-3D+BMP hPSC-amnion cysts (harvested at indicated timepoints after BMP4 treatment) stained with indicated markers (inverted black and white fluorescent signals shown for individual channels, to aid visualization). GATA3, an immediate BMP target is seen by 3 hr (yellow arrowheads). hPSC-amnion cysts with prominent nuclear TFAP2A (B) and ISL1/2 (C) are seen by 12 and 24 hr, respectively (yellow arrowheads), while SOX2 shows gradual decrease. Consistent changes are also observed at mRNA transcript levels using quantitative RT-PCR (D–F), also see the expression of additional markers: HAND1 (amniotic) and NANOG (pluripotent); * indicates statistically significant changes (p<0.05) compared to 0 hr timepoint. (G) Relative mRNA expression analyses of indicated pluripotency (top) and amniotic (bottom) markers between d4 Glass-3D hPSC-pluripotent cyst (black), and d4 Glass-3D+BMP hPSC-amnion with 24 hr (blue) or 48 hr (red) BMP treatment; * indicates statistically significant changes (p<0.05). (H) BMP inhibitor (LDN-193189) treatment outline as well as confocal micrographs of d4 Glass-3D+BMP hPSC-amnion (top, control – 24 hr BMP4 treatment between d2 and d3) and hPSC-amnion treated with LDN-193189 between d3 and d4 after BMP4 treatment (between d2 and d3). Scale bars = 50 μm. BMP, bone morphogenetic protein.
Figure 2—figure supplement 1
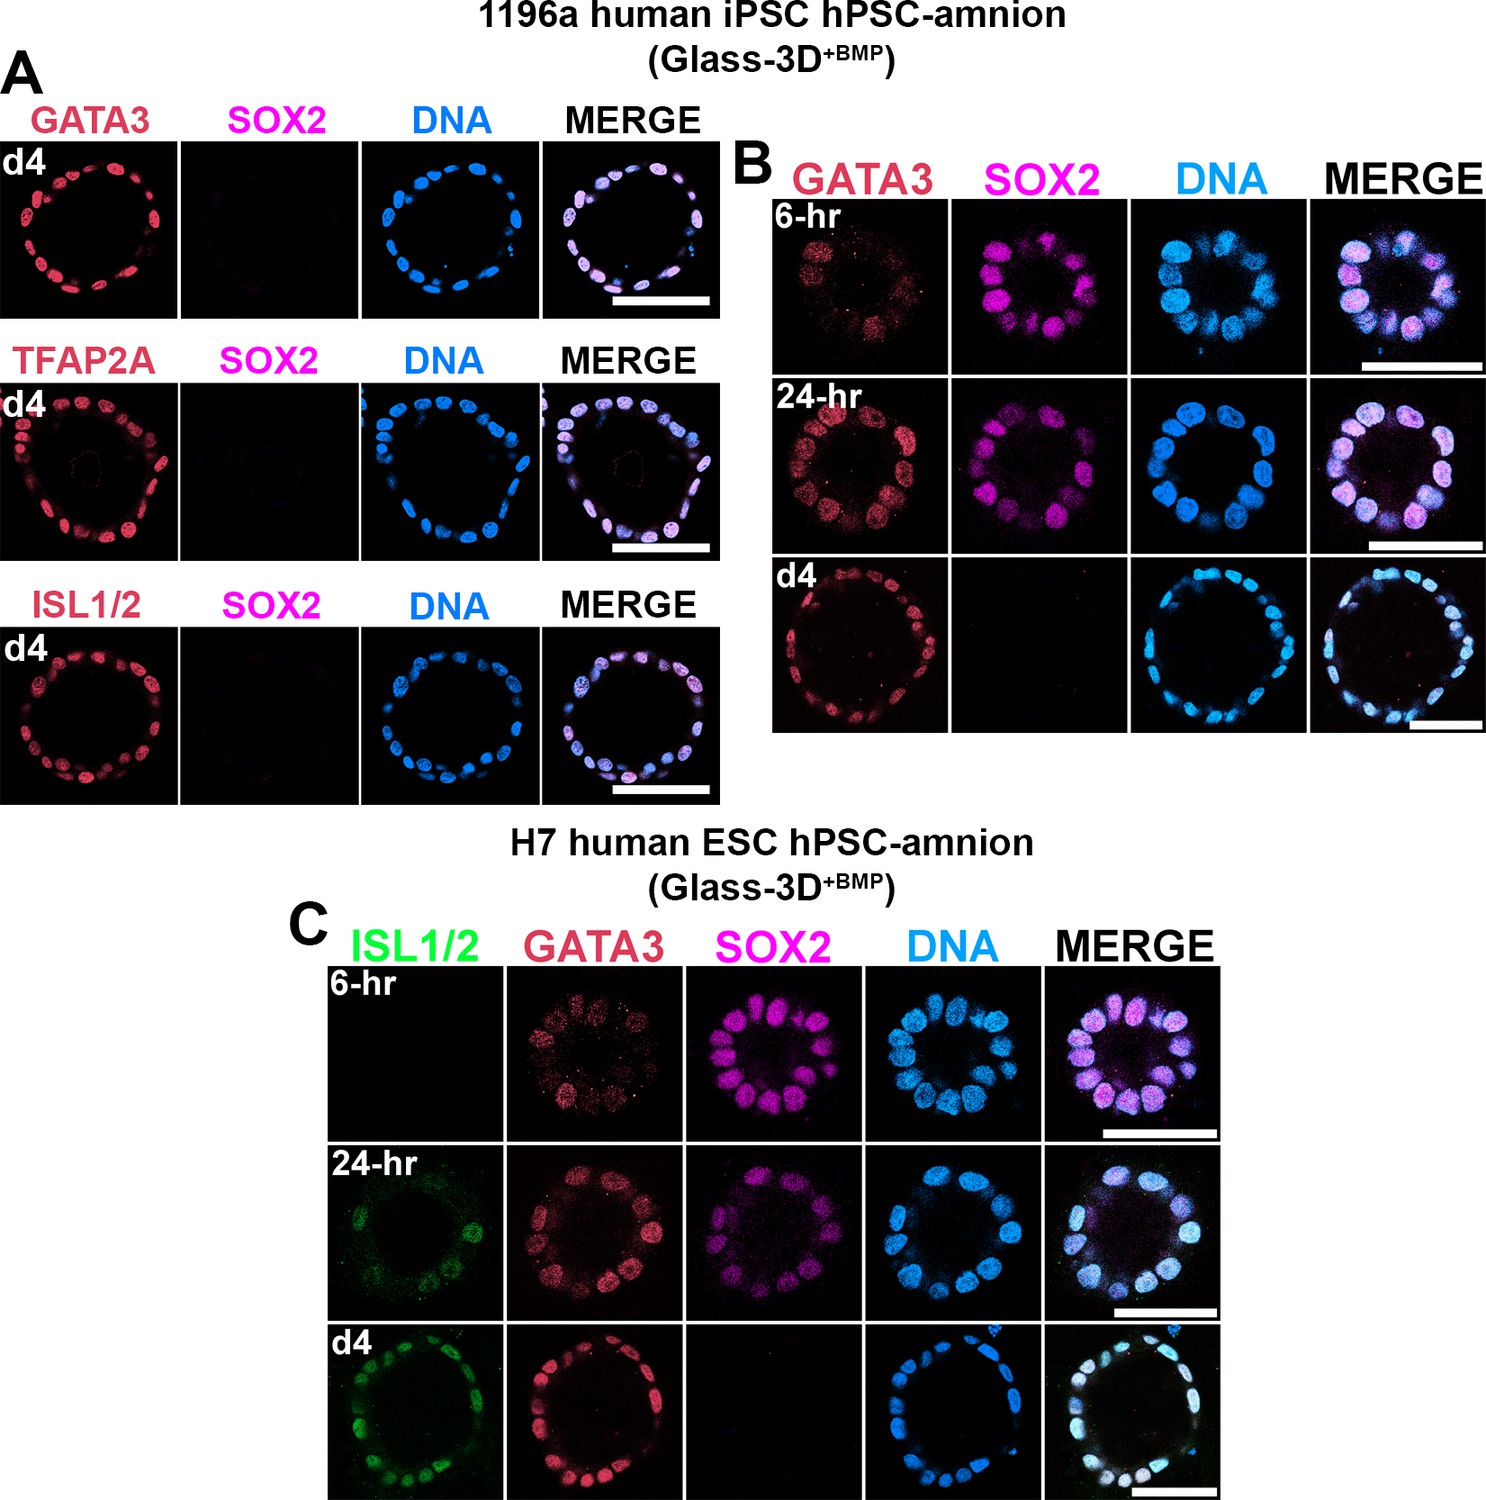
Glass-3D+BMP human pluripotent stem cell (hPSC)-amnion formation using 1196a human induced pluripotent stem cell and H7 human embryonic stem cell lines.
(A–C) Confocal micrographs of 1196a (A,B) and H7 lines (C) grown in the Glass-3D+BMP condition, stained with indicated markers and timepoints. Scale bars = 50 μm.
Figure 3
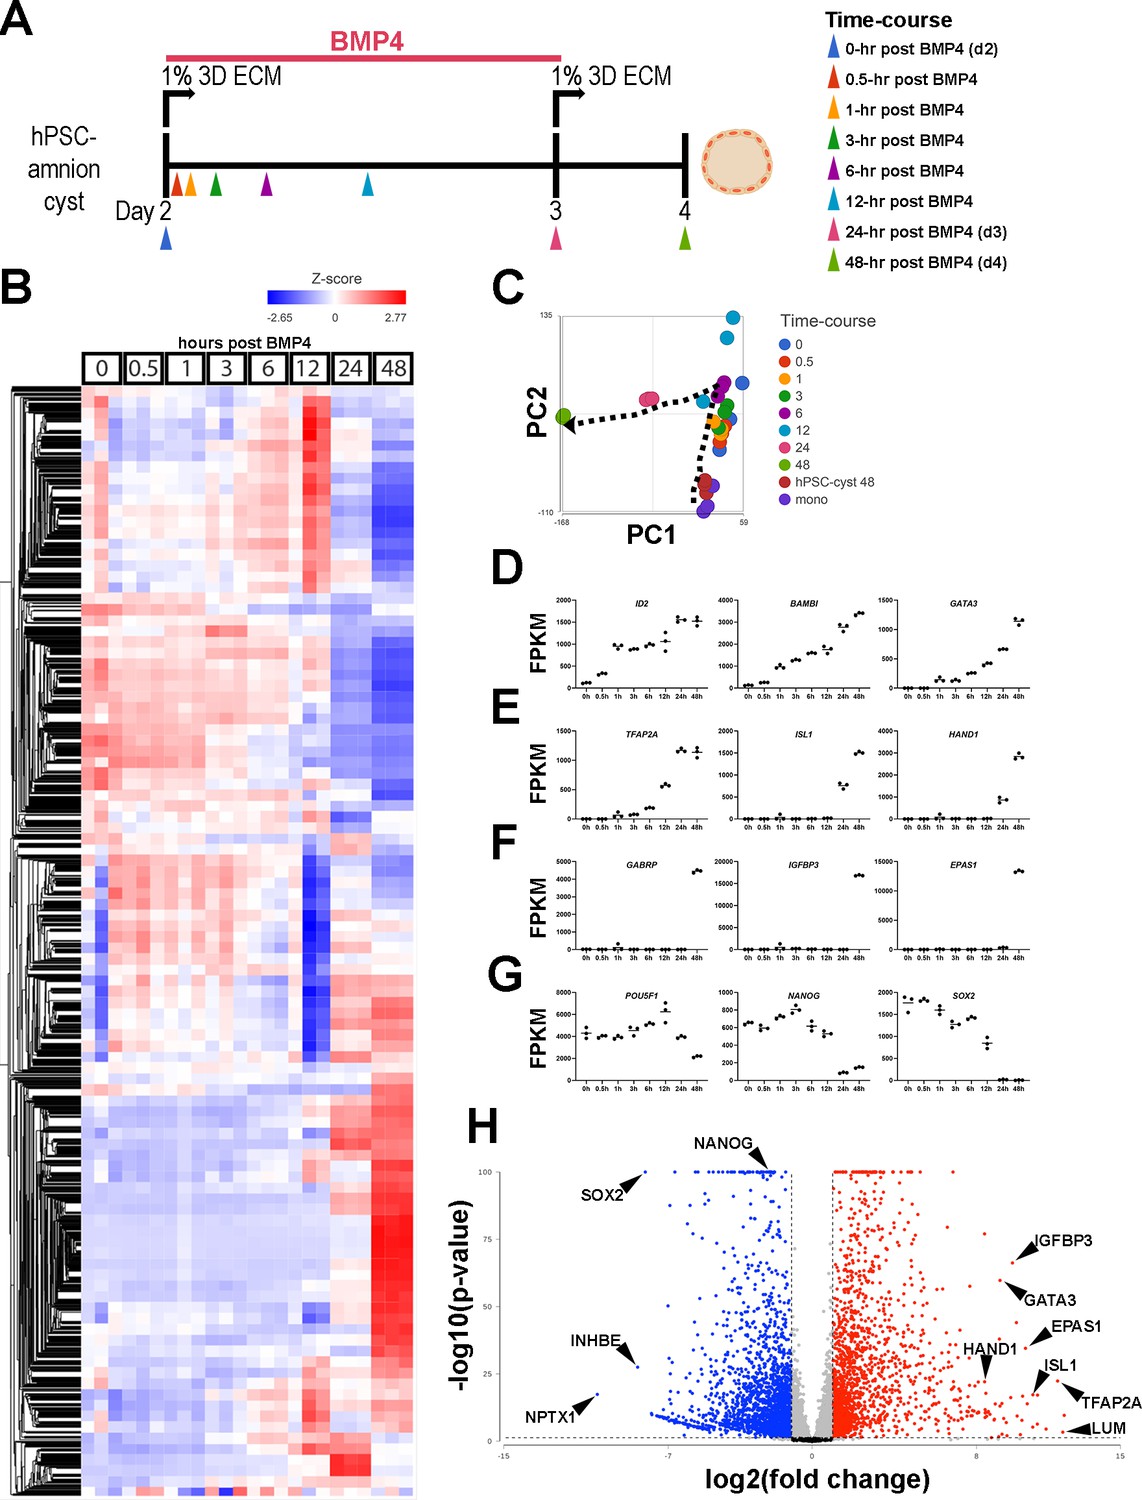
Temporally resolved transcriptomic characterization of Glass-3D+BMP human pluripotent stem cell (hPSC)-amnion.
(A) Experimental timeline (from d2) of the time-course bulk RNA sequencing analysis. Colored arrowheads indicate timepoints at which samples were harvested. (B) A heatmap showing a hierarchical clustering analysis of all detected genes (12,940): bulk transcriptomes from triplicate samples are shown at each timepoint. A gradient scale indicates Z-score. (C) Principal component analysis (PCA) plot of time-course bulk transcriptomes, using the most variable genes, revealing progressive transcriptomic changes over time (indicated by the dotted arrow). Note that coloring is consistent with the arrowheads in (A). (D–G) Time-course plots of normalized expression values for selected known immediate BMP target (D), general amnion (E), advanced amnion (F), and pluripotency genes (G). (H) A volcano plot analysis showing up- (red) and down- (blue) regulated genes in Glass-3D+BMP hPSC-amnion cysts (gene expression compared to d4 pluripotent hPSC-cysts): black lines represent cutoffs for p-value<0.05 and twofold difference. BMP, bone morphogenetic protein.
Figure 4 with 1 supplement
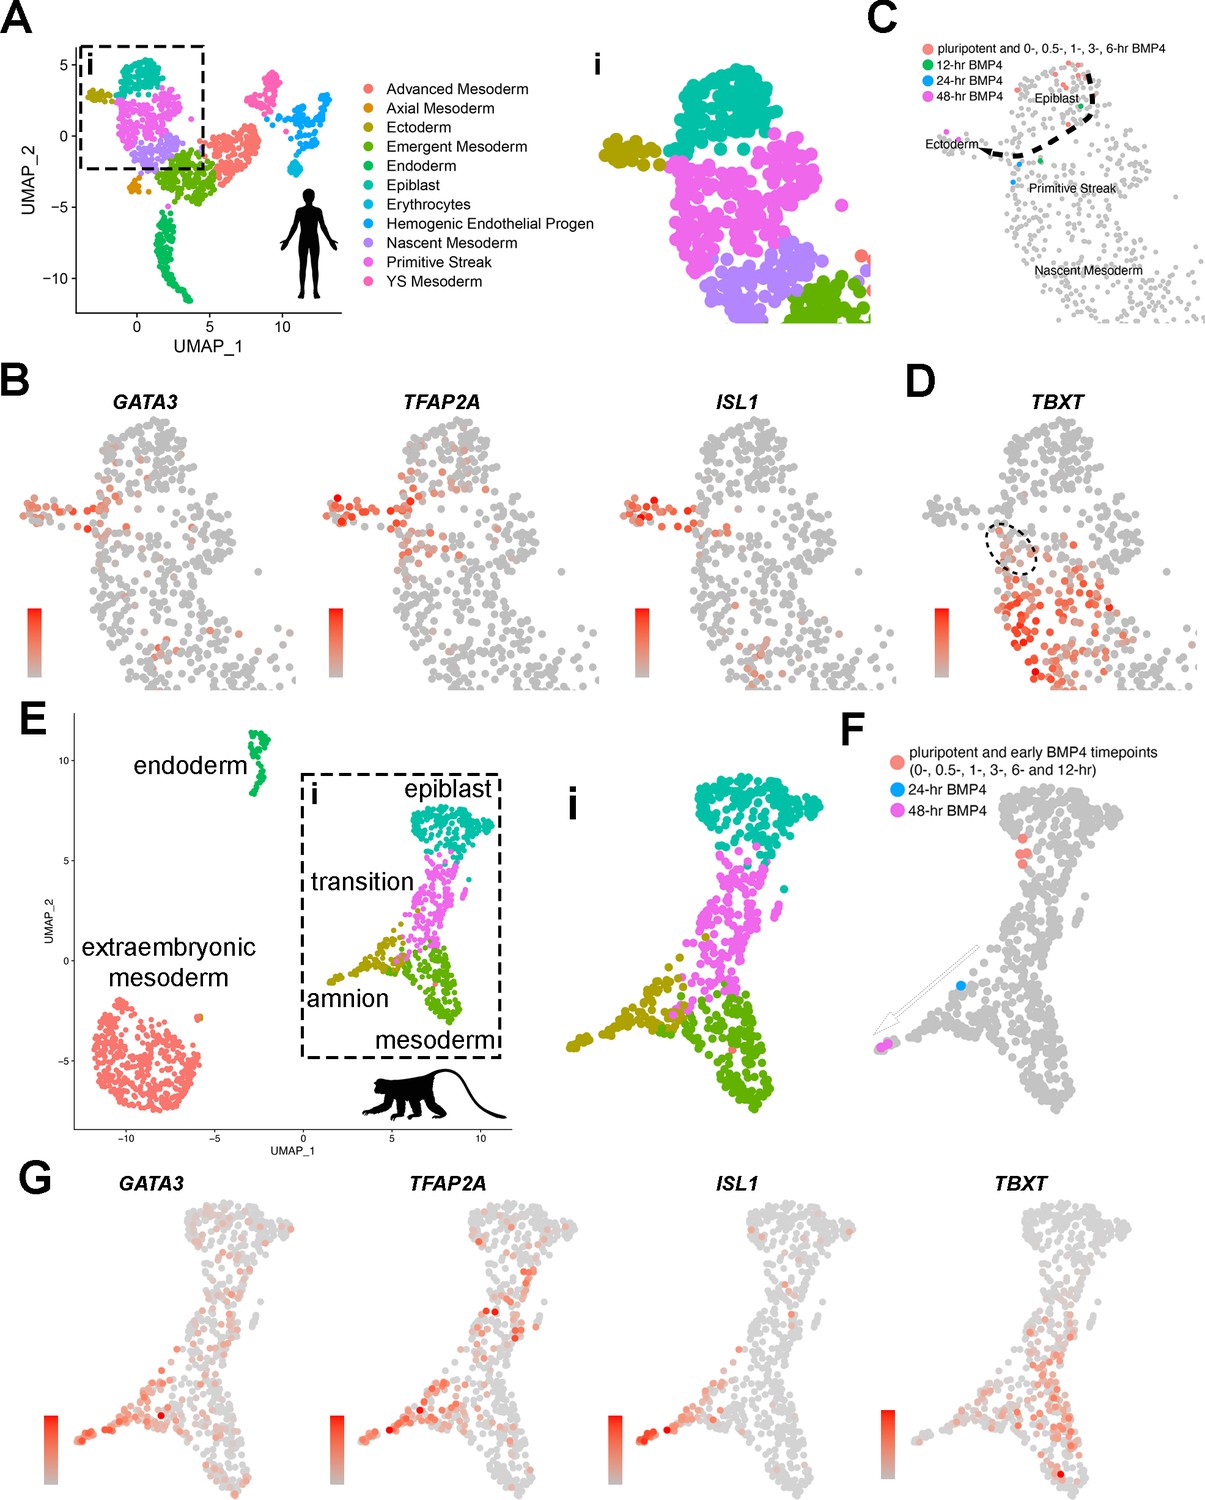
Transcriptome comparison of developing Glass-3D+BMP human pluripotent stem cell (hPSC)-amnion cysts, a Carnegie stage (CS)7 human embryo, and two GD14 cynomolgus macaque peri-gastrula.
(A) A Uniform Manifold Approximation and Projection (UMAP) plot displaying the original single-cell transcriptome coordinates of the CS7 human embryo described in Tyser et al., shown with the original annotations. The inset (i) is used for expression analyses in (B). (B) Expression of amnion markers – GATA3, TFAP2A, and ISL1 – superimposed onto the UMAP plot in (A – i). (C) Transcriptome similarity analysis comparing the CS7 human embryo single-cell dataset and the Glass-3D+BMP time-course bulk RNA sequencing dataset, showing the human CS7 embryo UMAP plot (inset) with colored cells that are transcriptomically similar to each timepoints as indicated (orange – pluripotent cysts/monolayer and 0, 0.5, 1, 3, and 6 hr post-BMP4; green – 12 hr post-BMP4; blue – 24 hr; magenta – 48 hr). While pluripotent and earlier timepoints (orange colored cells) overlap with Epiblast cells, some 12 hr (green) and all 24 hr (blue) samples are similar to a subpopulation of Primitive Streak cells, and 48 hr (magenta) samples overlap exclusively with Ectoderm (see Materials and methods for detailed bioinformatics pipeline). (D) TBXT expression transposed onto the CS7 human embryo UMAP plot, revealing TBXTlow subpopulation that show transcriptomic similarities to 24 hr post-BMP samples (indicated by dotted circle). (E) An integrated UMAP plot for two in vitro cultured gestation date (GD) 14 (8 days after culturing 6-day-old blastocyst) cynomolgus macaque peri-gastrula (replotted and reclustered from Yang et al.). (F) Transcriptome similarity analysis comparing the GD14 cynomolgus macaque peri-gastrula dataset, and the Glass-3D+BMP time-course dataset, showing the Yang et al. GD14 UMAP plot (inset ‘i’) with colored cells that are transcriptomically similar to each timepoints as indicated (orange – pluripotent cysts/monolayer and 0, 0.5, 1, 3, 6, and 12 hr post-BMP4; blue – 24 hr; magenta – 48 hr). While pluripotent and early datapoints (orange colored cells) overlap with epiblast cells, the 24 hr samples share similarities with TBXTlow population, and the 48 hr samples overlap with ISL1high amnion cells (G), expression analysis of indicated markers. Gradient scales indicate expression level (orange = high, gray = low). Uncropped plots are found in Figure 4—figure supplement 1. BMP, bone morphogenetic protein. Created with BioRender.com.
© 2024, BioRender Inc. Figure 4 was created using BioRender, and is published under a CC BY-NC-ND license. Further reproductions must adhere to the terms of this license.
Figure 4—figure supplement 1
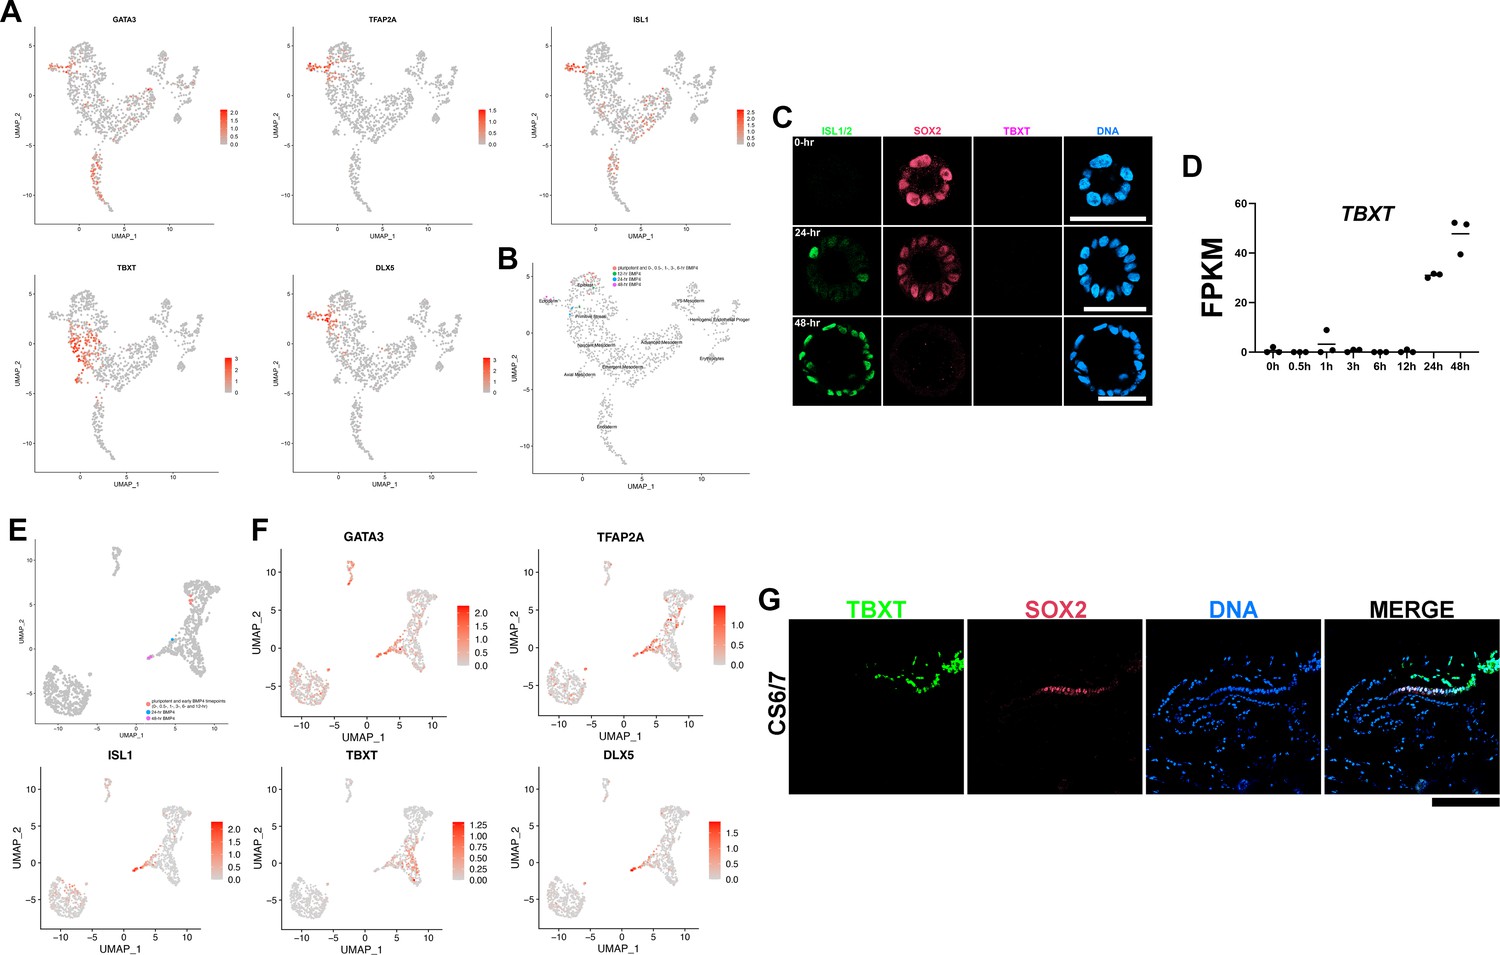
Original Uniform Manifold Approximation and Projection (UMAP) plots and TBXT expression analyses.
(A, B) Original UMAP expression plots of the Tyser et al. Carnegie stage (CS)7 human embryo single-cell RNA sequencing dataset used in this study (GATA3, TFAP2A, ISL1, TBXT, and DLX5, A) as well as time-course transcriptome similarity UMAP plot (B). (C) Confocal micrographs of control Glass-3D+BMP cysts stained for ISL1/2 (green), SOX2 (red), and TBXT (magenta). (D) Time-course plot of normalized expression values for TBXT. (E, F) Original time-course transcriptome similarity UMAP plot of the Yang et al. GD14 cynomolgus macaque dataset (E) as well as expression plots (F). (G) Optical sections of a CS6/7 cynomolgus macaque embryo stained for TBXT and SOX2. TBXT expression is enriched in primitive streak as well as in the primitive streak-derived disseminating cells.
Figure 5 with 1 supplement
Transcriptional characterizations of amnion-epiblast squamocolumnar boundary of the Carnegie stage (CS)6/7 cynomolgus monkey amniotic sac.
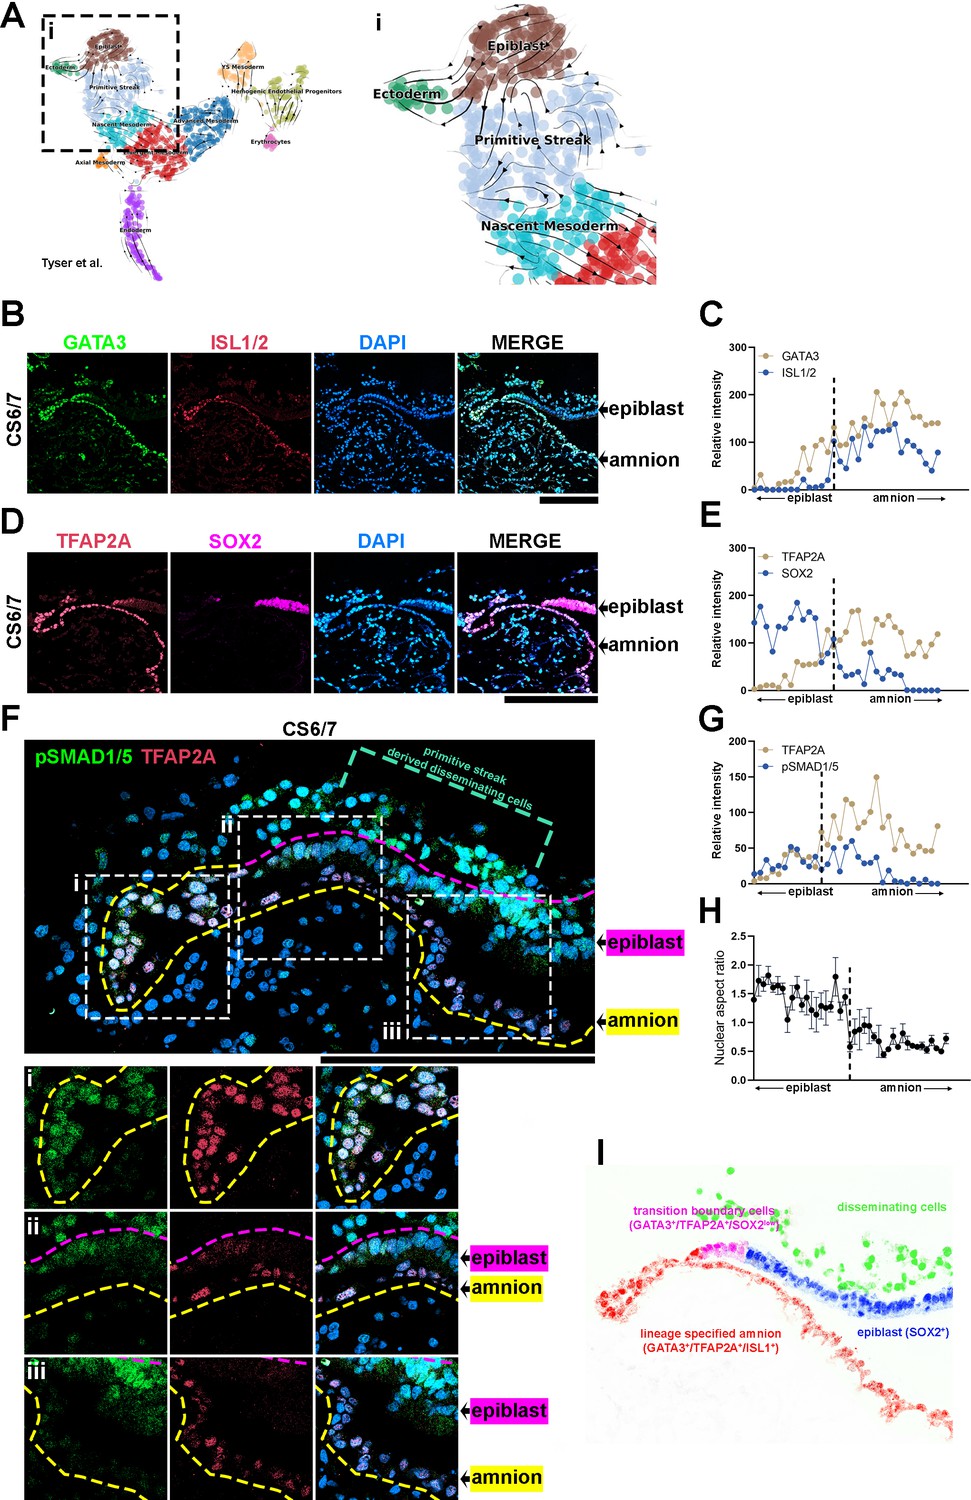
(A) RNA velocity analysis (scVelo) of the Tyser et al. CS7 human embryo dataset, showing predicted lineage progression trajectories from Epiblast to Ectoderm traversing the TBXTlow population. (B–G) Optical sections of a CS6/7 cynomolgus macaque embryo stained for indicated transcription factors (GATA3, ISL1/2, pSMAD1/5, and SOX2, B, D, F), as well as quantitation for relative fluorescent intensity in proximal (closer to epiblast) to distal (closer to amnion) cells of indicated markers at the amnion-epiblast boundary (C, E, and G are quantitation of images in B, D, and F, respectively). Each dot represents a single cell. (i), (ii), and (iii) indicate insets in (F). Half of the amniotic sac shown. Quantitation shows that, while GATA3+/TFAP2A+ cells are also SOX2+, ISL1+ cells are only seen after SOX2 expression is no longer detected: ISL1 expression is exclusive to squamous amnion cells. Moreover, the expression of pSMAD1/5 and TFAP2A is reduced in most distal amnion (ii, iii). Scale bars = 200 μm. (H) Nuclear aspect ratio quantitation of amnion-epiblast boundary cells in (B), (C), and (D), mean + standard error of the mean (SEM) shown. Dotted vertical line in each plot indicates amnion-epiblast boundary (C, E, G, H). (I) A schematic representation of the CS6/7 cynomolgus macaque amniotic sac: the confocal micrographs in (B) were edited to represent SOX2+ epiblast (pseudocolored in blue), primitive streak-derived disseminating (green), GATA3+/TFAP2A+/SOX2low transition boundary (magenta) and GATA3+/TFAP2A+/ISL1+ lineage specified amnion (red) cells.
Figure 5—figure supplement 1

Quantitation for relative fluorescent intensity in proximal and distal cells of indicated markers at the amnion-epiblast boundary in a Carnegie stage (CS)7 cynomolgus macaque embryo.
Figure 6

Characterization of differentially expressed genes identified through the Glass-3D+BMP human pluripotent stem cell (hPSC)-amnion time-course sequencing analysis.
(A–E) Combined and selected genes are shown for each category (A – immediate; B – early; C – intermediate-1; D – intermediate-2; E – late). Genes for each category are selected based on significant upregulation (FDR<0.05, fold >2, based on Z-scores) by 1 (immediate, n=5), 3 (early, n=9), 6–12 (intermediate-1, n=30), 24 (intermediate-2, n=178), and 48 hr (late, n=157) post-BMP4 treatment, compared to the previous timepoint. Vertical lines indicate timepoints at which significant changes are seen. BMP, bone morphogenetic protein.
Figure 7
Establishment of DLX5 as a new marker of amniogenesis similar to TFAP2A.
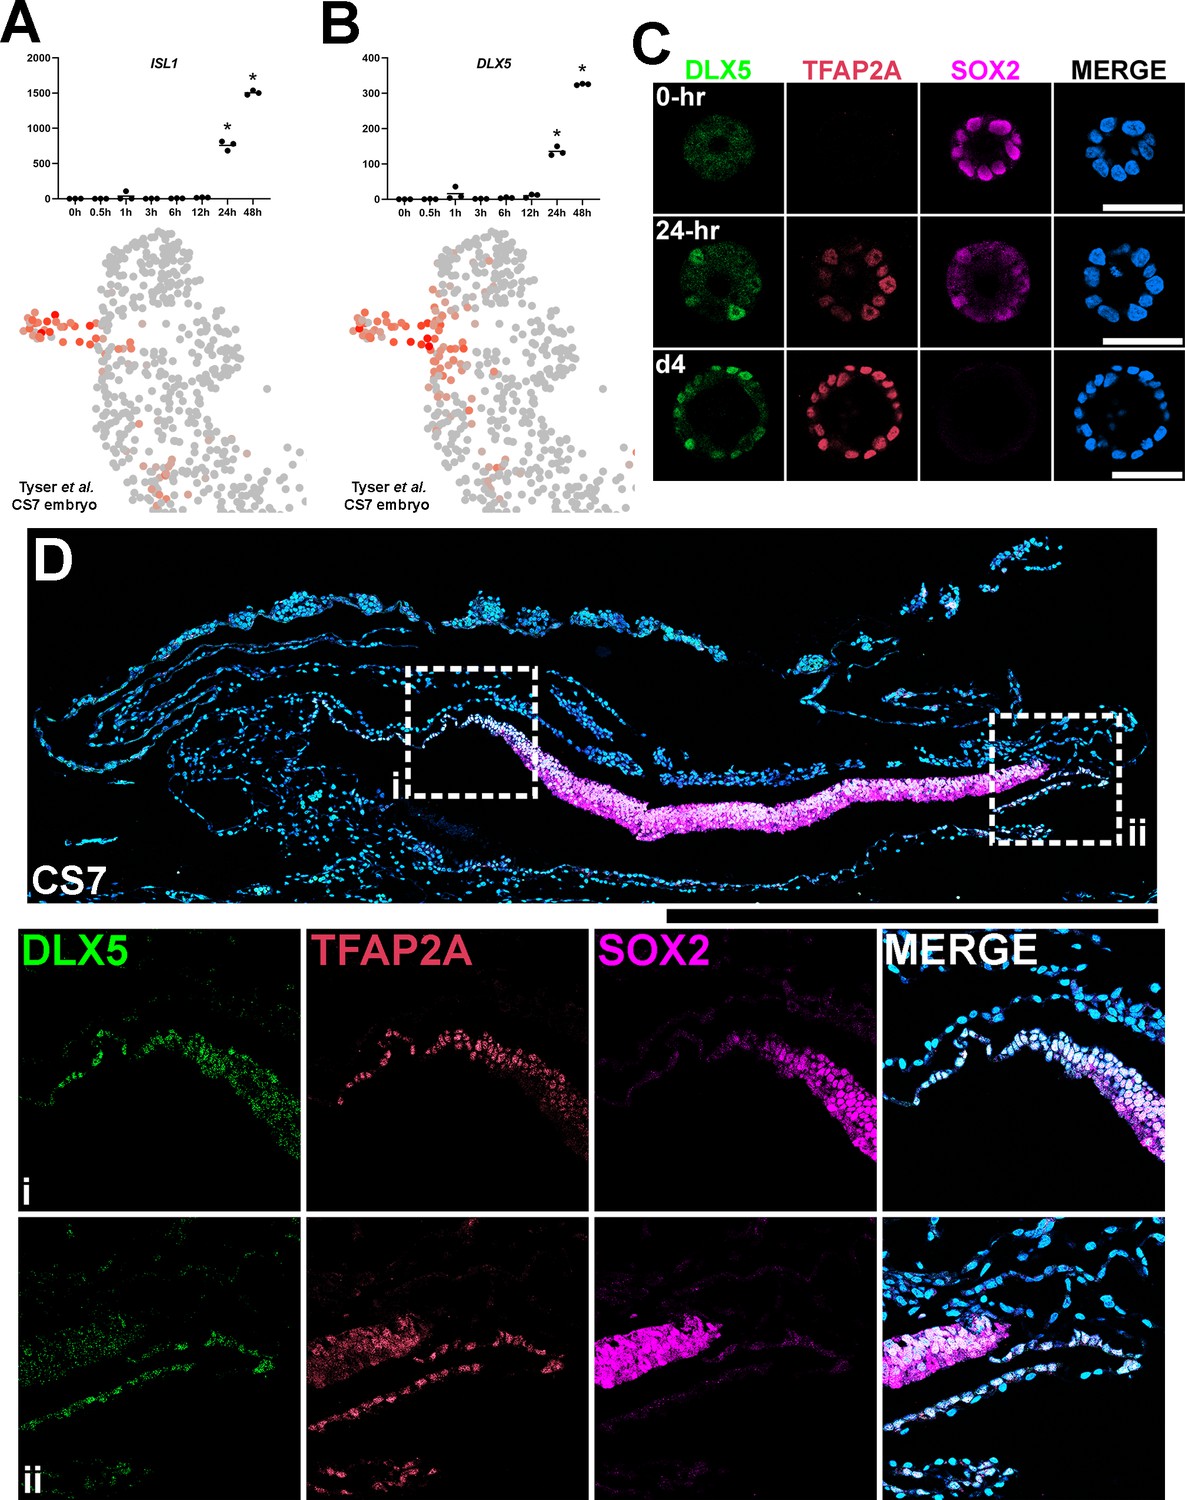
(A,B) Expression analyses for ISL1 (A) and DLX5 (B) in the time-course bulk RNA sequencing (top) and in the single-cell Carnegie stage (CS)7 human embryo (bottom) datasets. (C) Confocal optical sections of Glass-3D+BMP human pluripotent stem cell (hPSC)-amnion cysts (at 0 hr, 24 hr (d3) and d4) stained with indicated markers. (D) Histological section of a cynomolgus monkey amniotic sac at CS7 stained with indicated markers (SOX2+ epiblast; TFAP2A+/DLX5+/SOX2- amnion). Insets (i and ii) indicate the amnion-epiblast boundaries. DLX5 and TFAP2A share a similar expression pattern at the boundary. Similar to pSMAD1/5 and TFAP2A (shown in Figure 5F), most distal amnion cells show reduced DLX5 expression. Surface ectoderm bridging neural ectoderm and amniotic ectoderm is not seen at this stage. Amniotic mesenchyme is observed underlying the TFAP2A+/DLX5+ amniotic epithelium at this stage. Scale bars = 500 μm.
Figure 8 with 2 supplements
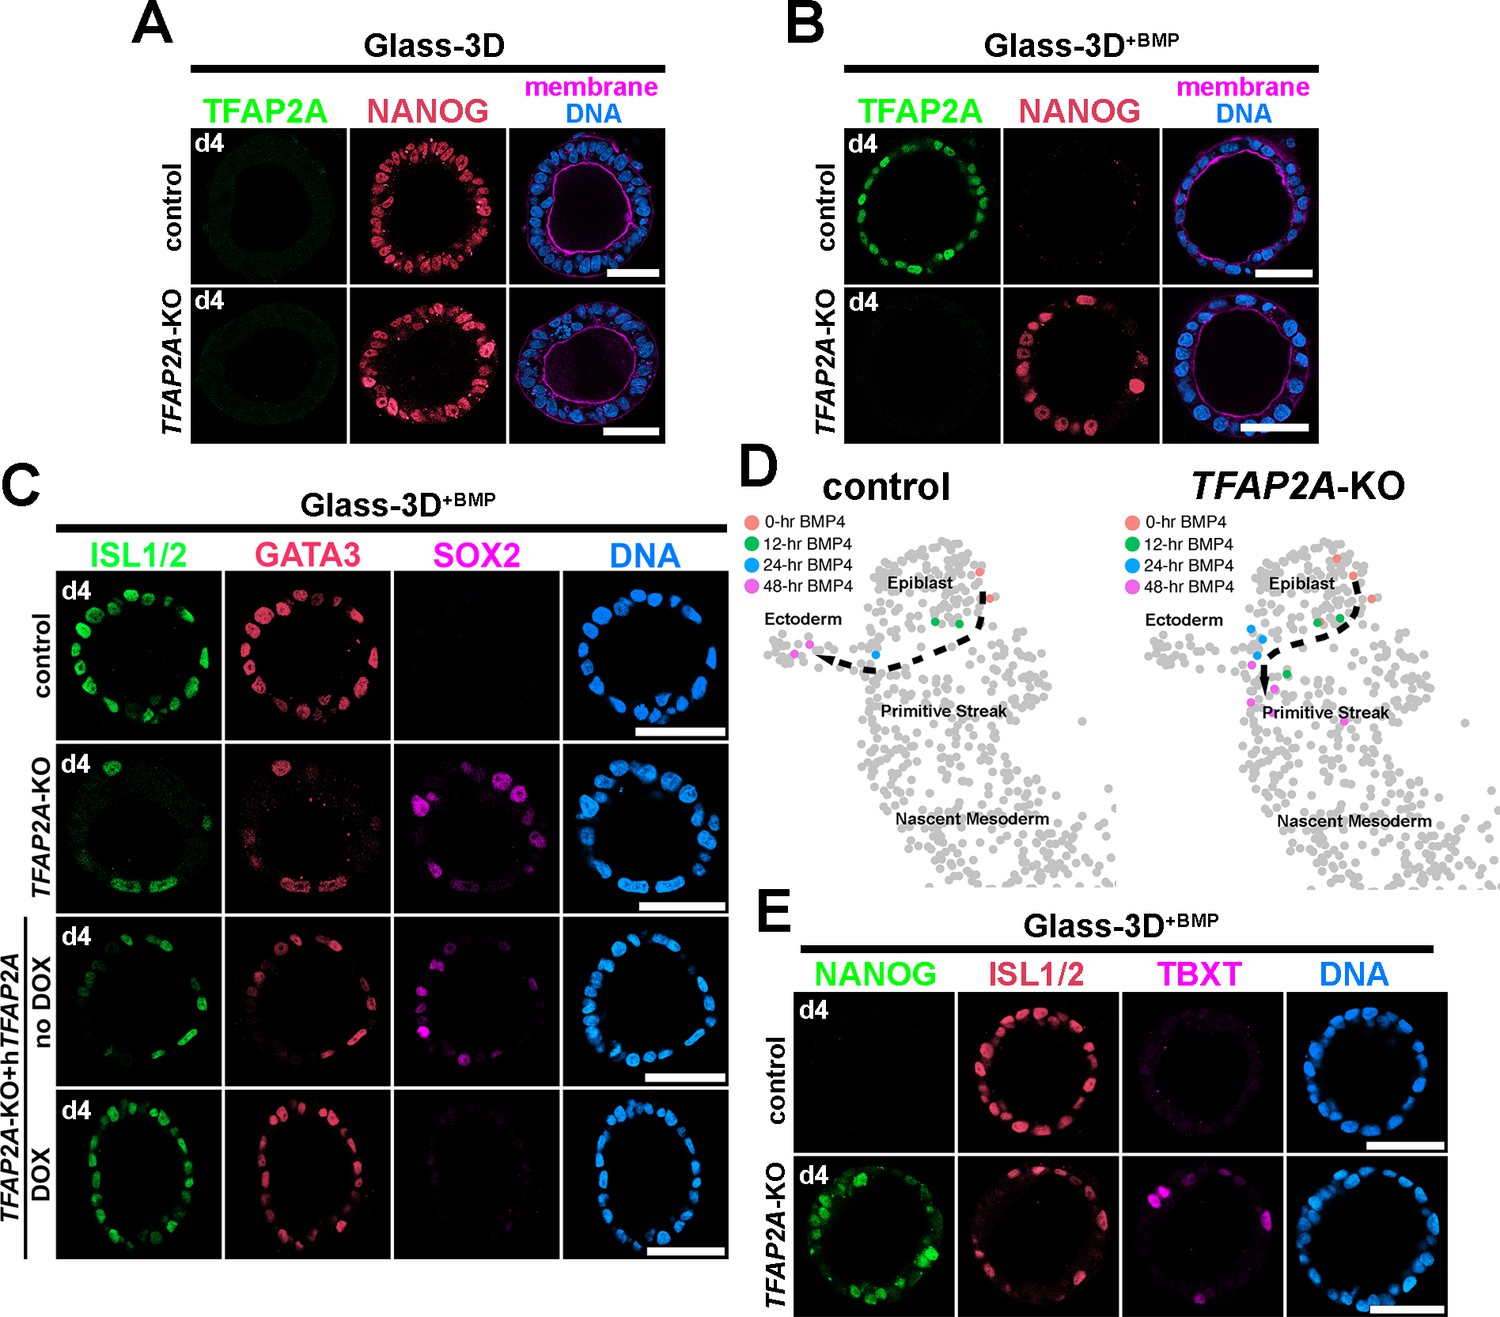
Analyses of Glass-3D+BMP human pluripotent stem cell (hPSC)-amnion in control and TFAP2A-KO background.
(A,B) Optical sections of control and TFAP2A-KO cysts in Glass-3D (A, pluripotent) as well as in Glass-3D+BMP (B). While control-like pluripotent cysts are formed in Glass-3D, several NANOG+ cells are still seen in Glass-3D+BMP in the absence of TFAP2A. (C) Confocal micrographs of d4 control, TFAP2A-KO and TFAP2A-KO carrying a doxycycline (DOX)-inducible human TFAP2A transgenic construct with or without DOX treatment, stained with indicated markers. (D) Transcriptome similarity analysis comparing the Carnegie stage (CS)7 human embryo single-cell dataset with the time-course (0, 12, 24, and 48 hr post-BMP) bulk dataset from control and TFAP2A-KO Glass-3D+BMP hPSC-amnion. Orange, green, blue, and magenta colored cells are transcriptomically similar to 0, 12, 24, and 48 hr post-BMP bulk RNA sequencing samples, respectively. While a clear differentiation trajectory from Epiblast to Ectoderm is seen in control (left), a halted amnion lineage progression is seen in the TFAP2A-KO background. (E) Optical sections of control and TFAP2A-KO cysts in Glass-3D+BMP stained for NANOG (green), ISL1/2 (red), and TBXT (magenta). Scale bars = 50 μm. BMP, bone morphogenetic protein.
Figure 8—figure supplement 1
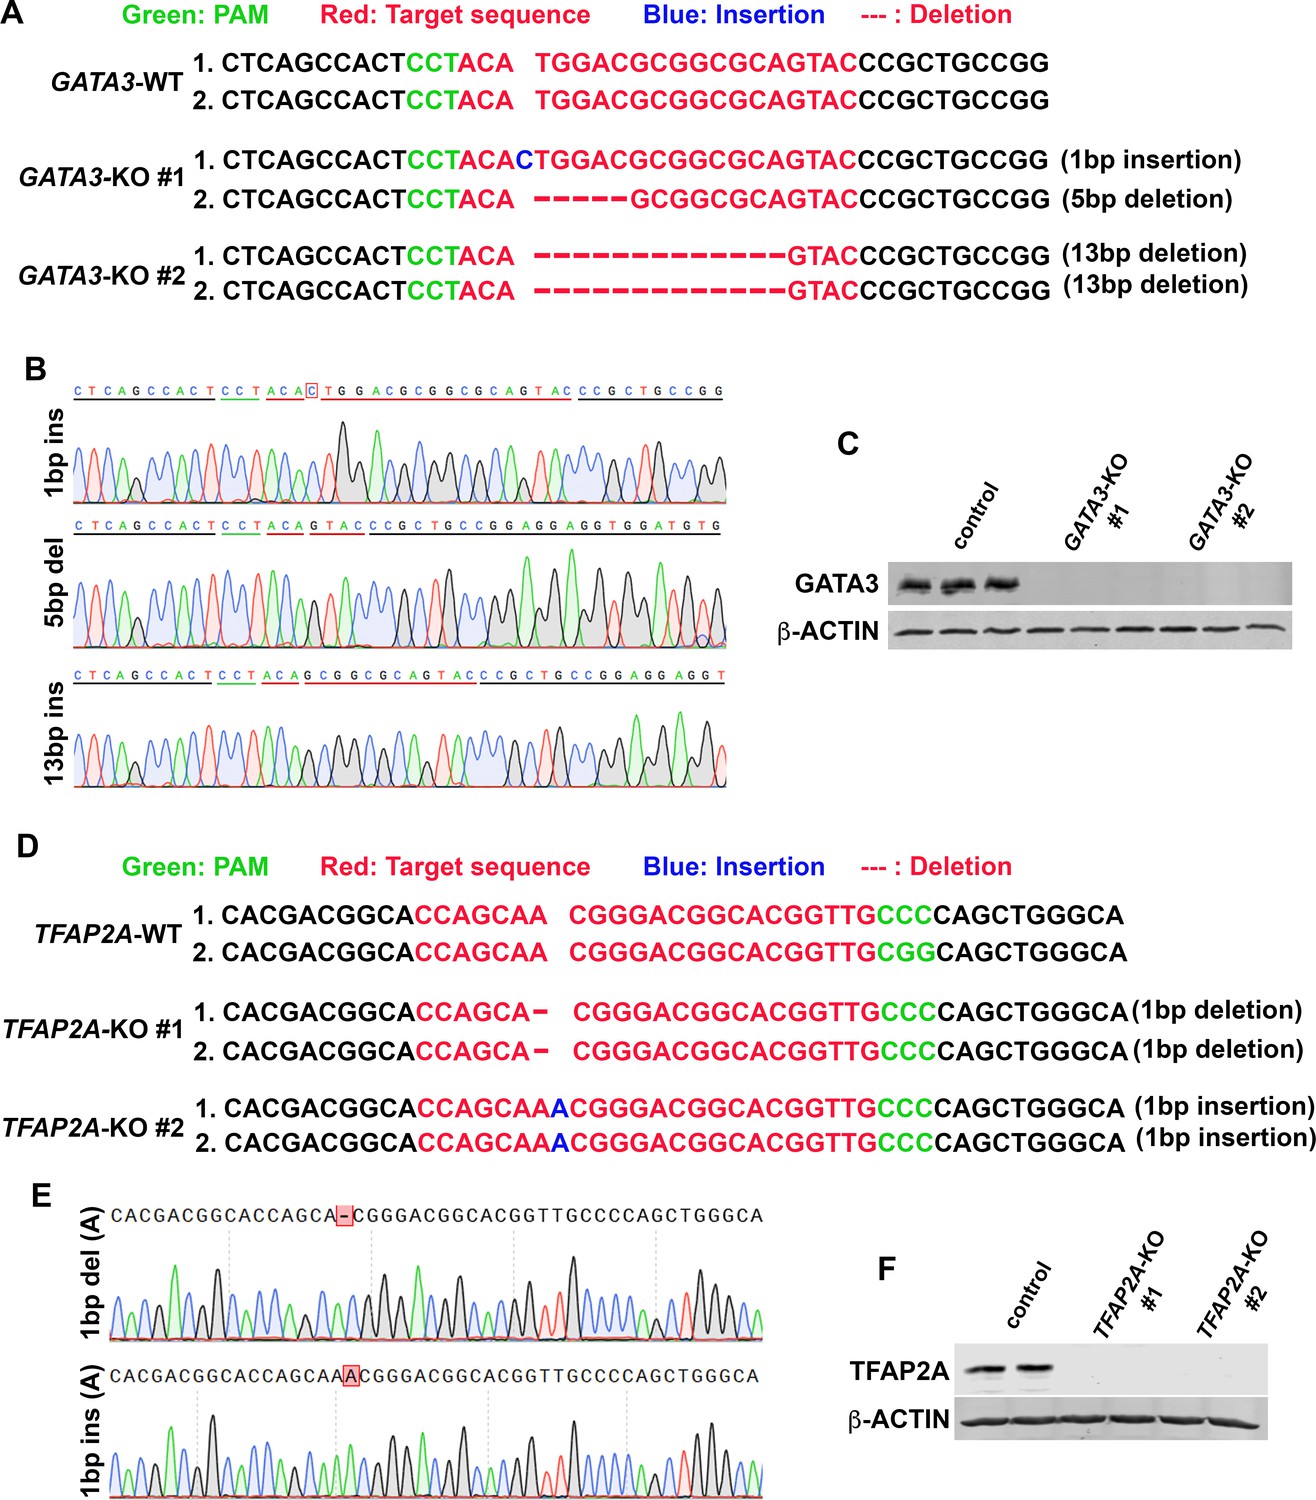
Validation of GATA3- and TFAP2A-KO human pluripotent stem cell (hPSC) lines.
(A–C) Sequenced genotyping results of GATA3-KO #1 and #2 lines (A), representative sequence traces for each mutation are shown in (B). Western blot analysis for GATA3 in control and GATA3-KO #1 and #2 lysates (C, β-actin is used as a loading control, triplicates shown). (D–F) Genotyping results of TFAP2A-KO #1 and #2 lines (D), representative sequence traces for each mutation are shown in (E). Western blot analysis for TFAP2A in control and TFAP2A-KO #1 and #2 lysates (F, β-actin is used as a loading control, duplicates shown).
Figure 8—figure supplement 2
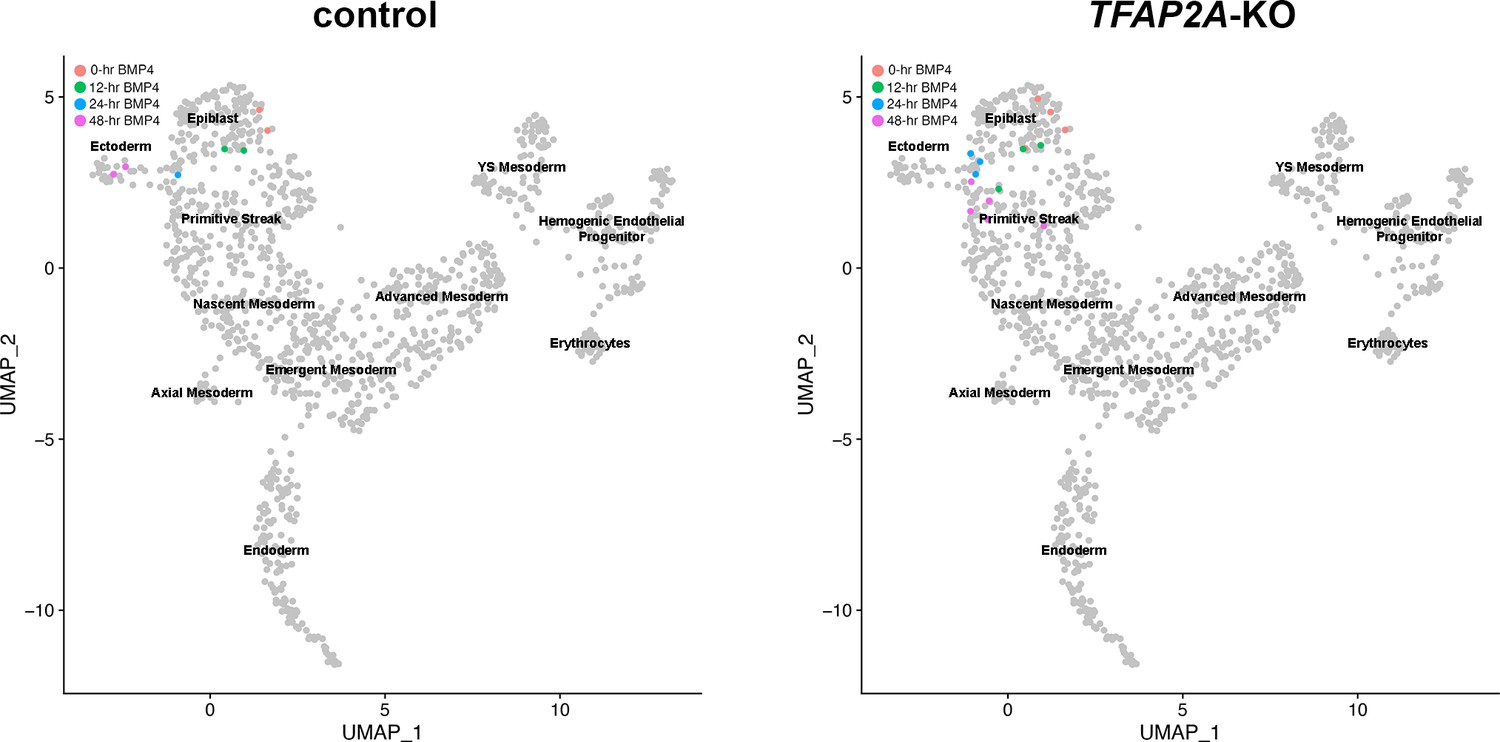
Uncropped transcriptional similarity Uniform Manifold Approximation and Projection (UMAP) plots for control and TFAP2A-KO shown in Figure 8D.
Additional files
-
Supplementary file 1
Glass-3D+BMP human pluripotent stem cell (hPSC)-amnion time-course bulk RNA sequencing dataset.
(A) Normalized and filtered count matrix of the time-course bulk-RNA sequencing. (B–C) Gene expression comparison analysis between 48 hr (d4) Glass-3D+BMP hPSC-amnion and d4 Glass-3D hPSC-cysts: lists of 1813 upregulated (B) and 2088 down- (C) regulated genes. (D–E) Gene Ontology analyses (Biological Processes) for top all significantly up- (D) and down- (E) regulated genes.
- https://cdn.elifesciences.org/articles/89367/elife-89367-supp1-v1.xlsx
-
Supplementary file 2
Lists of immediate, early, intermediate, and late genes.
An excel file containing temporally resolved gene lists: (A) immediate (0.5 hr and 1 hr, 57 genes); (B) early (3 hr and 6 hr, 135 genes); (C) intermediate-1 (12 hr, 81 genes); (D) intermediate-2 (24 hr, 642 genes); (E) late (48 hr, 909 genes). Genes that showed significant upregulation compared to the previous timepoint (e.g. 0.5 hr compared to 0 hr, 3 hr compared to 1 hr) were retained. Duplicated genes found in the list from earlier timepoint lists are removed. For example, GATA3 is significantly upregulated throughout the time-course, but is only included in the immediate category. Genes with averaged normalized counts <100 were excluded.
- https://cdn.elifesciences.org/articles/89367/elife-89367-supp2-v1.xlsx
-
Supplementary file 3
Lists of reagents used in this study.
(A–C) Lists of antibodies (A), primers (B), and plasmids (C).
- https://cdn.elifesciences.org/articles/89367/elife-89367-supp3-v1.xlsx
-
MDAR checklist
- https://cdn.elifesciences.org/articles/89367/elife-89367-mdarchecklist1-v1.pdf
Download links
A two-part list of links to download the article, or parts of the article, in various formats.
Downloads (link to download the article as PDF)
Open citations (links to open the citations from this article in various online reference manager services)
Cite this article (links to download the citations from this article in formats compatible with various reference manager tools)
Temporally resolved early bone morphogenetic protein-driven transcriptional cascade during human amnion specification
eLife 12:RP89367.
https://doi.org/10.7554/eLife.89367.3


