The target of rapamycin signaling pathway regulates vegetative development, aflatoxin biosynthesis, and pathogenicity in Aspergillus flavus
- State Key Laboratory of Ecological Pest Control for Fujian and Taiwan Crops, Key Laboratory of Pathogenic, Fungi and Mycotoxins of Fujian Province, School of Life Sciences, Fujian Agriculture and Forestry University, China
Figures
Figure 1 with 1 supplement
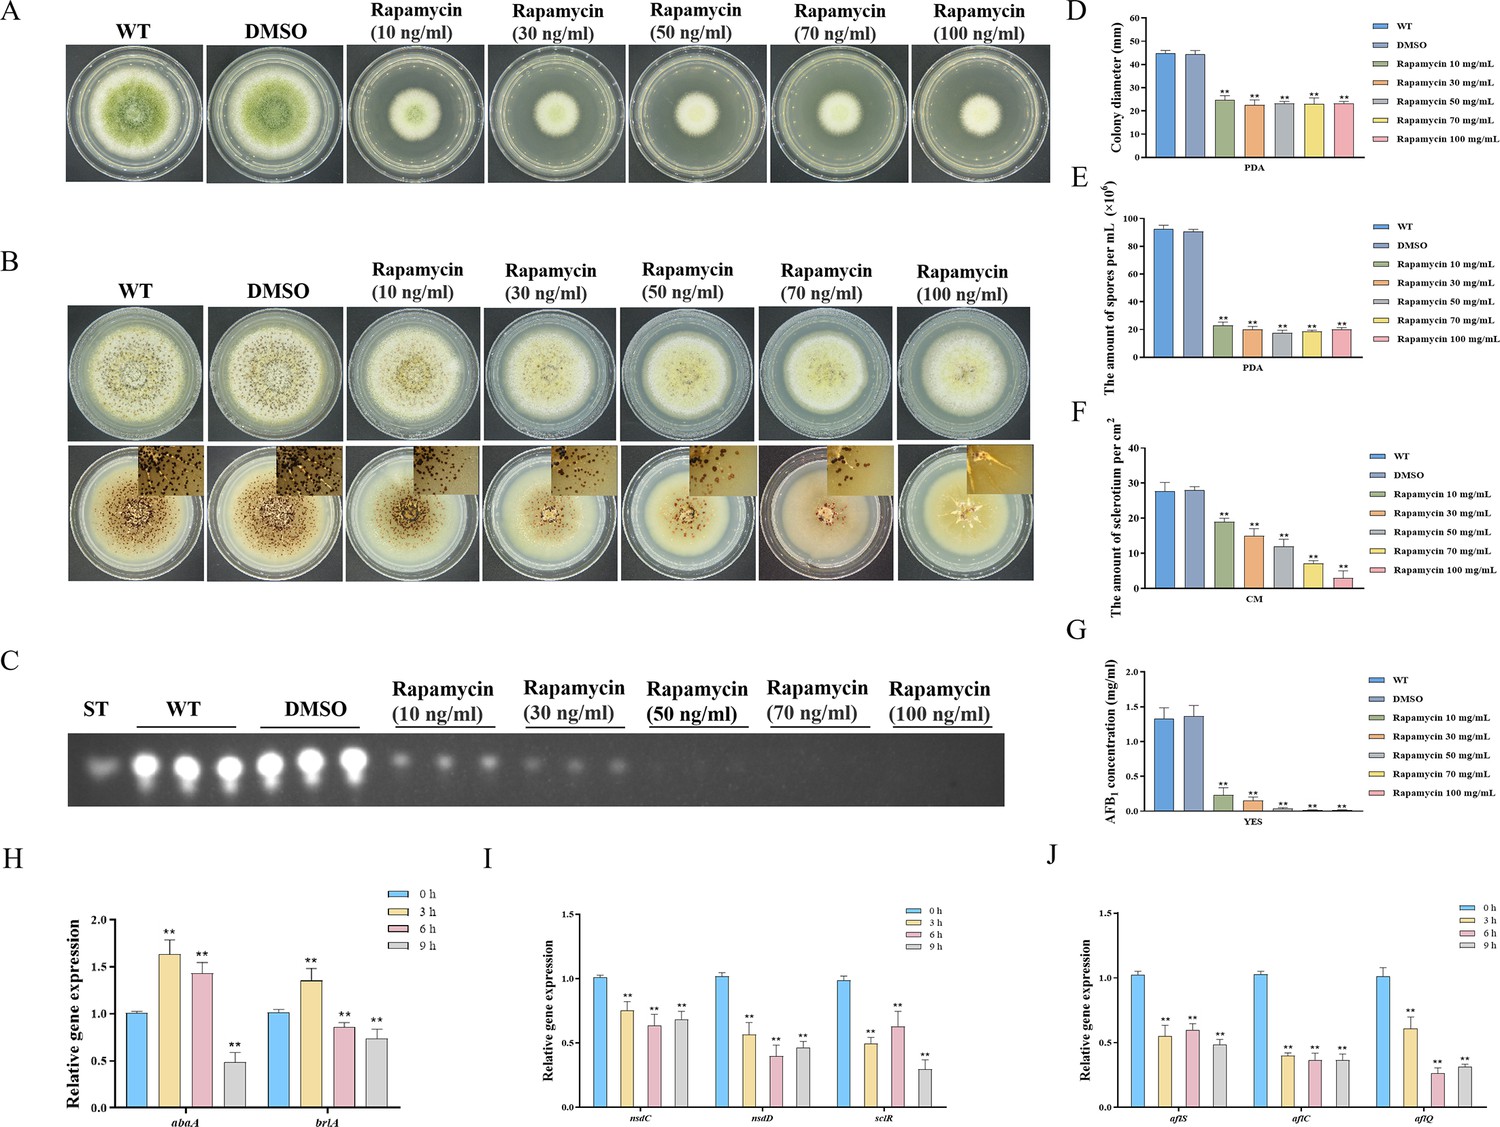
Impacts of rapamycin on the growth, sporulation, sclerotia formation, and aflatoxin production of A. flavus.
(A) Colony morphology of the wild-type (WT) strain cultured on potato dextrose agar (PDA) medium amended with different concentrations of rapamycin at 37°C for 5 days. (B) Colony phenotype of the WT strain grown on CM medium amended with different concentrations of rapamycin at 37°C for 7 days. (C) Thin layer chromatography (TLC) assay of aflatoxin B1 (AFB1) production by the WT strain cultured in yeast extract-sucrose agar (YES) liquid media amended with different concentrations of rapamycin at 29°C for 6 days. (D) Statistical analysis of the colony diameter by the WT strain treated with different concentrations of rapamycin described in (A). (E) Conidial quantification of the WT strain treated with different concentrations of rapamycin as mentioned in (A). (F) Quantitative analysis of sclerotium formation by the WT strain treated with different concentrations of rapamycin described in (B). (G) Relative quantification of AFB1 production by the WT strain treated with different concentrations of rapamycin as mentioned in (C). (H) Relative expression levels of conidia-related genes in WT strain treated with 100 ng/mL rapamycin after 3, 6, 9 hr. (I) Relative expression levels of sclerotia-related genes in WT strain treated with 100 ng/mL rapamycin after 3, 6, 9 hr. (J) Relative expression levels of aflatoxin biosynthesis regulatory and structural genes in WT strain treated with 100 ng/mL rapamycin after 3, 6, 9 hr. ** indicates that the significance level was p≤0.01, based on one-way ANOVA test with three replicates(n=3). Error bars represent the standard error of the mean (SEM).
Figure 1—figure supplement 1
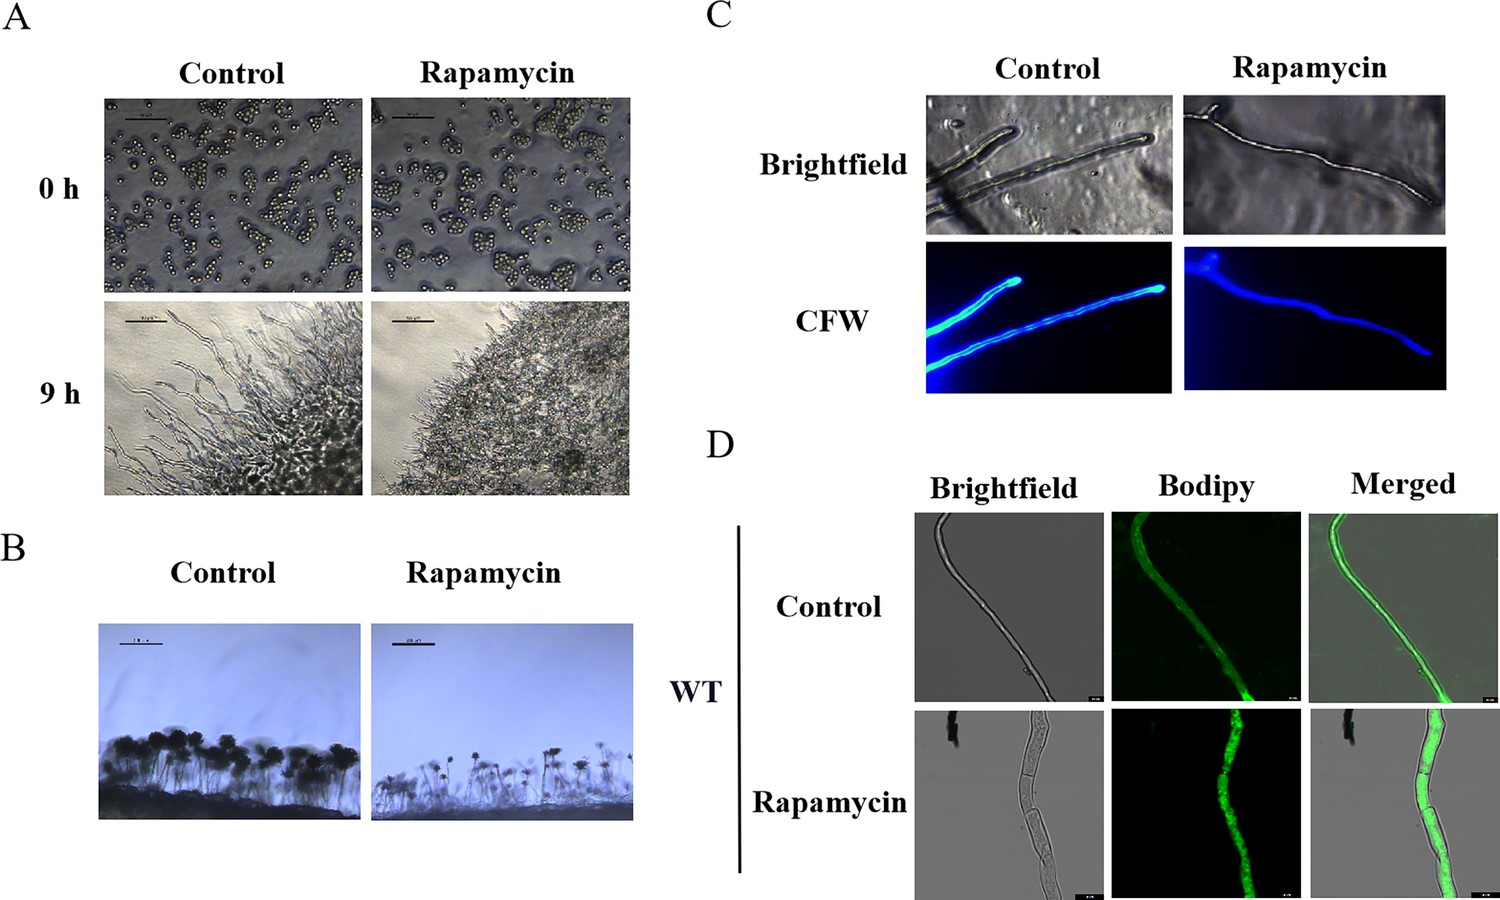
Impacts of rapamycin on spore germination, conidiophore formation, and lipid droplet biogenesis of A. flavus.
(A) Microscopic view of the spore germination of the wild-type (WT) strain treated with 100 ng/mL rapamycin. (B) Microscopic view of the conidiophore formation of the WT strain treated with 100 ng/mL rapamycin. (C) The hyphae treated with rapamycin were incubated for 12 hr, then stained with fluorescent brightener 28 (Calcofluor white [CFW]) and observed by microscopy. (D) Phenotype of lipid droplets accumulation in the mycelia of the WT strain treated with or without 100 ng/mL rapamycin for 6 hr (Scale bar, 10 μm).
Figure 2 with 2 supplements
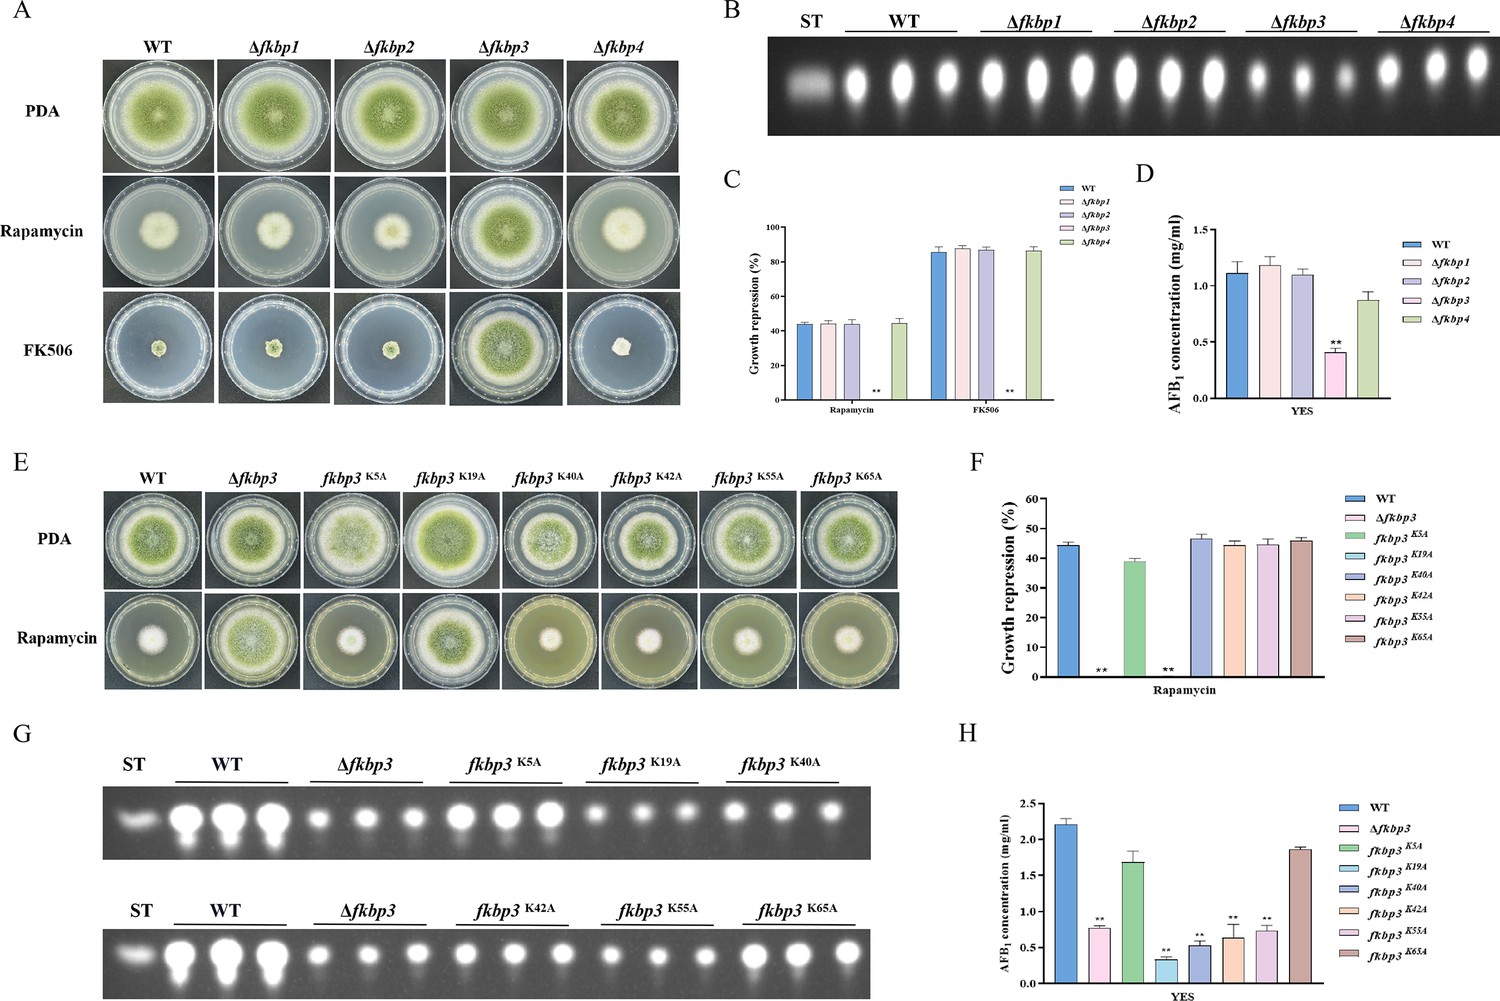
Disruption of fkbp3 significantly increases the resistance of A. flavus to rapamycin and FK506.
(A) Phenotype of the wild-type (WT) and all mutant strains (Δfkbp1, Δfkbp2, Δfkbp3, and Δfkbp4) grown on potato dextrose agar (PDA) amended with rapamycin and FK506 at 37°C for 5 days. (B) Thin layer chromatography (TLC) analysis of aflatoxin B1 (AFB1) production by the WT and all mutant strains (Δfkbp1, Δfkbp2, Δfkbp3, and Δfkbp4) cultured in yeast extract-sucrose agar (YES) liquid medium at 29°C for 6 days. (C) The growth inhibition rate of the WT and all mutant strains (Δfkbp1, Δfkbp2, Δfkbp3, and Δfkbp4) under rapamycin and FK506 stress. (D) AFB1 quantitative analysis of the WT and all mutant strains (Δfkbp1, Δfkbp2, Δfkbp3, and Δfkbp4) as described in (B). (E) Phenotype of the WT and all mutant strains (Δfkbp3, K5A, K19A, K40A, K42A, K55A, and K65A) grown on PDA amended with 100 ng/mL rapamycin at 37°C for 5 days. (F) The growth inhibition rate of the WT and all mutant strains (Δfkbp3, K5A, K19A, K40A, K42A, K55A, and K65A) under rapamycin stress. (G) TLC assay of AFB1 production by the WT and all mutant strains (Δfkbp3, K5A, K19A, K40A, K42A, K55A, and K65A) cultured in YES liquid medium at 29°C for 6 days. (H) Relative quantification of AFB1 production in the WT and all mutant strains (Δfkbp3, K5A, K19A, K40A, K42A, K55A, and K65A) as mentioned in (G). ** indicates that the significance level was p≤0.01, based on one-way ANOVA test with three replicates(n=3). Error bars represent the standard error of the mean (SEM).
Figure 2—figure supplement 1
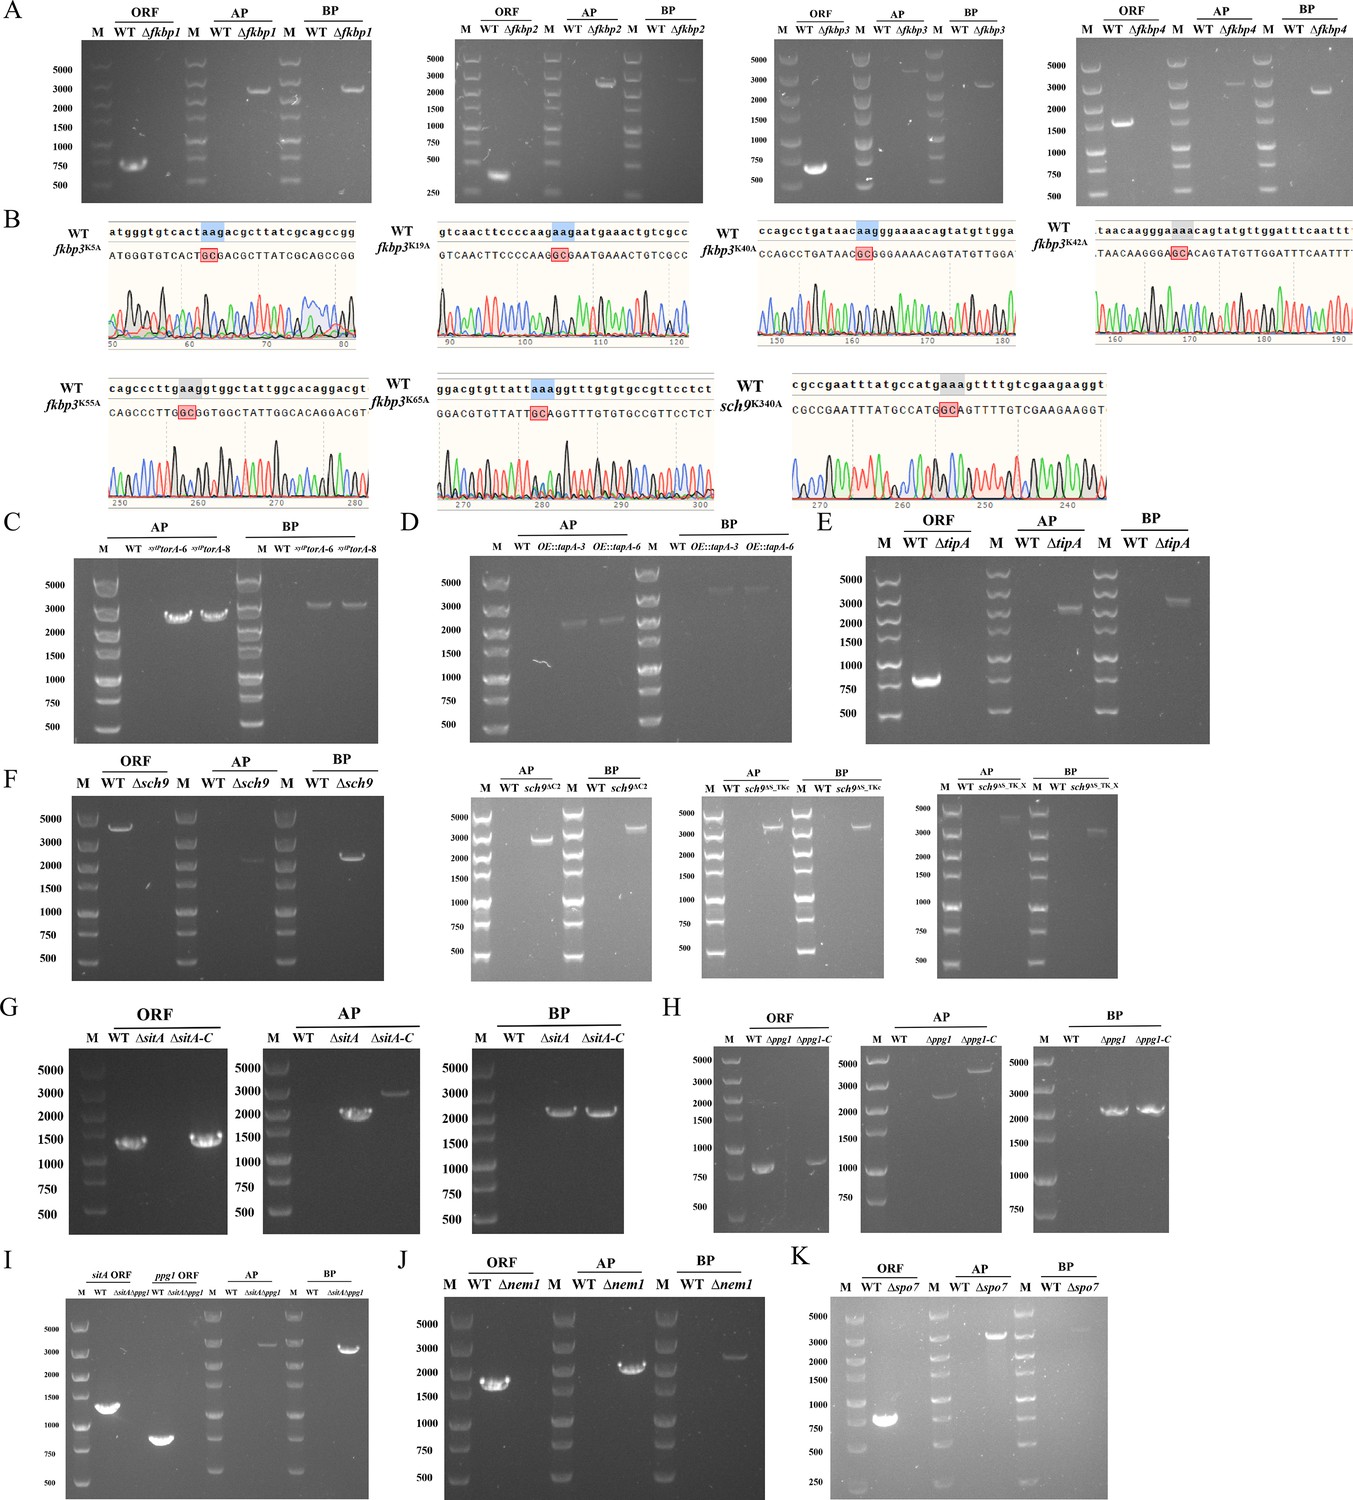
Construction of all mutants using homologous recombination.
(A) Knockout verification of fkbps by PCR in A. flavus. (B) Sequencing analysis of fkbp3K5A, fkbp3K19A, fkbp3K40A, fkbp3K42A, fkbp3K55A, fkbp3K65A, and sch9K340A site-specific mutagenesis in A. flavus. (C) The PCR validation of xylPtorA strain in A. flavus. (D) PCR validation of tapA gene overexpression strain in A. flavus. (E) Knockout verification of tipA by PCR in A. flavus. (F) The PCR validation of Δsch9, sch9 ΔC2, sch9 ΔS_TKc, sch9 ΔS_TK_X strains in A. flavus. (G) Knockout, complement verification of sitA by PCR in A. flavus. (H) Knockout, complement verification of ppg1 by PCR in A. flavus. (I) Knockout verification of sitA and ppg1 by PCR in A. flavus. (J) Knockout verification of nem1 by PCR in A. flavus. (K) Knockout verification of spo7 by PCR in A. flavus. The ORF fragment was specifically amplified using the O-F and O1-R primers to confirm the presence of the gene-specific open reading frame. The AP fragment was specifically amplified using the L-F and pyrG801-R primers to confirm the presence of the upstream homologous arm in the homologous recombination event. Subsequently, the BP fragments were delineated through the application of pyrG1020-F and R-R primers, thereby corroborating the downstream homologous arm’s fidelity in the homologous recombination process.
-
Figure 2—figure supplement 1—source data 1
Source data for DNA gel electrophoresis: original and annotated images for Figure 2—figure supplement 1.
- https://cdn.elifesciences.org/articles/89478/elife-89478-fig2-figsupp1-data1-v1.zip
Figure 2—figure supplement 2
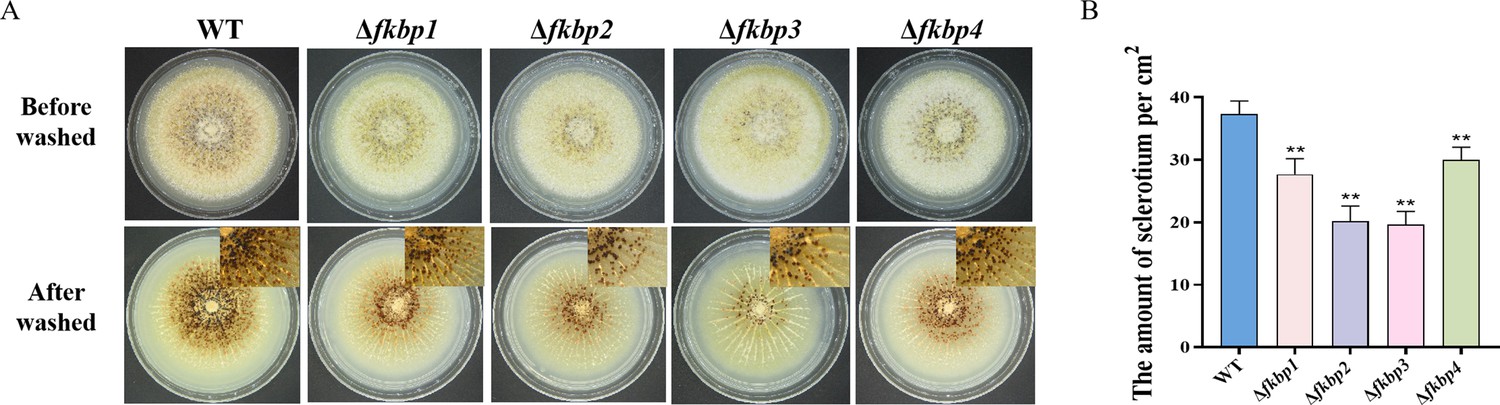
Fkbps regulate sclerotia biosynthesis in A. flavus.
(A) Phenotypic characterization of the wild-type (WT), Δfkbp1, Δfkbp2, Δfkbp3, and Δfkbp4 strains grown on CM medium at 37°C for 7 days. (B) Quantitative analysis of sclerotium formation as in (A). ** indicates that the significance level was p≤0.01, based on one-way ANOVA test with three replicates(n=3). Error bars represent the standard error of the mean (SEM).
Figure 3 with 2 supplements
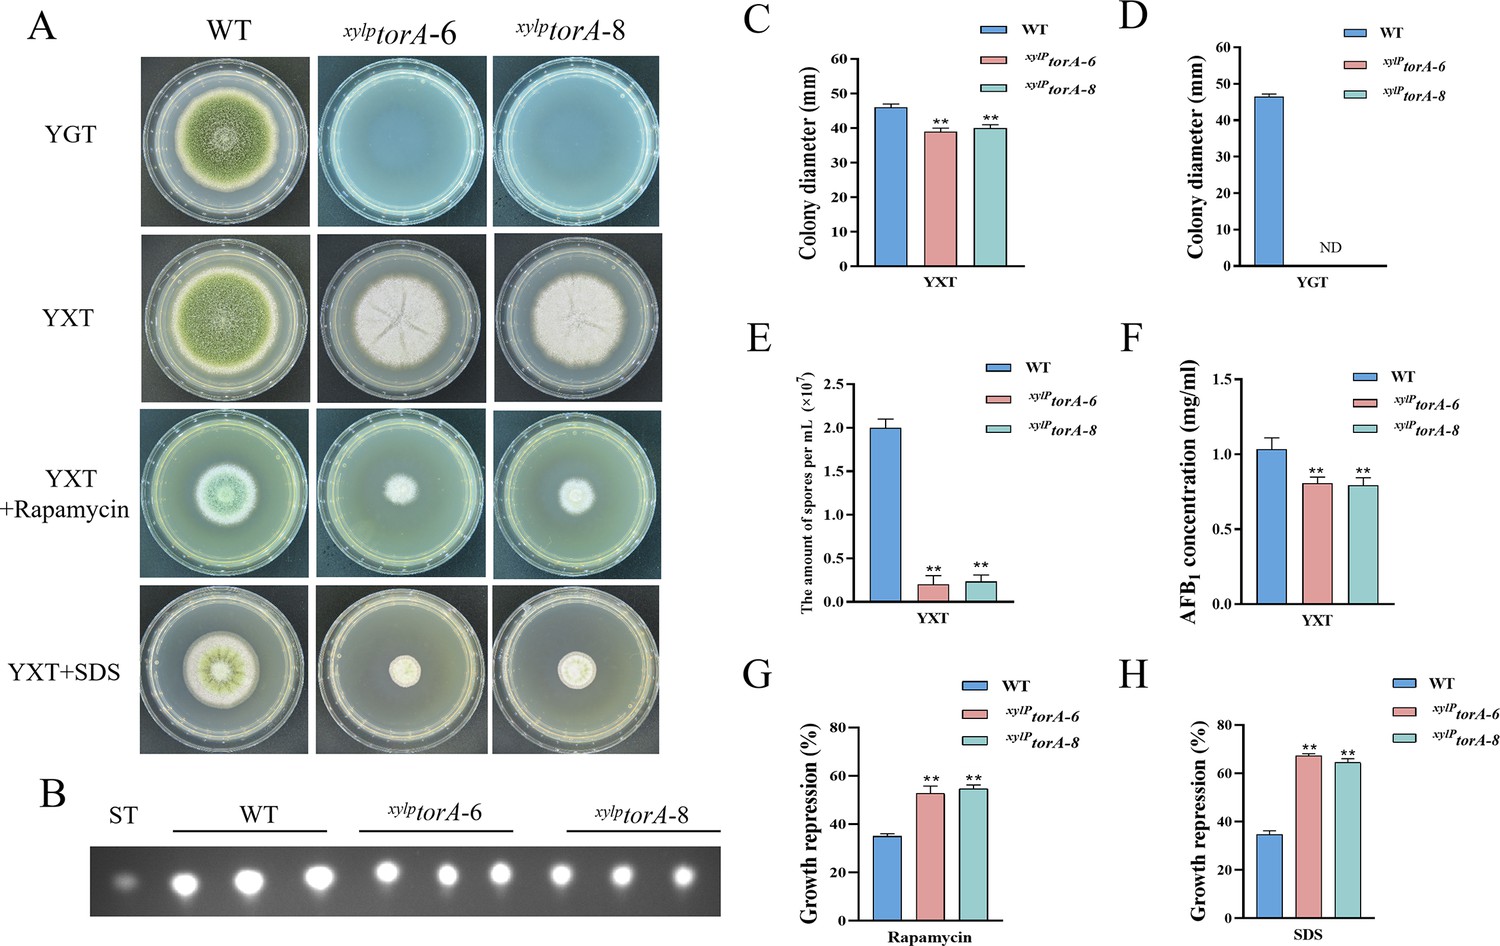
The TorA kinase plays a critical role in A. flavus.
(A) Phenotype of the wild-type (WT) and the xylPtorA strains in yeast extract-glucose agar (YGT) and yeast extract-xylose agar (YXT) medium amended with 100 ng/mL rapamycin and 300 mg/mL SDS at 37°C for 5 days. (B) Thin layer chromatography (TLC) assay of aflatoxin B1 (AFB1) production from the WT and the xylPtorA strains cultured in YXT medium containing 1 g/L MgSO4·7H2O at 29°C for 6 days. (C) Statistical analysis of the colony diameter by the WT and the xylPtorA strains in YXT medium. (D) Statistical analysis of the colony diameter by the WT and the xylPtorA strains in YGT medium. (E) Conidial quantification of the WT and the xylPtorA strains in YXT medium. (F) Quantitative analysis of AFB1 as shown in (B). (G) The growth inhibition rate of the WT and the xylPtorA strains under rapamycin. (H) The growth inhibition rate of the WT and the xylPtorA strains under SDS stress. ND indicates no detection. * indicates that the significance level was p≤0.05, ** indicates that the significance level was p≤0.01, based on one-way ANOVA test with three replicates(n=3). Error bars represent the standard error of the mean (SEM).
Figure 3—figure supplement 1

Transcriptional levels of torA.
Transcriptional levels of the torA gene expression in the wild-type (WT) and xylPtorA strains in yeast extract-xylose agar (YXT) medium. ** indicates that the significance level was p≤0.01, based on one-way ANOVA test with three replicates(n=3). Error bars represent the standard error of the mean (SEM).
Figure 3—figure supplement 2
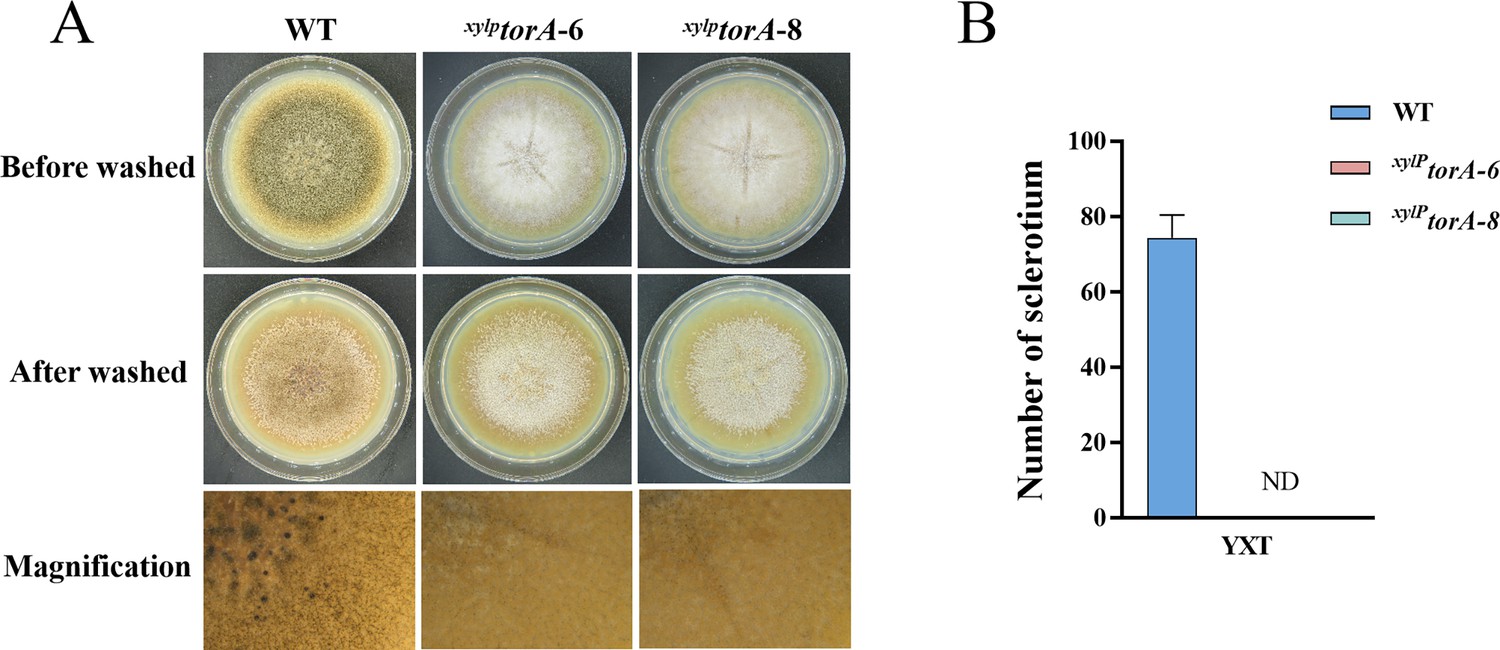
TorA regulate sclerotia biosynthesis in A. flavus.
(A) Phenotypic characterization of the wild-type (WT) and xylPtorA strains grown on yeast extract-xylose agar (YXT) medium at 37°C for 7 days. (B) Quantitative analysis of sclerotium formation as in (A). Data are presented as mean ± SD from three independent biological replicates (n=3). ND indicates no detection. Error bars represent the standard error of the mean (SEM).
Figure 4 with 1 supplement
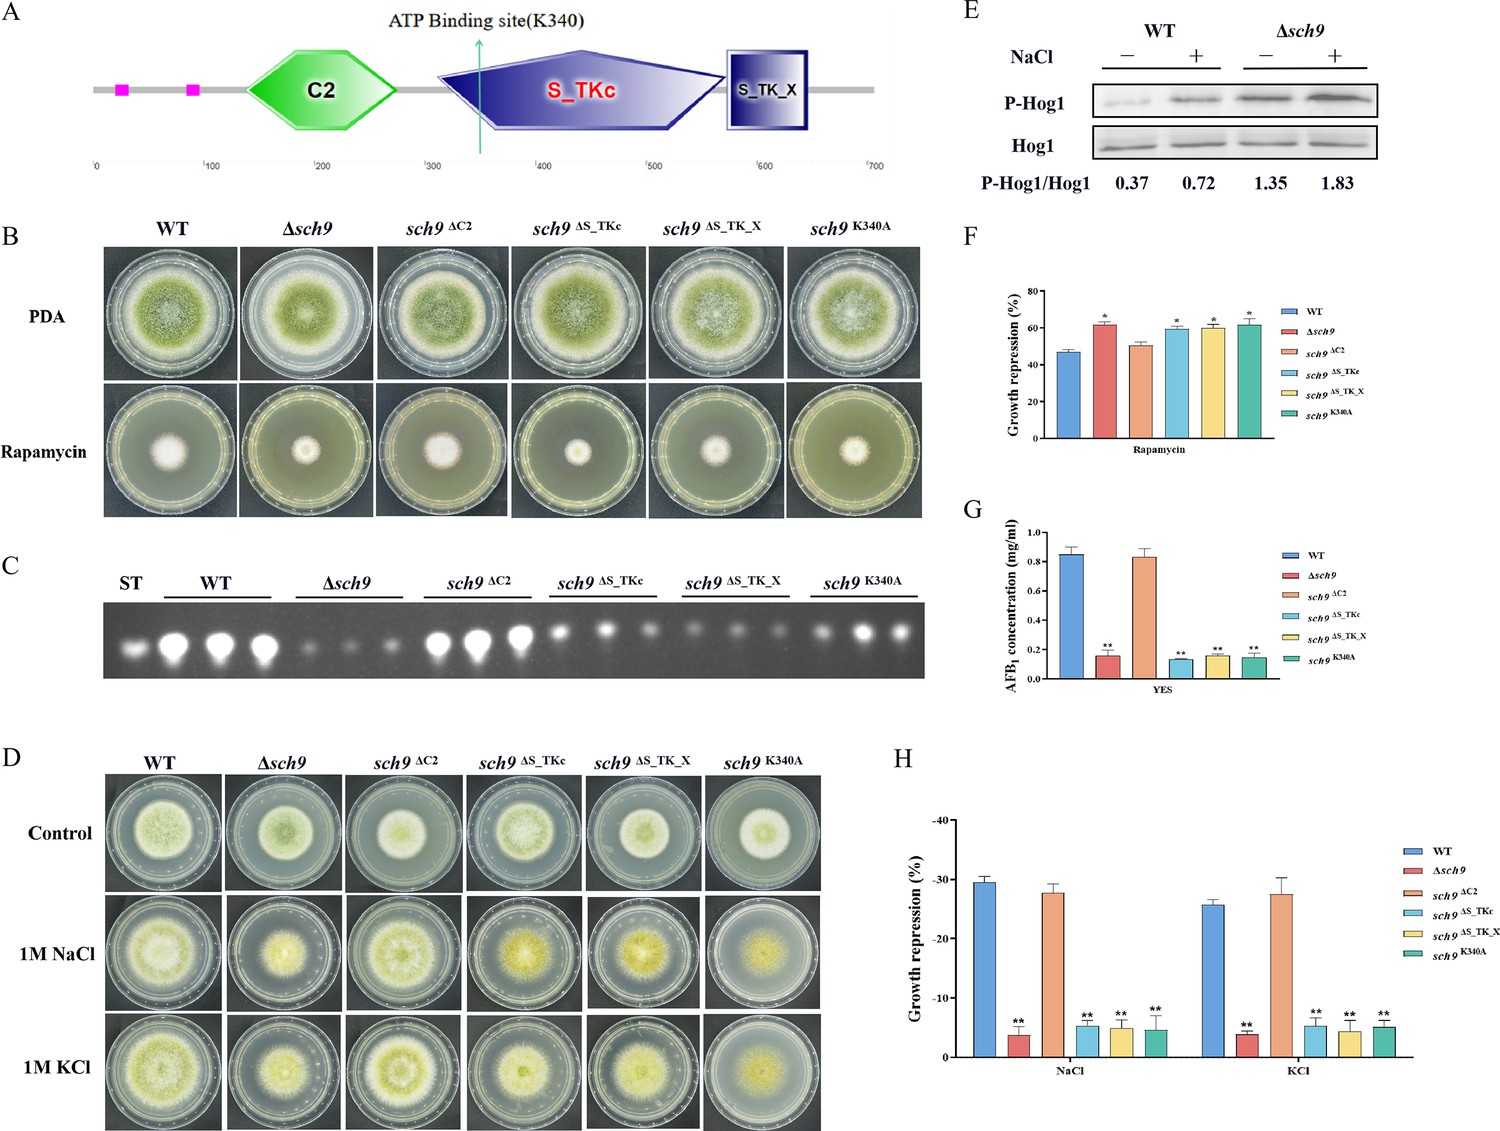
The Sch9 kinase participates in aflatoxin biosynthesis and the high osmolarity glycerol (HOG) pathway.
(A) The structure diagram of the Sch9 kinase. (B) Phenotype of the wild-type (WT), Δsch9, sch9ΔC2, sch9ΔS_TKc, sch9ΔS_TK_X, and sch9K340A strains grown on potato dextrose agar (PDA) medium amended with 100 ng/mL rapamycin at 37°C for 5 days. (C) Thin layer chromatography (TLC) assay of aflatoxin B1 (AFB1) production from the WT, Δsch9, sch9ΔC2, sch9ΔS_TKc, sch9ΔS_TK_X, and sch9K340A strains cultured in yeast extract-sucrose agar (YES) liquid medium at 29°C for 6 days. (D) The phenotypes of the WT, Δsch9, sch9ΔC2, sch9ΔS_TKc, sch9ΔS_TK_X, and sch9K340A strains on yeast extract-glucose agar (YGT) media amended with 1 M NaCl and 1 M KCl for 3 days. (E) The phosphorylation levels of Hog1 in the WT and Δsch9 strains were determined with or without osmotic stress. (F) The growth inhibition rate of the WT, Δsch9, sch9ΔC2, sch9ΔS_TKc, sch9ΔS_TK_X, and sch9K340A strains under rapamycin stress. (G) Quantitative analysis of AFB1 as shown in (C). (H) The growth inhibition rate of the WT, Δsch9, sch9ΔC2, sch9ΔS_TKc, sch9ΔS_TK_X, and sch9K340A strains under osmotic stress. * indicates that the significance level was p≤0.05, ** indicates that the significance level was p≤0.01, based on one-way ANOVA test with three replicates(n=3). Error bars represent the standard error of the mean (SEM).
-
Figure 4—source data 1
Original file for the western blot analysis in Figure 4E (anti-P-Hog1).
- https://cdn.elifesciences.org/articles/89478/elife-89478-fig4-data1-v1.zip
-
Figure 4—source data 2
Original file for the western blot analysis in Figure 4E (anti-Hog1).
- https://cdn.elifesciences.org/articles/89478/elife-89478-fig4-data2-v1.zip
-
Figure 4—source data 3
PDF containing Figure 4E and original scans of the relevant western blot analysis (anti-P-Hog1 and anti-Hog1) with highlighted bands and sample labels.
- https://cdn.elifesciences.org/articles/89478/elife-89478-fig4-data3-v1.zip
Figure 4—figure supplement 1
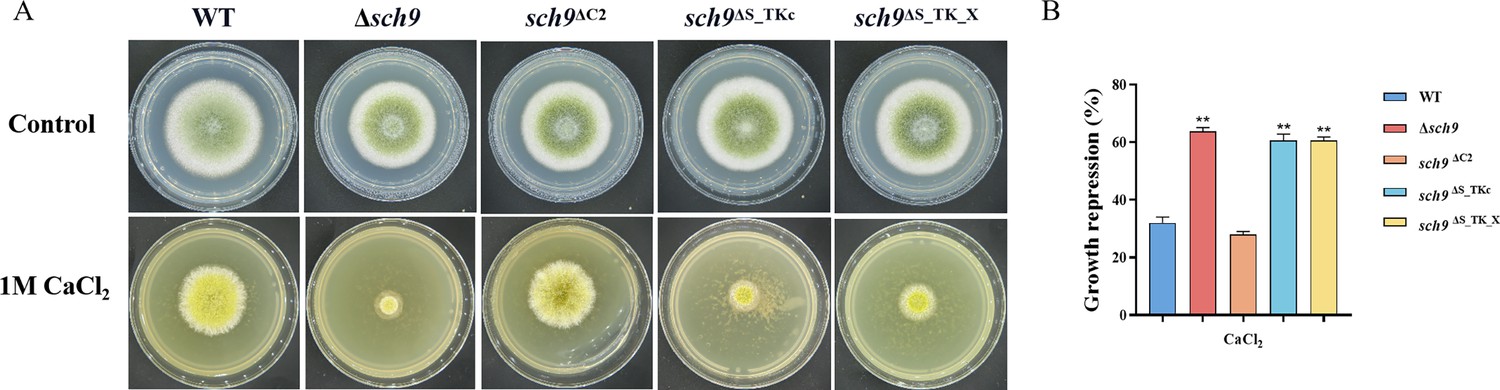
Sch9 is involved in calcium stress.
(A) Colony morphology of the wild-type (WT), Δsch9, Sch9ΔC2, Sch9ΔS_TKc, and Sch9ΔS_TK_X strains on yeast extract-glucose agar (YGT) media amended with 1 M CaCl2 for 3 days. (B) The growth inhibition rate of the WT and all mutant strains under calcium stress. ** indicates that the significance level was p≤0.01, based on one-way ANOVA test with three replicates(n=3). Error bars represent the standard error of the mean (SEM).
Figure 5 with 1 supplement
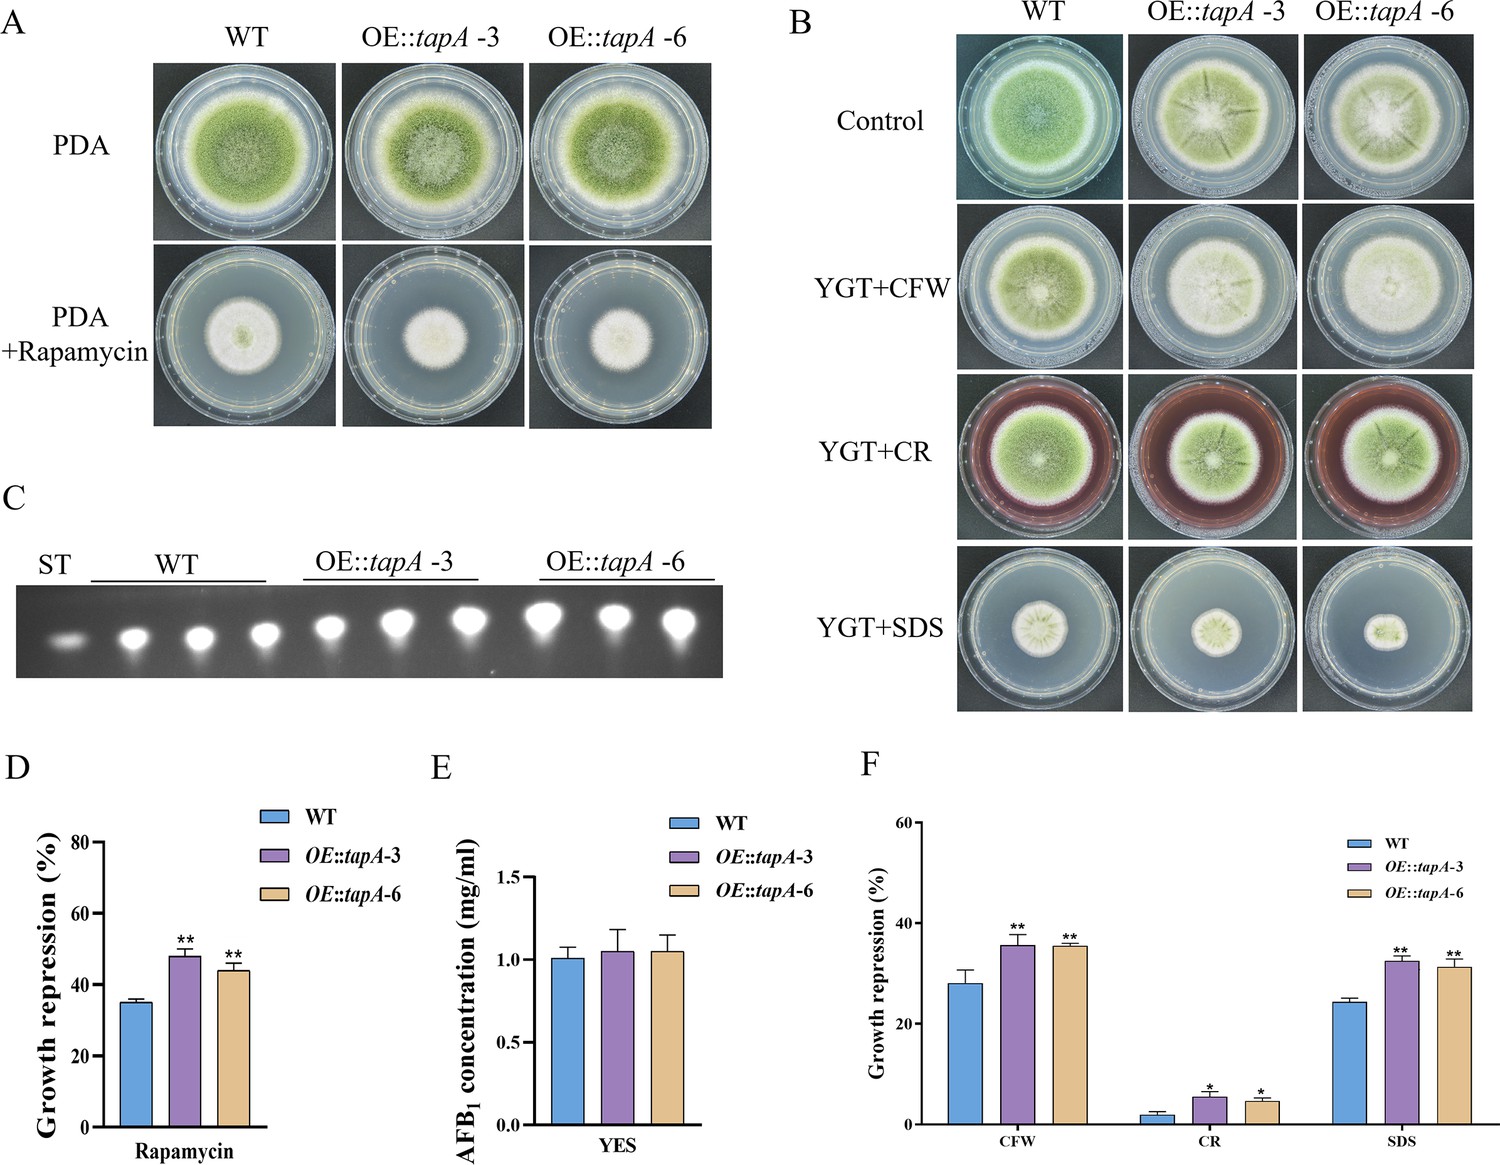
TapA regulates cell wall stress in A. flavus.
(A) Phenotype of the wild-type (WT) and OE::tapA strains grown on potato dextrose agar (PDA) amended with 100 ng/mL rapamycin at 37°C for 5 days. (B) Colony morphology of the WT and OE::tapA strains grown on PDA media supplemented with 200 µg/mL Congo red (CR), 200 µg/mL Calcofluor white (CFW), or 300 µg/mL SDS at 37°C for 5 days. (C) Thin layer chromatography (TLC) assay of aflatoxin B1 (AFB1) production by the WT and OE::tapA strains cultured in yeast extract-sucrose agar (YES) liquid medium at 29°C for 6 days. (D) The growth inhibition rate of the WT and OE::tapA strains under rapamycin. (E) Quantitative analysis of AFB1 as shown in (C). (F) The growth inhibition rate of the WT and OE::tapA strains under cell wall and cell membrane stress. * indicates that the significance level was p≤0.05, ** indicates that the significance level was p≤0.01, based on one-way ANOVA test with three replicates(n=3). Error bars represent the standard error of the mean (SEM).
Figure 5—figure supplement 1

Transcriptional levels of tapA.
Transcriptional levels of the tapA gene expression in the wild-type (WT) and OE::tapA strains in yeast extract-glucose agar (YGT) medium. ** indicates that the significance level was p≤0.01, based on one-way ANOVA test with three replicates(n=3). Error bars represent the standard error of the mean (SEM).
Figure 6
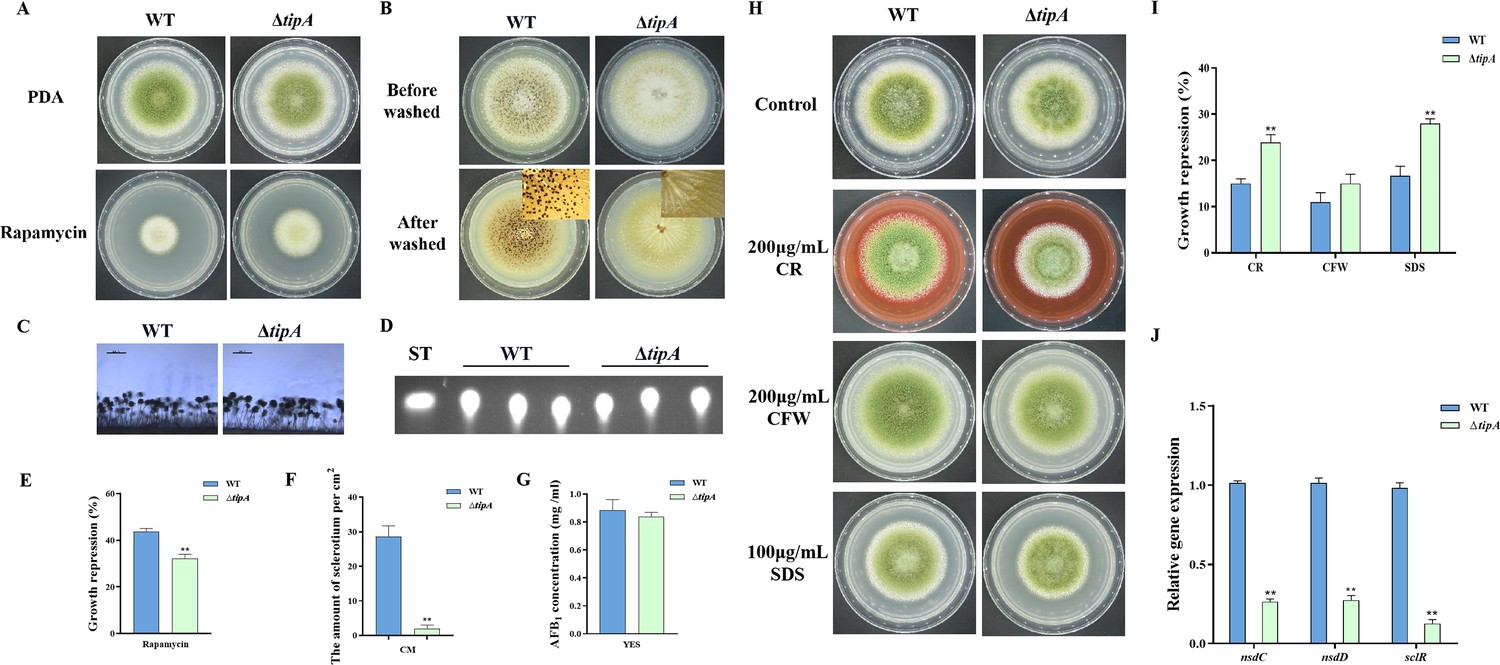
TipA regulates sclerotia development and cell wall stress in A. flavus.
(A) Phenotype of the wild-type (WT) and ∆tipA strains grown on potato dextrose agar (PDA) amended with 100 ng/mL rapamycin at 37°C for 5 days. (B) Phenotypic characterization of the WT and ∆tipA strains grown on CM medium at 37°C for 7 days. (C) Morphology of conidiophores in the WT and ∆tipA strains observed by microscope. (D) Thin layer chromatography (TLC) assay of aflatoxin B1 (AFB1) production by the WT and ∆tipA strains cultured in yeast extract-sucrose agar (YES) liquid medium at 29°C for 6 days. (E) The growth inhibition rate of the WT and ∆tipA strains under rapamycin stress. (F) Amount of sclerotia produced by the WT and ∆tipA strains. (G) AFB1 quantitative analysis of the WT and ∆tipA strains described in (D). (H) Colony morphology of the WT and ΔtipA strains grown on PDA media supplemented with 200 µg/mL Congo red (CR), 200 µg/mL Calcofluor white (CFW), and 100 µg/mL SDS at 37°C for 5 days. (I) The growth inhibition rate of the WT and ΔtipA strains under cell wall and cell membrane stress. (J) Relative expression levels of sclerotia formation genes in the WT and ΔtipA strains. ** indicates that the significance level was p≤0.01, based on one-way ANOVA test with three replicates(n=3). Error bars represent the standard error of the mean (SEM).
Figure 7
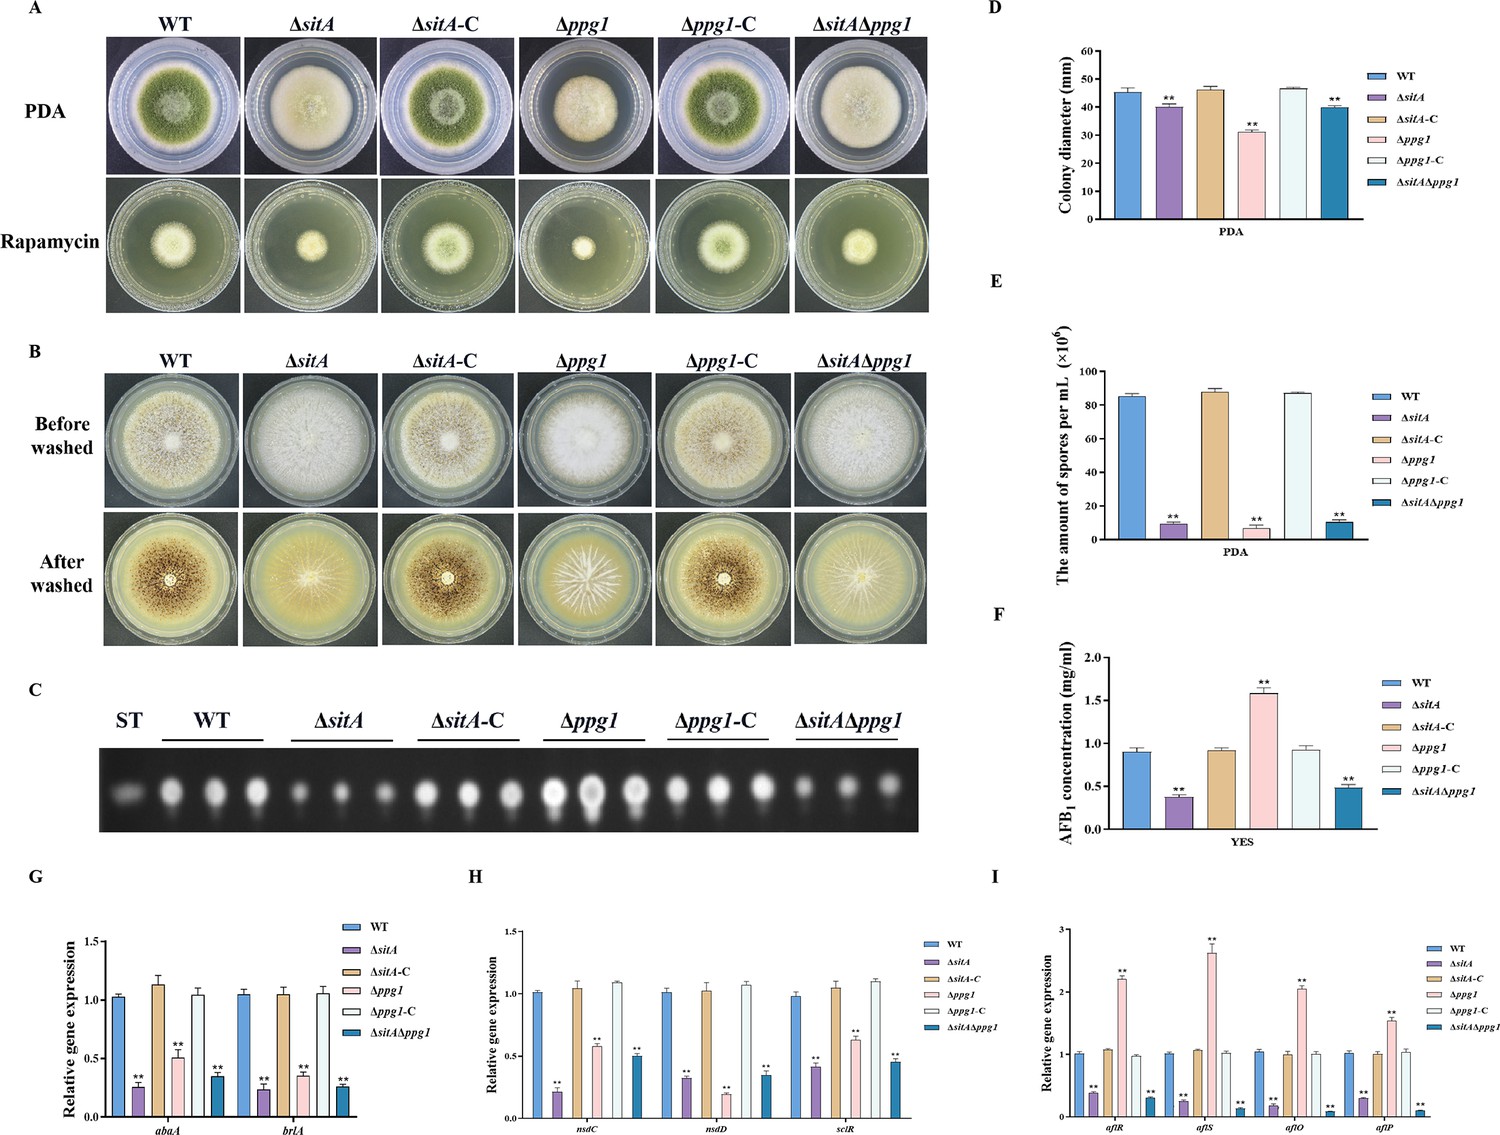
The impact of the phosphatases SitA and Ppg1 on the growth, conidiation, and aflatoxin biosynthesis in A. flavus.
(A) Colony morphology of the wild-type (WT), single knockout, and double knockout strains cultured on potato dextrose agar (PDA) medium amended with 100 ng/mL rapamycin at 37°C for 5 days. (B) Colony morphology of the WT, single knockout, and double knockout strains cultured on CM medium at 37°C for 7 days. (C) Thin layer chromatography (TLC) analysis of aflatoxin B1 (AFB1) production from the WT, single knockout, and double knockout strains cultured in yeast extract-sucrose agar (YES) liquid medium at 29°C for 6 days. (D) Growth diameter of the WT, single knockout, and double knockout strains on PDA media. (E) Conidial quantification of the WT, single knockout, and double knockout strains. (F) AFB1 quantitative analysis of the WT, single knockout, and double knockout strains. (G) Relative expression levels of conidia synthesis genes in the WT, single knockout, and double knockout strains. (H) Relative expression levels of sclerotia synthesis genes in the WT, single knockout, and double knockout strains. (I) Relative expression levels of aflatoxin biosynthesis genes in the WT, single knockout, and double knockout strains. ** indicates that the significance level was p≤0.01, based on one-way ANOVA test with three replicates(n=3). Error bars represent the standard error of the mean (SEM).
Figure 8
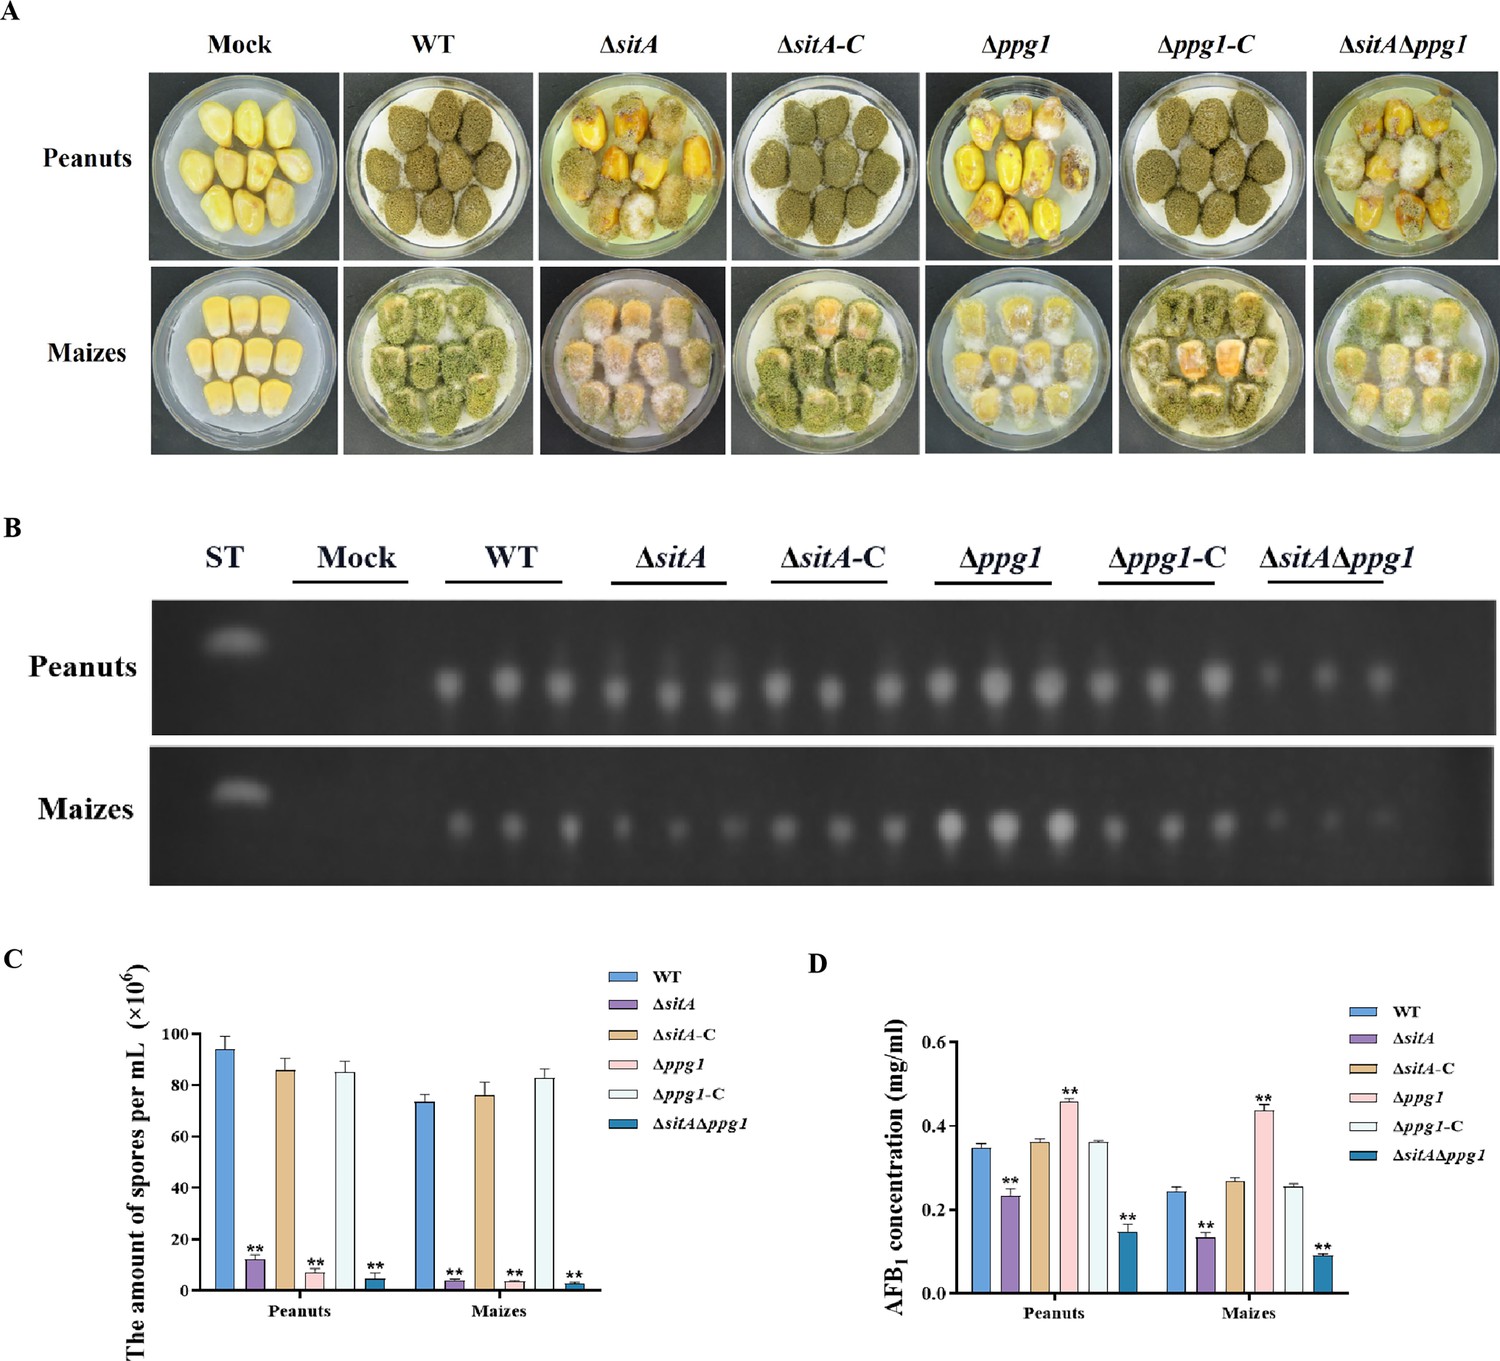
Pathogenicity analysis of the phosphatases SitA and Ppg1 in A. flavus.
(A) Phenotypes of peanut and maize infected by the wild-type (WT), single knockout, and double knockout strains. (B) Thin layer chromatography (TLC) was used to detect the aflatoxin B1 (AFB1) from peanut and maize infected by the WT, single knockout, and double knockout strains. (C) Quantitative analysis of conidia production from peanut and maize infected by the WT, single knockout, and double knockout strains. (D) Quantitative analysis of AFB1 from peanut and maize infected by the WT, single knockout, and double knockout strains. ** indicates that the significance level was p≤0.01, based on one-way ANOVA test with three replicates(n=3). Error bars represent the standard error of the mean (SEM).
Figure 9
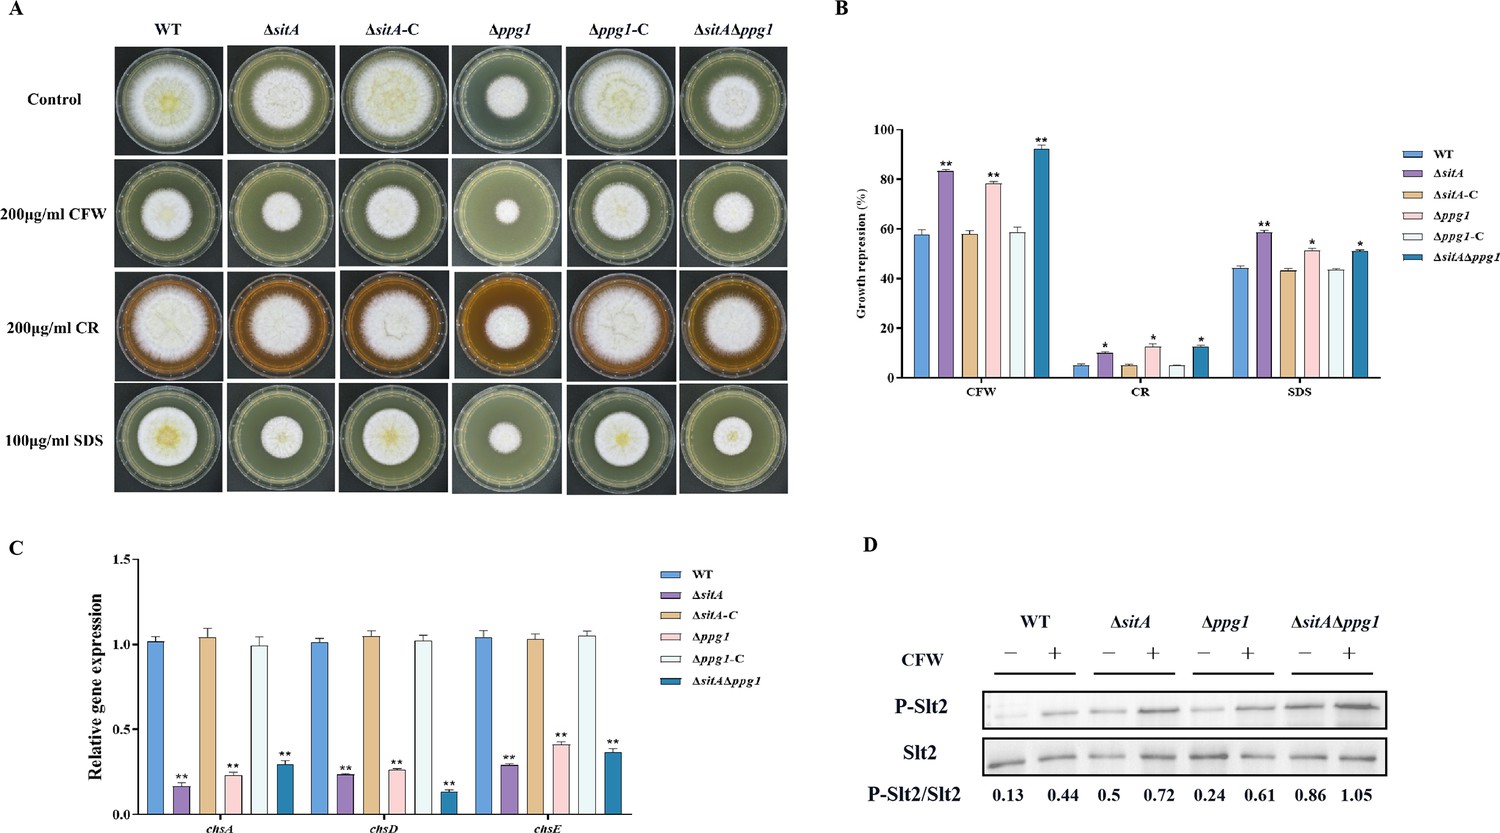
Sensitivity of phosphatases SitA and Ppg1 to cell wall damaging agents in A. flavus.
(A) Morphology of the wild-type (WT), single knockout, and double knockout strains grown on yeast extract-sucrose agar (YES) media supplemented with 200 µg/mL Congo red (CR), 200 µg/mL Calcofluor white (CFW), or 100 µg/mL SDS at 37°C for 5 days. (B) The growth inhibition rate of the WT, single knockout, and double knockout strains under cell wall and cell membrane stress. (C) Relative expression levels of cell wall synthesis genes (chsA, chsD, and chsE) in the WT, single knockout, and double knockout strains. (D) The phosphorylation level of Slt2 in the WT, single knockout, and double knockout strains was detected with or without cell wall stress. * indicates that the significance level was p≤0.05, ** indicates that the significance level was p≤0.01, based on one-way ANOVA test with three replicates(n=3). Error bars represent the standard error of the mean (SEM).
-
Figure 9—source data 1
Original file for the western blot analysis in Figure 9D (anti-P-Slt2).
- https://cdn.elifesciences.org/articles/89478/elife-89478-fig9-data1-v1.zip
-
Figure 9—source data 2
Original file for the western blot analysis in Figure 9D (anti-Slt2).
- https://cdn.elifesciences.org/articles/89478/elife-89478-fig9-data2-v1.zip
-
Figure 9—source data 3
PDF containing Figure 9D and original scans of the relevant western blot analysis (anti-P-Slt2 and anti-Slt2) with highlighted bands and sample labels.
- https://cdn.elifesciences.org/articles/89478/elife-89478-fig9-data3-v1.zip
Figure 10
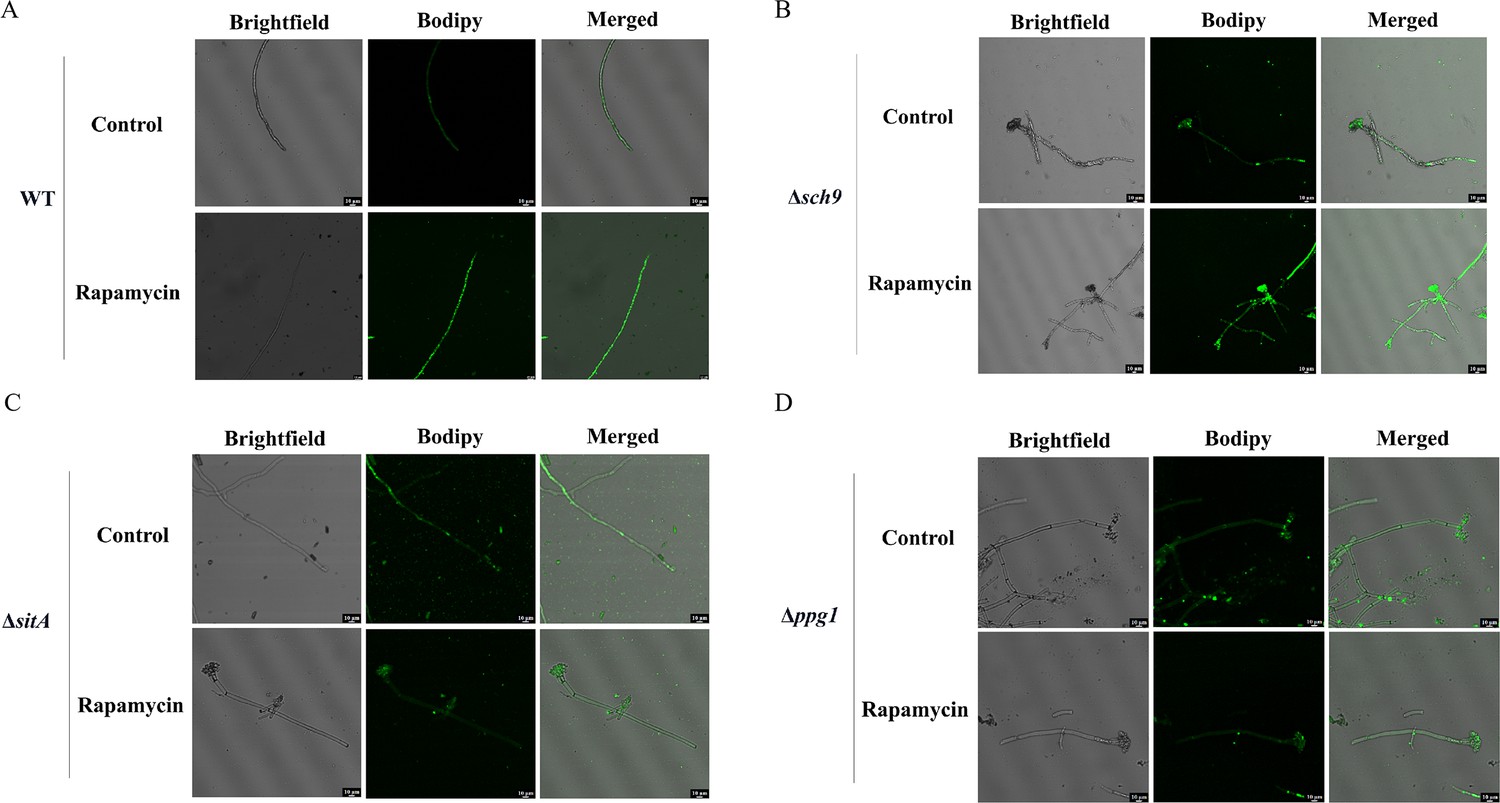
Phosphatases SitA and Ppg1 are involved in regulating lipid droplet biogenesis.
(A) The intracellular lipid droplets were stained by boron dipyrromethene difluoride (BODIPY) in hyphae of the wild-type (WT) strain and observed under fluorescence microscopy. The phenotype of lipid droplets accumulation in the mycelia of the WT strain treated with or without 100 ng/mL rapamycin for 6 hr (Scale bar, 10 μm). (B) Phenotype of lipid droplets accumulation in the mycelia of the Δsch9 strain treated with or without 100 ng/mL rapamycin for 6 hr (Scale bar, 10 μm). (C) Phenotype of lipid droplets accumulation in the mycelia of the ΔsitA strain treated with or without 100 ng/mL rapamycin for 6 hr (Scale bar, 10 μm). (D) Phenotype of lipid droplets accumulation in the mycelia of the Δppg1 strain treated with or without 100 ng/mL rapamycin for 6 hr (Scale bar, 10 μm).
Figure 11
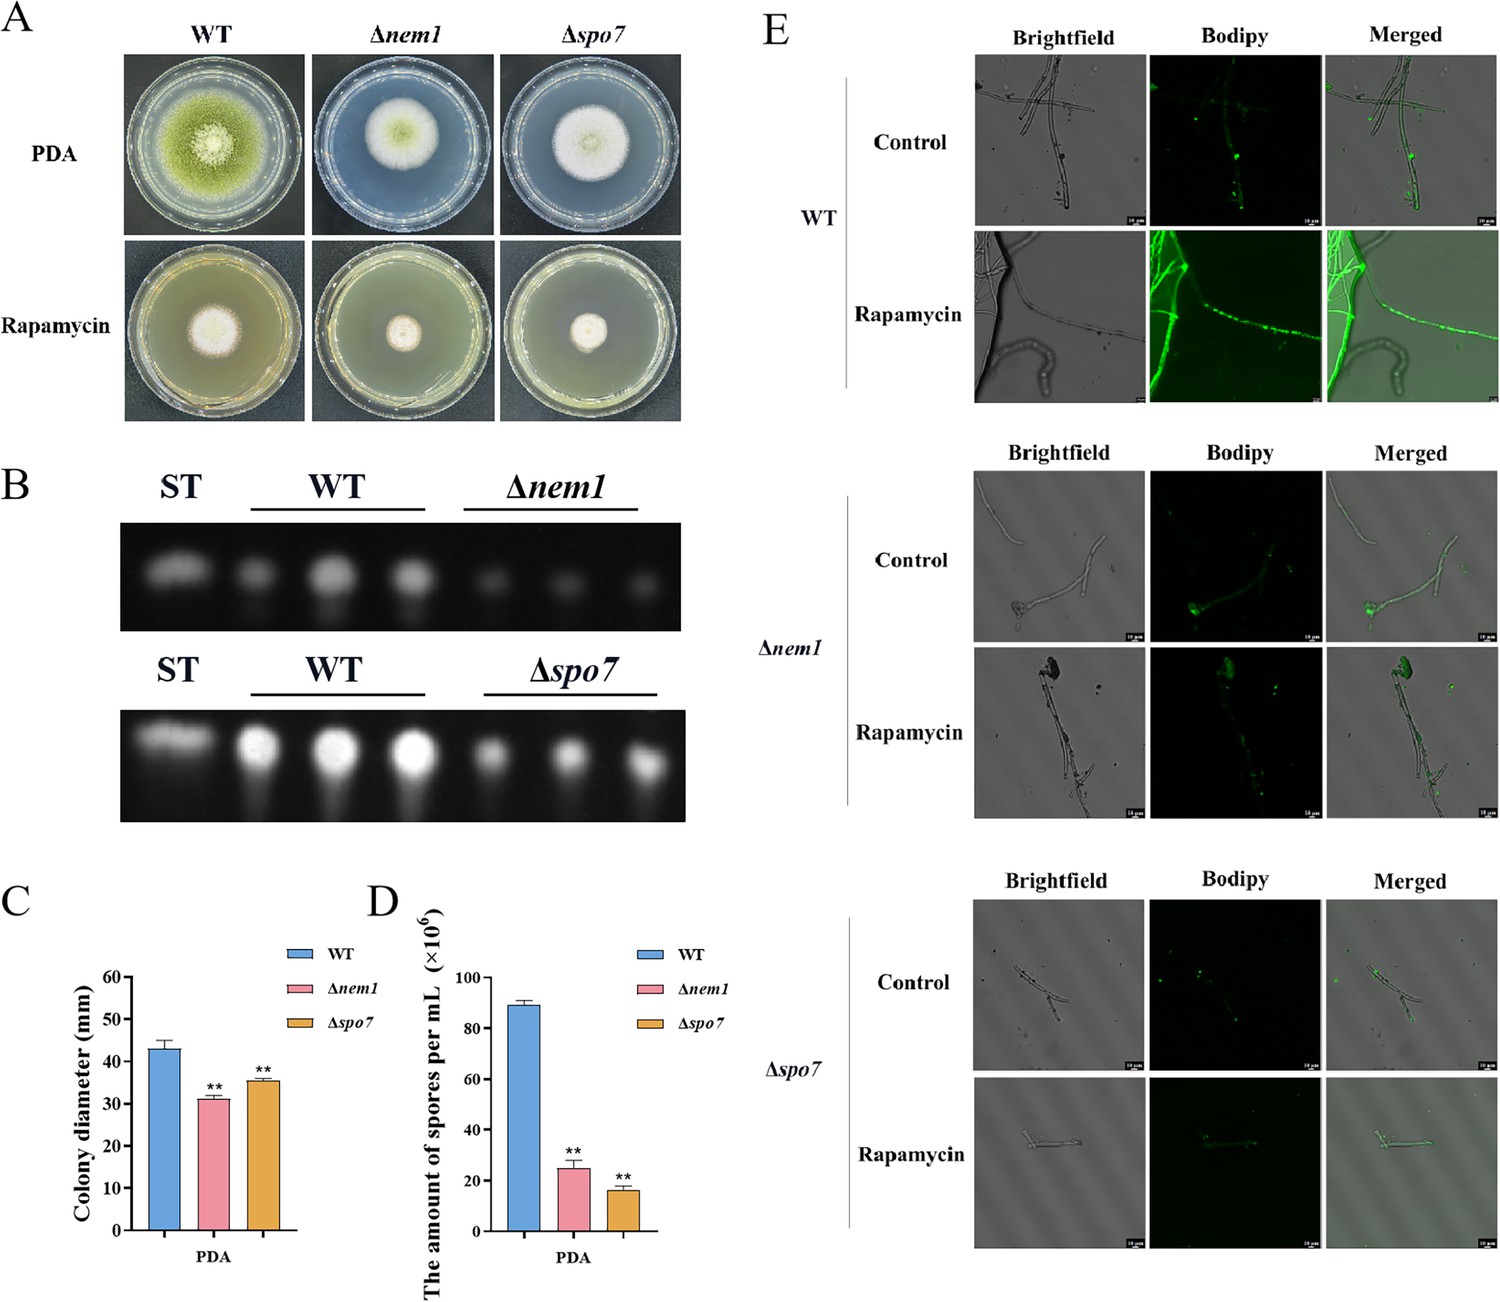
Phosphatase complex Nem1/Spo7 play significant role in growth, conidiation, aflatoxin, and lipid droplet biogenesis.
(A) Phenotype of the wild-type (WT), ∆nem1, and ∆spo7 strains grown on potato dextrose agar (PDA) amended with 100 ng/mL rapamycin at 37°C for 5 days. (B) Thin layer chromatography (TLC) assay of aflatoxin B1 (AFB1) production from the WT, ∆nem1, and ∆spo7 strains cultured in yeast extract-sucrose agar (YES) liquid medium at 29°C for 6 days. (C) Growth diameter of the WT, ∆nem1, and ∆spo7 strains on PDA media. (D) Statistical analysis of the sporulation by the WT, ∆nem1, and ∆spo7 strains. (E) Phenotype of lipid droplets accumulation in the mycelia of the WT, ∆nem1, and ∆spo7 strains treated with or without 100 ng/mL rapamycin for 6 hr (Scale bar, 10 μm). ** indicates that the significance level was p≤0.01, based on one-way ANOVA test with three replicates(n=3). Error bars represent the standard error of the mean (SEM).
Figure 12

The proposed model of the target of rapamycin (TOR) pathway in A. flavus.
Based on the above results, we propose a hypothesis regarding the TOR signaling pathway model in A. flavus. Rapamycin forms a complex with Fkbp3, and this particular complex can bind to the TorA kinase, thereby impeding its regular functionality. Sch9, functioning as a downstream element of the TorA kinase, regulates aflatoxin biosynthesis and high osmolarity glycerol (HOG) signaling pathway. As another important target of the TorA kinase, TapA-phosphatase complex is involved in the regulation of growth, sporulation, sclerotia, aflatoxin production, cell wall integrity (CWI) signaling pathway, lipid droplet synthesis, and other processes. In conclusion, the TOR signaling pathway plays a crucial role in various aspects of A. flavus, including vegetative development, stress response, aflatoxin biosynthesis, and pathogenicity.
Additional files
-
Supplementary file 1
Comprehensive list of strains and primers for this study.
- https://cdn.elifesciences.org/articles/89478/elife-89478-supp1-v1.docx
-
MDAR checklist
- https://cdn.elifesciences.org/articles/89478/elife-89478-mdarchecklist1-v1.docx
Download links
A two-part list of links to download the article, or parts of the article, in various formats.
Downloads (link to download the article as PDF)
Open citations (links to open the citations from this article in various online reference manager services)
Cite this article (links to download the citations from this article in formats compatible with various reference manager tools)
The target of rapamycin signaling pathway regulates vegetative development, aflatoxin biosynthesis, and pathogenicity in Aspergillus flavus
eLife 12:RP89478.
https://doi.org/10.7554/eLife.89478.5


