SUMOylation of Bonus, the Drosophila homolog of Transcription Intermediary Factor 1, safeguards germline identity by recruiting repressive chromatin complexes to silence tissue-specific genes
- California Institute of Technology, Division of Biology and Biological Engineering, United States
- Institute of Gene Biology, Russian Academy of Sciences, Russian Federation
- University of California, Riverside, United States
Figures
Figure 1 with 1 supplement
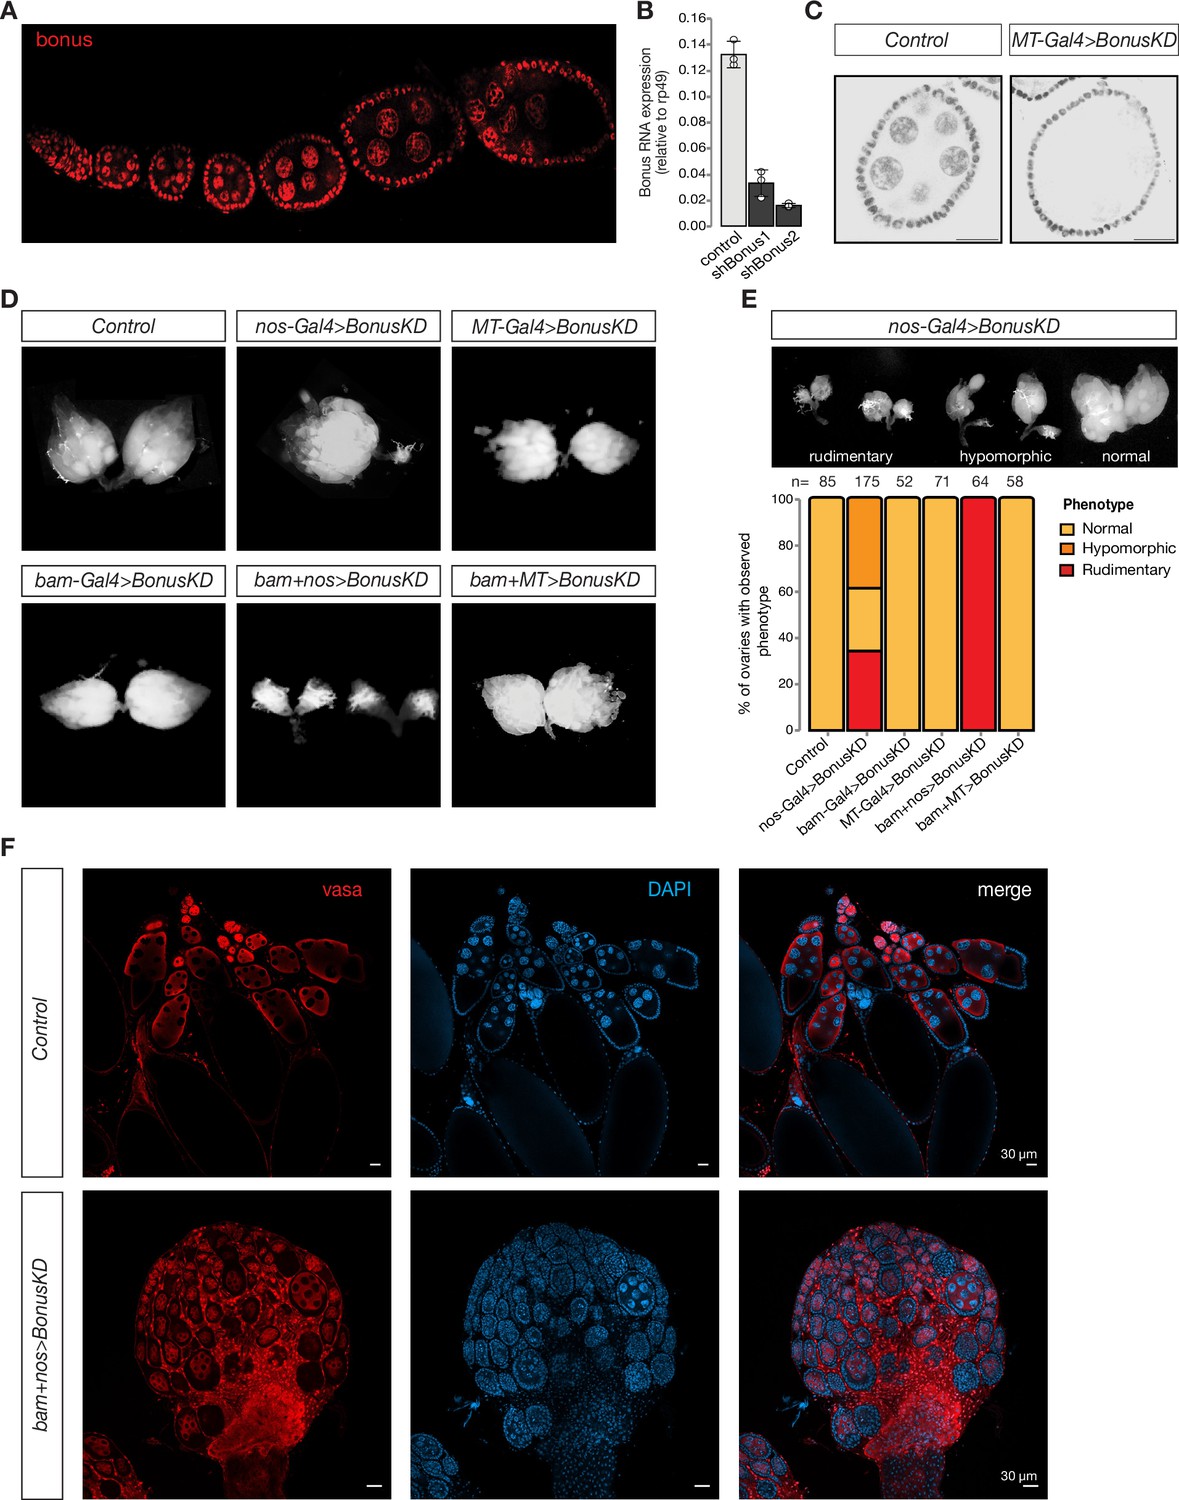
Germline expression of Bonus is required for oogenesis.
(A) Bon is expressed throughout oogenesis. Stacked confocal image of wild-type Oregon-R flies stained for Bon. (B) Bar graph shows the relative expression of Bon (normalized to rp49 level) in control and Bon-depleted ovaries (RT-qPCR, dots correspond to three independent biological replicates (n=3); error bars indicate st. dev.; p<0.001, two-tailed Student’s t-test). (C) Confocal images of egg chambers from wild-type Oregon-R flies (control) and flies expressing MT-Gal4-driven shRNA against Bon stained for Bon (scale bar: 20 μm). (D) Bon depletion leads to rudimentary ovaries. Phase contrast images of dissected ovaries from flies of indicated genotypes. Wild-type Oregon-R flies were used as control. (E) Top: phase contrast image of dissected ovaries with different phenotypes from flies with Bon GLKD driven by nos-Gal4. Bottom: graph showing the percentage of normal, hypomorphic, and rudimentary ovary phenotypes of indicated genotypes (n = 85, 175, 52, 71, 64, and 58, respectively). (F) Confocal images of whole ovaries from wild-type Oregon-R flies (control) and flies with Bon GLKD driven by bam + nos double driver stained for Vasa (red) and DAPI (4′,6-diamidino-2-phenylindole) (blue) (scale bar: 30 μm).
Figure 1—figure supplement 1
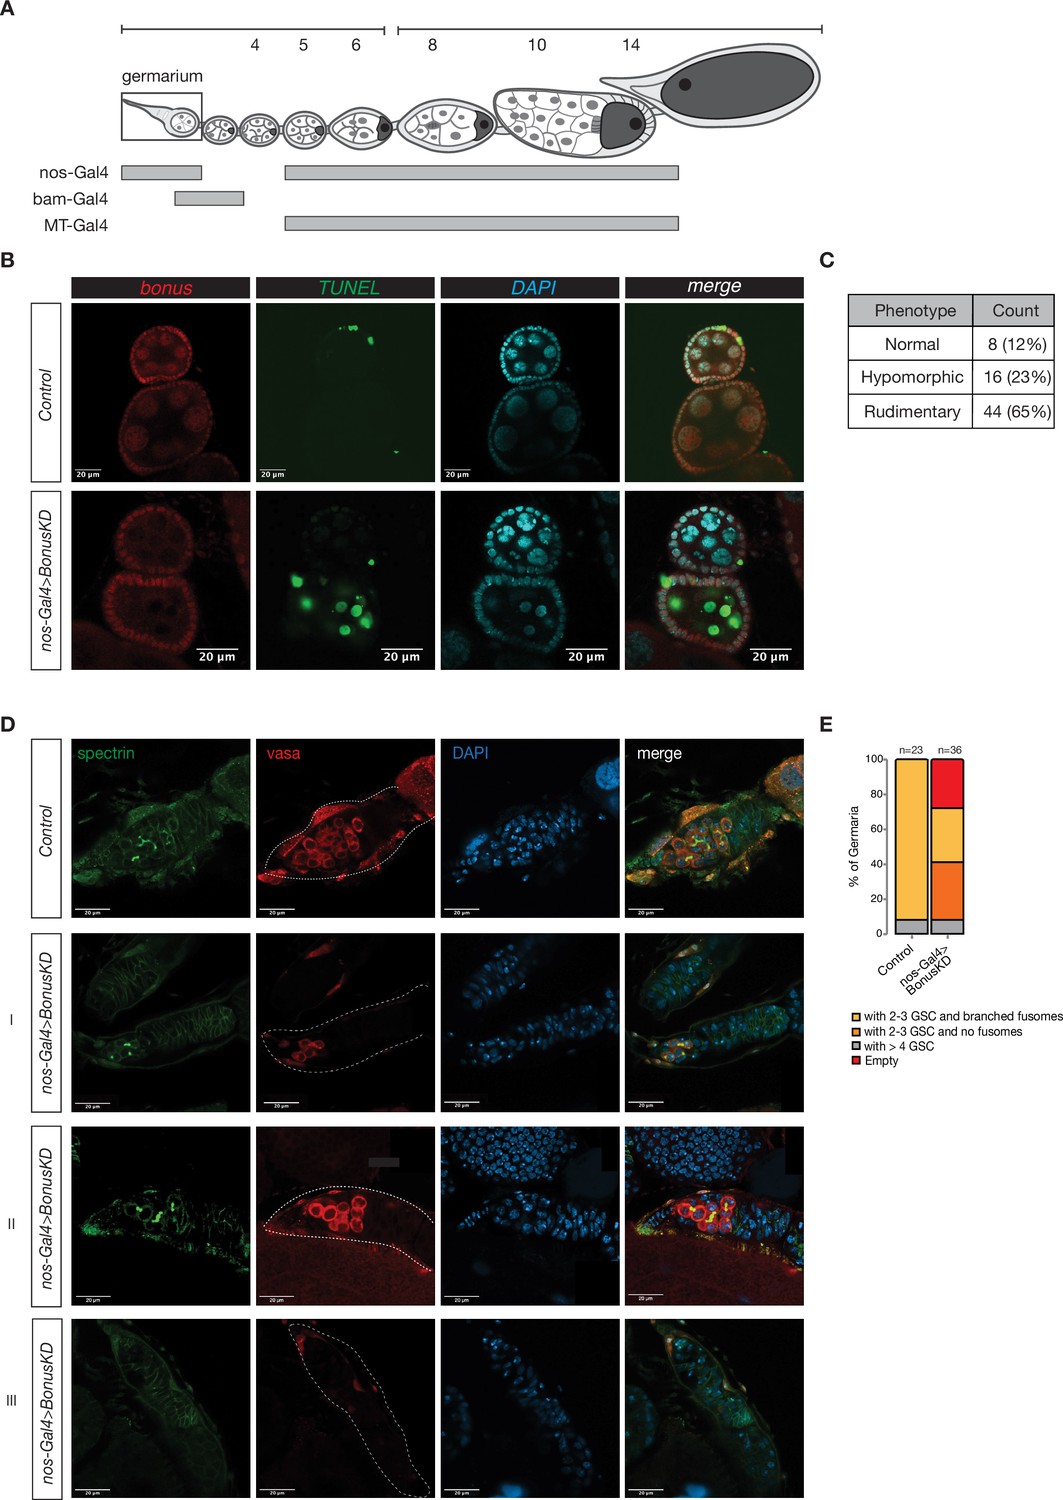
An important function of Bonus in the early stages of oogenesis.
(A) Schematics of a Drosophila ovariole and the expression pattern of different Gal4 driver lines during developmental stages of oogenesis. (B) TUNEL assay. Confocal images of egg chambers from flies with Bon GLKD driven by nos-Gal4 and control siblings from the same cross that lack Bon shRNA stained for Bon (red), TUNEL (green), and DAPI (blue) (scale bar: 20 μm). (C) Table shows the count of ovaries with indicated phenotypes after nos-Gal4; UAS-Cas9 knockout of bon. (D) Confocal images of germarium from flies with Bon GLKD driven by nos-Gal4 and control siblings from the same cross that lack Bon shRNA stained for α-spectrin (green), vasa (red), and DAPI (blue). The numbers on the left represent different germarium categories observed: I: 2–3 germline stem cells (GSCs) and no fusomes, II: >4 GSCs, III: empty germarium (scale bar: 20 μm). (E) Graph showing the percentage of different germarium phenotypes for the indicated genotypes (n = 23 for control flies and n = 36 for flies with Bon GLKD driven by nos-Gal4).
Figure 2 with 1 supplement
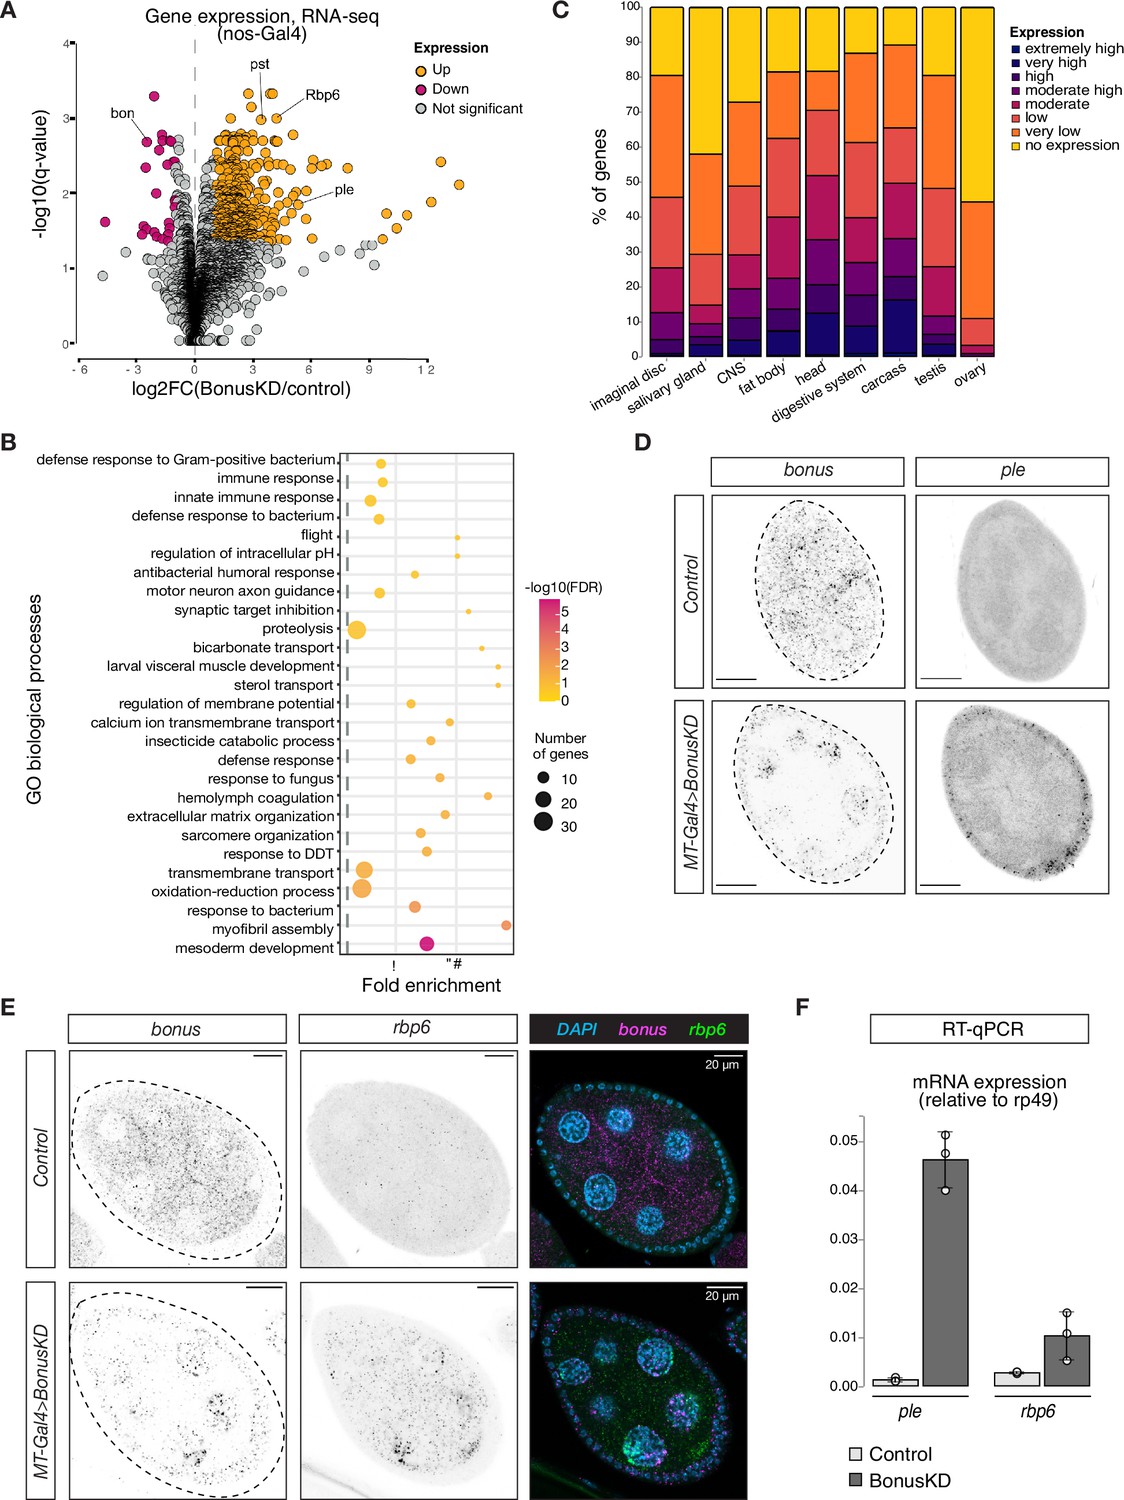
Bonus functions as a repressor of tissue-specific genes in ovary.
(A) Bon GLKD leads to misexpression of tissue-specific genes in the ovary. Volcano plot shows fold changes in genes expression upon Bon GLKD driven by nos-Gal4 in the ovary as determined by RNA-seq (n = 3). Siblings that lack shRNA against Bon produced in the same cross were used as a control. Genes that change significantly (log2FC >1, qval <0.05, LRT test, sleuth; Pimentel et al., 2017) are highlighted. Genes bon, pst, Rbp6, and ple are labeled. Genes with infinite fold change values (zero counts in control ovaries) are not shown. (B) Bon represses genes with diverse functions. Bubble plot shows the analysis of gene ontology (GO) enrichment at the level of biological processes (BP) for genes that are derepressed upon Bon GLKD driven by nos-Gal4 (log2FC >1, qval <0.05, LRT test, sleuth; Pimentel et al., 2017). Only GO terms above the established cut-off criteria (p-value <0.01 and >3 genes per group) are shown. BP are ranked by fold enrichment values. The most significant processes are highlighted in purple, and the less significant in yellow according to log10(FDR) values. The bubbles size reflects the number of genes, assigned to the GO BP terms. (C) Normal expression level of deregulated genes upon Bon GLKD in the tissues where they are normally expressed indicates Bon-mediated silencing of genes normally expressed in the head and digestive system. The graph shows the percentage of derepressed genes upon Bon GLKD driven by nos-Gal4 (log2FC >1, qval <0.05, LRT test, sleuth; Pimentel et al., 2017) with given expression level in the indicated enriched tissues. Expression levels according RPKM values from modENCODE anatomy RNA-seq dataset are no expression (0–0), very low (1–3), low (4–10), moderate (11–25), moderate high (26–50), high (51–100), very high (101–1000), and extremely high (>1000). (D) GLKD of Bon leads to ple expression in follicular cells. Confocal images of egg chambers show RNA in situ hybridization chain reaction (HCR) detecting ple and bonus mRNAs in flies with MT-Gal4>Bon GLKD and control siblings from the same cross that lack Bon shRNA (scale bar: 20 μm). (E) Bon represses rbp6 in the germline. Confocal images of egg chambers show RNA in situ HCR detecting rbp6 and bonus mRNAs in flies with MT-Gal4>Bon GLKD and control siblings from the same cross that lack Bon shRNA (scale bar: 20 μm). (F) Bar graph shows the relative expression of ple and rbp6 (normalized to rp49 level) in control and Bon-depleted ovaries (RT-qPCR, dots correspond to three independent biological replicates (n=3); error bars indicate st. dev.).
Figure 2—figure supplement 1
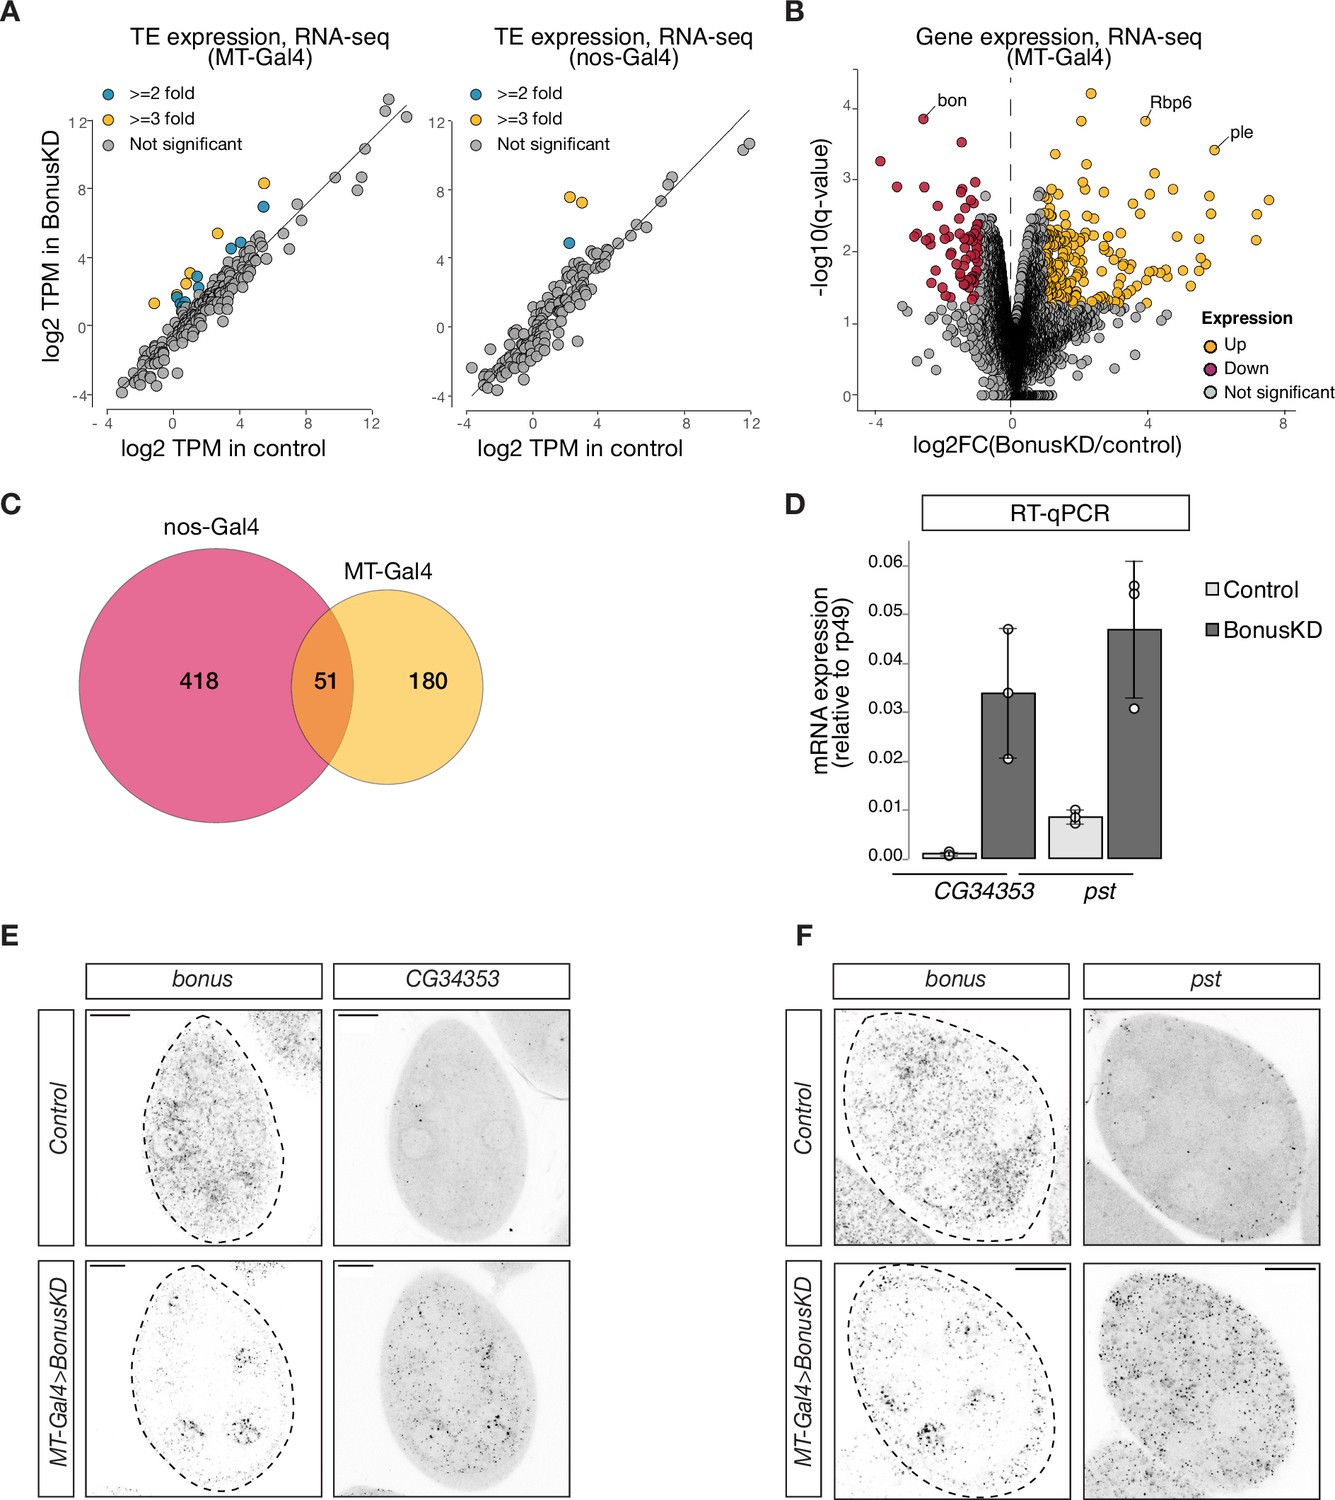
Depletion of Bon induces ectopic activation of non-ovarian genes.
(A) Scatterplots display changes in transposons expression upon Bon GLKD driven by MT-Gal4 (left) or nos-Gal4 (right) as determined by RNA-seq data (log2-transformed TPM values, n = 3). Flies with white GLKD driven by MT-Gal4 (left) or siblings from the same cross that lack Bon shRNA (right) were used as a control. (B) Volcano plot shows fold changes in genes expression upon Bon GLKD driven by MT-Gal4 in the ovary as determined by RNA-seq data (n = 3). Flies with white GLKD driven by MT-Gal4 were used as a control. Genes that change significantly (qval <0.05, LRT test, sleuth; Pimentel et al., 2017) and >twofold are highlighted, and bon, Rbp6, ple are labeled. Genes with infinite fold change values (zero counts in control ovaries) are not shown. (C) Venn diagram of the number of significantly derepressed genes (qval <0.05, LRT test, log2FC >1) upon Bon GLKD driven by MT-Gal4 and nos-Gal4. (D) Bar graph shows the relative expression of CG34353 and pst (normalized to rp49 level) in control and Bon-depleted ovaries (RT-qPCR, dots correspond to three independent biological replicates (n=3); error bars indicate st. dev.; p<0.01, two-tailed Student’s t-test). Confocal images of egg chambers show RNA in situ hybridization chain reaction (HCR) detecting bonus and CG34353 (E) and pst (F) mRNAs in flies with MT-Gal4>Bon GLKD and control siblings from the same cross that lack Bon shRNA (scale bar: 20 μm).
Figure 3 with 1 supplement
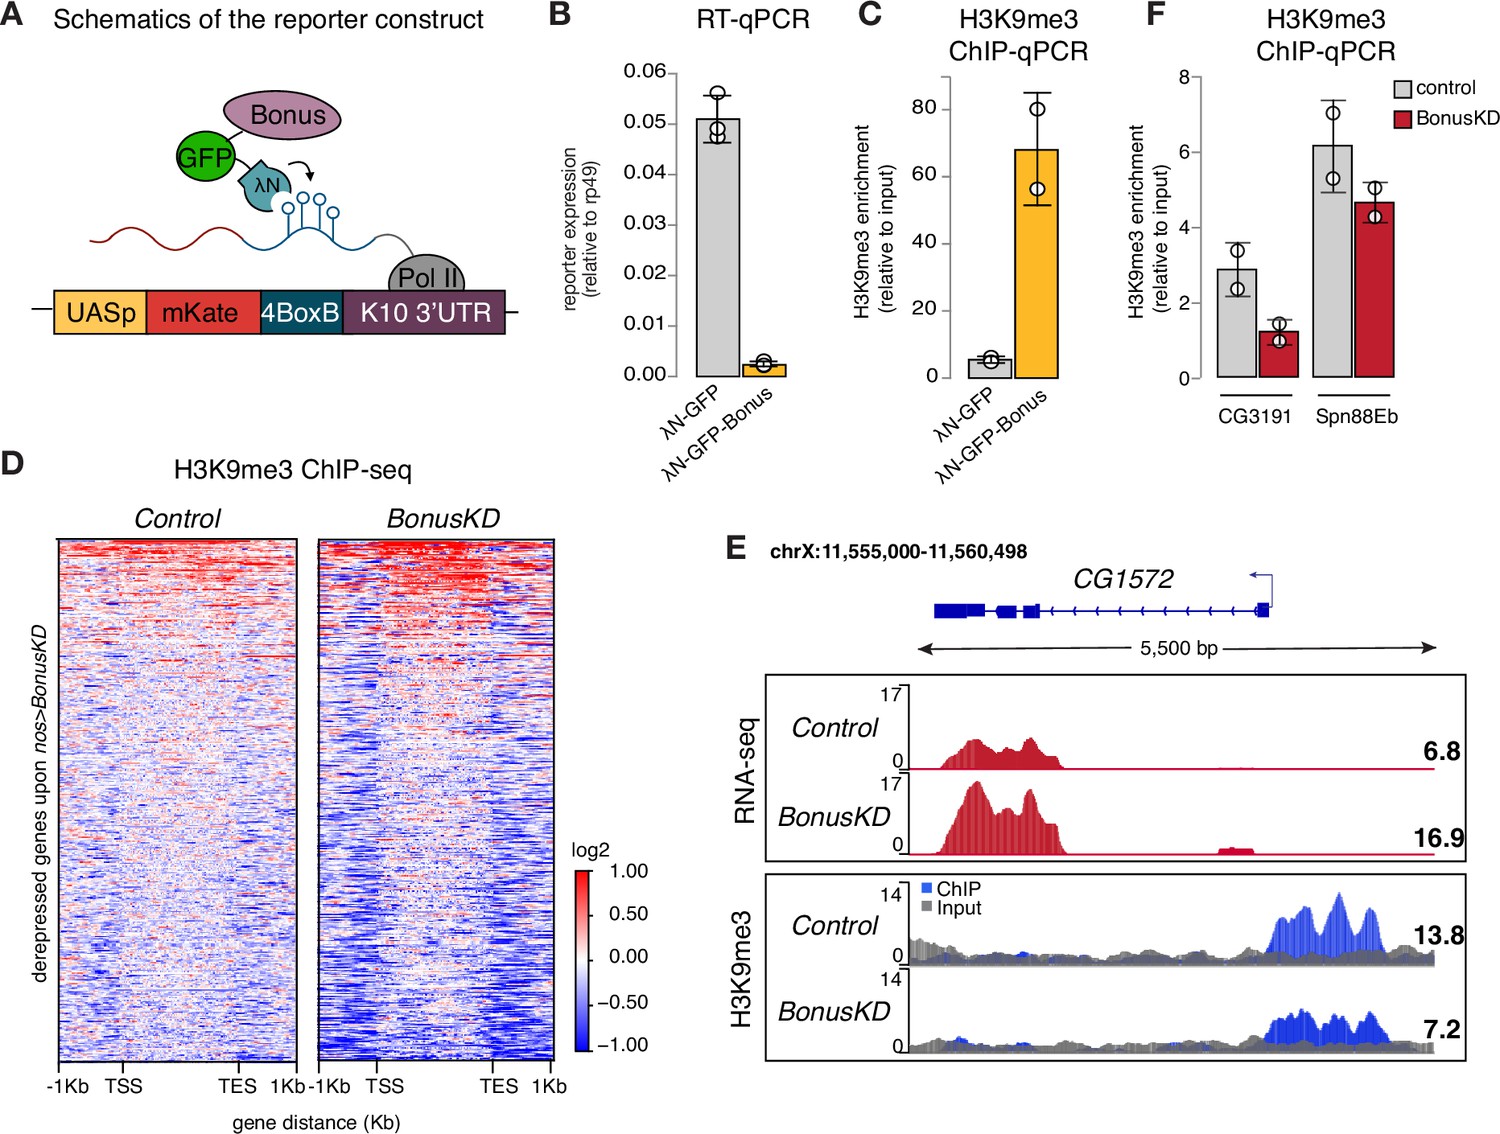
Bonus induces transcriptional silencing.
(A) Schematics of the reporter construct in flies that allows Bon recruitment to nascent reporter transcript in flies. λN-GFP-Bonus and the mKate reporter encoding 4BoxB hairpins are co-expressed in germline cells of the ovary (driven by MT-Gal4). (B) Bon tethering leads to transcriptional silencing of the reporter. Bar plot shows reporter expression (normalized to rp49 level) upon tethering of λN-GFP-Bonus or λN-GFP control ovaries (RT-qPCR, dots correspond to three independent biological replicates (n=3); error bars indicate st. dev.; p<0.001, two-tailed Student’s t-test). (C) Bon tethering leads to H3K9me3 accumulation. Bar plot shows H3K9me3 enrichment upon tethering of λN-GFP-Bonus or λN-GFP control ovaries (ChIP-qPCR, dots correspond to two independent biological replicates (n=2); error bars indicate st. dev.; p<0.05, two-tailed Student’s t-test). (D) Heatmap shows H3K9me3 distribution across Bon targets in control and nos-Gal4>Bon GLKD ovaries (input-normalized log2 values). (E) RNA-seq and ChIP-seq tracks show counts per million (CPM)-normalized coverage for CG1572 in control and nos-Gal4>Bon GLKD ovaries. The gene structure is depicted at the top; arrow indicates the direction of transcription. The ChIP (blue) and input (gray) signals are overlaid. Numbers show the CPM values of the exonic regions (RNA-seq) or the normalized ChIP/input signal (ChIP-seq) in a manually selected genomic location. (F) Bon depletion results in a slight decrease in H3K9me3 over some Bon target genes. Bar graph shows H3K9me3 levels at the genes CG3191 and Spn88Eb in control and Bon-depleted ovaries (ChIP-qPCR, dots correspond to two independent biological replicates (n=2); error bars indicate st. dev.).
Figure 3—figure supplement 1
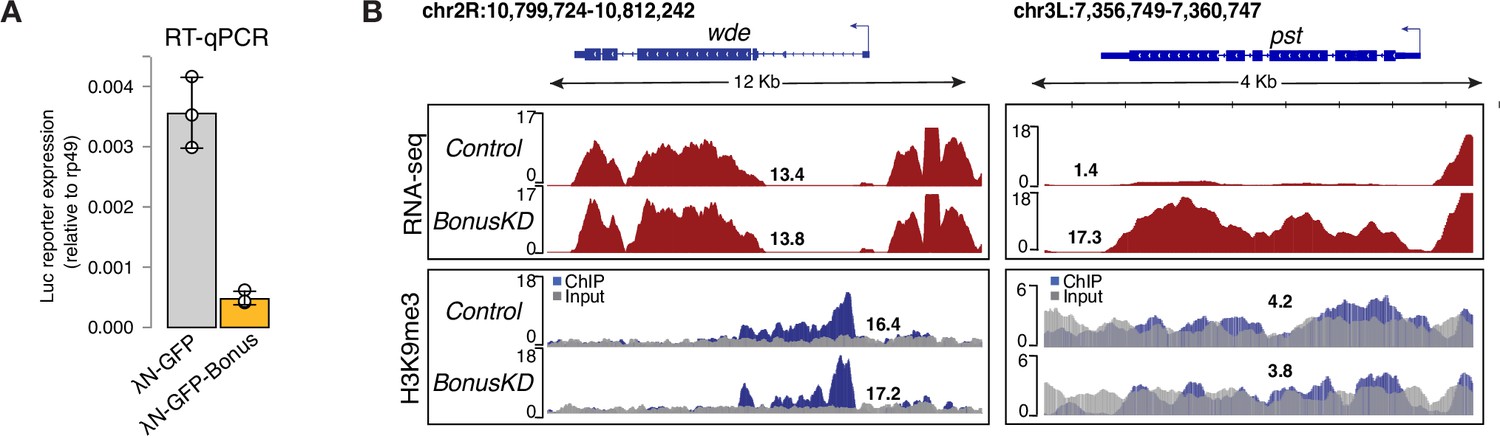
Bonus tethering leads to transcriptional silencing of the reporter.
(A) Bar plot shows the Luciferase reporter expression (normalized to rp49 level) in ovaries upon tethering of λN-GFP-Bonus or λN-GFP control ovaries (RT-qPCR, dots correspond to three independent biological replicates (n=3); error bars indicate st. dev.; p<0.001, two-tailed Student’s t-test). (B) RNA-seq and ChIP-seq tracks show counts per million (CPM)-normalized coverage for wde and pst in control and nos-Gal4>Bon GLKD ovaries. The gene structure is depicted at the top; arrow indicates the direction of transcription. The ChIP (blue) and input (gray) signals are overlaid. Numbers show the CPM values of the exonic regions (RNA-seq) or the normalized ChIP/input signal (ChIP-seq) in a manually selected genomic location.
Figure 4 with 1 supplement
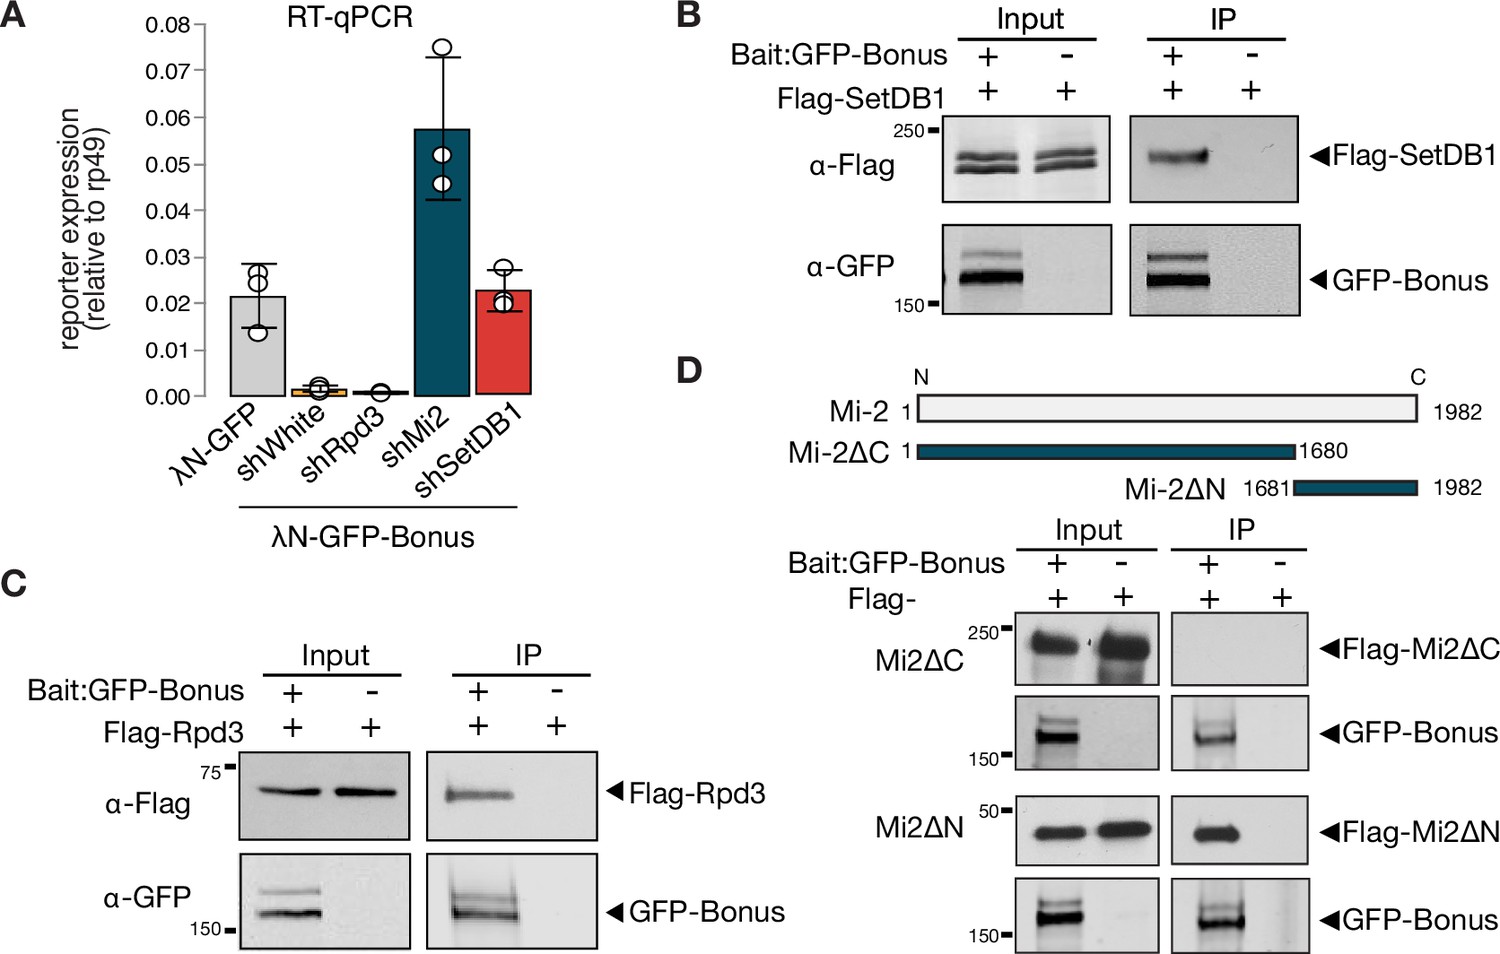
Bonus interacts with Mi-2, Rpd3, and SetDB1.
(A) Reporter silencing by Bon depends on Mi-2 and SetDB1. Bar plot showing the reporter expression (normalized to rp49 level) upon tethering of control λN-GFP or λN-GFP-Bonus in ovaries with Rpd3, Mi-2, SetDB1 GLKD, and control white GLKD (RT-qPCR, dots correspond to three independent biological replicates (n=3); error bars indicate st. dev.). Bon interacts with SetDB1 and Rpd3. Western blot analysis of immunoprecipitation experiment using GFP nanotrap beads from S2 cells co-expressing GFP-Bonus and Flag-tagged SetDB1 (B) and Flag-tagged Rpd3 (C). Lysates not expressing GFP-Bonus were used as negative control. (D) Bon interacts with the C-terminus of Mi-2. Top: schematic illustration of full-length Drosophila Mi-2 and its truncated versions as defined by the amino acids: C-terminal truncated Mi-2 (1–1680) and N-terminal truncated Mi-2 (1681–1982). Bottom: western blot analysis of immunoprecipitation experiment using GFP nanotrap beads from S2 cells co-expressing GFP-Bonus and Flag-tagged Mi2 fragments. Lysate not expressing GFP-Bonus was used as negative control.
-
Figure 4—source data 1
Annotated and uncropped western blots and raw images for Figure 4B.
- https://cdn.elifesciences.org/articles/89493/elife-89493-fig4-data1-v1.zip
-
Figure 4—source data 2
Annotated and uncropped western blots and raw images for Figure 4C.
- https://cdn.elifesciences.org/articles/89493/elife-89493-fig4-data2-v1.zip
-
Figure 4—source data 3
Annotated and uncropped western blots and raw images for Figure 4D.
- https://cdn.elifesciences.org/articles/89493/elife-89493-fig4-data3-v1.zip
Figure 4—figure supplement 1
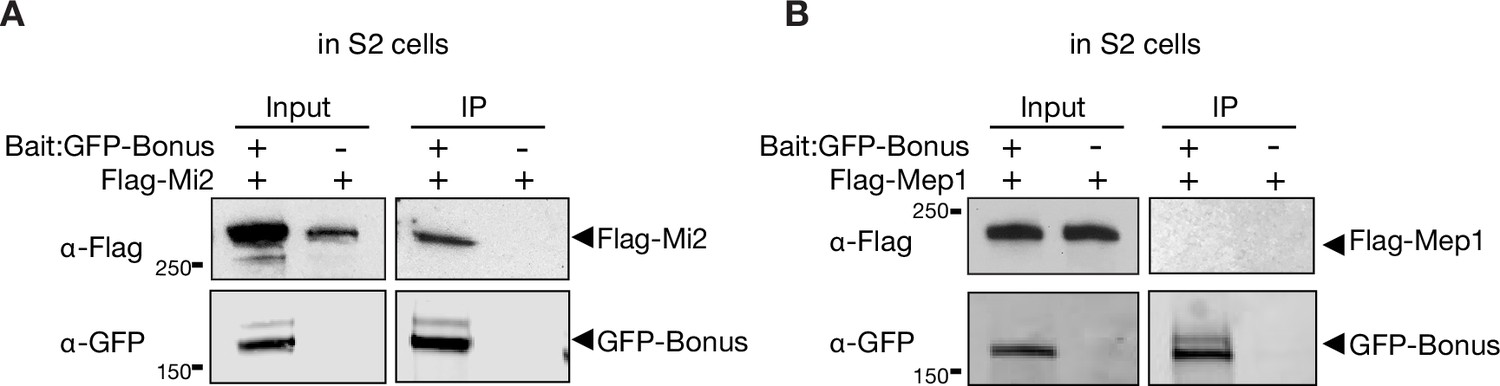
Bonus interacts with Mi-2.
Western blot analysis of immunoprecipitation experiment using GFP nanotrap beads from S2 cells co-expressing GFP-Bonus and Flag-tagged Mi-2 (A) or Flag-tagged Mep-1 (B). Lysates not expressing the GFP-Bonus were used as negative control.
-
Figure 4—figure supplement 1—source data 1
Annotated and uncropped western blots and raw images for Figure 4—figure supplement 1A.
- https://cdn.elifesciences.org/articles/89493/elife-89493-fig4-figsupp1-data1-v1.zip
-
Figure 4—figure supplement 1—source data 2
Annotated and uncropped western blots and raw images for Figure 4—figure supplement 1B.
- https://cdn.elifesciences.org/articles/89493/elife-89493-fig4-figsupp1-data2-v1.zip
Figure 5 with 2 supplements
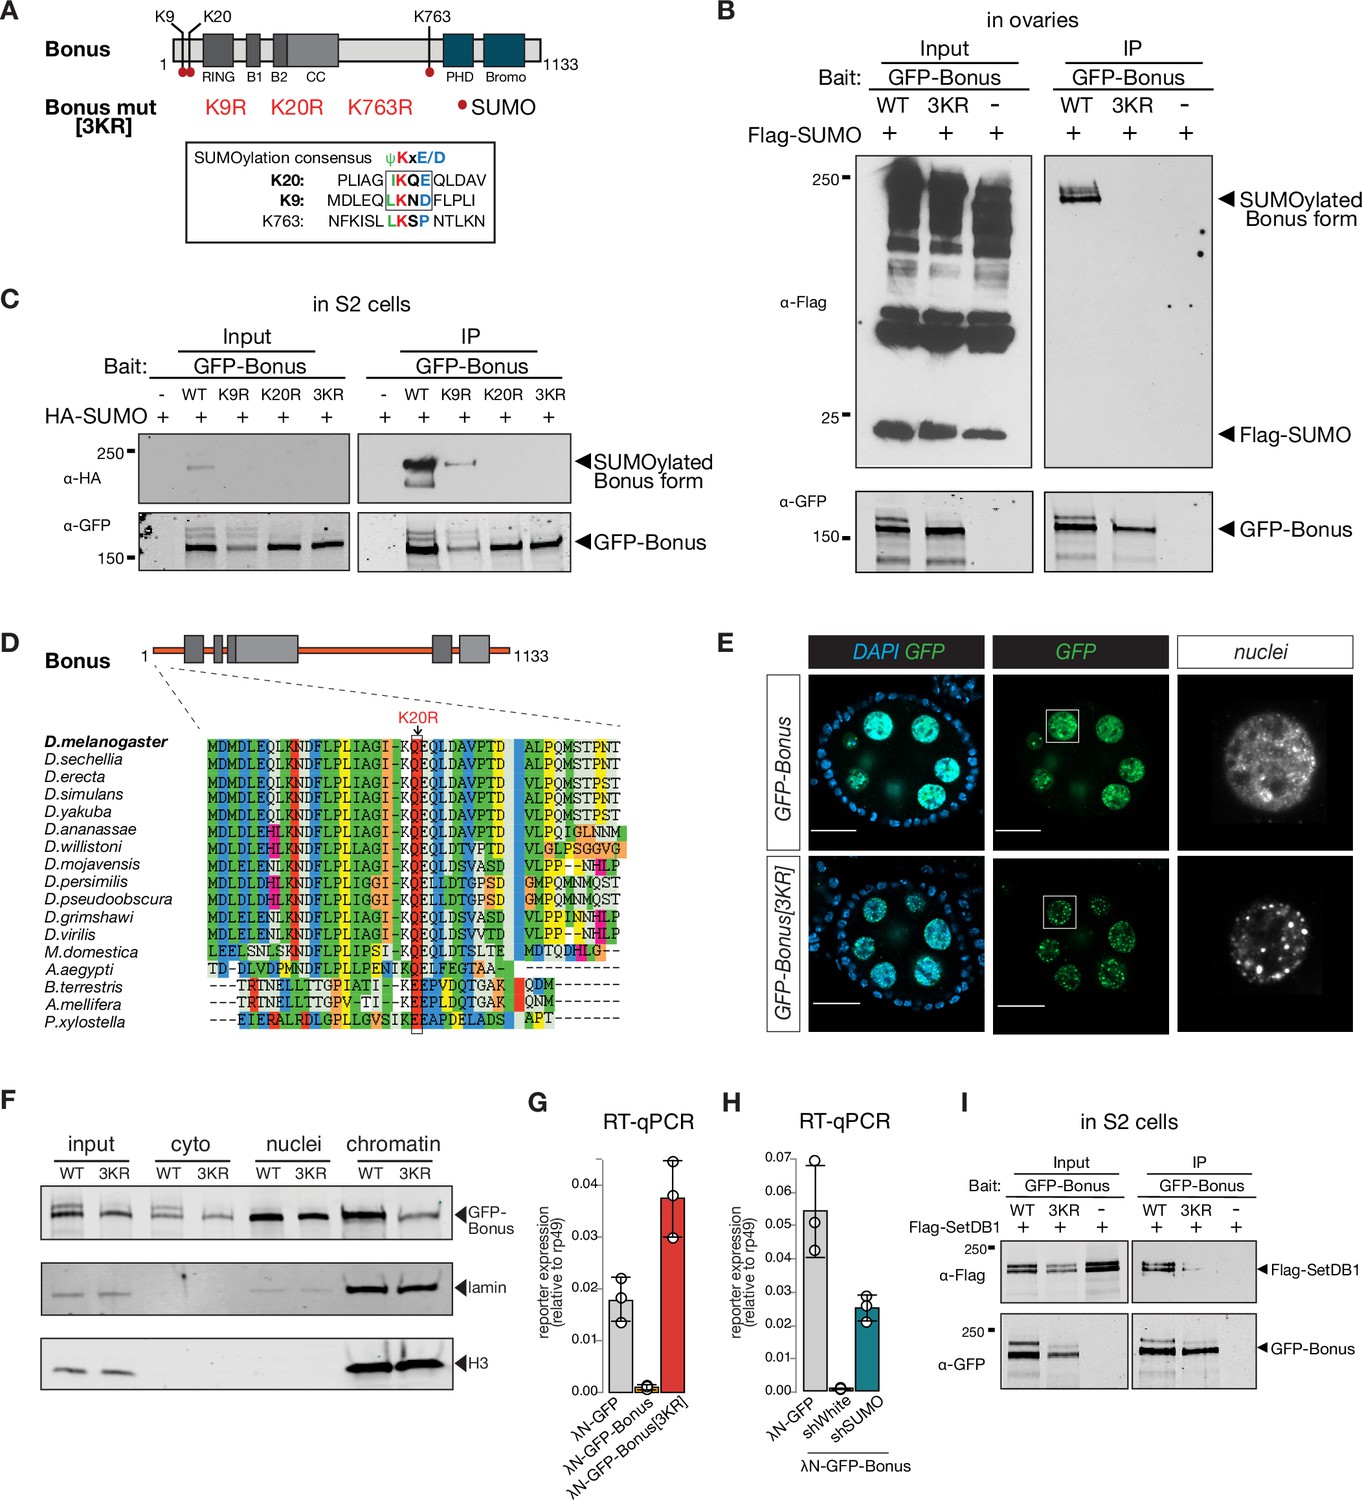
Bonus is SUMOylated.
(A) Schematic representation of putative SUMOylation sites within Bon. SUMOylation consensus sites are shown and boxed. Canonical consensus sites are in bold. Putative SUMOylated lysines were mutated to arginines individually (K9R, K20R, and K763R) or in combination (3KR). (B) Bon is SUMOylated at specific residues. Western blot analysis shows the SUMOylation levels of GFP-tagged Bon and SUMO-deficient triple mutant 3KR expressed in fly ovaries. SUMOylated form of Bon was detected only in wild-type GFP-Bonus (WT). Total protein lysates from flies co-expressing Flag-SUMO and λN-GFP-Bonus or λN-GFP-Bonus[3KR] were immunopurified using anti-GFP nanotrap beads. Flies not expressing λN-GFP-tagged protein were used as a negative control. (C) Bon is predominantly SUMOylated at K20. Western blot analysis shows the associated SUMOylation levels of GFP-tagged Bon and SUMO-deficient triple mutant 3KR and single mutated K9R, K20R expressed in S2 cells. Single mutation K9R reduced, while the K20R mutation and triple 3KR mutation completely abolished Bon SUMOylation. Total protein lysates from S2 cells co-expressing HA-SUMO and GFP-Bonus or GFP-Bonus[3KR], GFP-Bonus[K9R], GFP-Bonus[K20R] were immunopurified using anti-GFP nanotrap beads. Lysate not expressing GFP-tagged protein was used as a negative control. (D) SUMOylation site of Bon is conserved in insects. Sequence alignment of the Bon protein sequence from 12 Drosophila species and other insects shows conserve action of canonical SUMOylation consensus at K20 (boxed and indicated by the arrowhead). (E) SUMO-deficient Bon mislocalizes into nuclear foci. Confocal images of egg chambers show the localization of MT-Gal4-driven λN-GFP-tagged Bonus and SUMO-deficient triple mutant λN-GFP-Bonus[3KR] flies. Images on the right panel show isolated nurse cell nuclei (scale bar: 20 μm). (F) Chromatin association of Bon depends on its SUMOylation. Western blot analysis shows the fractionation of cytoplasmic (cyto), nuclear (nuclei), and chromatin compartments of MT-Gal4-driven λN-GFP-tagged Bonus (WT) and SUMO-deficient triple mutant λN-GFP-Bonus (3KR) fly ovaries. Lamin and Histone H3 were used as markers for nuclear and chromatin fractions. (G) Bon-mediated reporter repression depends on Bon SUMOylation. Bar plot shows the reporter expression (normalized to rp49 level) upon tethering of λN-GFP-Bonus, SUMO-deficient triple mutant λN-GFP-Bonus[3KR] or λN-GFP control ovaries (RT-qPCR, dots correspond to three independent biological replicates (n=3); error bars indicate st. dev.). (H) Bar plot shows the reporter expression (normalized to rp49 level) upon tethering of control λN-GFP or λN-GFP-Bonus in ovaries with SUMO GLKD, and control white GLKD (RT-qPCR, dots correspond to three independent biological replicates (n=3); error bars indicate st. dev.). (I) Western blot analysis shows the SUMO-dependent interaction between Bon and SetDB1. Total protein lysates from S2 cells co-expressing Flag-SetDB1 and GFP-Bonus (WT) or triple mutant GFP-Bonus[3KR] (3KR) were immunopurified using anti-GFP nanotrap beads. Lysate from cells not expressing GFP-tagged protein was used as a negative control.
-
Figure 5—source data 1
Annotated and uncropped western blots and raw images for Figure 5B.
- https://cdn.elifesciences.org/articles/89493/elife-89493-fig5-data1-v1.zip
-
Figure 5—source data 2
Annotated and uncropped western blots and raw images for Figure 5C.
- https://cdn.elifesciences.org/articles/89493/elife-89493-fig5-data2-v1.zip
-
Figure 5—source data 3
Annotated and uncropped western blots and raw images for Figure 5F.
- https://cdn.elifesciences.org/articles/89493/elife-89493-fig5-data3-v1.zip
-
Figure 5—source data 4
Annotated and uncropped western blots and raw images for Figure 5I.
- https://cdn.elifesciences.org/articles/89493/elife-89493-fig5-data4-v1.zip
Figure 5—figure supplement 1
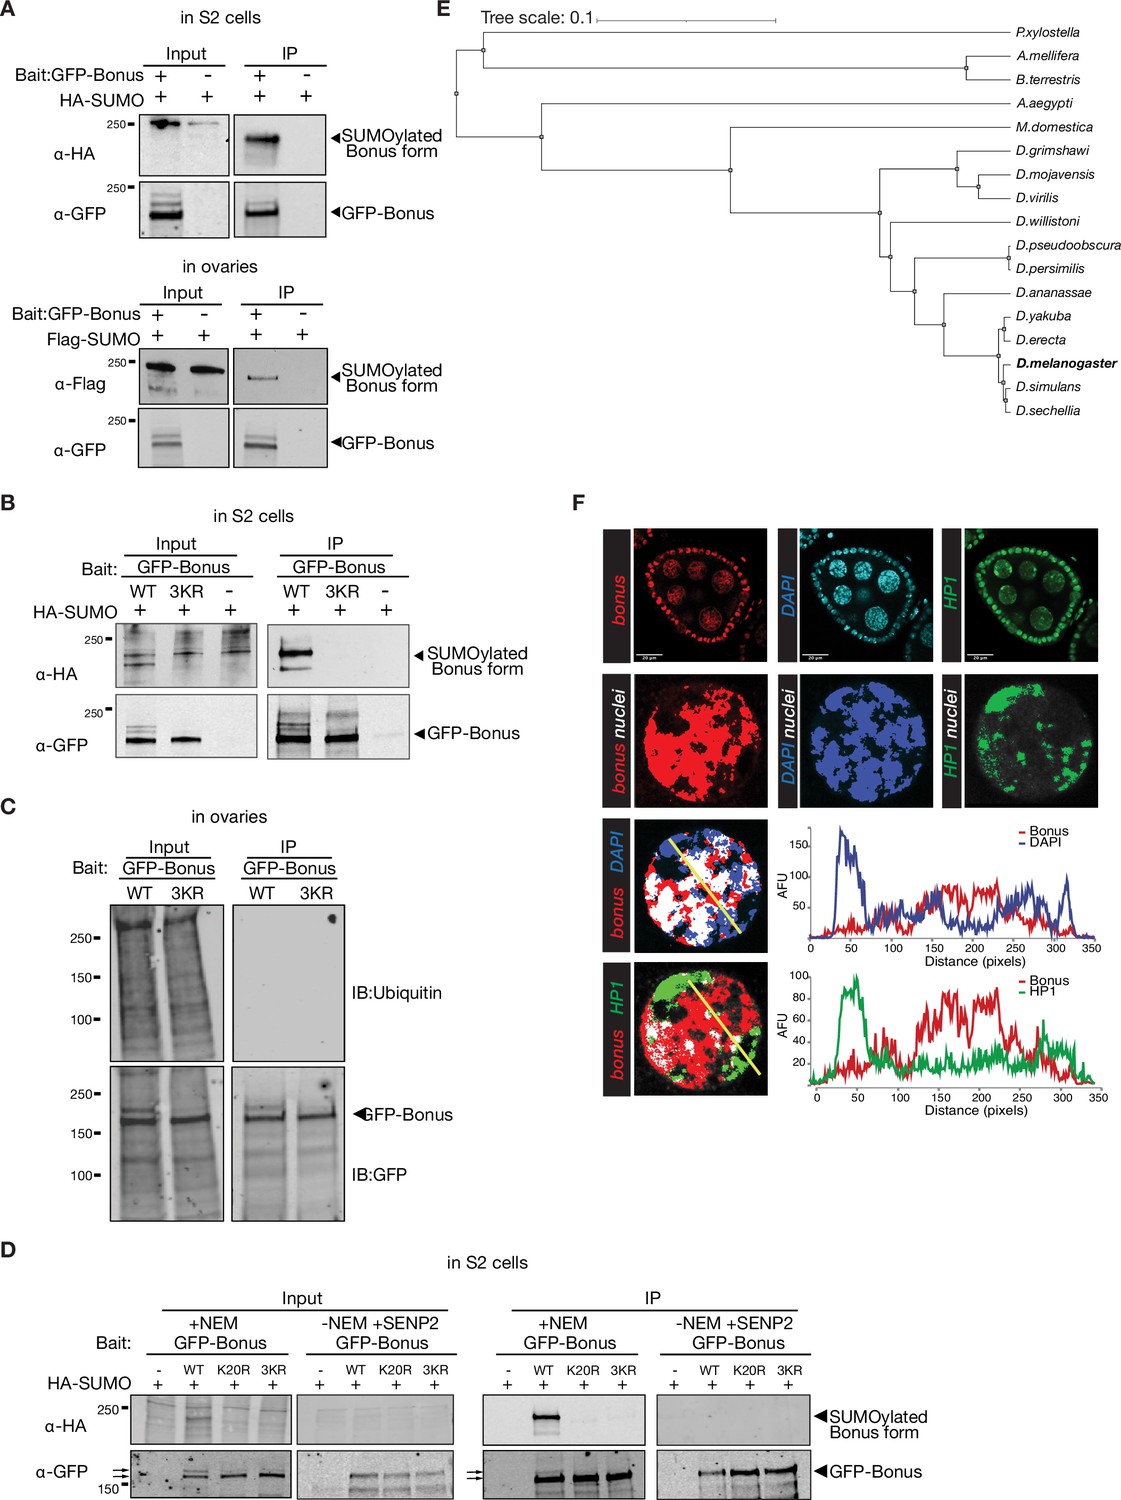
SUMOylation of Bonus.
(A) Western blot analysis of GFP-Bonus SUMOylation in S2 cells (top) and ovaries (bottom). Total protein lysates from S2 cells co-expressing HA-SUMO and GFP-Bonus or from ovaries of flies co-expressing Flag-SUMO and λN-GFP-Bonus were used to immunopurify Bon using anti-GFP nanotrap beads. S2 cells or flies not expressing GFP-tagged protein were used as negative control. (B) Western blot analysis of SUMOylation of GFP-tagged Bon and SUMO-deficient triple mutant 3KR expressed in S2 cells. Triple 3KR mutation completely abolished Bon SUMOylation. Total protein lysates from S2 cells co-expressing HA-SUMO and GFP-Bonus or GFP-Bonus[3KR] were immunopurified using anti-GFP nanotrap beads. Cell lysates not expressing GFP-tagged proteins were used as a negative control. (C) Western blot analysis of ubiquitination of GFP-tagged Bon and SUMO-deficient triple mutant 3KR expressed in ovaries. Total protein lysates from ovaries of flies expressing λN-GFP-Bonus or λN-GFP-Bonus[3KR] were used to immunopurify Bon using anti-GFP nanotrap beads. (D) Western blot analysis shows the SUMOylation levels of GFP-tagged Bon and SUMO-deficient triple mutant 3KR and single mutated K20R expressed in S2 cells in the presence of N-ethylmaleimide (NEM) or in the presense of SUMO protease SENP2 and absence NEM. Total protein lysates from S2 cells co-expressing HA-SUMO and GFP-Bonus or GFP-Bonus[3KR], GFP-Bonus[K20R] were immunopurified using anti-GFP nanotrap beads. Lysate not expressing GFP-tagged protein was used as a negative control. (E) Phylogenetic relationships between the 12 Drosophila species and some other insects (using iTOL). (F) Confocal images of egg chambers from wild-type Oregon-R flies stained for Bon (red), DAPI (blue), and HP1 (green) (scale bar: 20 μm). Bottom images show isolated nurse cell nuclei. Bottom right represent fluorescence intensity analysis of overlayed signal (along the yellow line) performed by ImageJ software and expressed as arbitrary fluorescence units (AFU).
-
Figure 5—figure supplement 1—source data 1
Annotated and uncropped western blots and raw images for Figure 5—figure supplement 1A.
- https://cdn.elifesciences.org/articles/89493/elife-89493-fig5-figsupp1-data1-v1.zip
-
Figure 5—figure supplement 1—source data 2
Annotated and uncropped western blots and raw images for Figure 5—figure supplement 1B.
- https://cdn.elifesciences.org/articles/89493/elife-89493-fig5-figsupp1-data2-v1.zip
-
Figure 5—figure supplement 1—source data 3
Annotated and uncropped western blots and raw images for Figure 5—figure supplement 1C.
- https://cdn.elifesciences.org/articles/89493/elife-89493-fig5-figsupp1-data3-v1.zip
-
Figure 5—figure supplement 1—source data 4
Annotated and uncropped western blots and raw images for Figure 5—figure supplement 1D.
- https://cdn.elifesciences.org/articles/89493/elife-89493-fig5-figsupp1-data4-v1.zip
Figure 5—figure supplement 2
SUMO-independent and dependent interactions of Bonus.
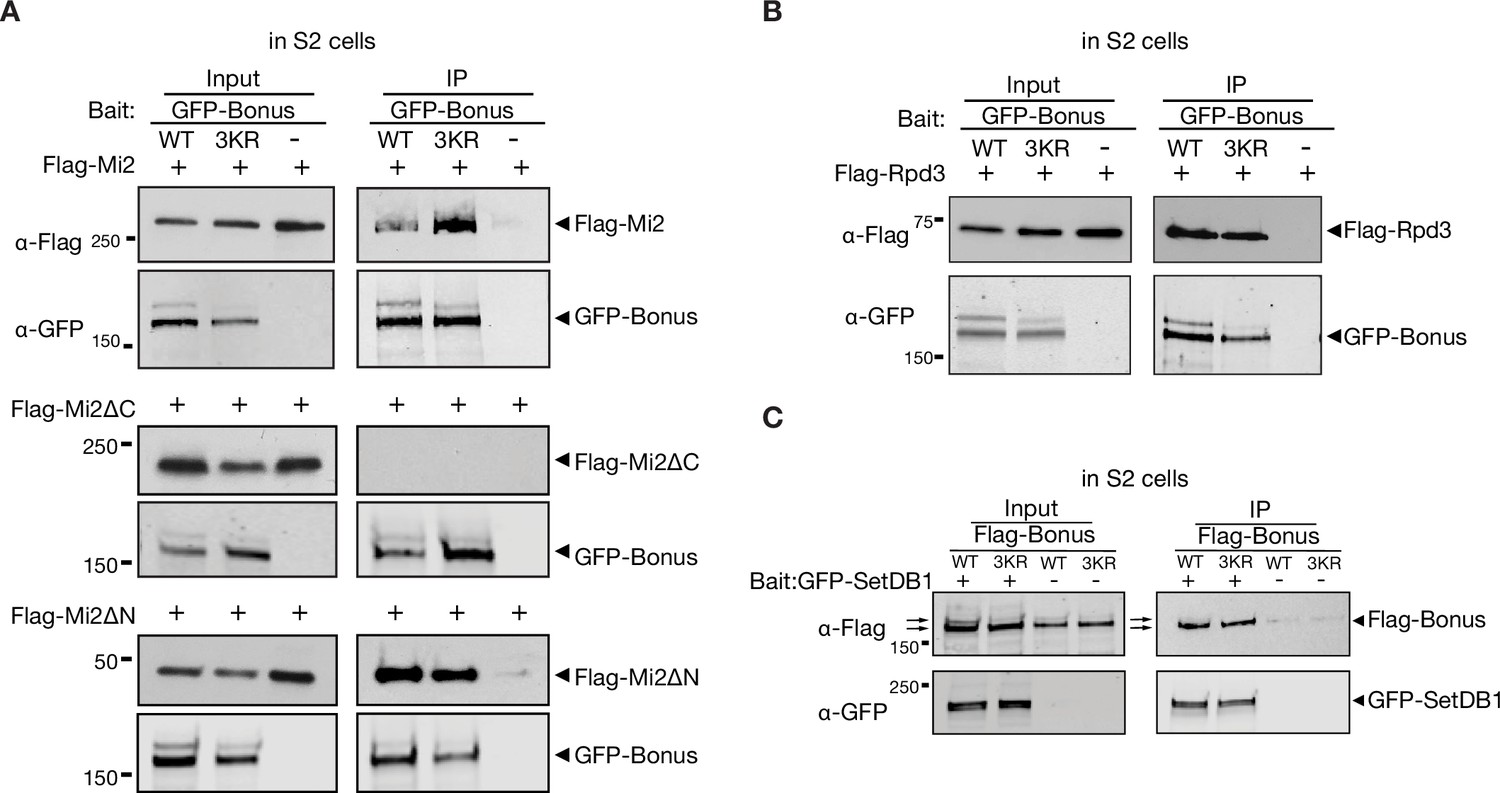
(A, B) Western blot analysis shows the SUMO-independent interaction between Bon and Mi-2 or Rpd3. Total protein lysates from S2 cells co-expressing GFP-Bonus (WT) or triple mutant GFP-Bonus[3KR] (3KR) and full-length or truncated Flag-Mi2 (A), and Flag-Rpd3 (B) were immunopurified using anti-GFP nanotrap beads. Lysates from cells not expressing GFP-tagged proteins were used as a negative control. (C) Western blot analysis shows the interaction between Bon and SetDB1. Total protein lysates from S2 cells co-expressing GFP-SetDB1 and Flag-Bonus (WT) or triple mutant Flag-Bonus[3KR] (3KR) were immunopurified using anti-GFP nanotrap beads. Lysates from cells not expressing GFP-SetDB1 proteins were used as a negative control.
-
Figure 5—figure supplement 2—source data 1
Annotated and uncropped western blots and raw images for Figure 5—figure supplement 2A.
- https://cdn.elifesciences.org/articles/89493/elife-89493-fig5-figsupp2-data1-v1.zip
-
Figure 5—figure supplement 2—source data 2
Annotated and uncropped western blots and raw images for Figure 5—figure supplement 2B.
- https://cdn.elifesciences.org/articles/89493/elife-89493-fig5-figsupp2-data2-v1.zip
-
Figure 5—figure supplement 2—source data 3
Annotated and uncropped western blots and raw images for Figure 5—figure supplement 2C.
- https://cdn.elifesciences.org/articles/89493/elife-89493-fig5-figsupp2-data3-v1.zip
Figure 6 with 1 supplement
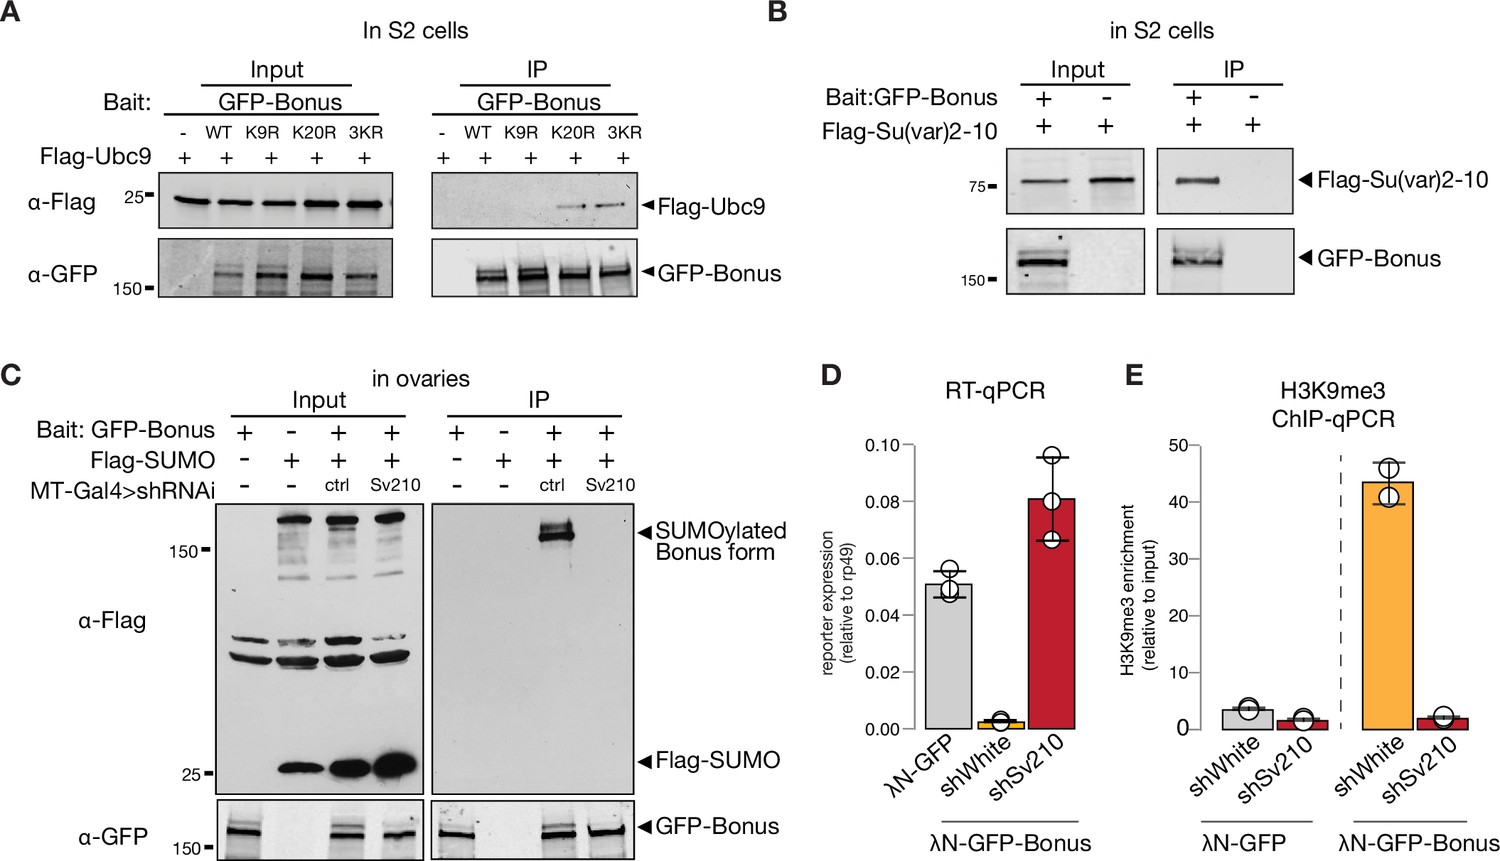
SUMO E3-ligase Su(var)2–10 interacts with Bonus and regulates its SUMOylation.
(A) Western blot analysis shows the interaction between Bon and SUMO E2-conjugating enzyme Ubc9. Total protein lysates from S2 cells co-expressing Flag-Ubc9 and GFP-Bonus (WT), SUMO-deficient triple mutant 3KR or single mutated K9R, K20R were immunopurified using anti-GFP nanotrap beads. Lysate from cells not expressing GFP-tagged proteins was used as a negative control. (B) Bon interacts with Su(var)2–10. Western blot analysis of immunoprecipitation experiment using GFP nanotrap beads from S2 cells co-expressing GFP-Bonus and Flag-tagged Su(var)2–10. Lysate expressing only Flag-Su(var)2–10 was used as a negative control. (C) Western blot analysis shows the loss of SUMOylated Bon in fly ovaries upon Su(var)2–10 depletion. Total protein lysates from flies co-expressing MT-Gal4-driven Flag-SUMO and λN-GFP-Bonus and shRNAs against Su(var)2–10 (Sv210) or control white (ctrl) were immunopurified using anti-GFP nanotrap beads. Ovarian lysates from flies expressing only Flag-SUMO, only expressing λN-GFP-Bonus, or lacking Su(var)2–10 shRNA were used as controls. (D) Reporter repression by Bon depends on Su(var)2–10. Bar plot shows reporter expression (normalized to rp49 level) upon tethering of control λN-GFP or λN-GFP-Bonus in ovaries with Su(var)2–10 GLKD (shSv210), and control white GLKD (RT-qPCR, dots correspond to three independent biological replicates (n=3); error bars indicate st. dev.). (E) Bon H3K9me3 depositing requires Su(var)2–10. Bar plot shows H3K9me3 enrichment upon tethering of control λN-GFP or λN-GFP-Bonus in ovaries with Su(var)2–10 GLKD (shSv210), and control white GLKD (ChIP-qPCR, dots correspond to two independent biological replicates (n=2); error bars indicate st. dev.).
-
Figure 6—source data 1
Annotated and uncropped western blots and raw images for Figure 6A.
- https://cdn.elifesciences.org/articles/89493/elife-89493-fig6-data1-v1.zip
-
Figure 6—source data 2
Annotated and uncropped western blots and raw images for Figure 6B.
- https://cdn.elifesciences.org/articles/89493/elife-89493-fig6-data2-v1.zip
-
Figure 6—source data 3
Annotated and uncropped western blots and raw images for Figure 6C.
- https://cdn.elifesciences.org/articles/89493/elife-89493-fig6-data3-v1.zip
Figure 6—figure supplement 1
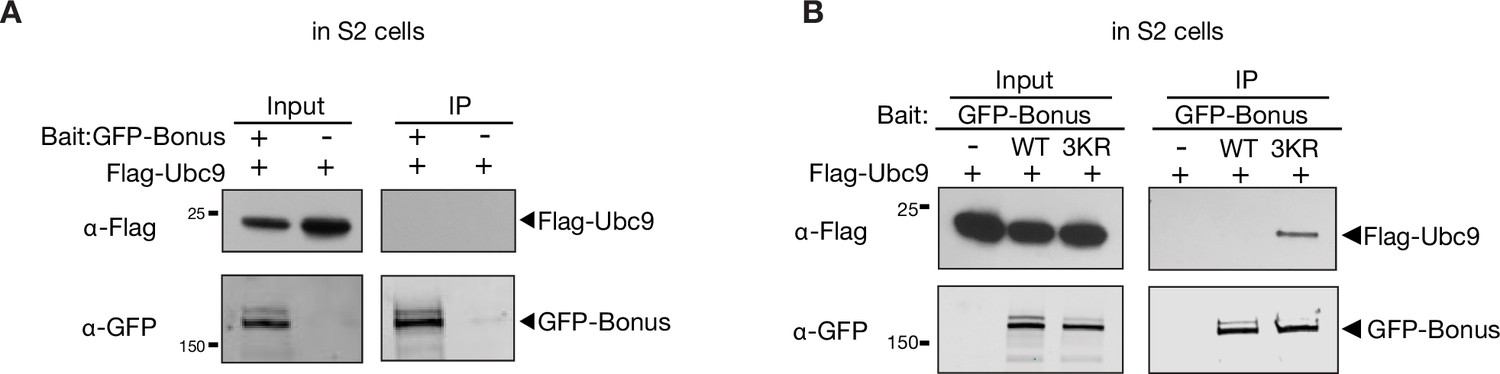
Bonus does not interact with Ubc9 in S2 cells.
Western blot analysis of immunoprecipitation experiment using GFP nanotrap beads from S2 cells co-expressing Flag-tagged Ubc9 and GFP-Bonus (A) or Flag-tagged Ubc9 and GFP-Bonus or SUMO-deficient triple mutant 3KR GFP-Bonus (B). Lysates not expressing the GFP-tagged proteins were used as negative control.
-
Figure 6—figure supplement 1—source data 1
Annotated and uncropped western blots and raw images for Figure 6—figure supplement 1A.
- https://cdn.elifesciences.org/articles/89493/elife-89493-fig6-figsupp1-data1-v1.zip
-
Figure 6—figure supplement 1—source data 2
Annotated and uncropped western blots and raw images for Figure 6—figure supplement 1B.
- https://cdn.elifesciences.org/articles/89493/elife-89493-fig6-figsupp1-data2-v1.zip
Additional files
Download links
A two-part list of links to download the article, or parts of the article, in various formats.
Downloads (link to download the article as PDF)
Open citations (links to open the citations from this article in various online reference manager services)
Cite this article (links to download the citations from this article in formats compatible with various reference manager tools)
SUMOylation of Bonus, the Drosophila homolog of Transcription Intermediary Factor 1, safeguards germline identity by recruiting repressive chromatin complexes to silence tissue-specific genes
eLife 12:RP89493.
https://doi.org/10.7554/eLife.89493.3


