An atypical basement membrane forms a midline barrier during left-right asymmetric gut development in the chicken embryo
- Department of Molecular Medicine, College of Veterinary Medicine, Cornell University, United States
- Department of Genetics and Developmental Biology, Rappaport Faculty of Medicine, Technion – Israel Institute of Technology, Israel
- Rappaport Faculty of Medicine, Technion – Israel Institute of Technology, Israel
- Stowers Institute for Medical Research, United States
- Department of Anatomy and Cell Biology, University of Kansas Medical Center, United States
Figures
Figure 1
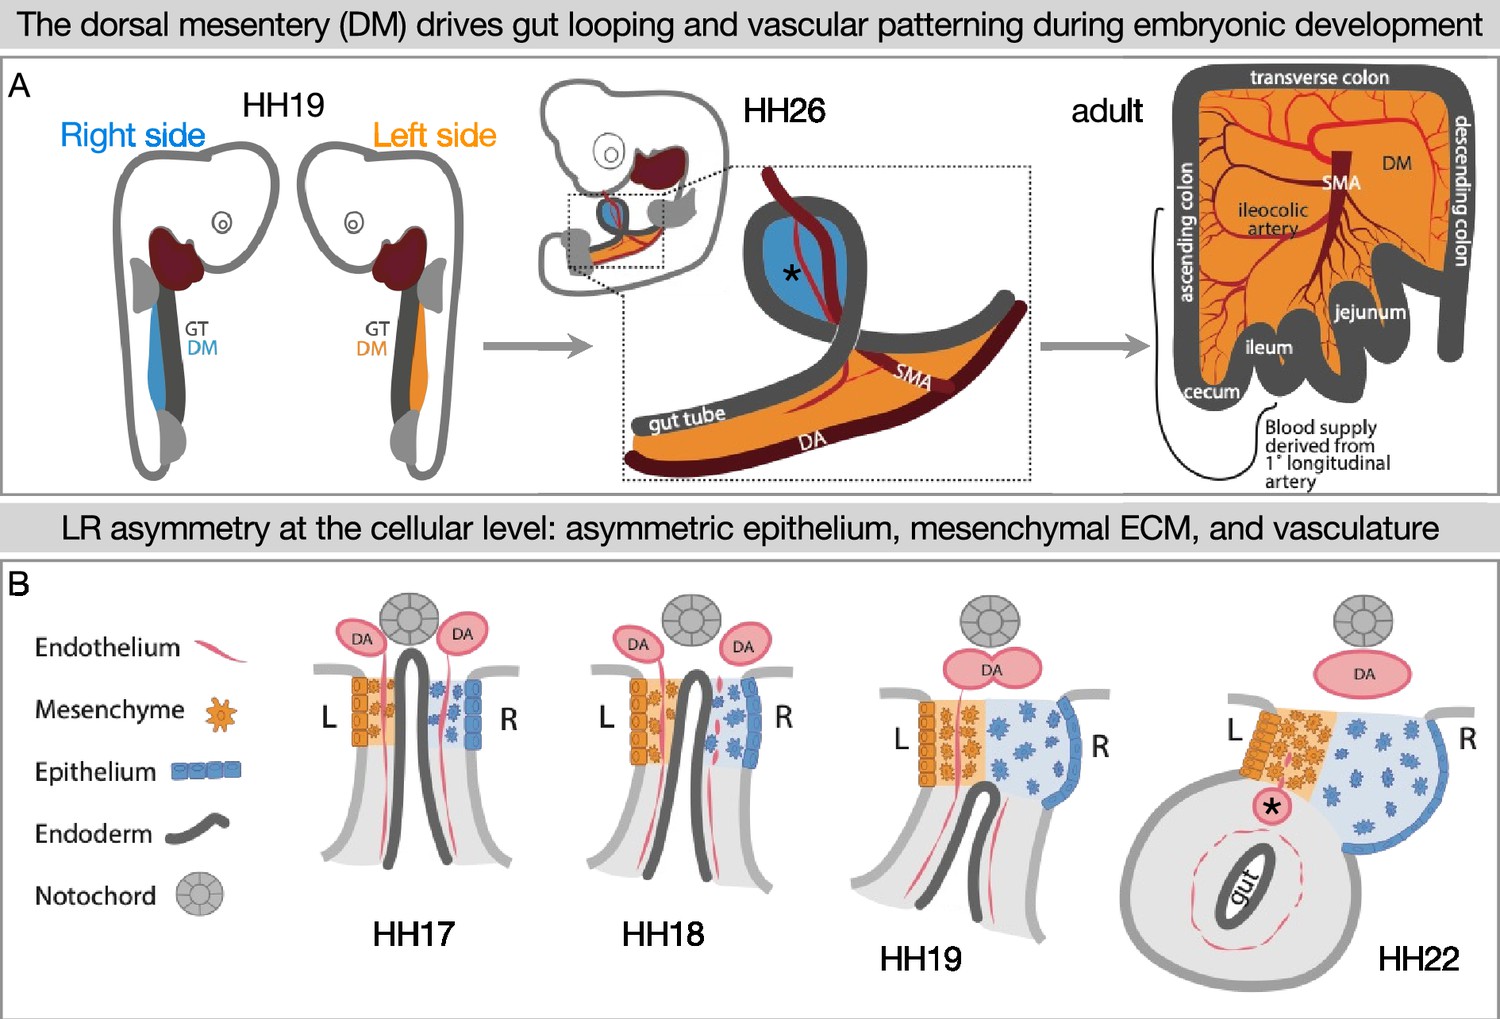
Left-right (LR) asymmetry in the DM is critical for proper gut looping and vascular patterning.
(A) Asymmetries in the DM drive the formation of the first and subsequent gut loops. Concurrently, the vasculature is being patterned in the DM. The 1° longitudinal artery (*) gives rise to the ileocolic artery, which provides a significant portion of the adult intestine with critical blood flow. (B) Hamburger-Hamilton stage 17 (HH17): The DM has cellular symmetry. HH18 and 19: The right mesenchyme begins expanding and the right epithelial cells elongate. The right-sided endothelial cells (vascular precursors) begin to disperse and leave the compartment, while the left-sided endothelium is maintained to become the future gut arteries. HH22: The asymmetric forces have pushed the gut tube to the left. A left-sided blood vessel, the 1° longitudinal artery (*) has formed. GT = gut tube, DM = dorsal mesentery, DA = dorsal aorta, SMA = superior mesenteric artery.
Figure 2

During DM formation from epithelial-to-mesenchymal transition (EMT) and ingression of the coelomic epithelia, right and left cells do not mix.
When the coelomic cavity is injected with DiI at Hamburger-Hamilton stage 12–13 (HH12–13), n=5 (A), the labeled cells give rise to the mesenchymal and epithelial cells of the DM on the corresponding side of the embryo, n=5 (B). When DiI and DiO are injected at HH12–13 into left and right coeloms, respectively, n=6 (C), labeled cells are still segregated at HH18, n=6 (D, E, F). The same results are found when cells are labeled by electroporation with pCAG-GFP (left) and pCl-H2B-RFP (right) (G, H), both when the midline is continuous (HH19 n=3), (G) and once it has disappeared (HH21 n=3, H). (I–L) H&E staining of the DM at HH18 n=5 (I) shows ‘empty space’ between the notochord, endoderm, and dorsal aortae. At HH19 n=5 (J), this space gains some cells (arrows), and the space is completely filled in by HH20 n=4 (K) and HH21 n=3 (L). Scale bars = 60 μm. nt = neural tube, c = coelom, ao = aorta, N = notochord, s = somite, DM = dorsal mesentery, L = left, R = right.
Figure 3 with 4 supplements
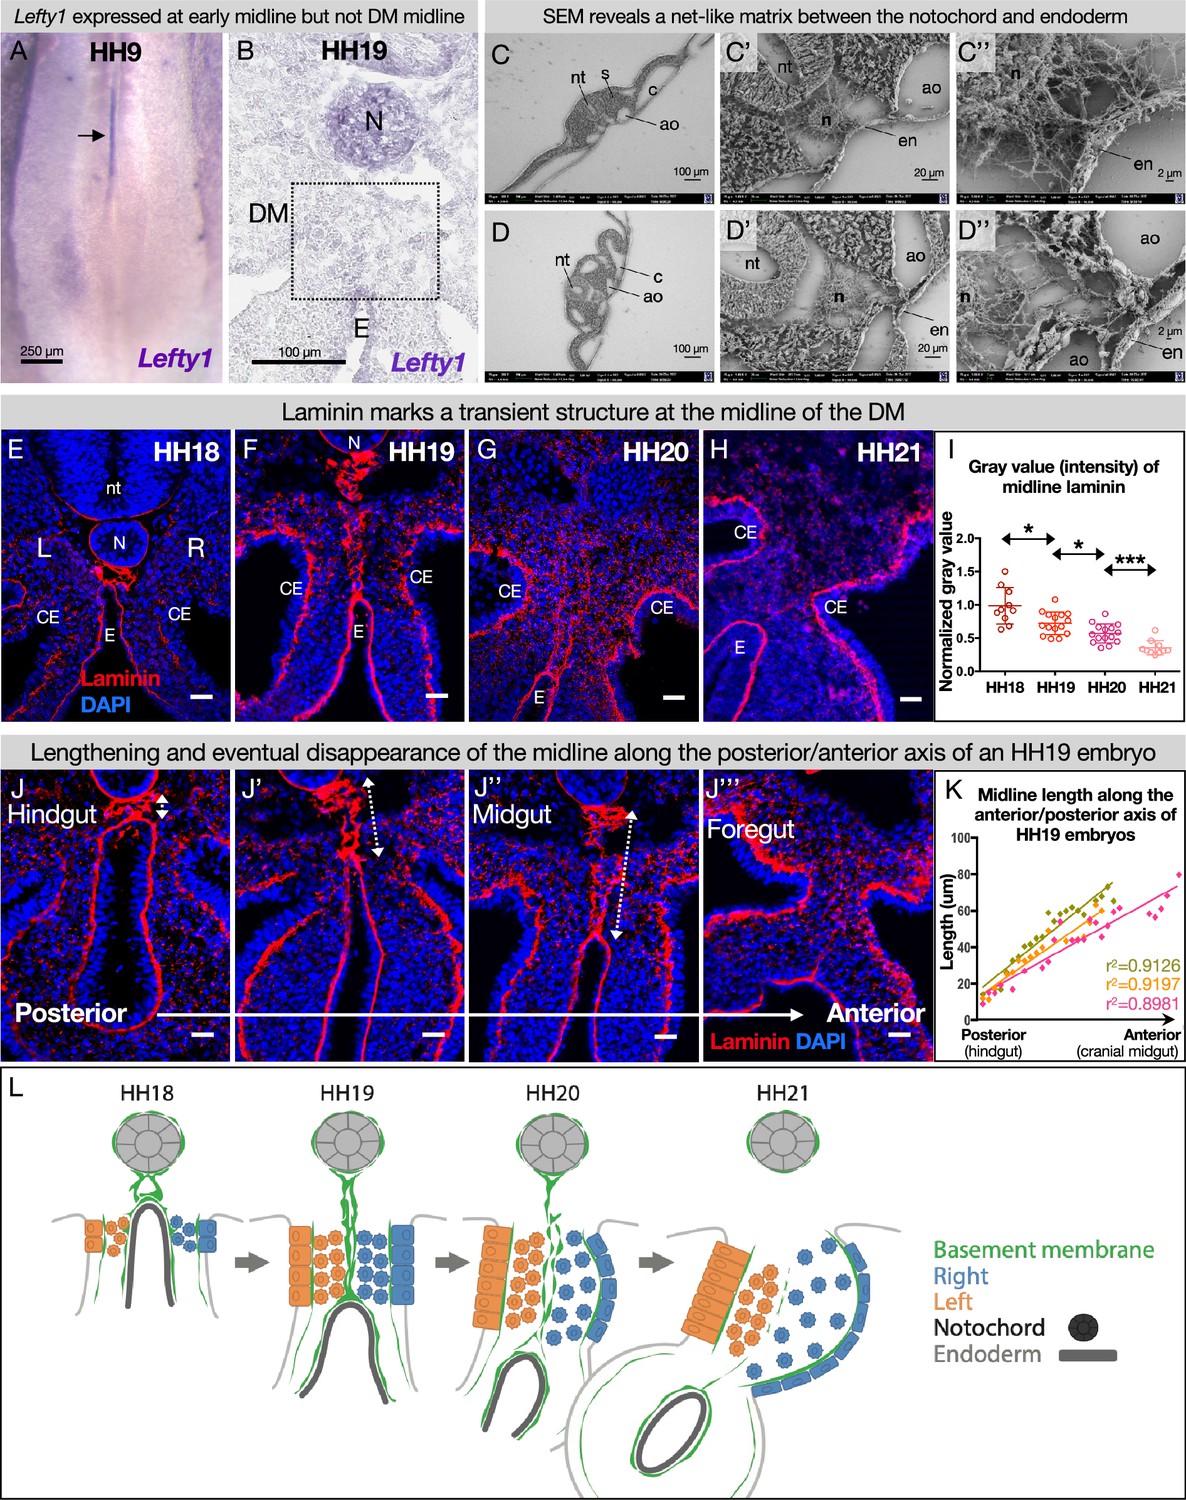
The dorsal mesentery (DM) midline is marked by laminin immunofluorescence.
(A) Lefty1 expression is seen at the embryonic midline of this Hamburger-Hamilton stage 9 (HH9) embryo n=4 (arrow). (B) Lefty1 expression is not seen at the midline of the DM (dashed box) of an HH19 embryo (n=4) (notochord = positive control). (C, D) Scanning electron microscopy (SEM) images of a fixed embryo at HH15–16 show fibrous extracellular matrix (ECM) between the notochord and endoderm. (C) is from a more posterior axial level than (D). (E–H) Time course of midline dynamics from HH18–21, marked by laminin. Scale bars = 25 µm. (I) Quantification of the intensity of laminin immunofluorescence over development, normalized to laminin staining around the neural tube. Biological replicates: HH18 n=2, HH19 n=3, HH20 n=3, and HH21 n=2. Each dot represents one image quantified. Statistical analyses are unpaired Welch’s t-tests. HH18–19: p=0.0188, HH19–20: p=0.0118, HH20–21: p=0.0003. Additionally, there is a significant (p<0.0001) linear trend among the means from HH18 to HH21 with a slope of –0.1019, r2=0.5906. (J) Midline appearance from hindgut to foregut in an HH19 embryo, marked by laminin. Scale bars = 25 μm. (K) Quantification of DM midline length (dashed line) of three HH19 embryos, from the separation of the notochord and endoderm (hindgut) to the fusion of the aortae (foregut, coinciding with midline fragmentation). (L) Model of DM midline time kinetics. N = notochord, E/en = endoderm, Ao = aorta, nt = neural tube, c=coelomic cavity, CE = coelomic epithelium, L = left, R = right.
-
Figure 3—source data 1
Summary table of embryo stages, statistical testing, and graph data for laminin intensity and midline length in Figure 3.
- https://cdn.elifesciences.org/articles/89494/elife-89494-fig3-data1-v1.xlsx
Figure 3—figure supplement 1
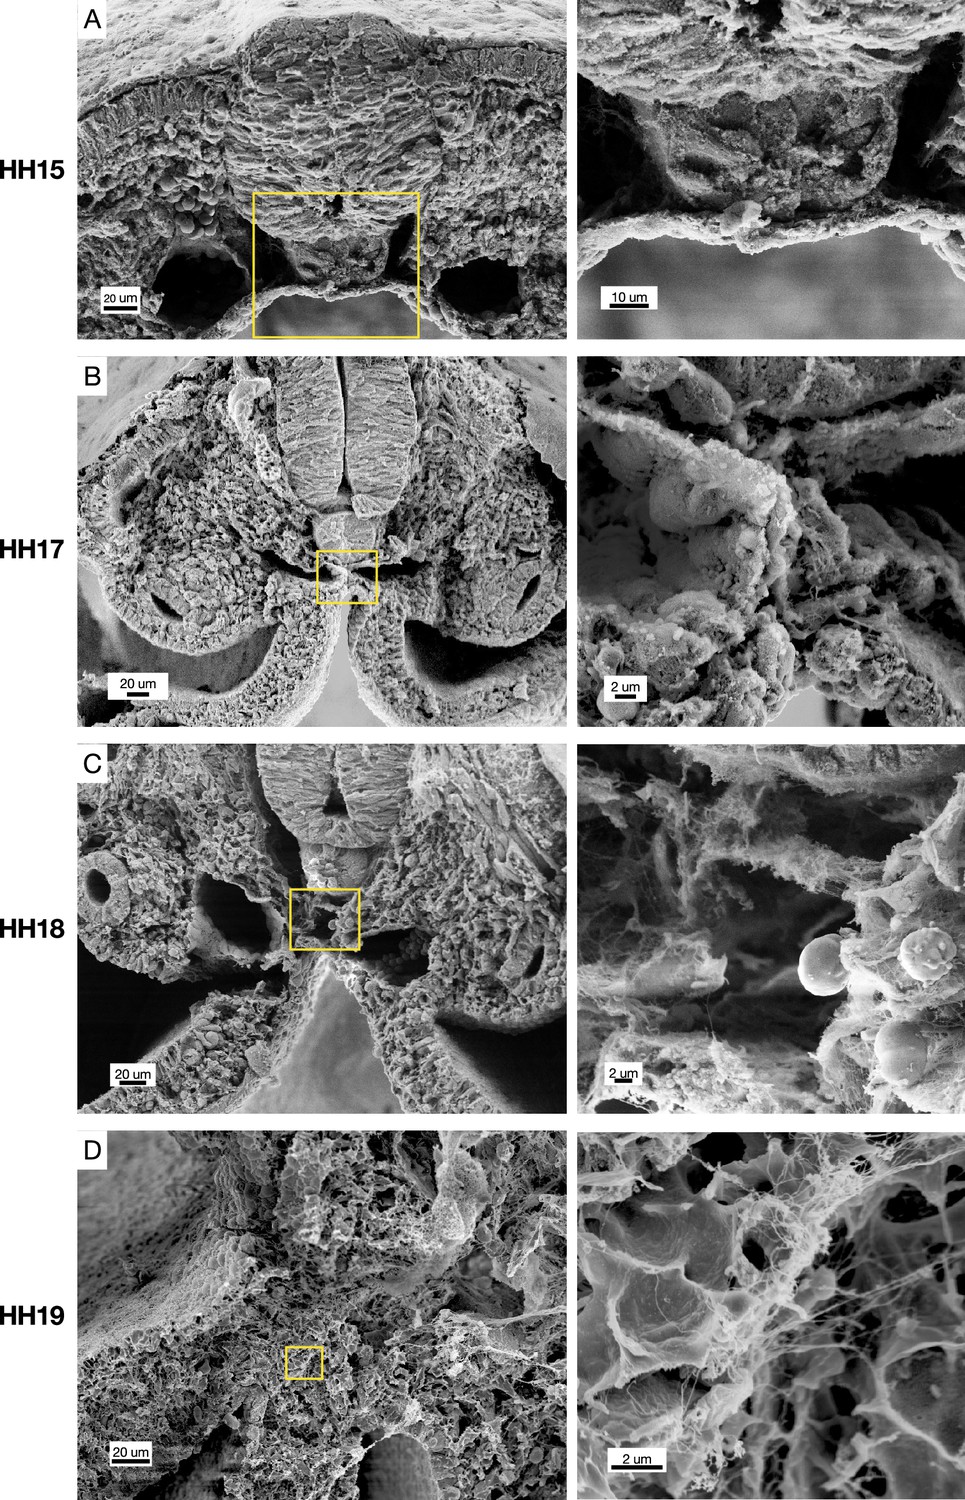
Scanning electron microscopy (SEM) of cross-sections of chicken embryos at different stages of midline development.
Hamburger-Hamilton stage 15 (HH15) n=2, HH17 n=2, HH18 n=3, HH19 n=3. Yellow boxes indicate position of higher magnification images on right.
Figure 3—figure supplement 2
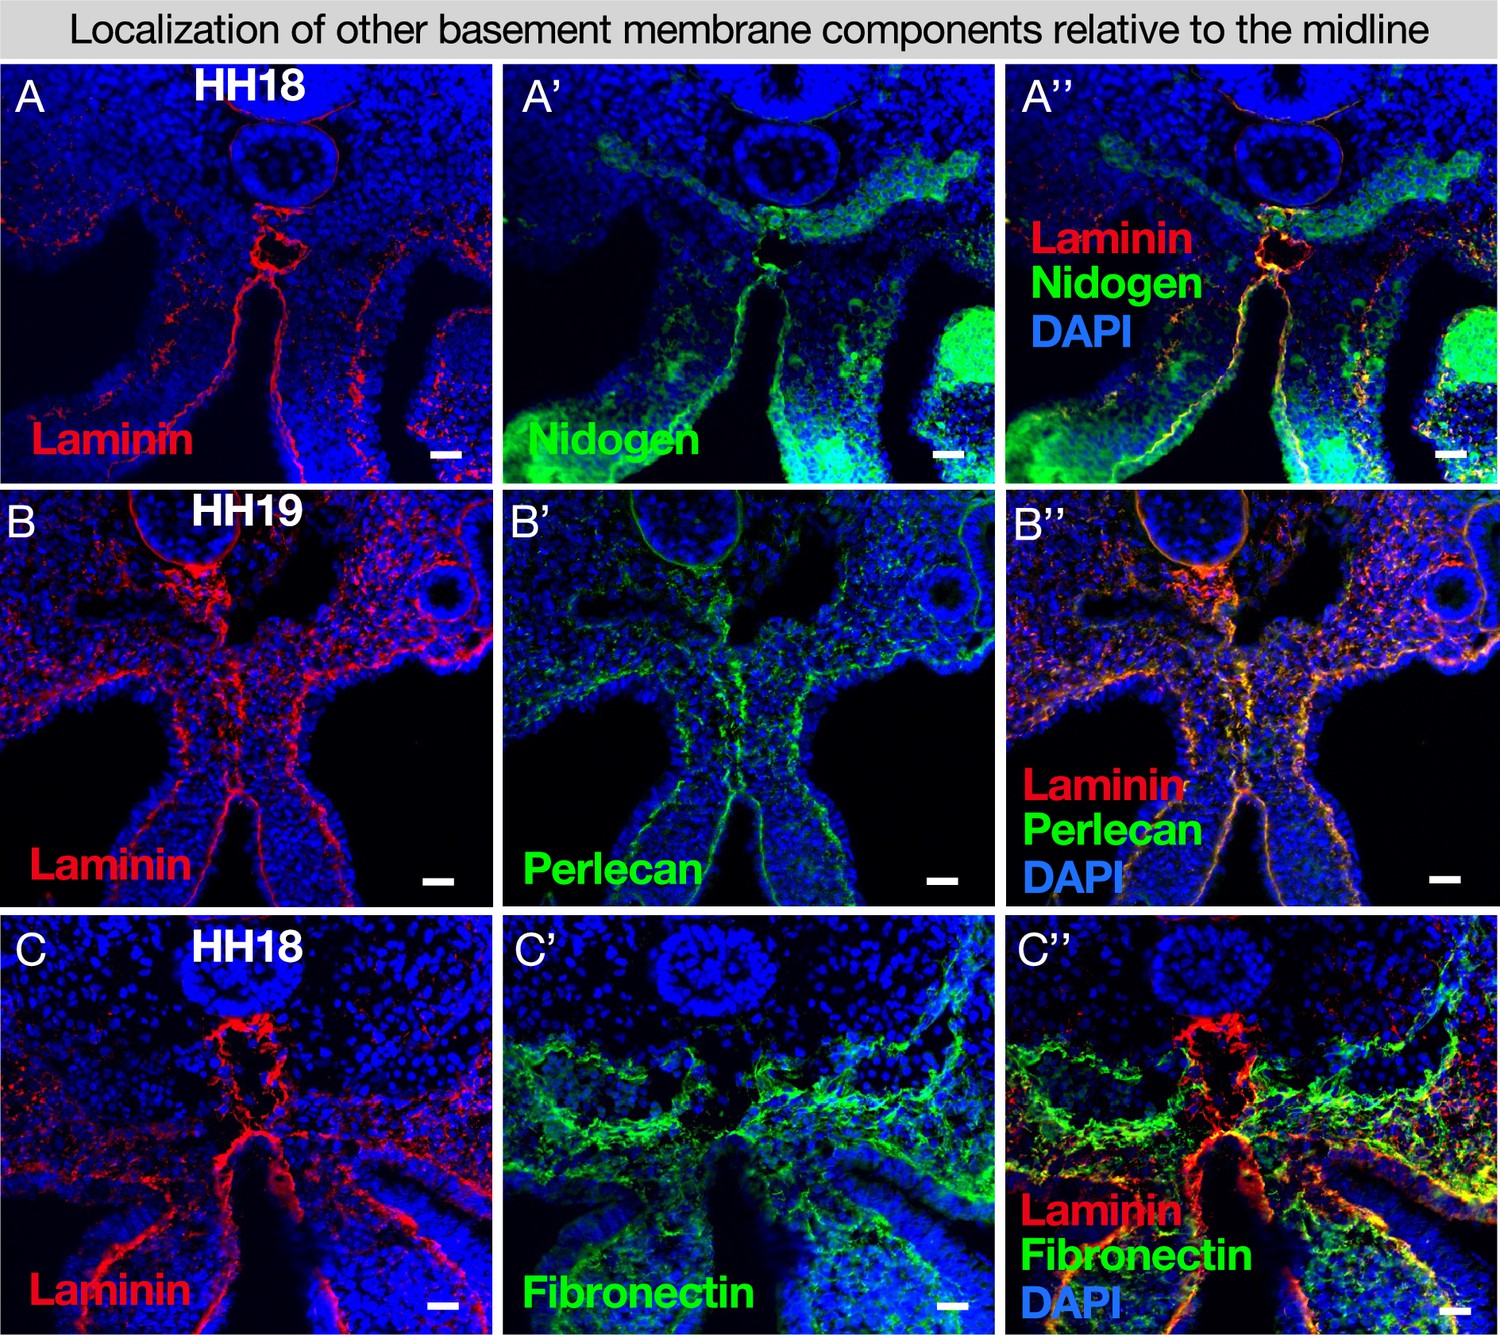
The required basement membrane components nidogen and perlecan co-localize with laminin at the midline.
(A) Nidogen co-localizes with laminin at the midline n=4. (B) Perlecan co-localizes with laminin at the midline n=4. (C) Fibronectin surrounds the dorsal aortae and is only found in the midline nearest the endoderm n=6. Scale bars = 25 μm.
Figure 3—figure supplement 3
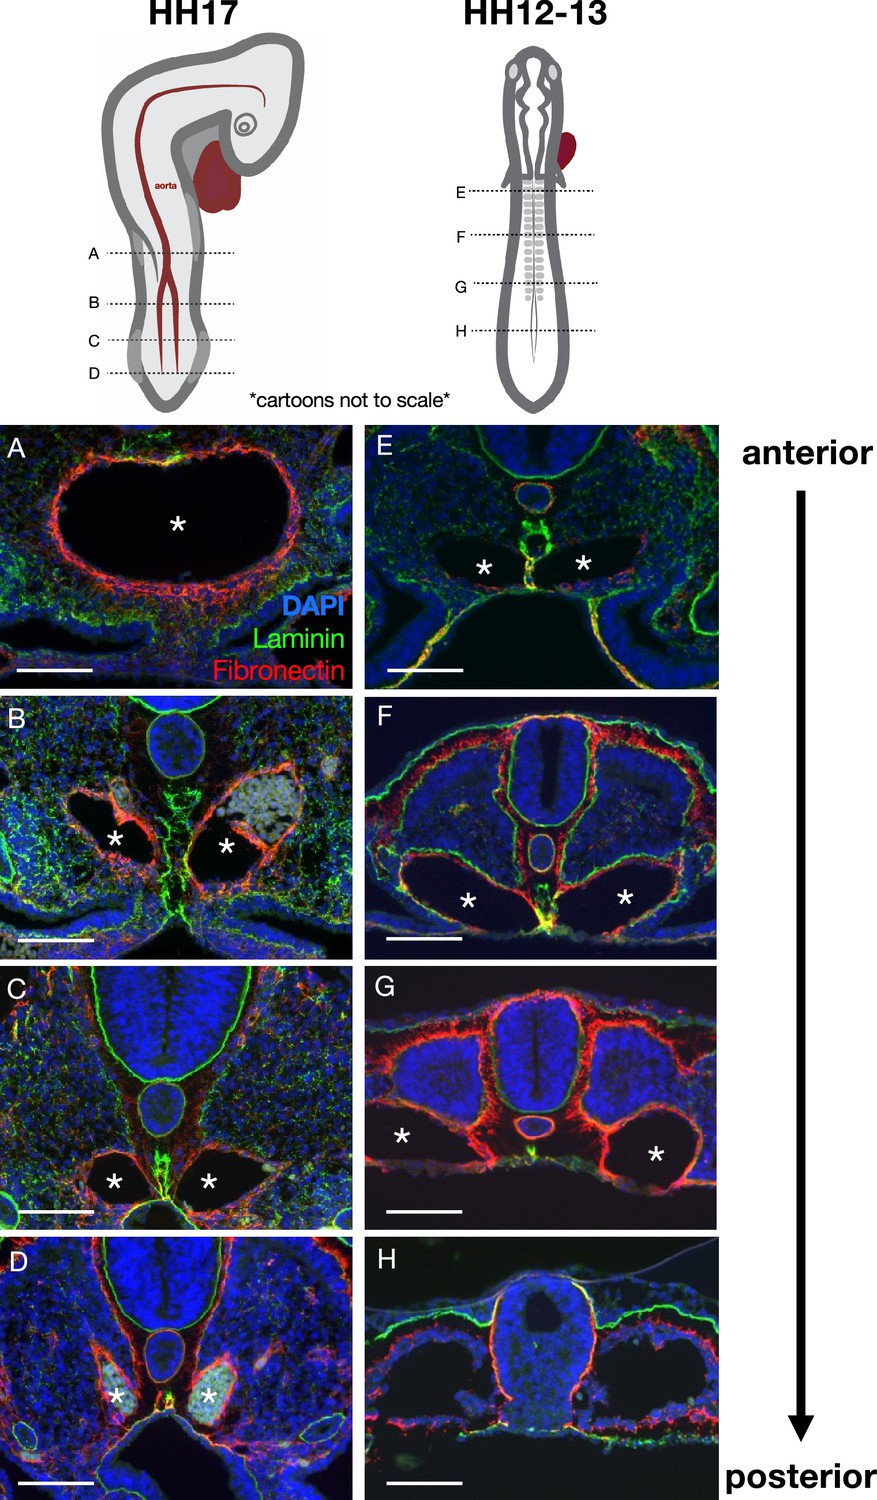
Pseudotime kinetics of the midline along the anterior-posterior axis.
(A–D) Laminin (green) and fibronectin (red) highlight the midline and aorta/e, respectively, in this Hamburger-Hamilton stage 17 (HH17) embryo. The maturation of the midline occurs in an anterior-to-posterior wave (from A to D), as does the fusing of the two branches of the aorta into one (A–D, asterisks). Immunohistochemistry images were taken at approximately the axial level shown in the above cartoon (cartoons not to scale). Notice that the midline at a more anterior position in a younger HH12–13 (E–H) embryo appears similar to the midline at a more posterior position in an older embryo. Scale bars = 100 μm.
Figure 3—figure supplement 4
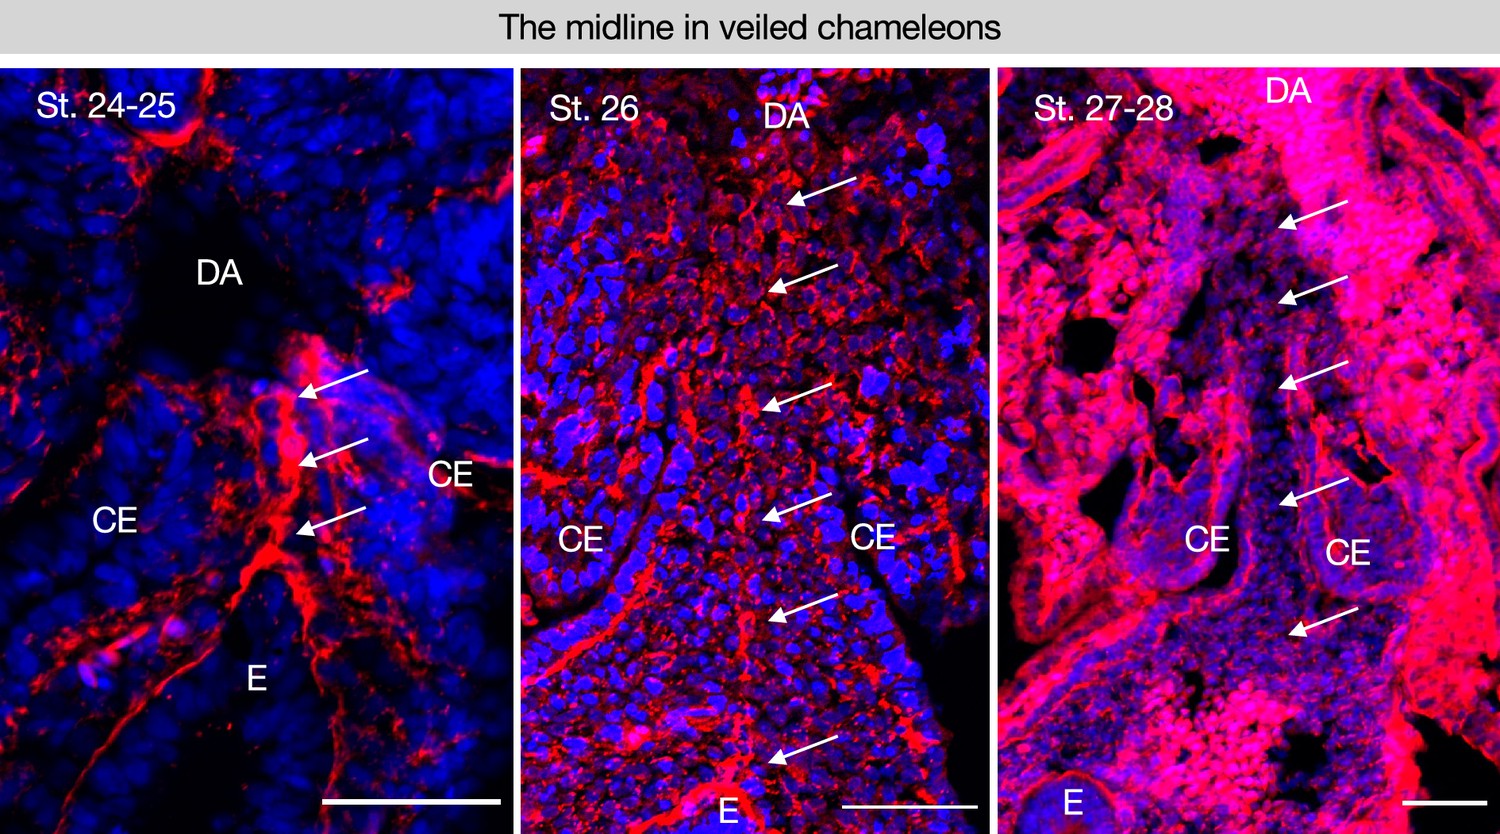
The midline is conserved in a squamate and follows a similar trajectory of degradation.
(A–C) Stages 24–25 n=10; 26–28 n=9 of veiled chameleon embryos, Chamaeleo calyptratus by somite stage as shown in Diaz et al., 2019. Scale bars = 50 μm. GT = gut tube, DM = dorsal mesentery, E=endoderm, DA = dorsal aorta.
Figure 4 with 1 supplement
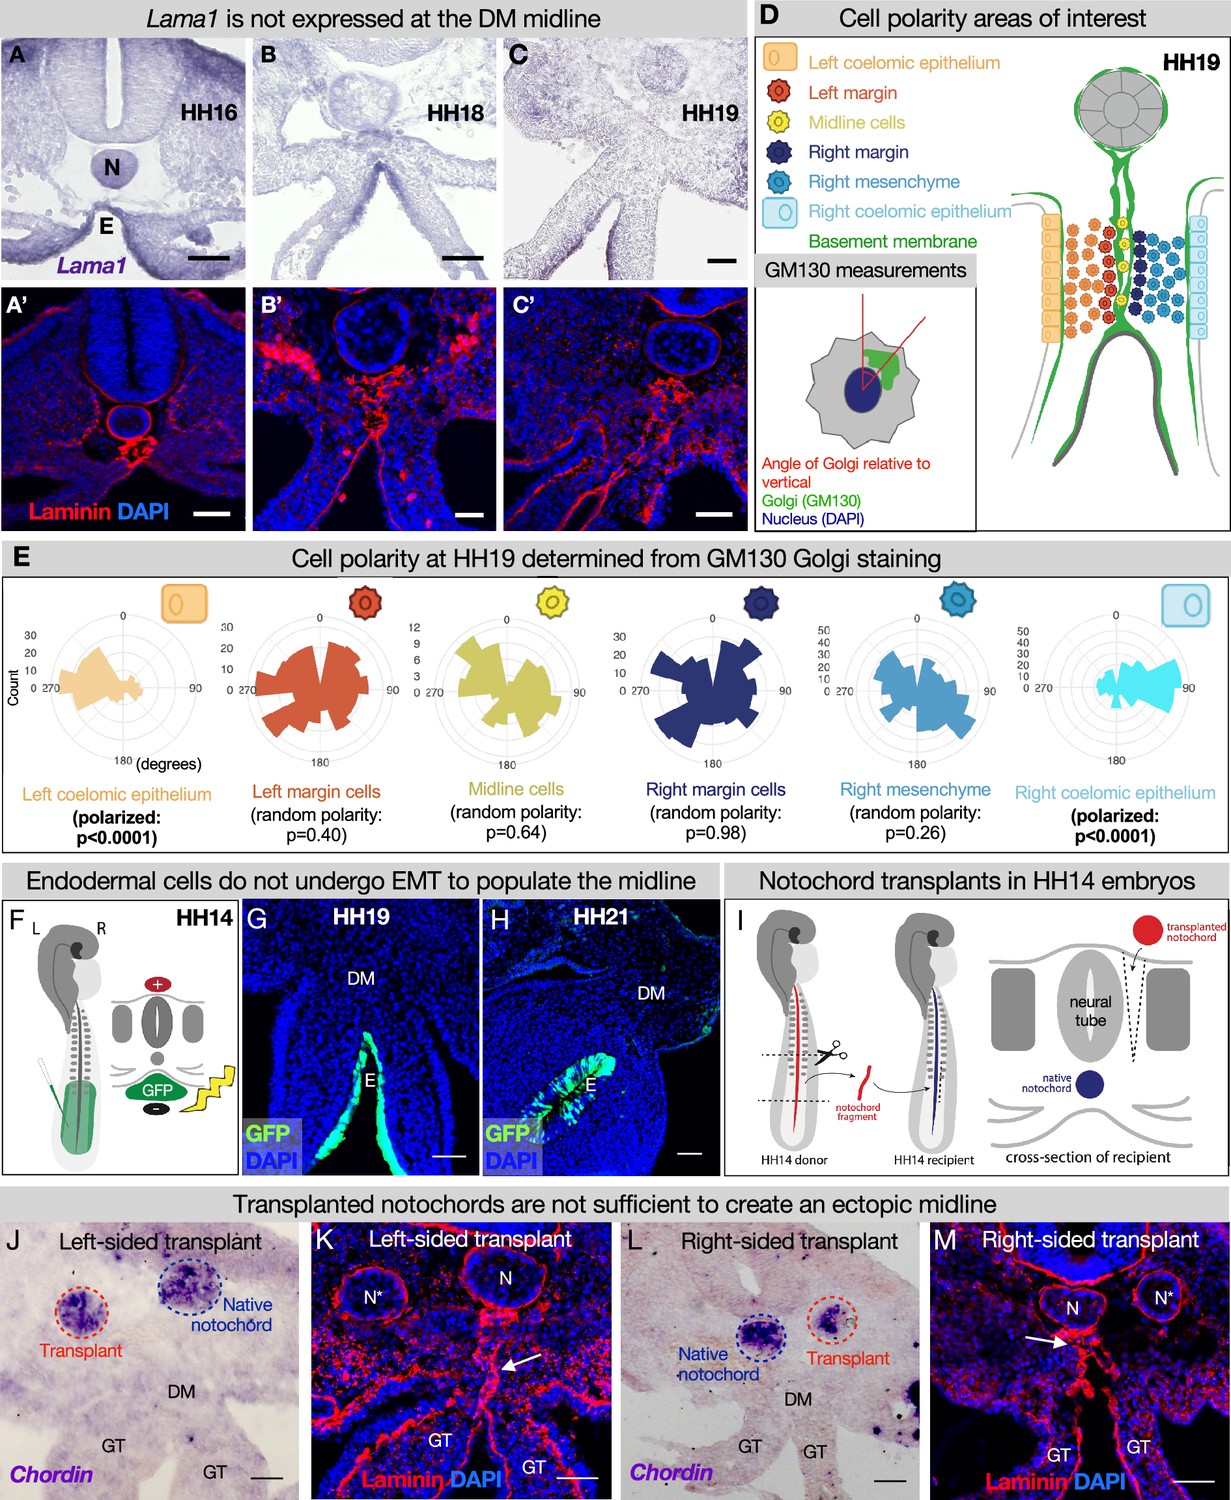
The midline basement membrane is not made by the DM mesenchyme or epithelial-to-mesenchymal transition (EMT) of the endoderm, and the notochord is not sufficient for midline formation.
(A–C) Lama1 RNA in situ hybridization and adjacent sections with laminin immunofluorescence (IF) staining at Hamburger-Hamilton stage 16 (HH16) n=3, HH18 n=9, and HH19 n=10 (A’–C’). Scale bars = 50 μm. (D, E) Cell polarity analysis from GM130 staining shows that the mesenchymal cells immediately to the left or right of the midline (‘left/right margin’) and within the double membrane (‘midline cells’) have random polarity, as do the cells of the right mesenchyme (random polarization control), in contrast to the strong apical-basal polarity in cells of the left coelomic epithelium. Five embryos were used for these quantifications. Number of cells per circle histogram: left coelomic epithelium = 209, left margin = 346, midline cells = 118, right margin = 413, right mesenchyme = 514, right coelomic epithelium = 295. (F) Electroporation mix containing pCAGEN-GFP plasmid was injected under an HH14/15 embryo and then electroporated to specifically target the endoderm. Lineage tracing endoderm-derived cells to HH19 n=8 (G) and HH21 n=2 (H) by pCAGEN-GFP electroporation of the endoderm. (I) Model of notochord transplant method. A piece of notochord (red) was isolated from an HH14 donor embryo. In a stage-matched recipient, a cut was made adjacent to the neural tube and the donor notochord was inserted into this slit. (J, L) RNA in situ hybridization for Chordin to mark the native notochord (blue dashed circle) and transplanted notochord (red dashed circle). (K, M) Laminin immunohistochemistry to mark basement membrane including the midline (white arrow). Notochords are marked with an N (native notochord) and N* (transplanted notochord). (J, K) are from the same embryo, as are (L, M). n=8, scale bars = 50 μm. GT = gut tube, DM = dorsal mesentery, E=endoderm.
-
Figure 4—source data 1
Summary table of embryo stages, statistical testing, and graph data for cell polarity in Figure 4.
- https://cdn.elifesciences.org/articles/89494/elife-89494-fig4-data1-v1.xlsx
Figure 4—figure supplement 1
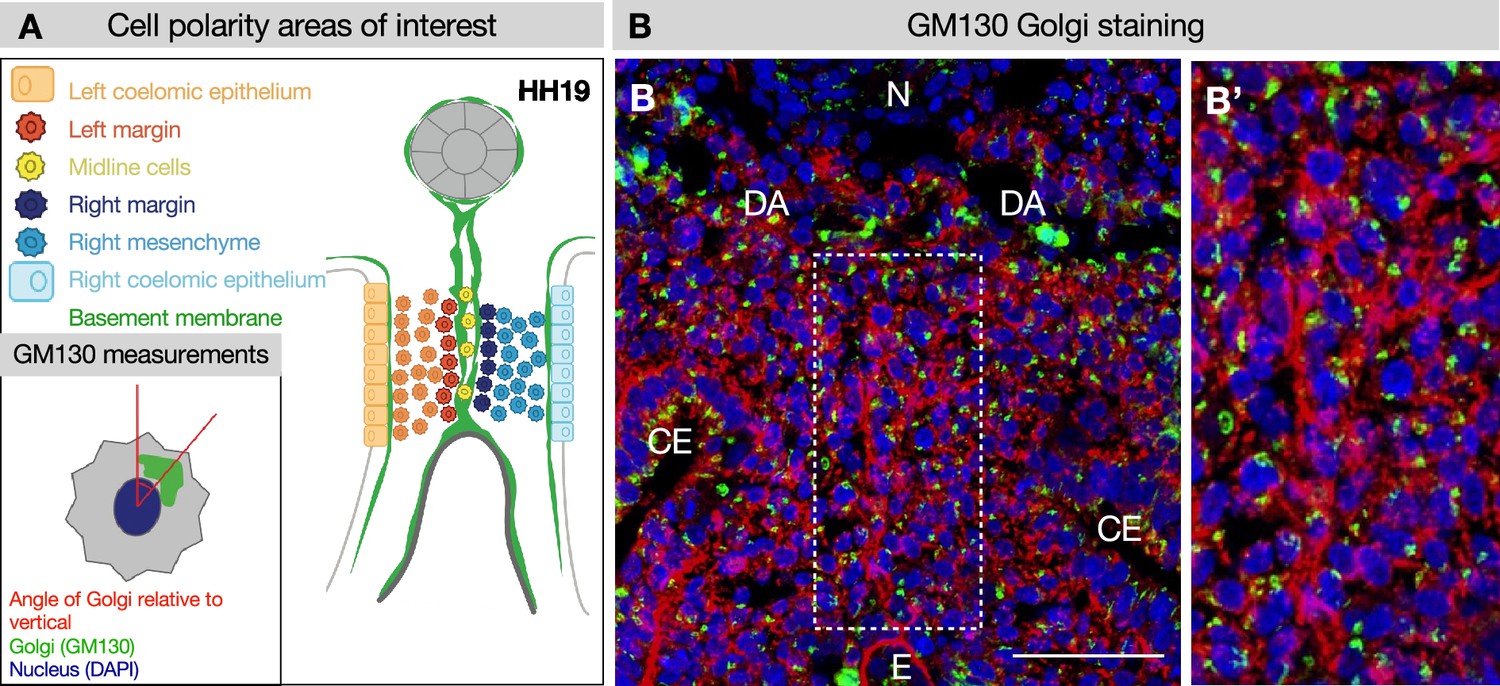
GM130 staining for polarity analysis.
(A, B) Example of GM130 staining at Hamburger-Hamilton stage 19 (HH19) used for cell polarity analysis in Figure 4, with key. (B’) Dotted region of interest in B is magnified. Five embryos were used for these quantifications. Scale bars = 50 μm. CE = coelomic epithelium, DA = dorsal aorta, E = endoderm, N = notochord.
Figure 5
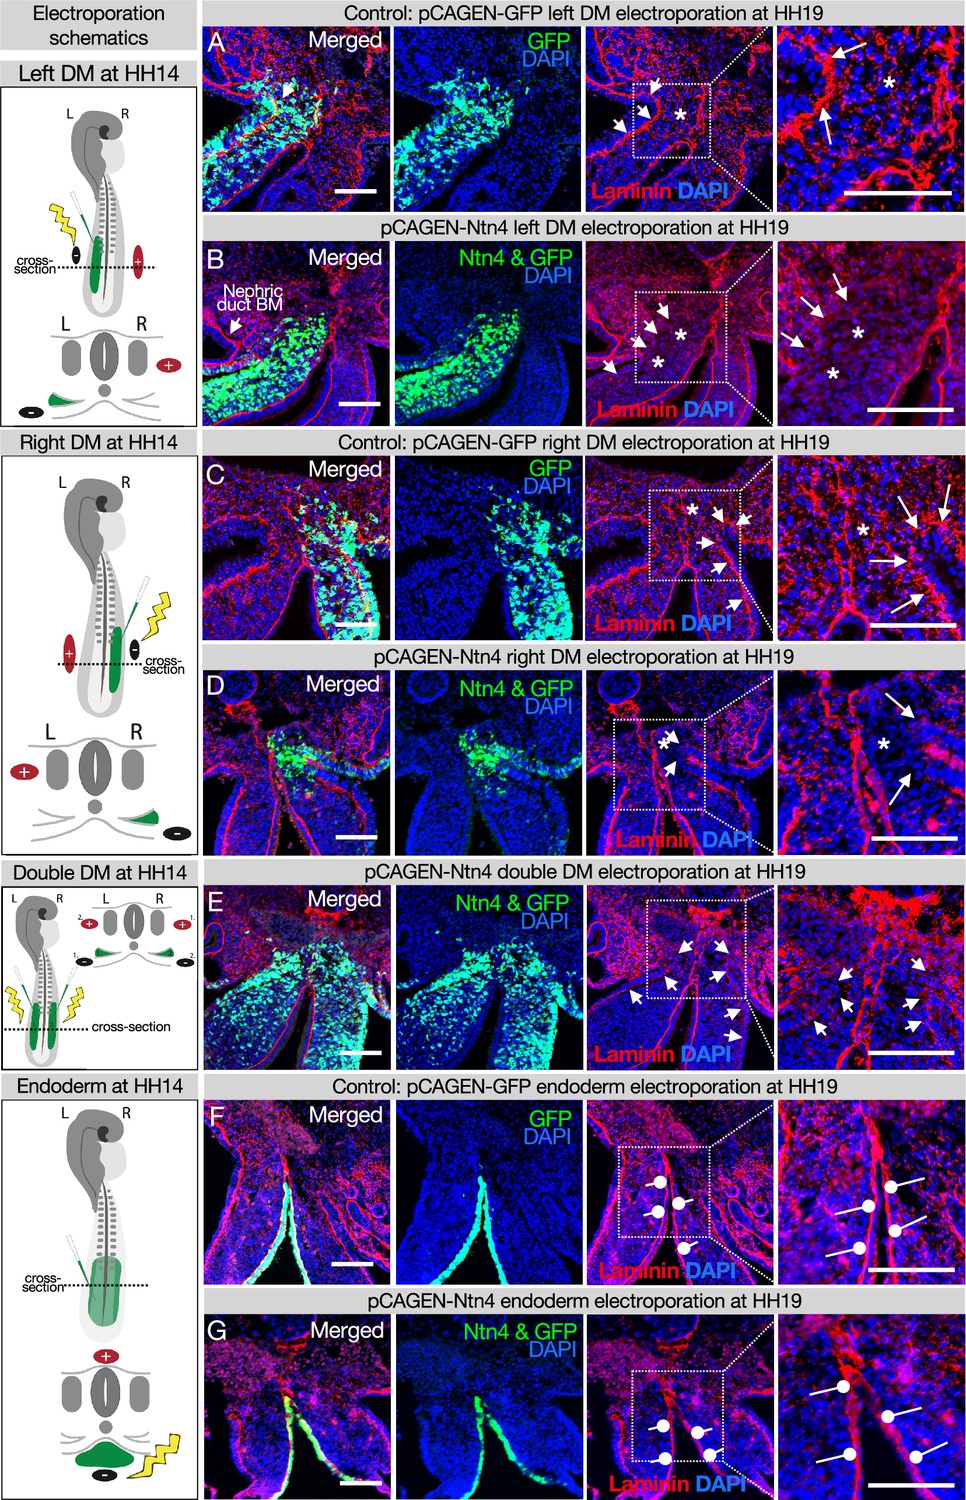
Ectopic expression of Netrinn4 by electroporation visibly affects the basement membrane underlying the coelomic epithelium, but not that underlying the endoderm, or the midline.
(A, C) Electroporation of the left (A) or right (C) dorsal mesentery (DM) with the control, pCAG-GFP, had no effect on the basement membrane of the coelomic epithelium (arrows). Left n=6. Right n=4. (B, D) Electroporation of mouse Netrin4 (pCAGEN-Ntn4) and pCAG-GFP into the left (B) or right (D) DM disrupted the basement membrane underlying the coelomic epithelium (arrows) and scattered basement membrane in the mesenchyme (asterisks). Left n=5. Right n=5. The intact laminin staining in B is the basement membrane (BM) of the nephric duct. (E) Double DM electroporations also disrupt the coelomic epithelium (arrows) but the midline appears intact despite being contacted by Ntn4+ cells (n=3). (F, G) Electroporation of the endoderm directly with pCAG-GFP or pCAGEN-Ntn4 does not visibly affect the basement membrane underlying the endoderm (open round pointers). Control n=5. Ntn4 n=8. The midline appears unaffected by any of these perturbations. Scale bars = 100 μm.
Figure 6
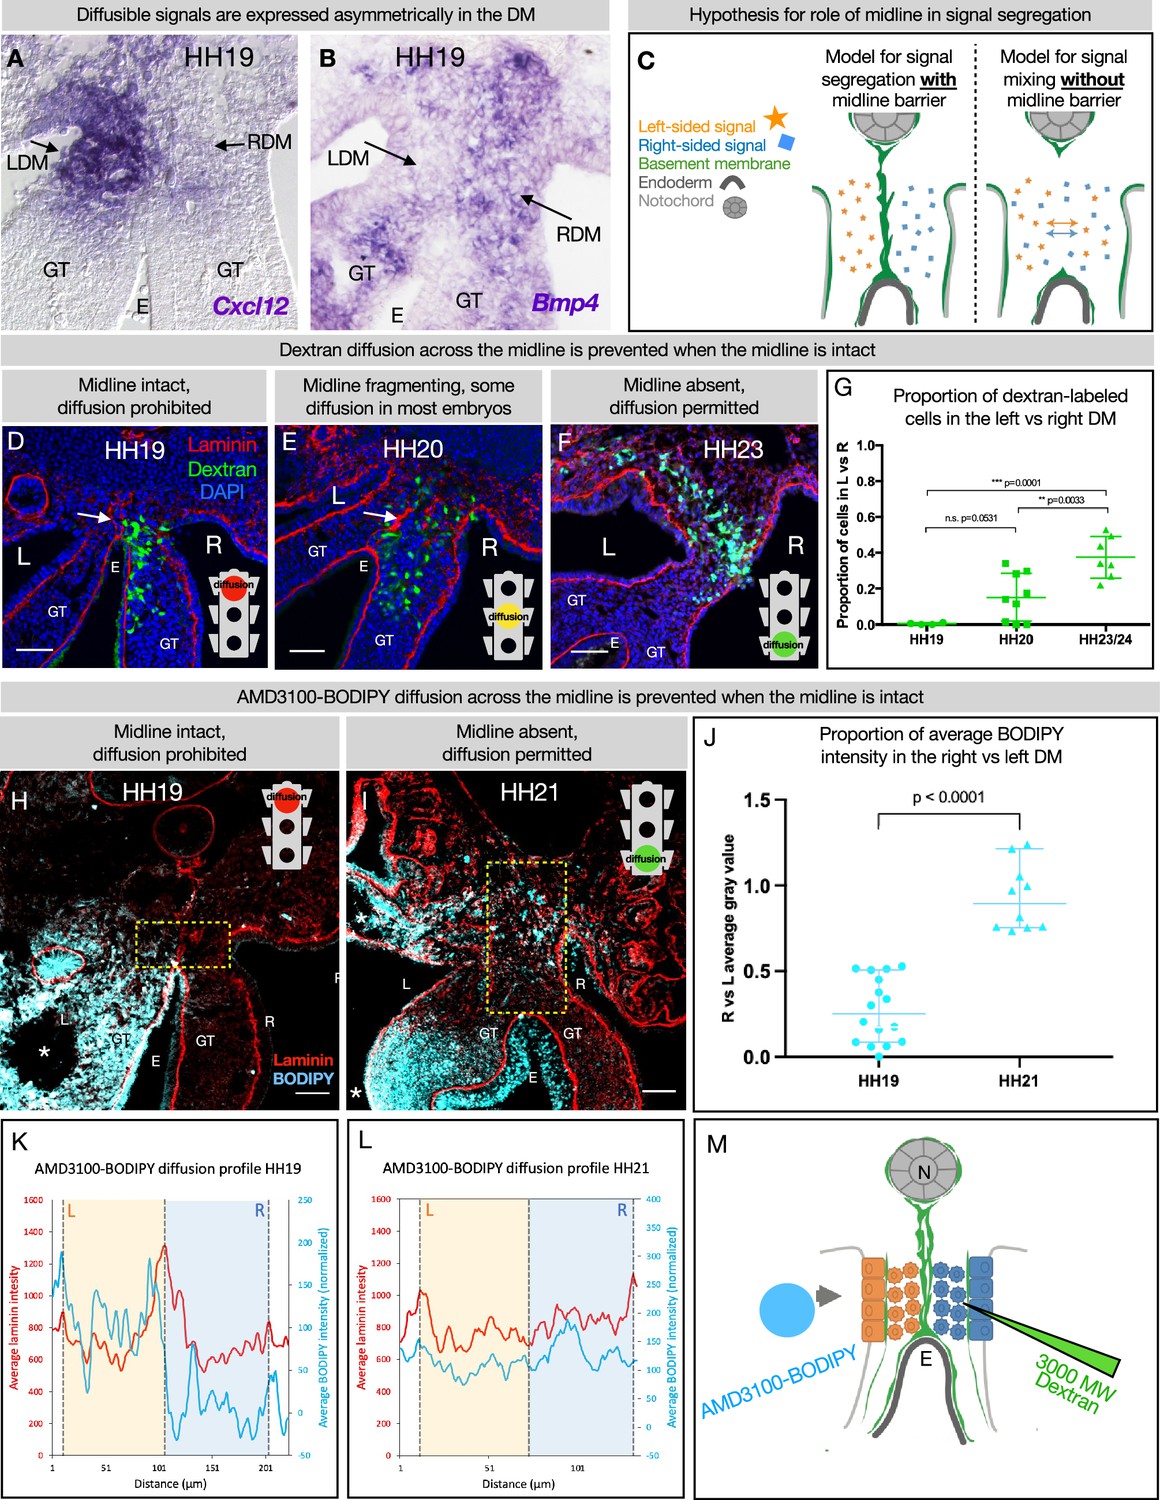
The dorsal mesentery (DM) midline serves as a barrier against diffusion.
(A, B) Genes encoding diffusible signals including Cxcl12 and Bmp4 are expressed asymmetrically in the DM at Hamburger-Hamilton stage 19 (HH19). (C) Hypothesis for the role of the midline in limiting diffusion of left and right signals across DM. (D) At HH19, the midline is intact (white arrow) and diffusion of 3000 MW dextran (green) is limited to the right side (n=4/4). (E) At HH20, the midline (white arrow) has begun to fragment. Diffusion across the midline is prohibited in some embryos (n=2/9) but permitted in others (n=7/9). (F) At later stages when the midline has disappeared, diffusion is allowed through the DM (n=7/7). (G) Proportion of dextran-labeled cells in the left vs. right DM, with unpaired t-test. (H) At HH19, the midline is intact and diffusion of AMD3100-BODIPY is limited to the left side (n=4). Dashed yellow box indicates quantified area. (I) At HH21 when the midline has disappeared, diffusion is allowed through the DM (n=3). Dashed yellow box indicates quantified area. (J) Proportion of BODIPY intensity in the right vs. left DM, with unpaired t-test. Each dot represents one image quantified. (K, L) Profile plot of average BODIPY intensity across the DM within the dashed yellow boxes in H and I, with left and right compartments of the DM overlayed. (M) Schematic of dextran injections into the right DM and AMD3100-BODIPY beading into the left DM. Scale bars = 50 µm. LDM = left dorsal mesentery. RDM = right dorsal mesentery. GT = gut tube. E = endoderm. L=left. R=right. N=notochord. DA = dorsal aorta.
-
Figure 6—source data 1
Summary table of embryo stages, statistical testing, and graph data for dextran and BODIPY diffusion in Figure 6.
- https://cdn.elifesciences.org/articles/89494/elife-89494-fig6-data1-v1.xlsx
Figure 7
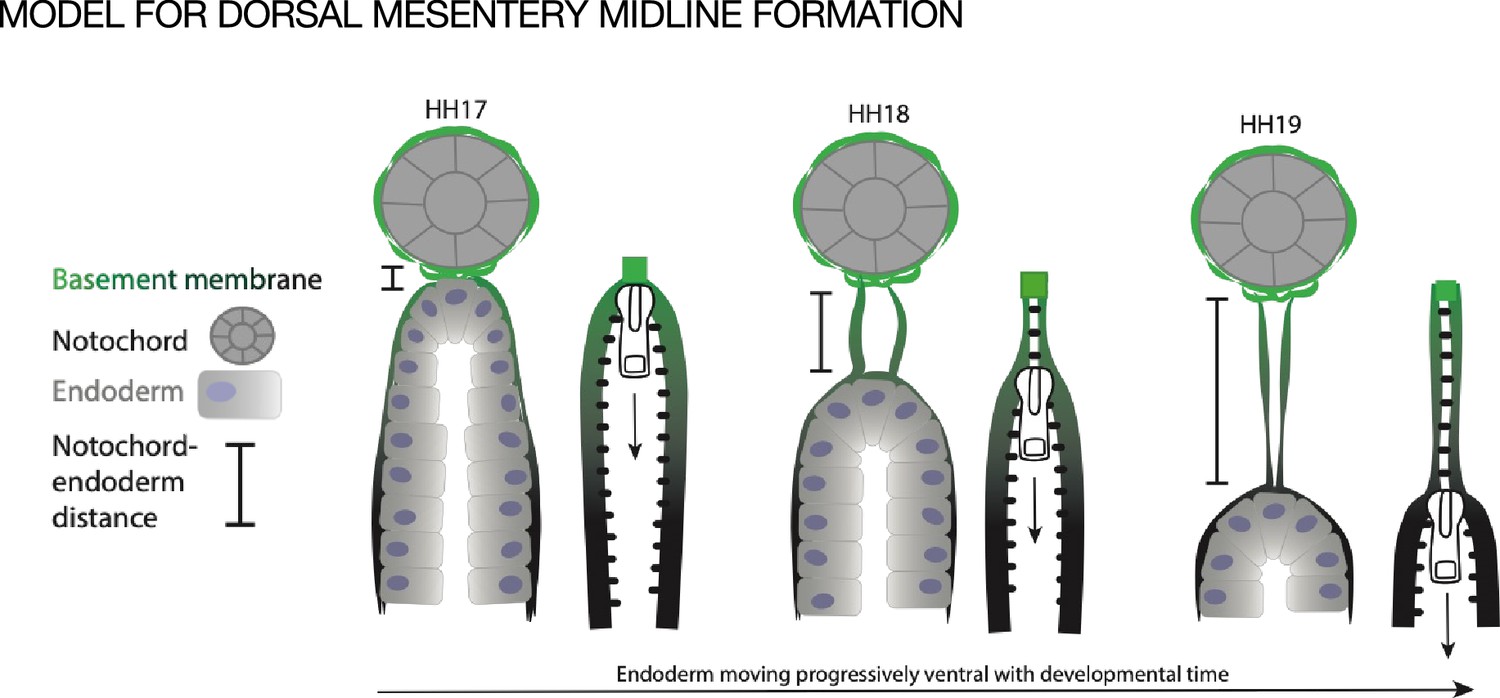
Model of endoderm descending hypothesis for midline formation.
We hypothesize that as the endoderm moves ventrally and the distance between the notochord and endoderm grows, basement membrane from the endoderm may be left behind. This can be compared to a zipper where each side is the basement membrane underlying the endoderm, and when the zipper pull (tip of endoderm) moves downward, the basement membrane behind it pulls closer together.
Author response image 1
Author response image 2

Author response image 3

Author response image 4

Tables
Key resources table
| Reagent type (species) or resource | Designation | Source or reference | Identifiers | Additional information |
|---|---|---|---|---|
| Antibody | Anti-laminin alpha 1 rabbit polyclonal (1° ab) | Sigma | L9393 | 1:100 |
| Antibody | Anti-laminin 1 mouse monoclonal (1° ab) | DSHB | 3H11 | 1:10 |
| Antibody | Anti-perlecan mouse monoclonal (1° ab) | DSHB | 5C9 | 1:10 |
| Antibody | Anti-nidogen mouse monoclonal (1° ab) | DSHB | 1G12 | 1:10 |
| Antibody | Anti-fibronectin mouse monoclonal (1° ab) | DSHB | VA1(3) | 1:5 |
| Antibody | Anti-fibronectin mouse monoclonal (1° ab) | DSHB | B3/D6 | 1:30 |
| Antibody | Anti-fibronectin rabbit polyclonal (1° ab) | Sigma | F3648 | 1:400 |
| Antibody | Anti-GM130 mouse monoclonal (1° ab) | BD Biosciences | 610822 | 1:250 |
| Antibody | Alexa Fluor 568 goat anti-rabbit (2° ab) | Invitrogen | A-11031 | 1:500 |
| Antibody | Alexa Fluor 647 donkey anti-rabbit (2° ab) | Invitrogen | A32795 | 1:500 |
| Antibody | Alexa Fluor 488 goat anti-mouse (2° ab) | Invitrogen | A32723 | 1:500 |
| Other | DAPI | Thermo Fisher | D1306 | 1:2000, nuclear DNA counterstain |
| Chemical compound, drug | Dextran, Fluorescein, 3000 MW, lysine fixable, anionic | Thermo Fisher | D3306 | |
| Chemical compound, drug | AMD3100-Bodipy | Poty et al., 2015 | 5 mg/ml | |
| Chemical compound, drug | CM-DiI | Invitrogen | C7000 | |
| Chemical compound, drug | SP-DiO | Invitrogen | D7778 | |
| Recombinant DNA reagent | Plasmid for chordin riboprobe (chicken) | Cliff Tabin lab | T691 | |
| Recombinant DNA reagent | Plasmid for lefty1 riboprobe (chicken) | Cepko/Tabin lab | T607 | |
| Recombinant DNA reagent | pCAGEN (plasmid) | Connie Cepko | RRID:Addgene_11160 | |
| Recombinant DNA reagent | pCAG-GFP (plasmid) | Connie Cepko | RRID:Addgene_11150 | |
| Recombinant DNA reagent | pCI-H2B-RFP (plasmid) | Addgene | RRID:Addgene_92398 | |
| Recombinant DNA reagent | Ntn4-AP-His (plasmid) | Addgene | RRID:Addgene_71980 | |
| Sequence-based reagent | F primer for chicken LAMA1 riboprobe from cDNA | This paper | ACGGAGAGTTTGGCAGATGA | |
| Sequence-based reagent | R primer for chicken LAMA1 riboprobe from cDNA | This paper | ATCCTGAGCCCAAATCCCAA | |
| Sequence-based reagent | 5’ primer for cloning Ntn4 coding region out of RRID:Addgene_71980 and into pCAGEN (XhoI and NotI) | This paper | ATGCCTCGAGATATCgccaccatggggagctg | |
| Sequence-based reagent | 3’ primer for cloning Ntn4 coding region out of RRID:Addgene_71980 and into pCAGEN (XhoI and NotI) | This paper | CTAGCGGCCGCGGATCCATCGATTATTA CACGCAGTCTCTTTTTAAGATGTGCA | |
| Commercial assay or kit | PCR cloning kit (with pDrive plasmid) | QIAGEN | 231124 | |
| Other | Fertilized chicken eggs | Westwind Farms (Interlaken, NY, USA, http://chickenhawkfood.com). | Eggs used for embryo manipulation and collection as described in Materials and methods | |
| Other | Veiled chameleon eggs | Reptiles and Aquatics Facility at Stowers Institute for Medical Research | Eggs used for embryo manipulation and collection as described in Materials and methods | |
| Other | AG beads | Bio-Rad | 143-1255 | Resin beads for surgical implantation and drug diffusion as described in Materials and methods |
Additional files
Download links
A two-part list of links to download the article, or parts of the article, in various formats.
Downloads (link to download the article as PDF)
Open citations (links to open the citations from this article in various online reference manager services)
Cite this article (links to download the citations from this article in formats compatible with various reference manager tools)
An atypical basement membrane forms a midline barrier during left-right asymmetric gut development in the chicken embryo
eLife 12:RP89494.
https://doi.org/10.7554/eLife.89494.3


