Basolateral amygdala oscillations enable fear learning in a biophysical model
- Department of Mathematics and Statistics, Boston University, United States
- Department of Biology, University of Southern California, United States
Figures
Figure 1
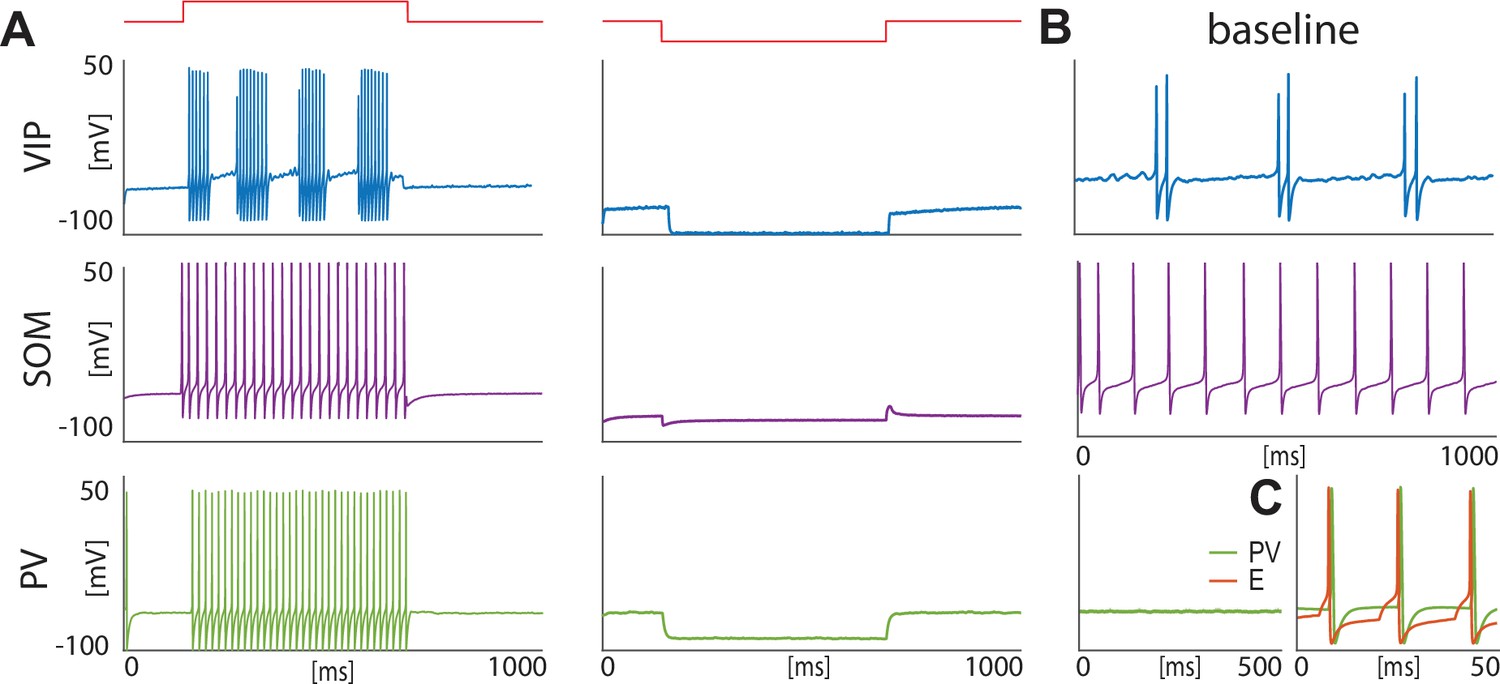
Isolated neurons produce fundamental rhythms.
(A) dynamics in response to depolarizing and hyperpolarizing currents mimic the electrophysiological behavior of BLA interneurons classified in Sosulina et al., 2010. (B) dynamics in the baseline condition. (C). Interacting PV and excitatory projection neuron (E) entrain in a pyramidal-interneuron network gamma rhythm (PING).
Figure 2
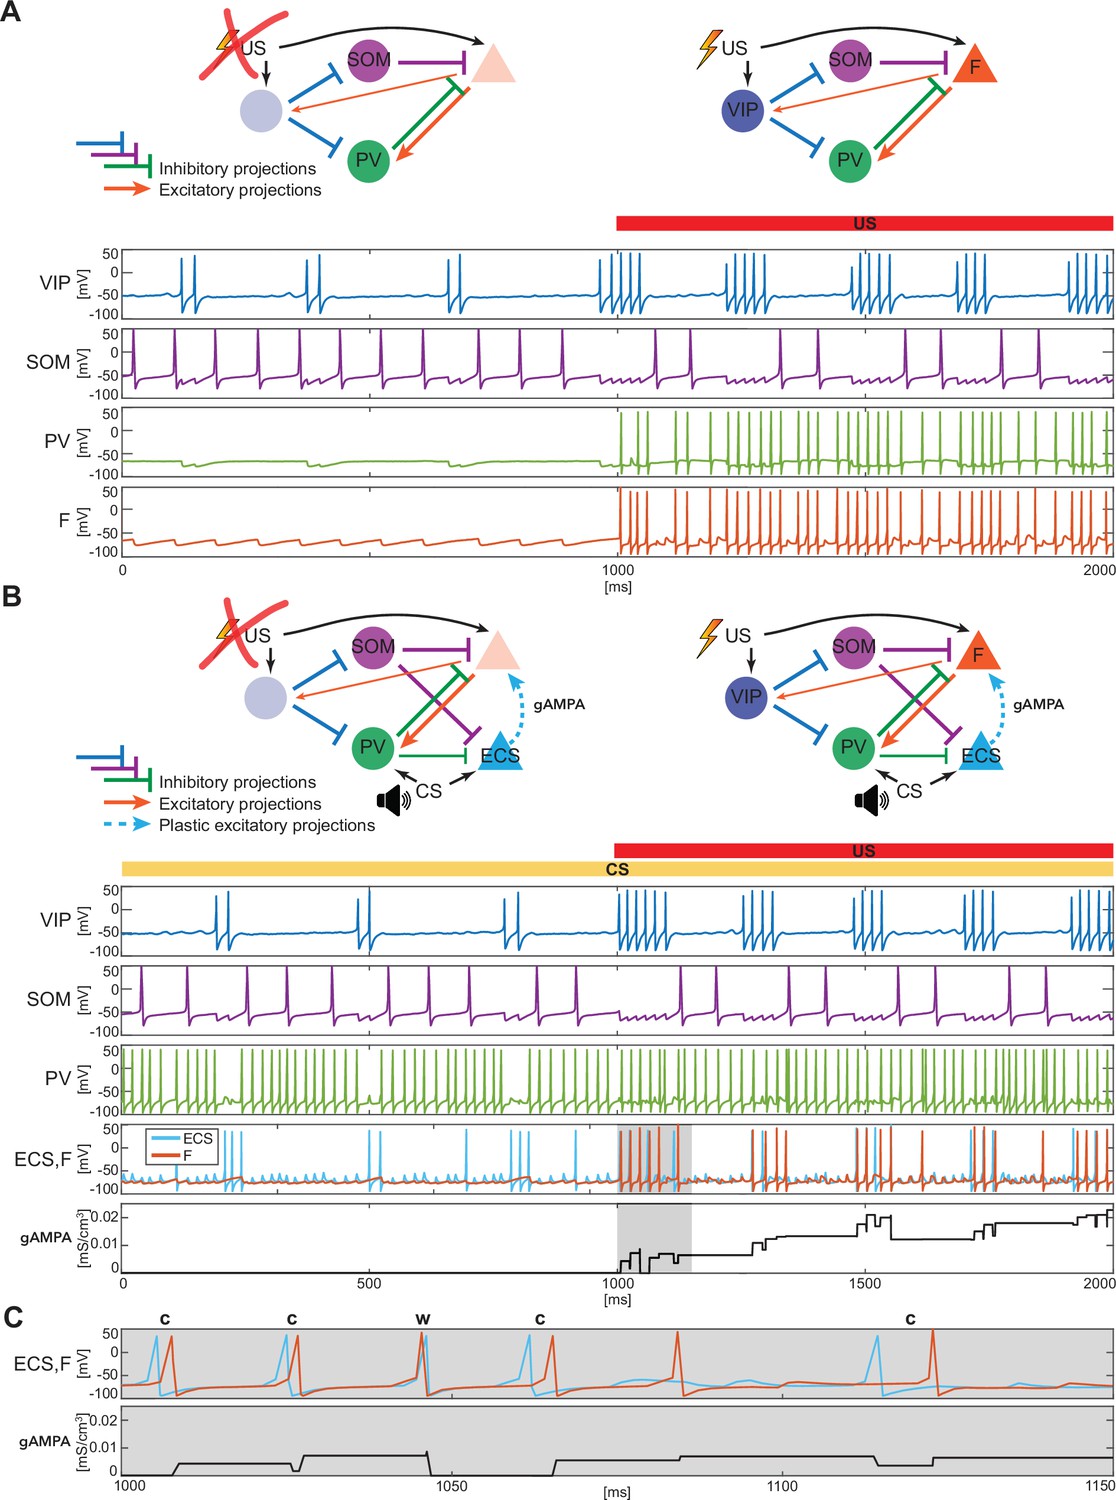
BLA interneurons and the excitatory projection neurons interact and modulate the network activity.
(A) (top): Network made of three interneurons (VIP, SOM, and PV) and the excitatory projection neuron encoding fear (F) without US input (left) and with US input (right). (A) (bottom): before the onset of US, VIP shows gamma bursts nested in the low theta rhythm (blue trace), and SOM fires at a natural frequency in the high theta range (purple trace). PV is completely silent due to the lack of any external input (green trace). (F) despite its natural frequency of around 11 Hz, is silent due to the inhibition from SOM (orange trace). After US onset, due to the longer VIP bursts and the US input, F shows a pronounced activity during the VIP active phase and outside when the SOM and PV inhibition fade. PV is active only when excited by F, and then gives inhibitory feedback to F. (B) (top): Network in panel A with the excitatory projection neuron encoding the CS input (ECS) during the CS presentation (left) and with paired CS and US inputs (right). (B) (bottom): 2 s dynamics of all the neurons in the BLA network affected by CS, and by US after 1 s has elapsed. As in panel A, VIP shows gamma bursting activity nested in the low theta frequency range with bursts duration affected by the presence or absence of US. VIP inhibits (i) SOM, which fires at high theta (purple trace) regardless of the external inputs, and (ii) PV, which fires at gamma. ECS (light blue trace) and F are both active when both CS and US are present and VIP is active, producing a gamma nested into a low theta rhythm. The evolution in time of the conductance (gAMPA) shows an overall potentiation over the second half of the dynamics when both ECS and F are active. (C): blowup of ECS-F burst of activity and gAMPA dynamic shown in the gray area in panel B (bottom); ECS (blue trace) fires most of the time right before F, thus creating the correct pre-post timing conducive for potentiation of the ECS to F conductance. The order of each pair of ECS-F spikes is labeled with ‘c’ (correct) or ‘w’ (wrong).
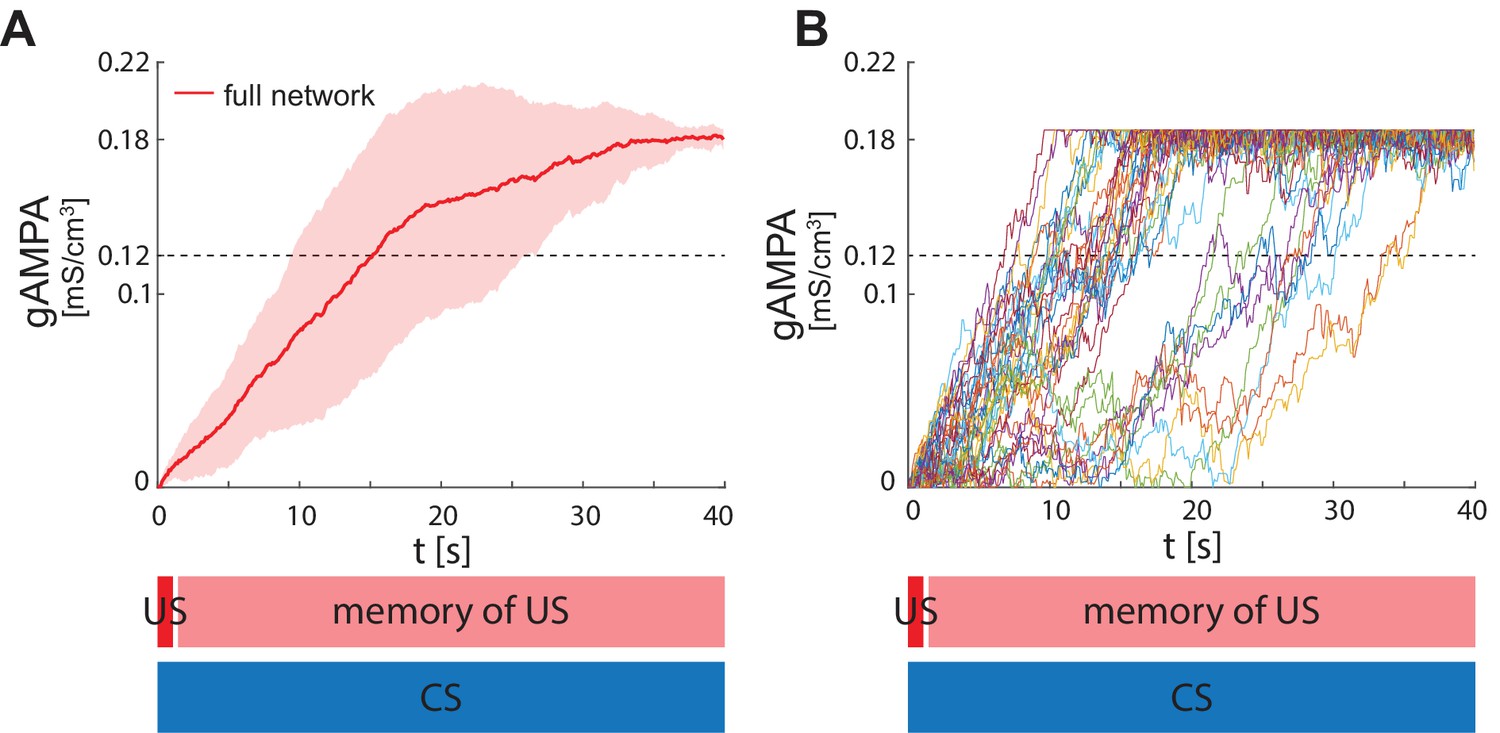
Figure 3
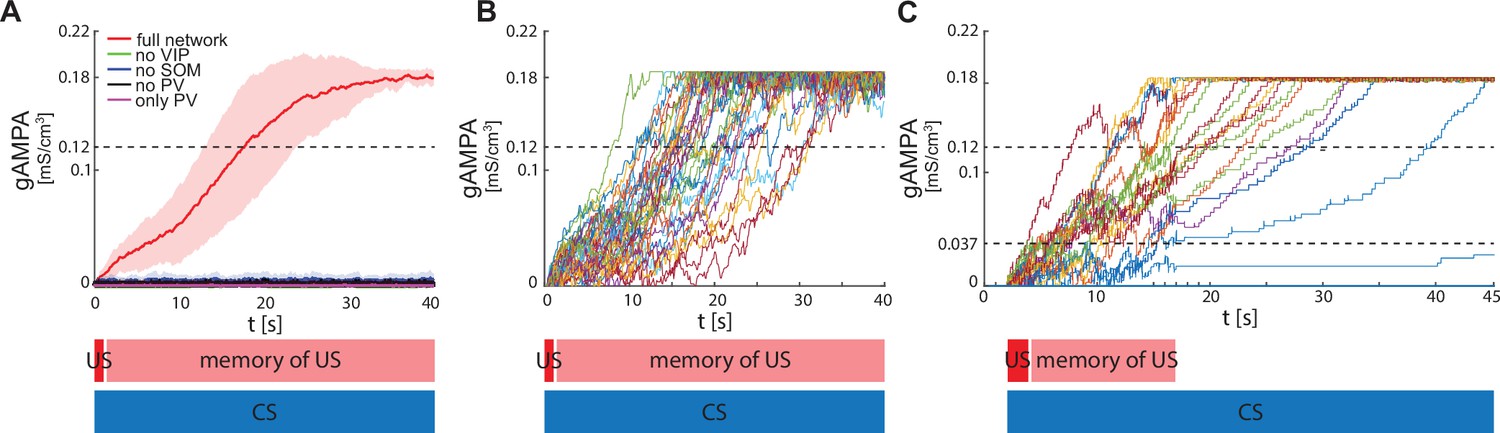
ECS to F conductance across network realizations.
(A) Mean (color-coded curves) and standard deviation (color-coded shaded areas) of the AMPA conductance (gAMPA) from ECS to F across 40 network realizations over 40 s. Red curve and shaded area represent the mean and standard deviation, respectively, across network realizations endowed with all the interneurons. (B) Evolution in time of the AMPA conductance for the 40 full network realizations in A. (C) AMPA conductance of 20 network realizations over 45 s with F strongly activated by US (2 s) and its effects (13 s), and ECS active the whole interval because of CS; 19 out of 20 network realizations show potentiation after one trial.
Figure 4
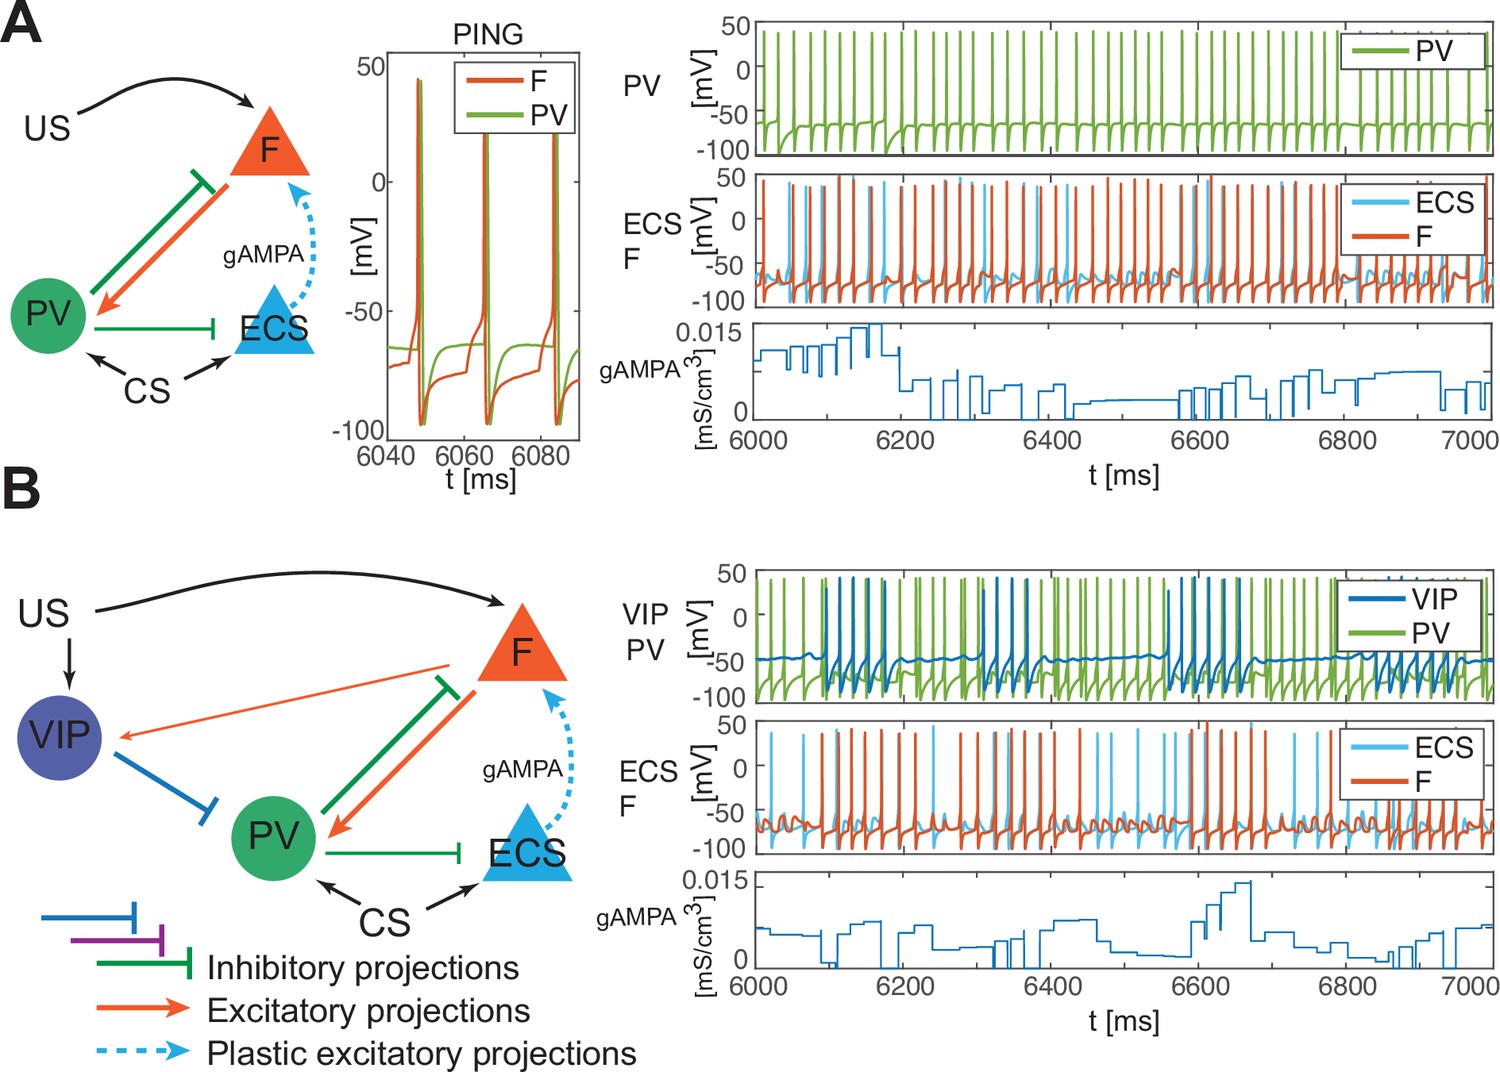
PV-only network and VIP-PV network lead to depression.
(A) Left, network with PV as the only interneuron. PV cell is at an excitation level that supports PING. Middle, dynamics of PV and F that reciprocally interact and generate PING. Right, PV and F entrain in PING (top), ECS and F activity (middle), and ECS to F conductance (bottom). (B) Left, network with both PV and VIP. Right, network dynamics (top, middle) followed by the evolution in time of the ECS to F AMPA conductance (bottom). The detailed mechanism behind the evolution of AMPA conductance in panels A and B is in Appendix 1, including Appendix 1—figure 2.
Figure 5
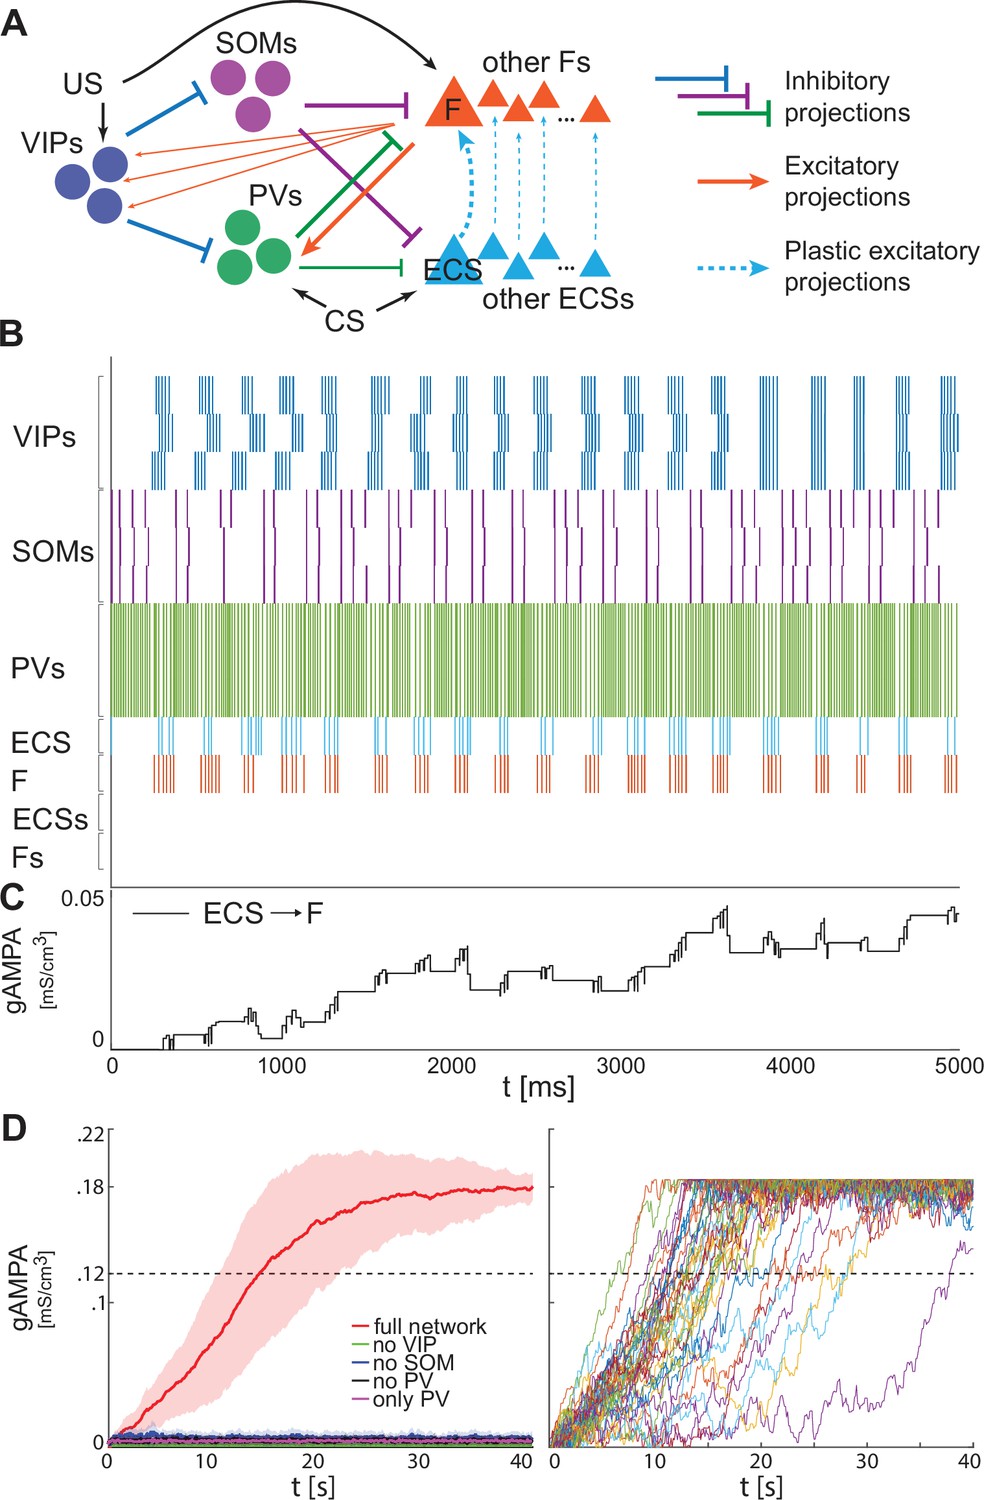
Heterogeneous BLA fear network is capable of establishing the association between CS and fear.
(A) whole BLA network with multiple and heterogeneous neurons. (B) Dynamics in the first 5000ms after the onset of US and CS of each of the neurons in the BLA network. (C) Dynamics of ECS to F conductance over 5000 ms shaped by the activity in B. (D) Left, mean and standard deviation across 40 network realizations of the ECS to F conductance for the full (red), no VIP (green), no SOM (purple), no PV (black), no SOM and PV (magenta) networks. The green, purple, back, and magenta curves are superimposed on each other. Right, dynamics of all the 40 full network realizations over 40 s.
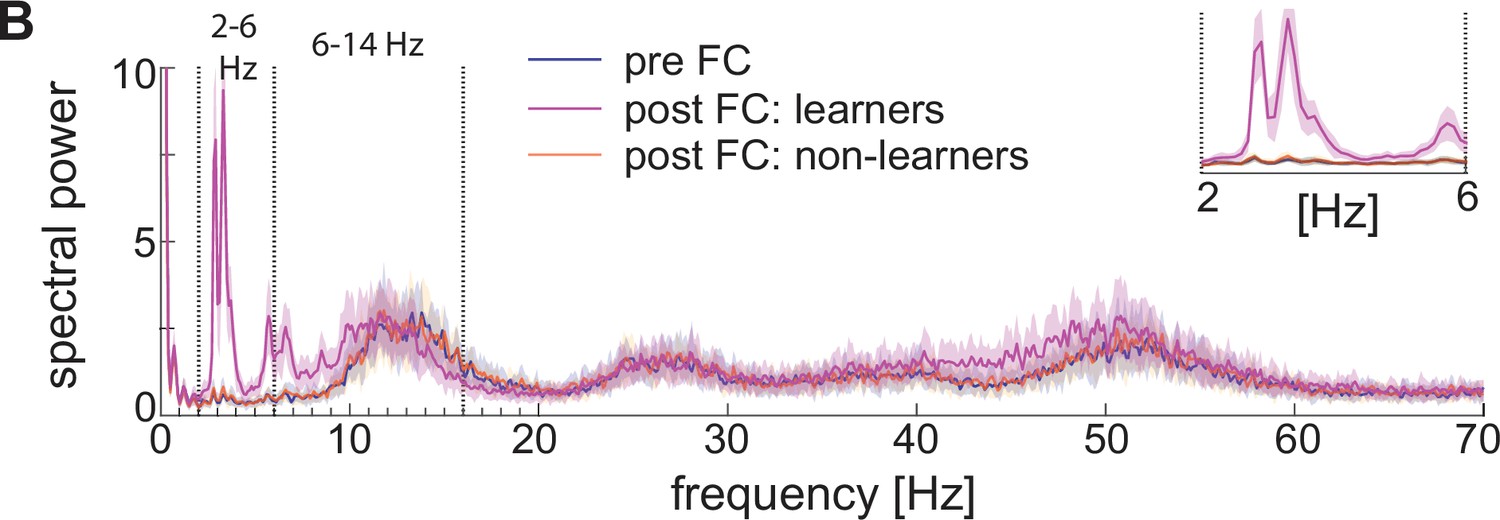
Figure 6
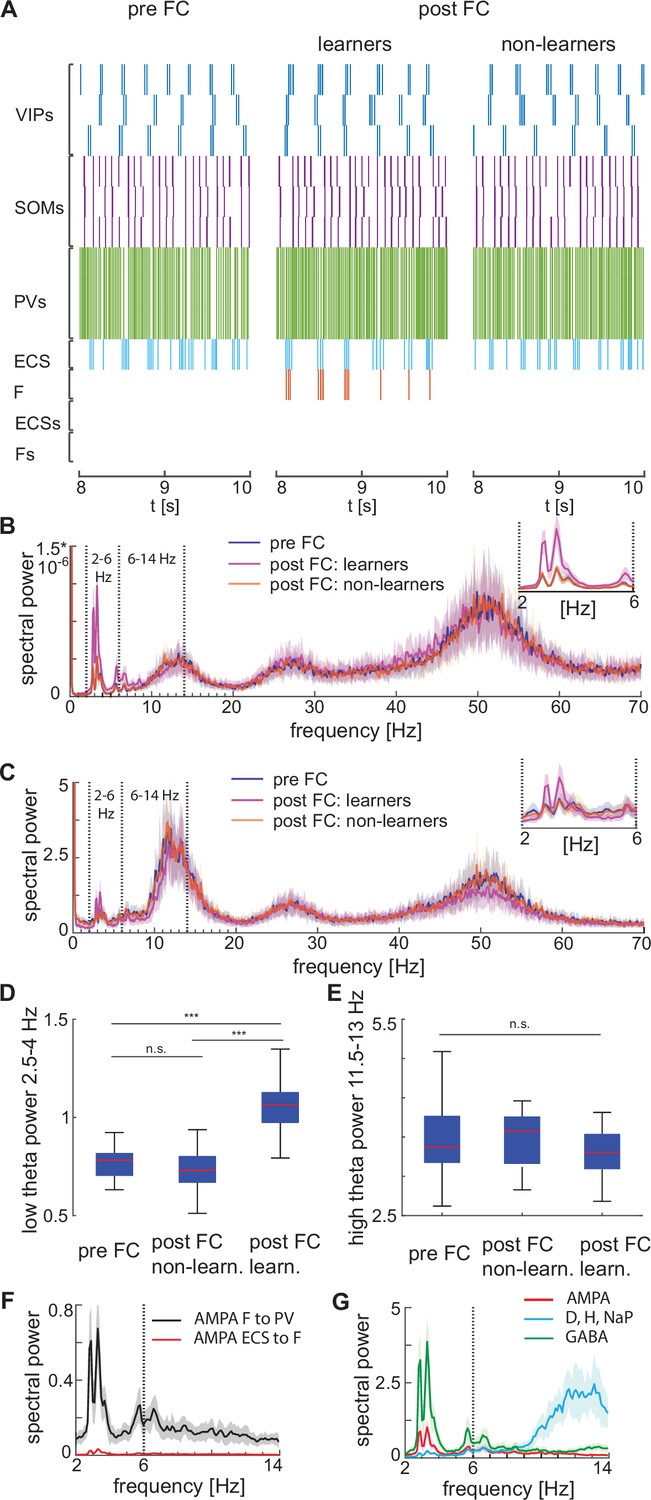
Heterogeneous network dynamics and spectral properties pre versus post fear conditioning for network realizations in learners and non-learners.
All power spectra are represented as mean and standard deviation across 20 network realizations. (A) Dynamic of BLA heterogeneous networks pre (left) and post (learner, middle; non-learner, right) fear conditioning. (B) Power spectra of network spiking activity before fear conditioning (blue) and after successful (purple) and non-successful fear conditioning (orange); top, right: inset between 2 and 6 Hz. Blue and orange curves closely overlap. (C) Power spectra of the LFP proxy (linear sum of AMPA, GABA, D-, NaP-, and H-currents); all the details as in B. (D, E) 25th, 50th, and 75th percentiles of LFP low theta power in the 2.5–4 Hz range where the peaks of power exist (D) and high theta power in the 12–14 Hz range again where the peaks of power exist (E) in 20 network realizations before and after (in both learners and non-learners) fear conditioning. ***: p-value <0.001; n.s.: non-significant difference, obtained using a two-sided Wilcoxon rank sum test (ranksum in Matlab). (F) Power spectra of AMPA currents from ECS to F (red curve) and from F to PV interneurons (black curve). (G) Power spectra mean and standard deviation of the LFP signals derived from only AMPA currents (red curve), GABA currents (green curve), D-current, NaP-current and H-current (light blue curve). AMPA currents are generated by the interactions from ECS to F, F to VIPs, and F to PVs. VIP cells contribute to the D-current and SOM cells to H-current and NaP-current (see the Result section ‘Rhythms in the BLA can be produced by interneurons’ for a description of these currents).
Appendix 1—figure 1
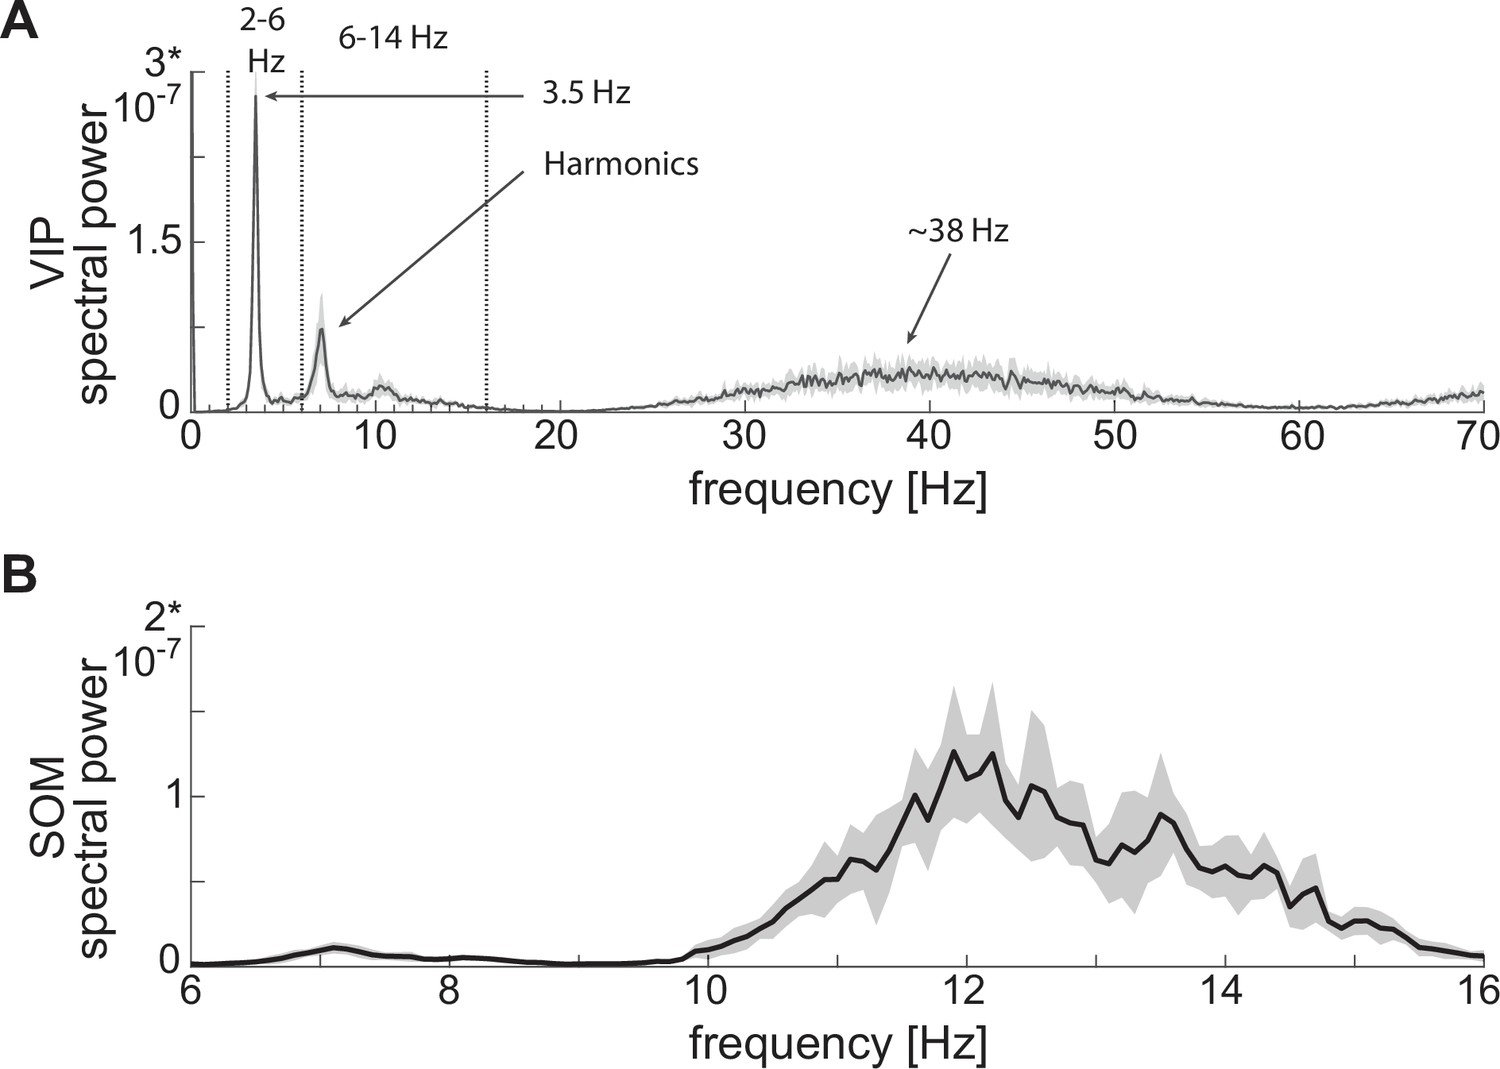
Power spectra of neuronal spiking activity at baseline.
(A) Power spectrum of VIP cell showing a first peak at low theta (~3.5 Hz), plus harmonics, and a second peak at gamma (~38 Hz). (B) SOM cell power spectrum showing a peak at high theta (~12 Hz). Both panels show the mean (black curves) and standard deviation (black shaded areas) of the power spectra across 10 network realizations.
Appendix 1—figure 2
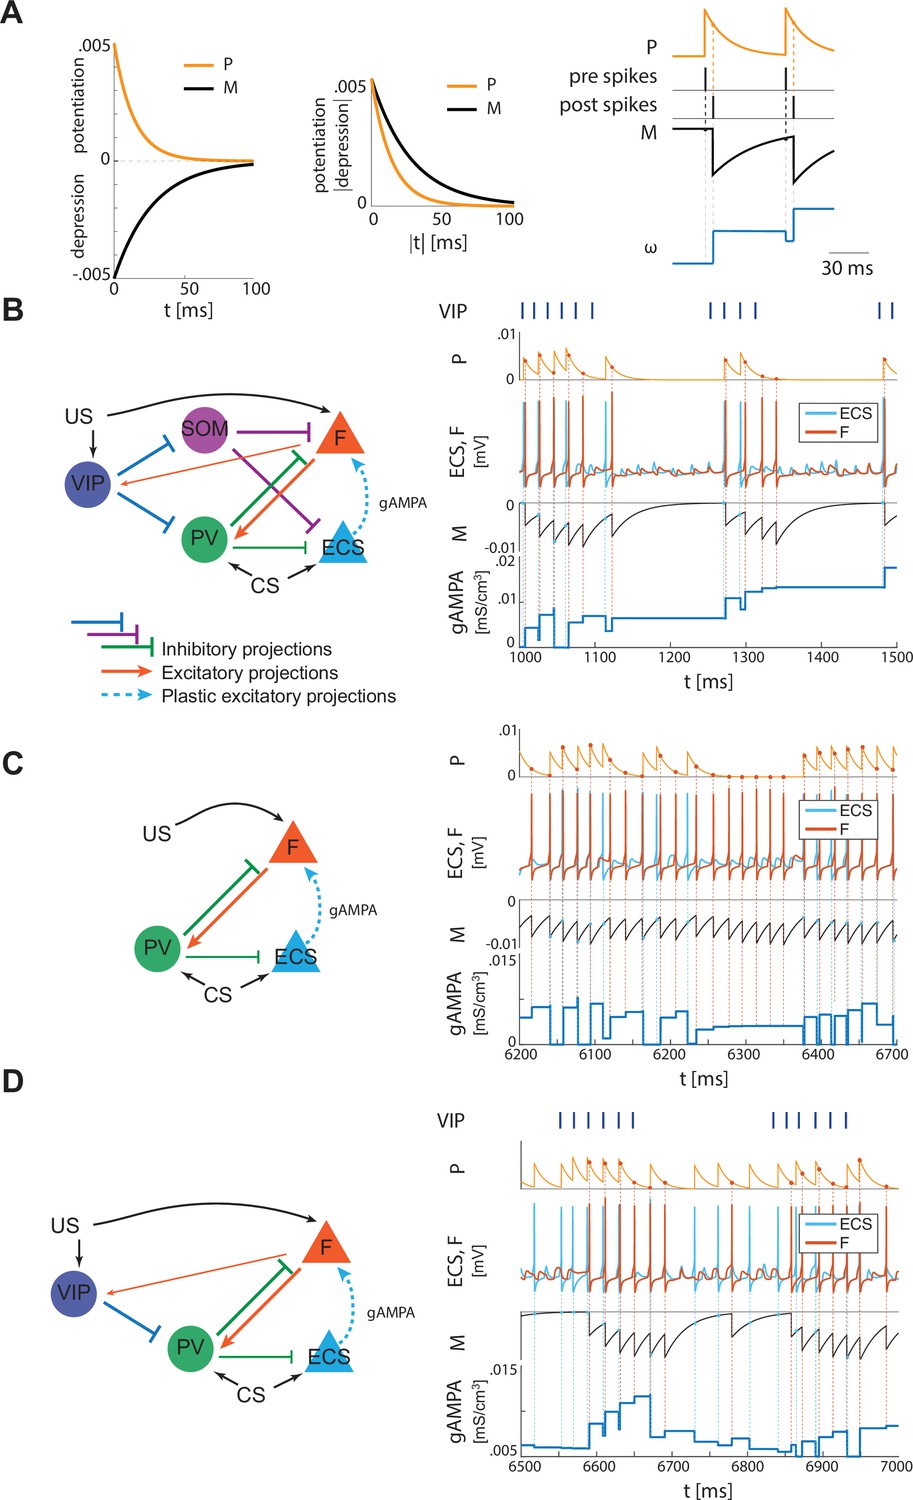
Plasticity rule and detailed representation of how plasticity works in the three network configurations shown in Figure 2B and Figure 4A and B.
(A) Left, STDP potentiation (P) and depression (M) functions. The area underlying depression is larger than the one of potentiation, thus providing a depression-dominated rule. The potentiation and depression curves are used to compute the instantaneous change of the synaptic conductance as a function of the spike time difference between pre and postsynaptic neurons, as detailed in the section ‘Synaptic plasticity’ in Materials and methods, and in Appendix 1. Right, a representative spike pattern of pre and postsynaptic neurons alongside the resulting P and M functions and the evolution of the pre-post synaptic conductance. (B) Left, full network. Right, ECS (pre) and F (post) spiking activities over 500 ms (extracted from Figure 2) with their respective M and P functions, which determine how the AMPA conductance from ECS to F evolves in time. (C) Left, only-PV network at a low excitation level. Right, ECS and F dynamics as in 500ms extracted from Figure 4A with P, M, and AMPA conductance unfolded over time. (D) Left, network with VIP and PV. Right, ECS and F dynamics as in 500ms extracted from Figure 4B, alongside P, M, and AMPA conductance over time.
Appendix 1—figure 3
ECS to F conductance across network realizations in BLA characterized by US, instead of CS, input to PV interneuron.
(A) Mean (color-coded curves) and standard deviation (color-coded shaded areas) of the AMPA conductance (gAMPA) from ECS to F across 40 network realizations over 40 seconds. (B) Evolution in time of the AMPA conductance for the 40 full network realizations in A.
Appendix 1—figure 4
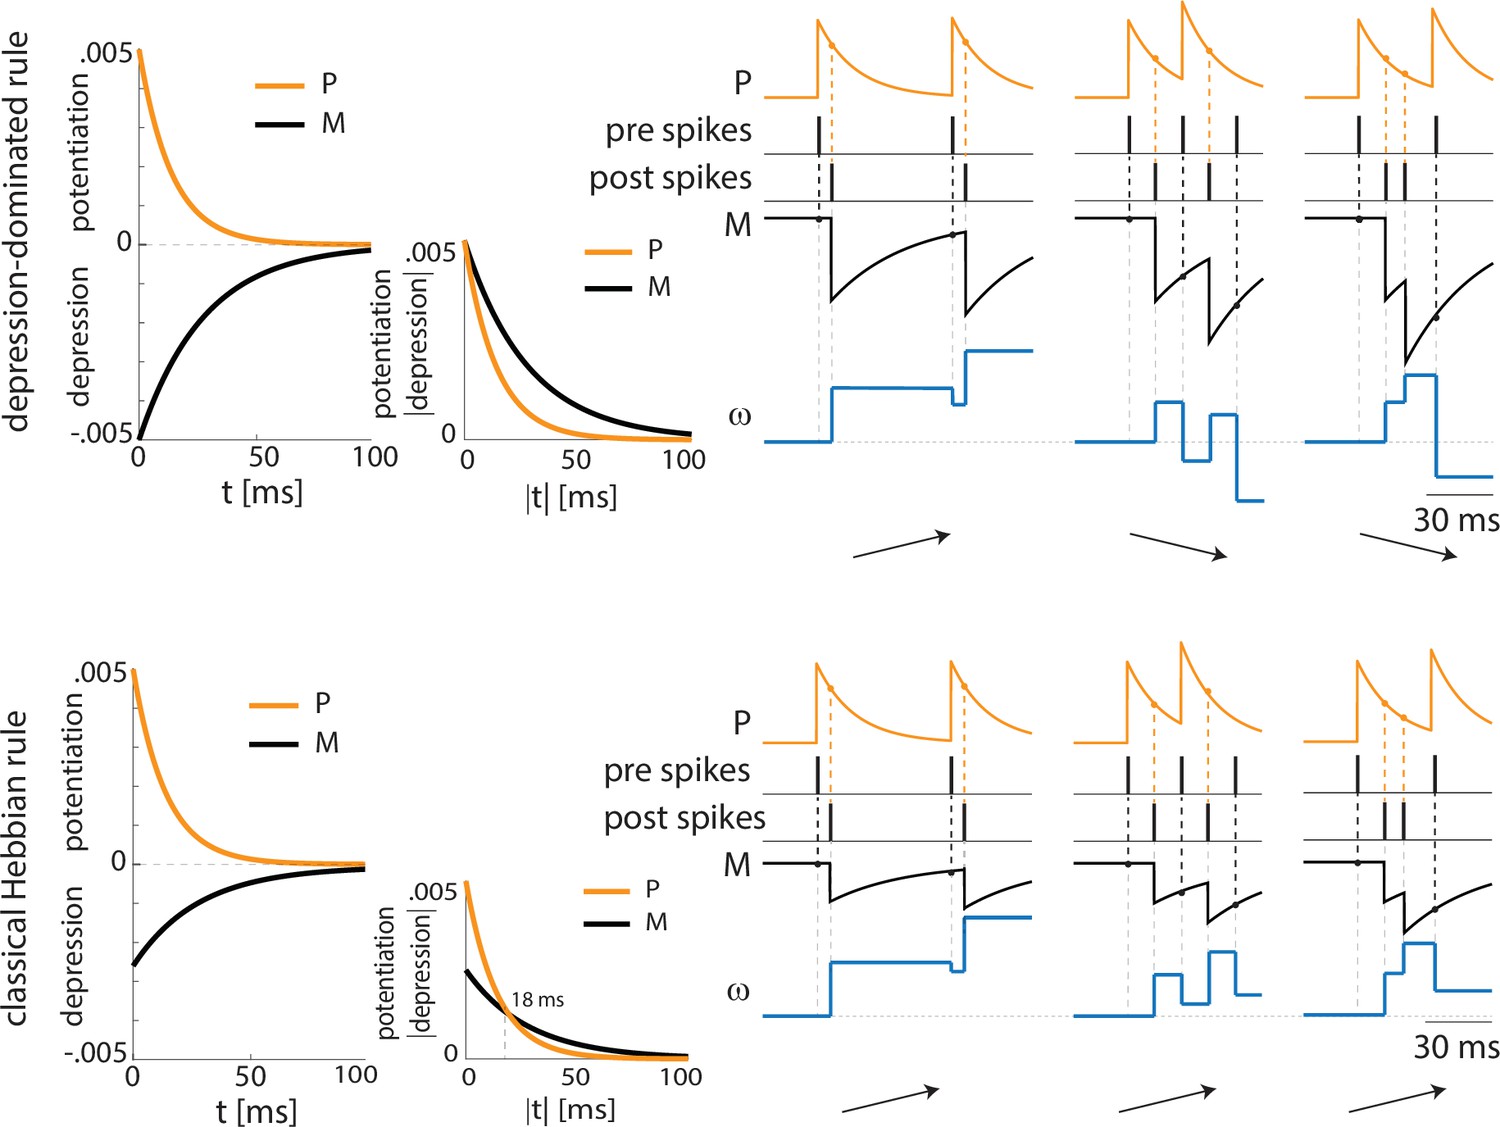
Depression-dominated and classical Hebbian plasticity rules may provide opposite potentiation/depression profiles.
Top, depression-dominated rule (as in Appendix 1—figure 2A) with three examples of pre and postsynaptic spike patterns. Only the first one, which shows a consistent pre-post timing, shows overall potentiation. The remaining two spike patterns lead to depression. Bottom, classical Hebbian rule characterized by a smaller maximal amplitude for depression than potentiation. In agreement with the depression-dominated rule, the classical rule shows potentiation in the case of the pre and postsynaptic neurons showing correct pre-post spike timing. However, the classical rule shows potentiation also in the remaining two examples where there is no-consistent pre-post timing, given that the pre and postsynaptic neurons fire at a frequency higher than 55 Hz.
Appendix 1—figure 5
Spectral properties pre versus post fear conditioning of LFP approximated with the sum of the absolute values of AMPA, GABA, D-, NaP-, and H-currents.
Power spectra before fear conditioning (blue) and after successful (purple) and non-successful fear conditioning (orange); top, right: inset between 2 and 6 Hz. Blue and orange curves closely overlap.
Additional files
Download links
A two-part list of links to download the article, or parts of the article, in various formats.
Downloads (link to download the article as PDF)
Open citations (links to open the citations from this article in various online reference manager services)
Cite this article (links to download the citations from this article in formats compatible with various reference manager tools)
Basolateral amygdala oscillations enable fear learning in a biophysical model
eLife 12:RP89519.
https://doi.org/10.7554/eLife.89519.4


