Cell-type-specific cis-regulatory divergence in gene expression and chromatin accessibility revealed by human-chimpanzee hybrid cells
- Department of Biology, Stanford University, United States
Figures
Figure 1 with 4 supplements
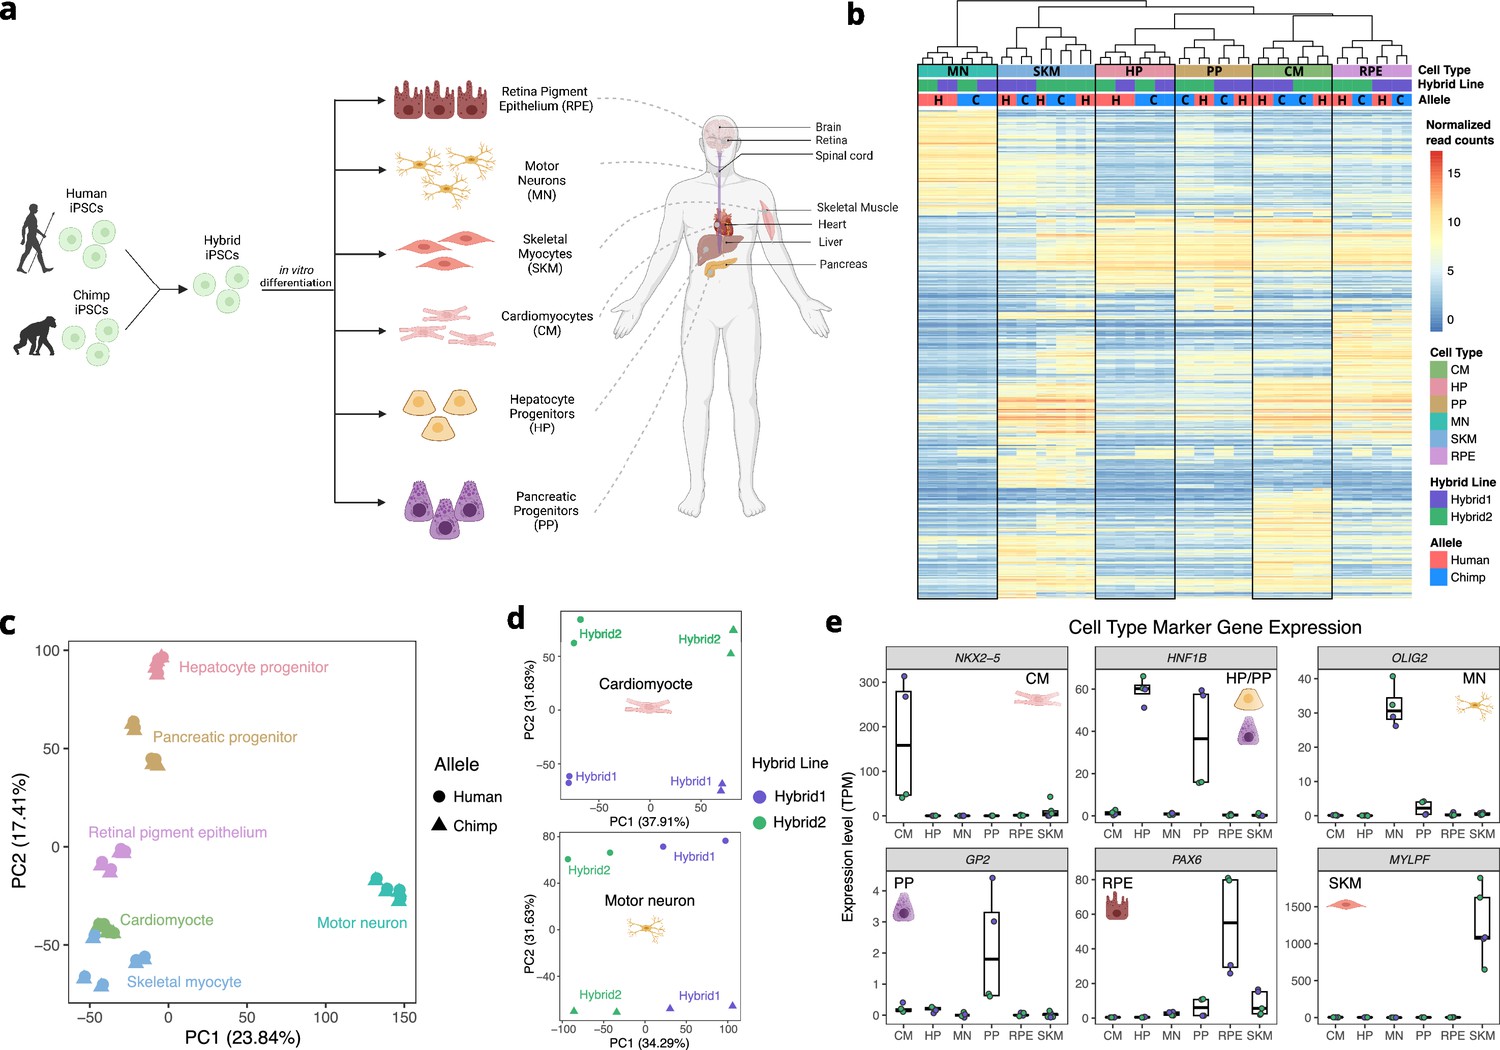
Allele-specific expression across diverse human-chimpanzee hybrid cell types.
(a) Six cell types were differentiated from human-chimpanzee hybrid induced pluripotent stem cells. These six cell types represent diverse body systems, including motor neurons for the central nervous system, retinal pigment epithelium for eye, skeletal myocytes for skeletal muscle, cardiomyocytes for the heart, hepatocyte progenitors for the liver, and pancreatic progenitors for the pancreas. (b) Heatmap showing the result of hierarchical clustering performed on genes with highly variable normalized allele counts. (c) Result of running PCA on normalized allelic counts for all samples and cell types. (d) Result of PCA performed on normalized allele counts for each individual cell type separately. Cardiomyocytes and motor neurons are shown here. (e) Expression of marker genes for each cell type.
© 2024, Wang et al. Figure 1a was created using BioRender, and is published under a CC BY-NC-ND 4.0 license. Further reproductions must adhere to the terms of this license.
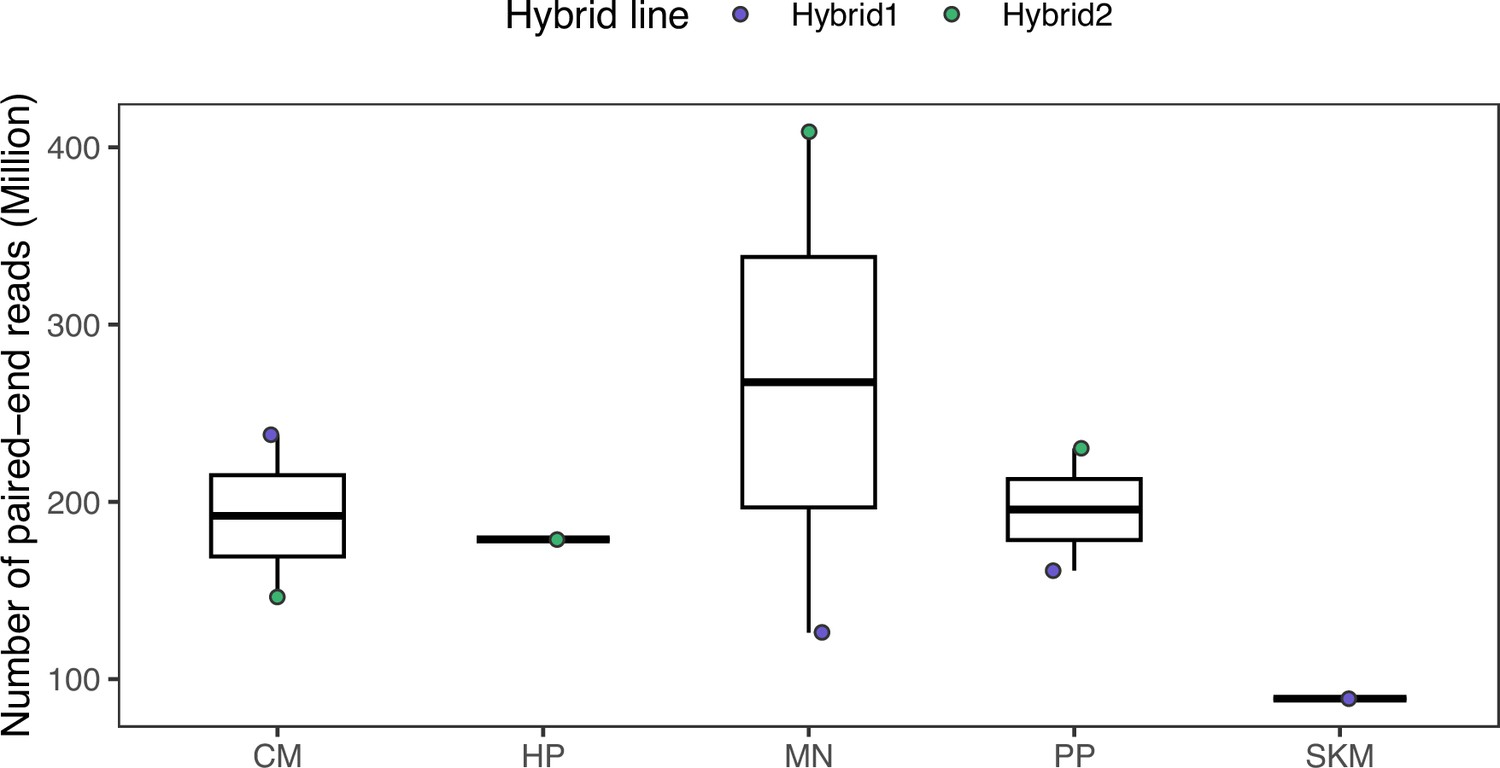
Figure 1—figure supplement 1

Sequencing depth across samples for the RNA-seq data.
Sequencing depth in the raw fastq files is shown in the top panel. The bottom panel shows the read count after filtering for only uniquely mapped reads and removing duplicates. CM: cardiomyocyte; HP: hepatocyte progenitor; MN: motor neuron; PP: pancreatic progenitor; RPE: retinal pigment epithelium; SKM: skeletal myocyte.
Figure 1—figure supplement 2
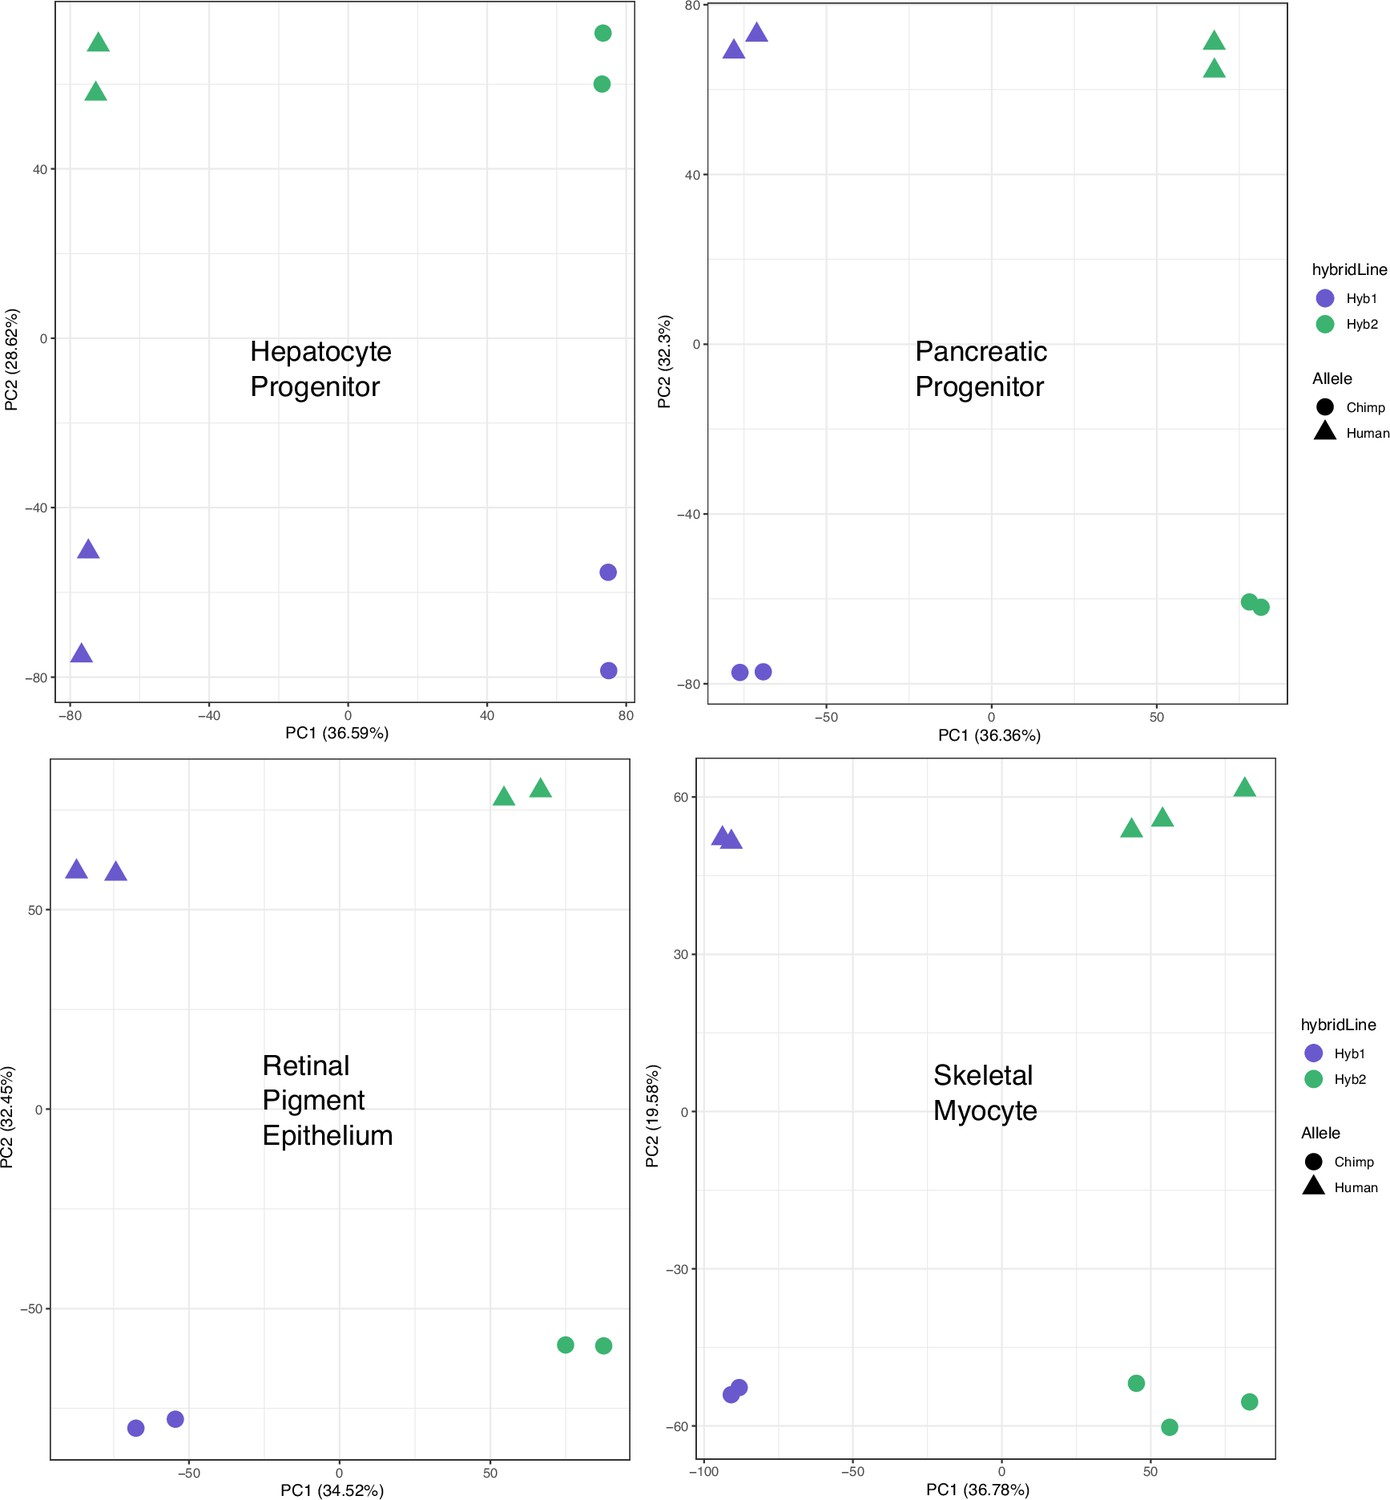
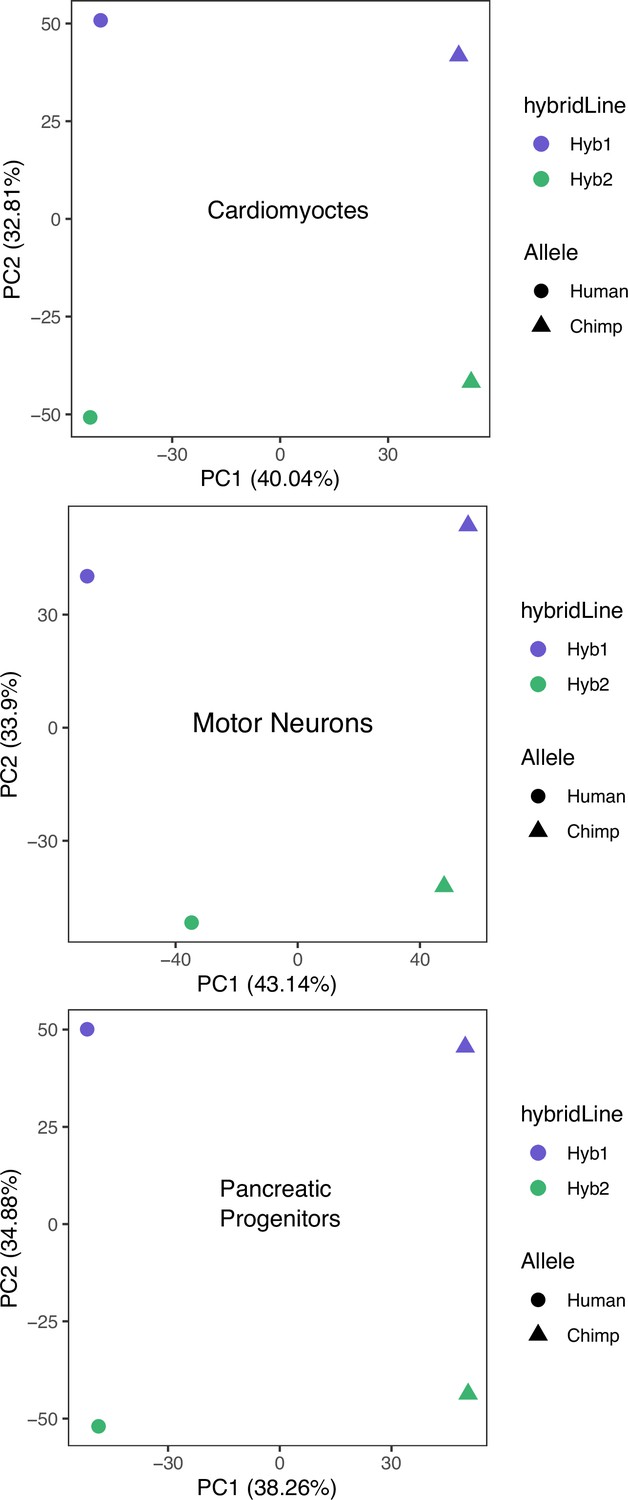
PCA on allelic counts from RNA-seq for individual cell types.
The result of running principal component analysis (PCA) on the individual cell types not shown in Figure 1d. Species were clearly separated by PC1 or PC2 when PCA was performed on each cell type.
Figure 1—figure supplement 3
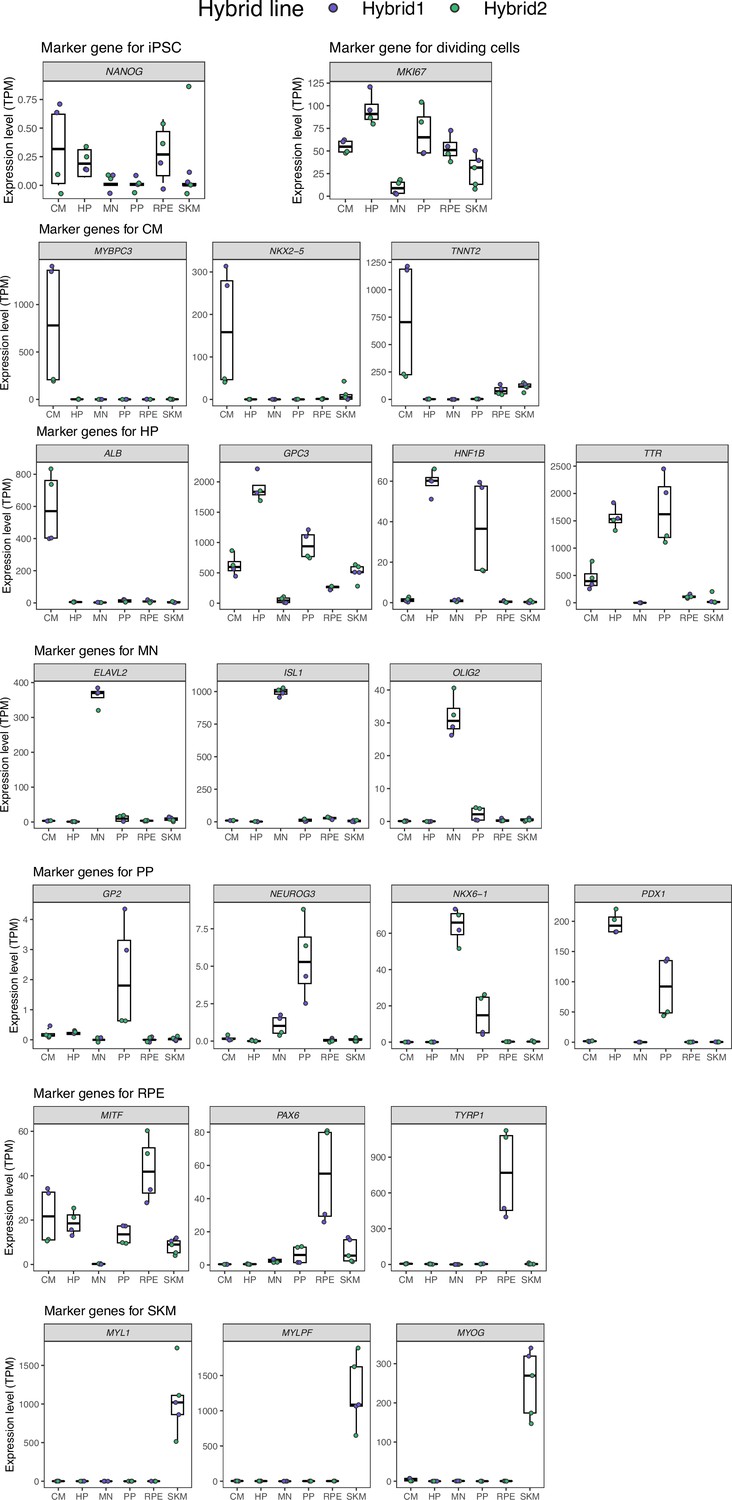
Marker gene expression in different cell types.
In order, the panels show: a marker for pluripotency, a marker gene for dividing cells, marker genes for cardiomyocytes, marker genes for hepatocytes and hepatocyte progenitors, marker genes for motor neurons, marker genes for pancreatic progenitors and more mature pancreatic cell types, marker genes for retinal pigment epithelial cells, and marker genes for skeletal myocytes. Hepatocyte progenitors and pancreatic progenitors generally show similar gene expression profiles. TPM: transcript per million.
Before continuing with the analysis, we tested whether the differentiations were successful and contained primarily our target cell types. The very low expression of NANOG, a marker for pluripotency, across all differentiations indicates that the samples contain very few iPSCs (Agoglia et al., 2021). For cardiomyocytes (CM), NKX2-5, MYBPC3, and TNNT2 definitively distinguish CM from other heart cell types and their high expression indicates successful differentiations (Burridge et al., 2014). For motor neurons, the high expression of ELAVL2, a pan-neuronal marker, indicates a high abundance of neurons in the sample (Mickelsen et al., 2019). The expression of ISL1 and OLIG2 further demonstrates that these are motor neurons and not other types of neurons (Maury et al., 2015). For retinal pigment epithelium (RPE), the combined expression of MITF, PAX6, and TYRP1 provides strong evidence that the differentiations were successful in producing RPE cells (Sharma et al., 2019). For skeletal muscle, the very high expression of MYL1, MYLPF, and MYOG indicates that these samples contain a high proportion of skeletal muscle cells (Chal et al., 2016). In general, all these populations of cells contain some proportion of progenitors as there is detectable expression of MKI67 in all samples.
The low expression of ALB (a marker for mature hepatocytes) and the high expression of TTR and GPC3 (markers for hepatocyte progenitors) combined with the high expression of HNF1B indicate that the bulk of the cells in the HP samples are hepatocyte progenitors rather than mature hepatocytes or endoderm cells, although there are likely some endoderm cells and immature hepatocytes in the sample (Hay et al., 2008; Mallanna and Duncan, 2013). Similarly, the combined expression of PDX1 and NKX6-1 and the low expression of NEUROG3 (a marker of endocrine progenitors which differentiate from pancreatic progenitors) in the PP samples indicates that these primarily contain pancreatic progenitors but likely contain some endocrine progenitors and endoderm cells (Cogger et al., 2017; Korytnikov and Nostro, 2016).
Notably, HP and PP are closely related cell types that are derived from the same lineage. Indeed, heterogeneous multipotent progenitors can contribute to both the adult liver and adult pancreas in mice (Willnow et al., 2021). Progenitors that express PDX1 (often used as a marker for the pancreatic lineage) can differentiate into hepatocytes (Willnow et al., 2021). As a result, some overlap in the transcriptomic signature of both cell types is expected and we cannot rule out that the HP samples contain cells that could differentiate into pancreatic cells or that the PP samples contain cells that could differentiate into hepatocytes. However, the expression of NKX6-1 and GP2, markers for pancreatic progenitors, in the PP samples but not the HP samples indicates that these two populations of cells are distinct. Overall, the similarity of PP and HP likely explains the lower number of cell-type-specific genes and genes showing cell-type-specific ASE for these cell types. This similarity does not alter the conclusions presented in the main text.
Figure 1—figure supplement 4
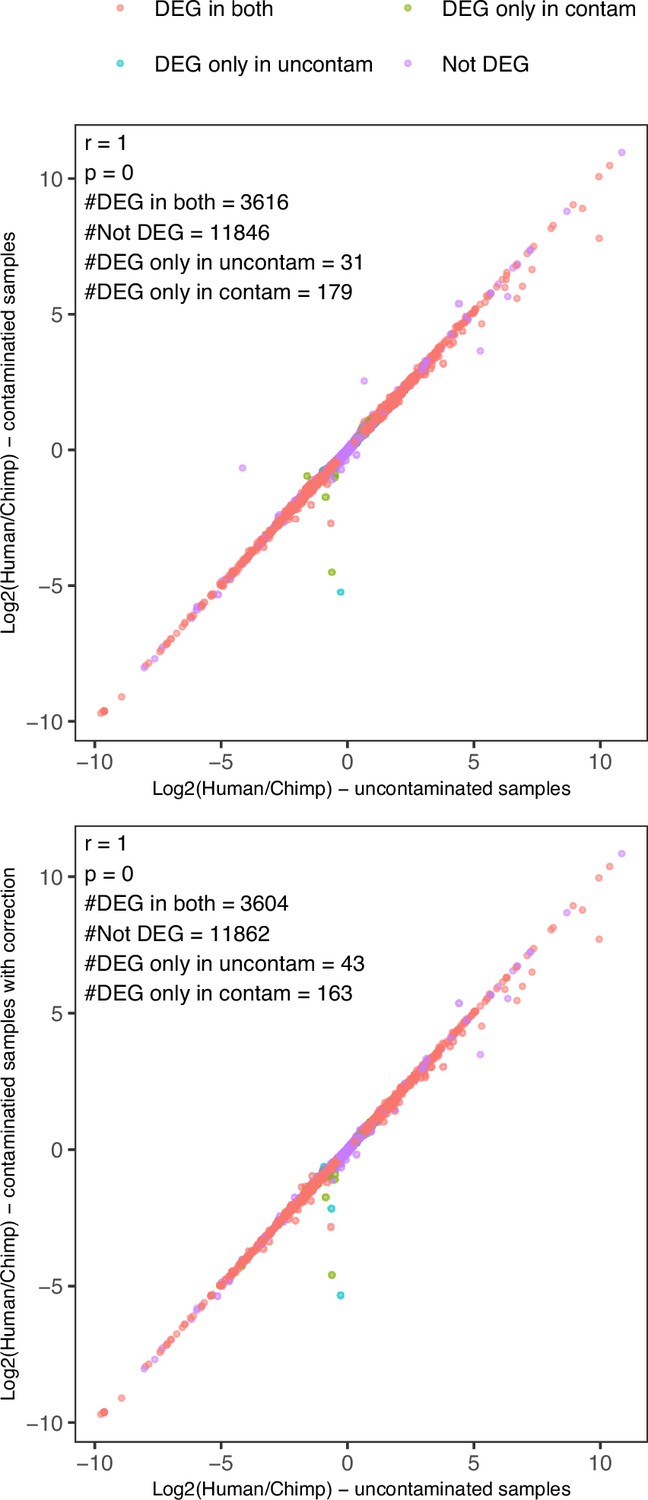
Simulated chimpanzee parental contamination of hybrid RNA-seq data and correction.
The result of using hybrid and chimpanzee parental iPSC RNA-seq from Agoglia et al. (the same lines used in this study) is shown. Simulation of chimpanzee parental contamination was done by mixing chimpanzee parental data into hybrid2 data to reach a similar chimpanzee bias to that observed in PP hybrid2 samples. Top: log2(human allele counts/chimpanzee allele counts) estimates from uncontaminated samples vs contaminated samples. Bottom: log2(human allele counts/chimpanzee allele counts) estimates from uncontaminated samples vs contaminated samples after correction. The numbers of detected differentially expressed genes with FDR <0.05 in each condition are shown on the figures.
Figure 2 with 9 supplements
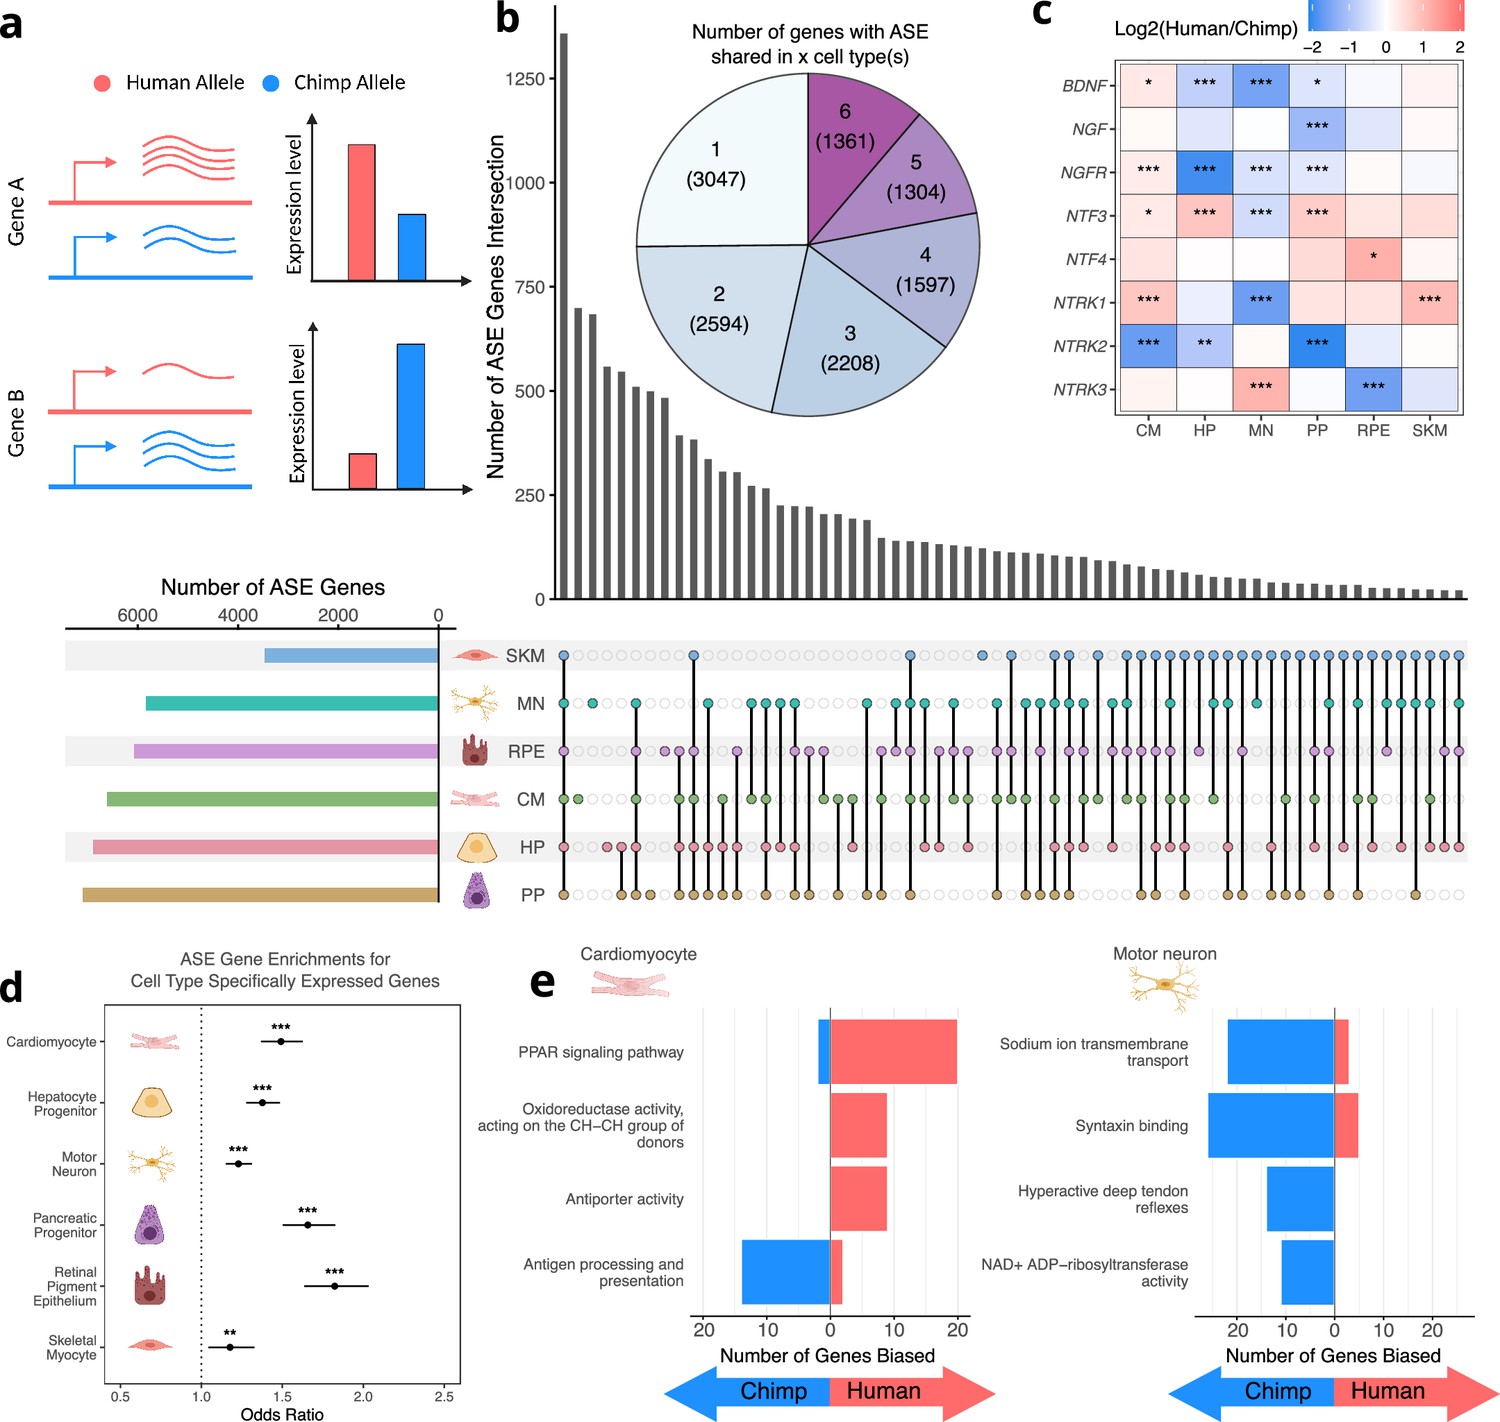
Human-chimpanzee ASE is largely cell-type-specific.
(a) Outline of measurement of allele-specific expression. Reads from the human and chimpanzee alleles are counted and differences in read counts identified. (b) Thousands of genes with ASE were identified for each cell type, with many genes only showing ASE in a single-cell type (Conway et al., 2017). (c) The neurotrophins and their receptors as examples of genes showing cell-type-specific ASE patterns. DESeq2 estimate of log2 fold-change (human/chimpanzee) are shown in the heatmap and significance is indicated by asterisks where *** indicates FDR <0.005, ** indicates FDR <0.01, and * indicates FDR <0.05. Zero asterisks (i.e. a blank box) indicates FDR >0.05. (d) Plot showing that genes with ASE are enriched for genes showing cell-type-specific expression patterns across all cell types. Asterisks indicate p-values rather than FDR using the same system as in 2 c. (e) Top gene sets with evidence for lineage-specific selection in cardiomyocytes and motor neurons are shown. The length of the bars indicates the number of genes in a category with biased expression in each cell type.
© 2024, Wang et al. Figure 2a was created using BioRender, and is published under a CC BY-NC-ND 4.0 license. Further reproductions must adhere to the terms of this license.
Figure 2—figure supplement 1
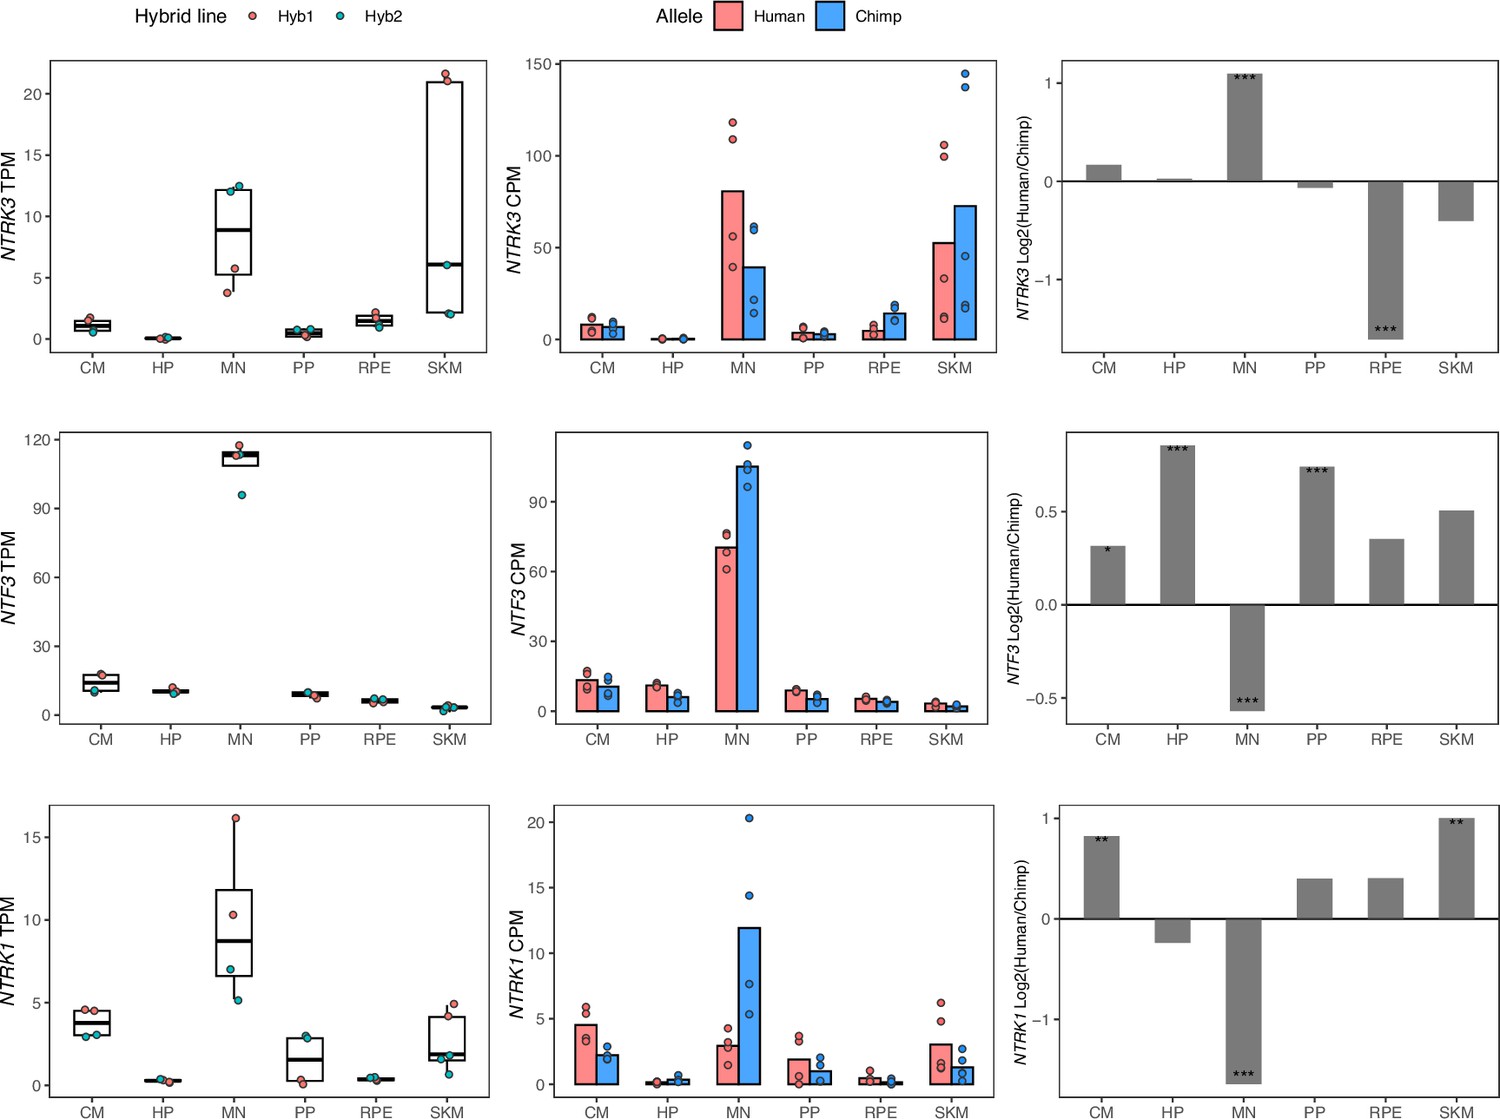
NTF3, NTRK1, and NTRK3 have cell-type-specific allele-specific expression.
Left: TPM from total expression, with the mean TPM as the center of boxplots and the TPM of each sample plotted as dots. Samples were colored by the hybrid line from which they were collected. Middle: Allelic counts per million (CPM). Right: DESeq2 log fold-changes (log2(human/chimpanzee)) and significance (using DESeq2 likelihood ratio test) which is indicated by asterisks where *** indicates FDR <0.005, ** indicates FDR <0.01, and * indicates FDR <0.05.
Figure 2—figure supplement 2
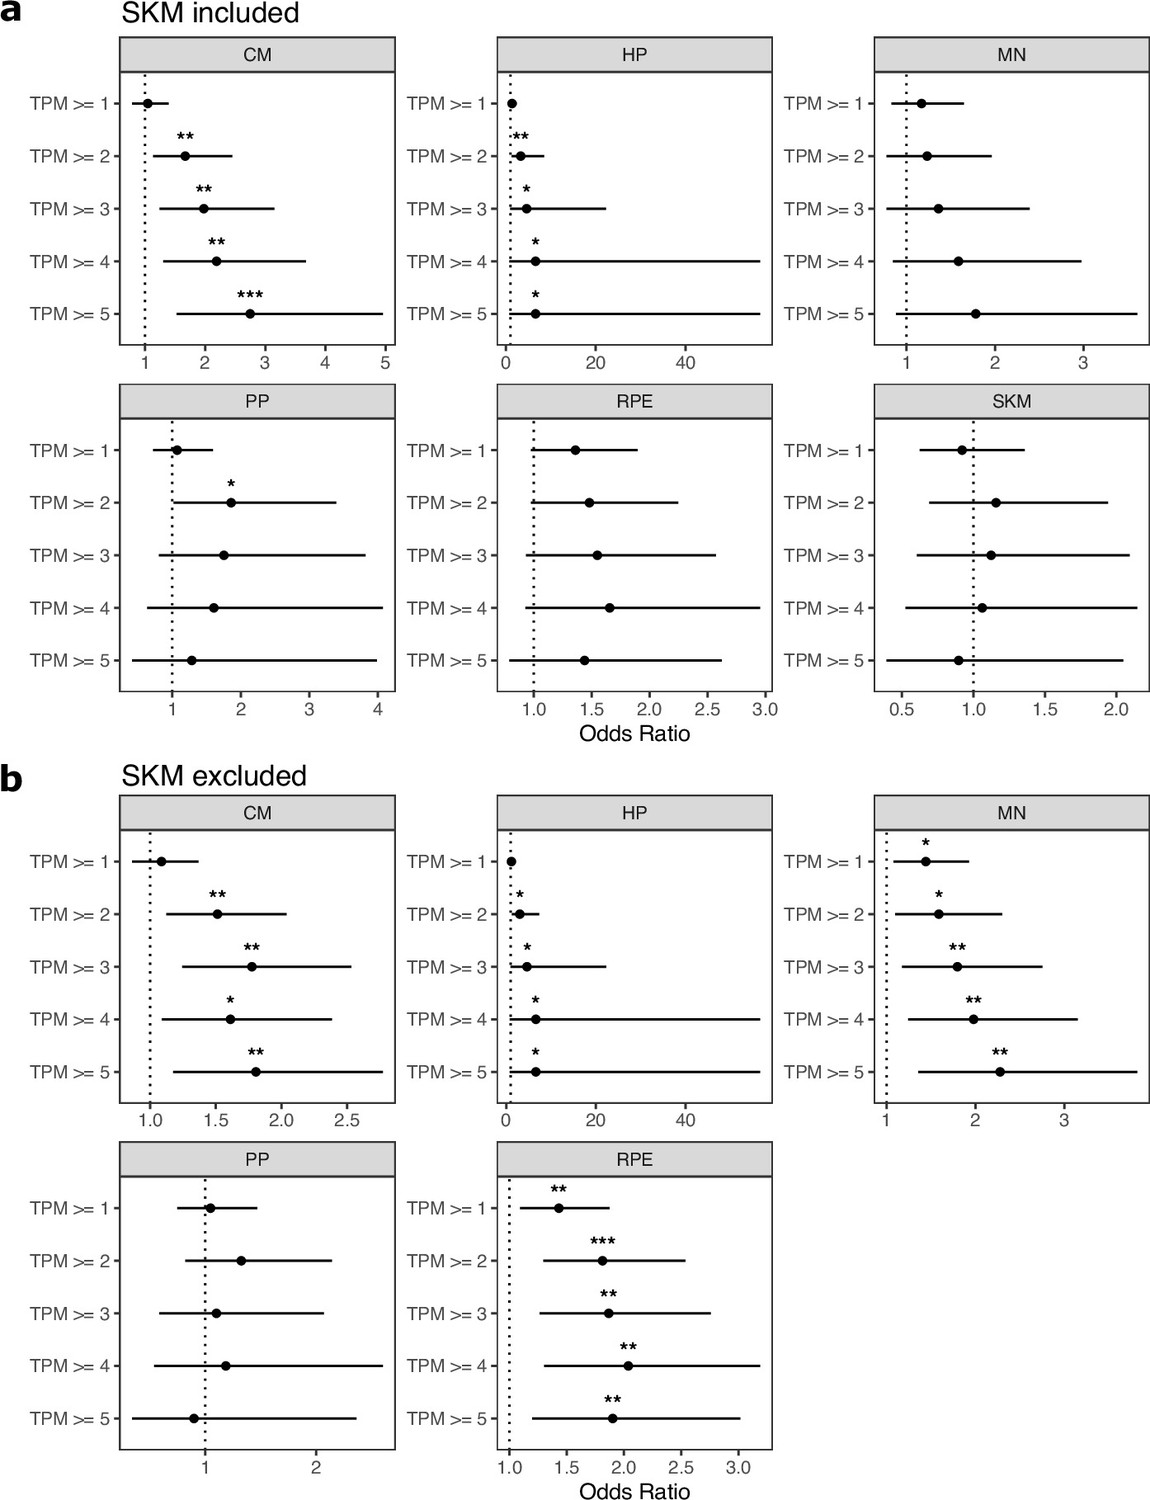
Genes expressed in only one cell type are enriched for genes with ASE.
(a) TPM cutoffs were used to test whether genes expressed in only one cell type are enriched for genes with allele-specific expression (ASE). For each tested cell type, genes with TPM greater than the cutoff in this cell type and TPM <1 in all other cell types were tested. Significance (using the Wald test) is indicated by asterisks where *** indicates p<0.005, ** indicates p<0.01, and * indicates p<0.05. (b) The same as in (a) but excluding SKM.
Figure 2—figure supplement 3

Cell type-specifically expressed genes are enriched for genes with ASE across FDR cutoffs.
(a) Testing for enrichment of tissue-specific genes for ASE genes across various FDR cutoffs. Significance (using the Wald test) is indicated by asterisks where *** indicates p<0.005, ** indicates p<0.01, and * indicates p<0.05. (b) The same as in (a) but excluding SKM.
Figure 2—figure supplement 4

Cell type-specifically expressed genes are enriched for genes with ASE regardless of expression level.
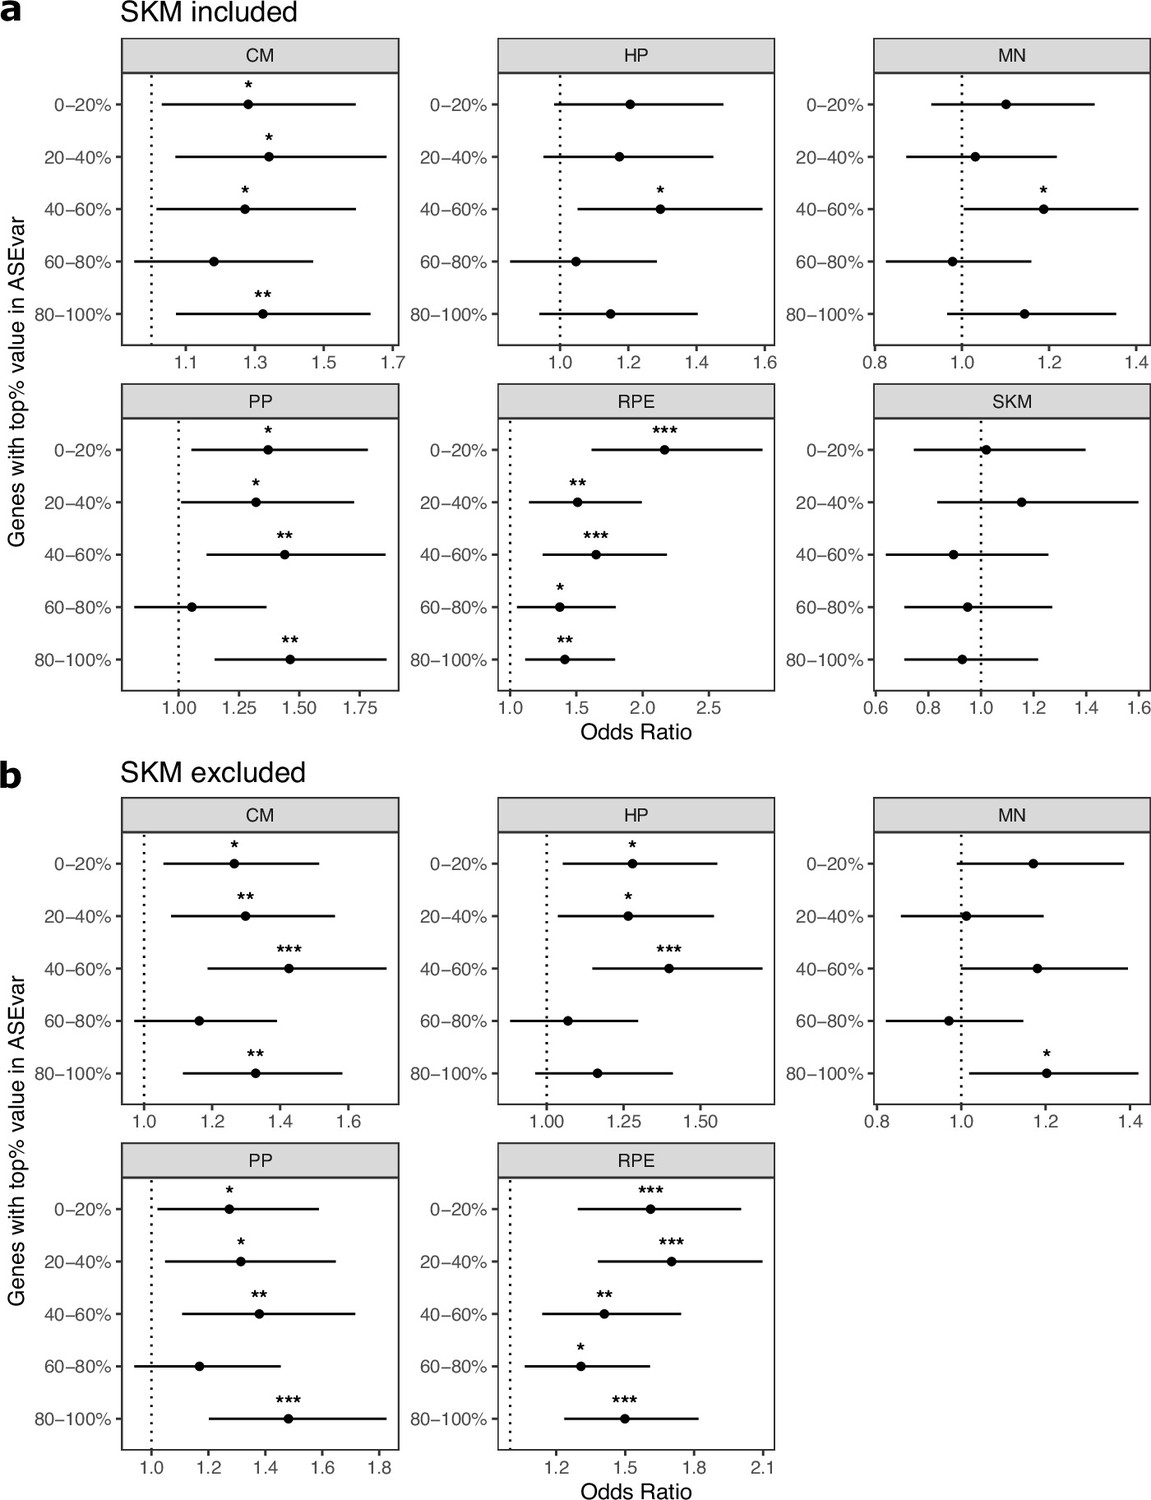
(a) The enrichment for cell-type-specific genes in genes with ASE holds regardless of gene expression level. Significance (using the Wald test) is indicated by asterisks where *** indicates p<0.005, ** indicates p<0.01, and * indicates p<0.05. Genes in the 0–20% bin are the most lowly expressed whereas genes in the 80–100% bin are the most highly expressed. (b) The same as in (a) but excluding SKM.
Figure 2—figure supplement 5
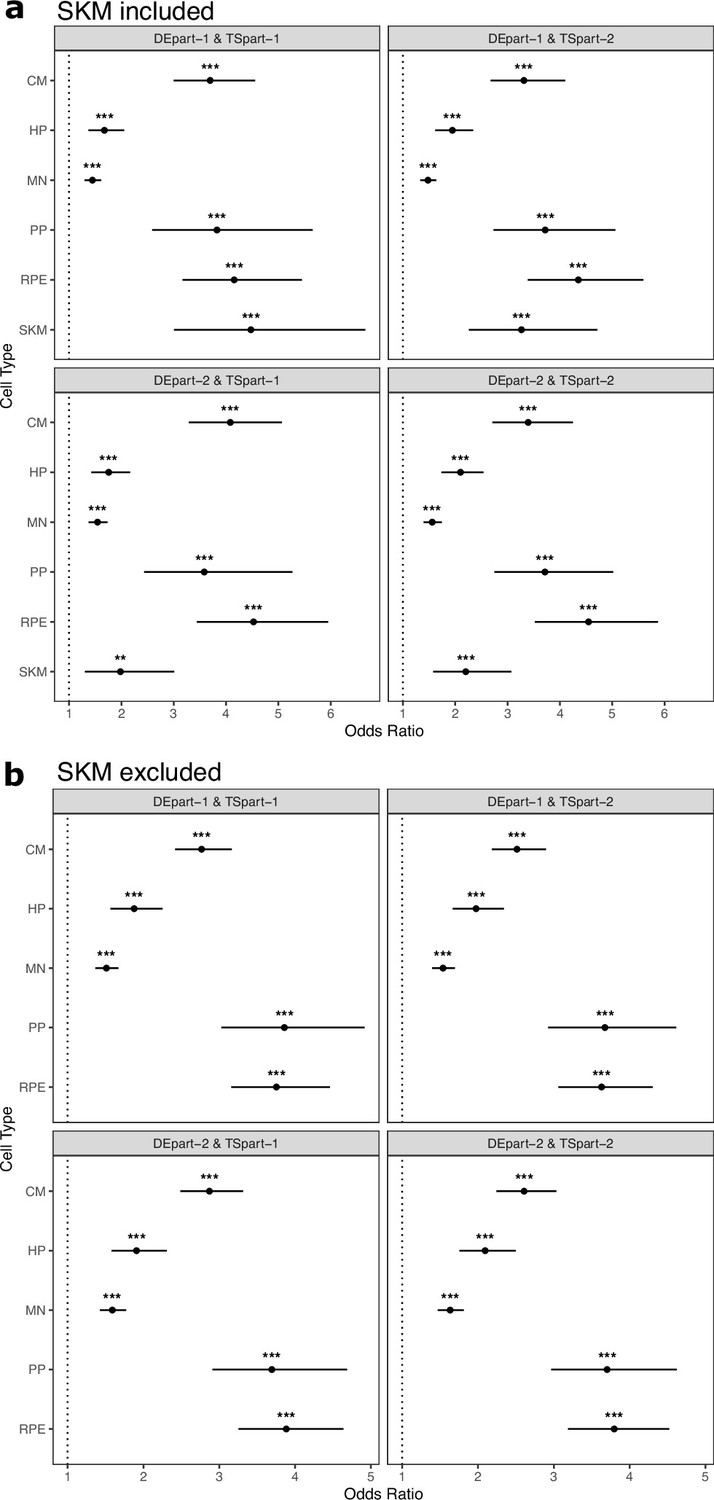
Cell type-specifically expressed genes are enriched for genes with ASE when different samples are used to identify cell-type-specific and ASE genes.
(a) At least four samples including two hybrid1 samples and two hybrid2 samples were collected for each cell type, except five samples were collected for SKM (two hybrid1 and three hybrid2 samples). Samples were split into part-1 and part-2 randomly by enforcing that each part have both hybrid1 and hybrid2 samples. Genes with ASE (denoted here as DE) and tissue-specifically expressed genes (denoted here as TS) were identified from part-1 and part-2, respectively (or vice versa), so different samples were used for each definition. For example, DEpart-1 indicates that genes with ASE were identified from part-1 samples and TSpart-2 indicates that tissue-specifically expressed genes were identified from part-2 samples. Significance (using the Wald test) is indicated by asterisks where *** indicates p<0.005, ** indicates p<0.01, and * indicates p<0.05. (b) The same as in (a) but excluding SKM.
Figure 2—figure supplement 6
Controlling for ASE variance generally does not eliminate enrichment of ASE genes in cell type-specifically expressed genes.
(a) Enrichments tests when controlling for ASE variance, a metric that measures constraint on gene expression developed by Starr et al. Genes were split into equal size bins based on ASE variance values. Genes in the 0–20% bin are the most constrained while genes in the 80–100% bin are the least constrained. Significance (using the Wald test) is indicated by asterisks where *** indicates p<0.005, ** indicates p<0.01, and * indicates p<0.05. (b) The same as in (a) but excluding SKM.
Figure 2—figure supplement 7
Controlling for probability of haploinsufficiency (pHI) generally does not eliminate enrichment of ASE genes in cell type-specifically expressed genes.
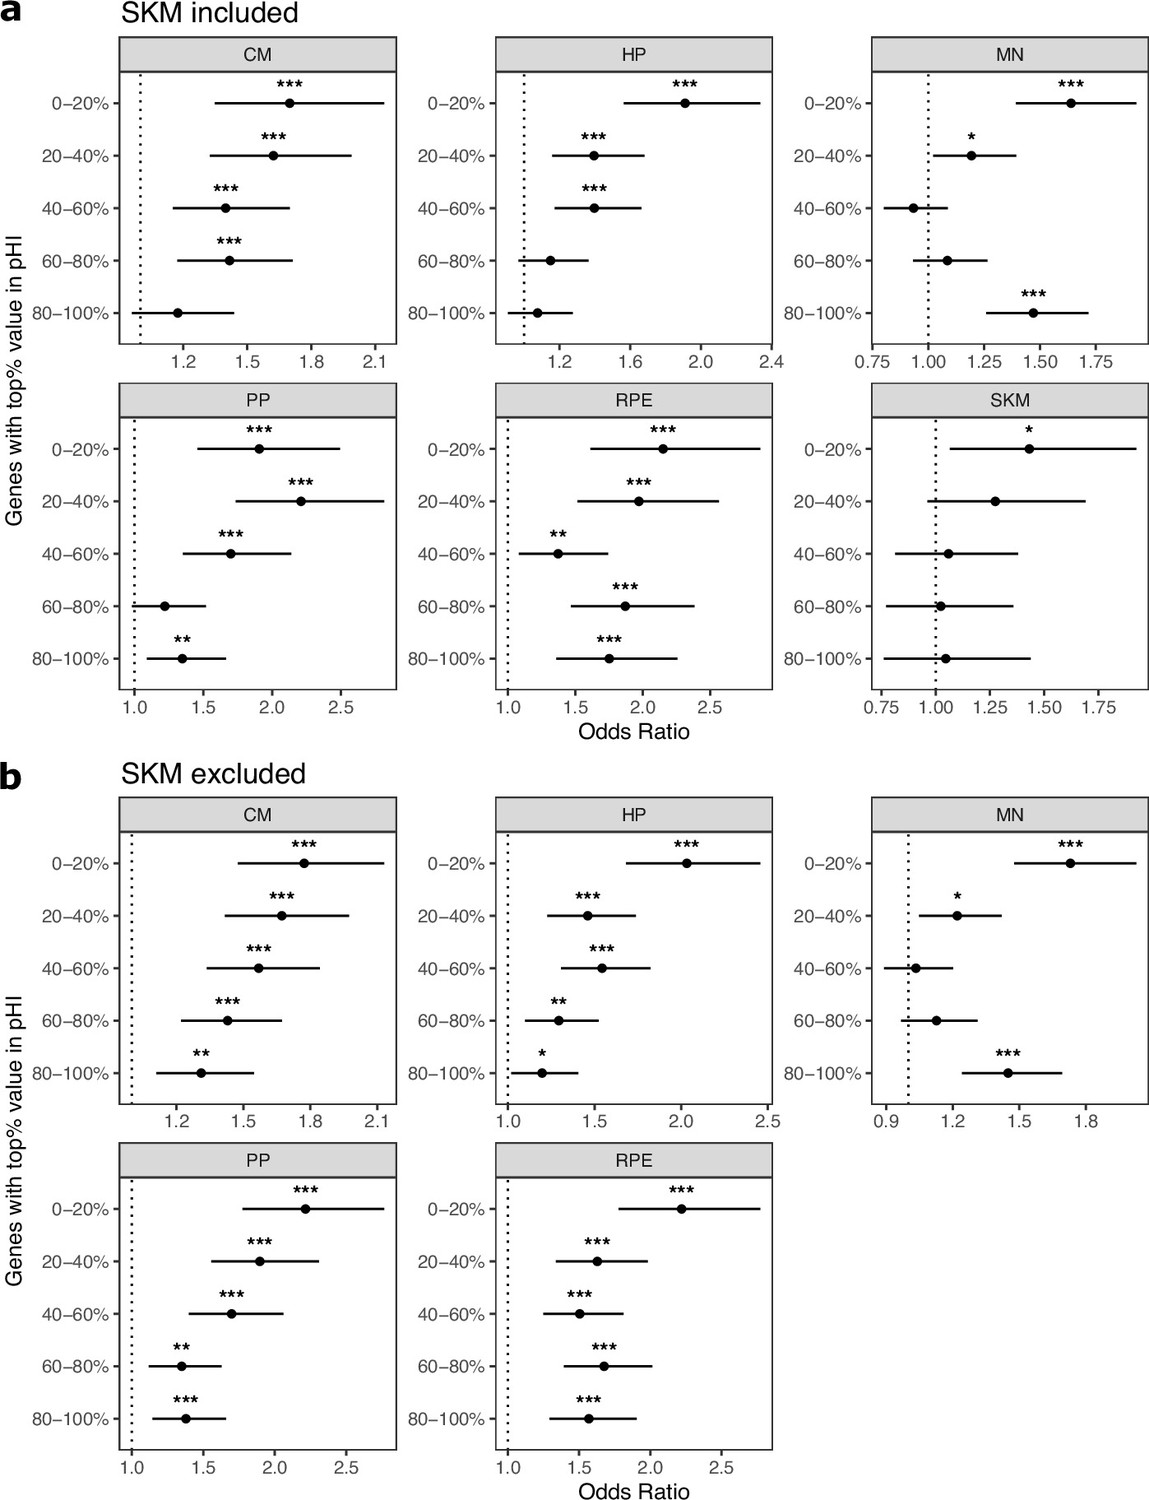
(a) Enrichment tests when controlling for the probability of haploinsufficiency score (pHI) score. Genes were split into equal size bins based on the pHI values. Genes in the 80–100% bin are the most constrained while genes in the 0–20% bin are the least constrained. Significance (using the Wald test) is indicated by asterisks where *** indicates p<0.005, ** indicates p<0.01, and * indicates p<0.05. (b) The same as in (a) but excluding SKM.
Figure 2—figure supplement 8
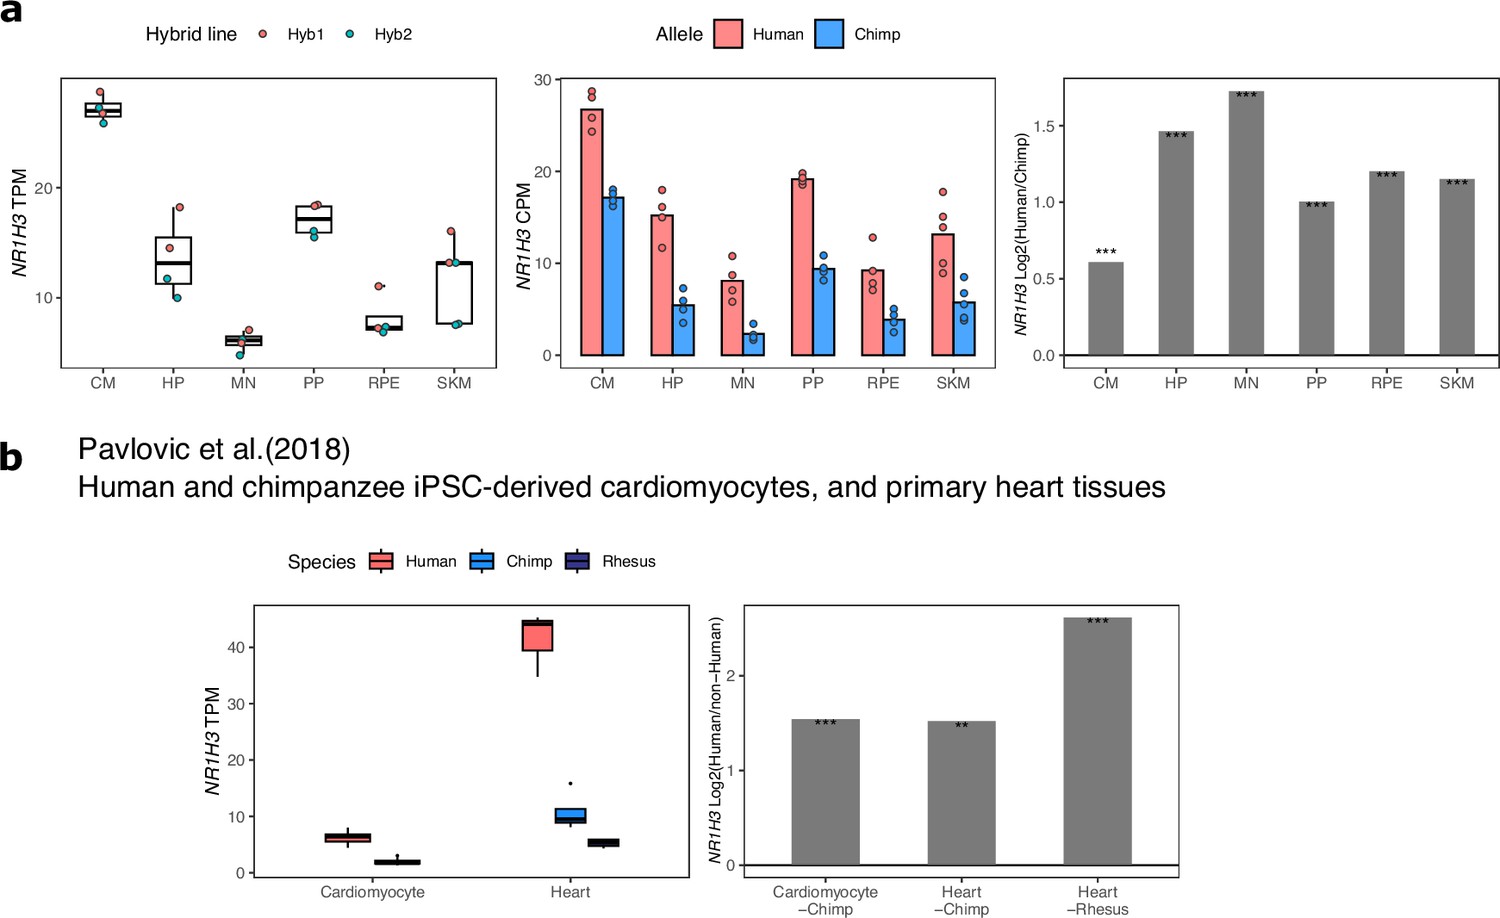
Validation of increased NR1H3 expression in the human lineage.
(a) TPM, allelic CPM, and log2 fold-change estimated by DESeq2 across cell types in our dataset for NR1H3. Significance (using the DESeq2 likelihood ratio test) is indicated by asterisks where *** indicates FDR <0.005, ** indicates FDR <0.01, and * indicates FDR <0.05. (b) NR1H3 expression and estimated log fold-change in human and chimpanzee cardiomyocytes and human, chimpanzee, and rhesus macaque adult heart tissue. These results indicate that the increase in NR1H3 expression occurred on the human lineage.
Figure 2—figure supplement 9
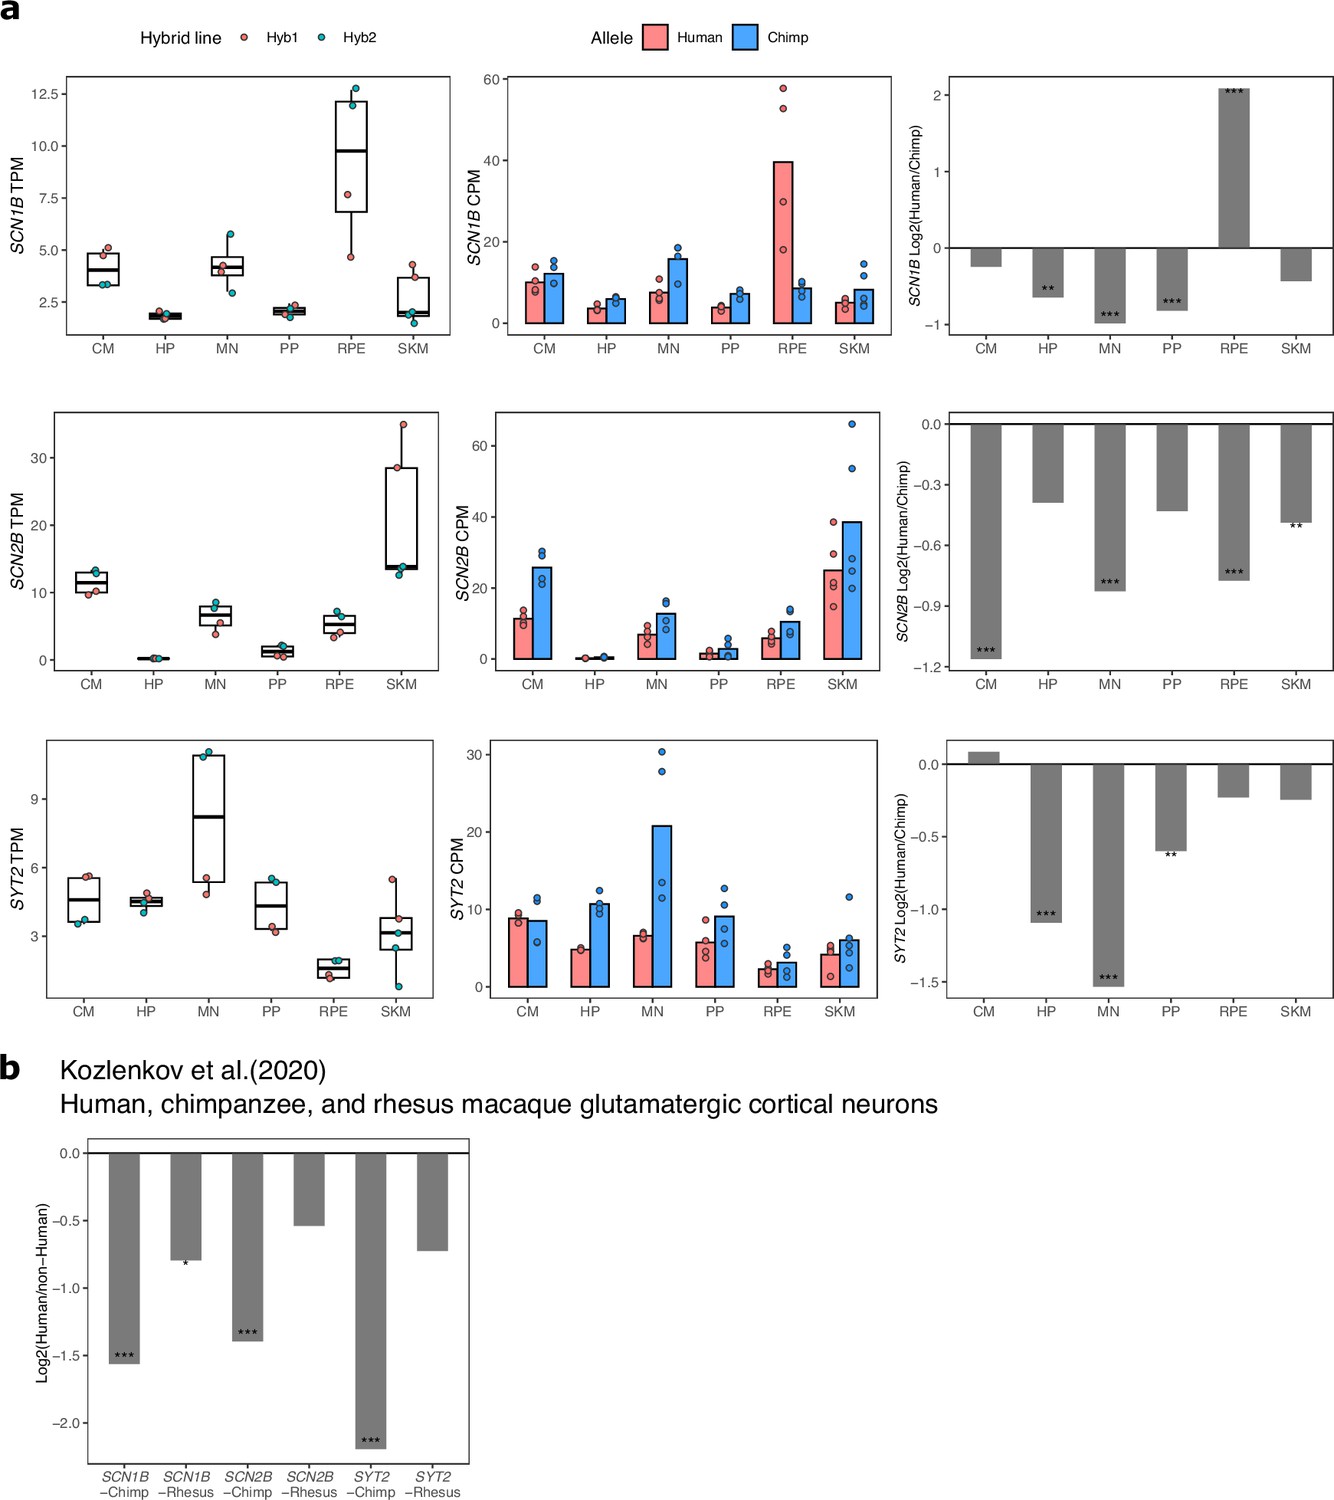
ASE and differential expression of SCN1B, SCN2B, and SYT2 across cell types.
(a) TPM, allelic CPM, and log2 fold change estimated by DESeq2 for SCN1B, SCN2B, and SYT2 across cell types in our dataset. Significance (using the DESeq2 likelihood ratio test) is indicated by asterisks where *** indicates FDR <0.005, ** indicates FDR <0.01, and * indicates FDR <0.05. (b) Log2 fold-changes and FDR for SCN1B, SCN2B, SYT2 in cortical glutamatergic neurons as computed by Kozlenkov et al., 2020.
Figure 3 with 21 supplements
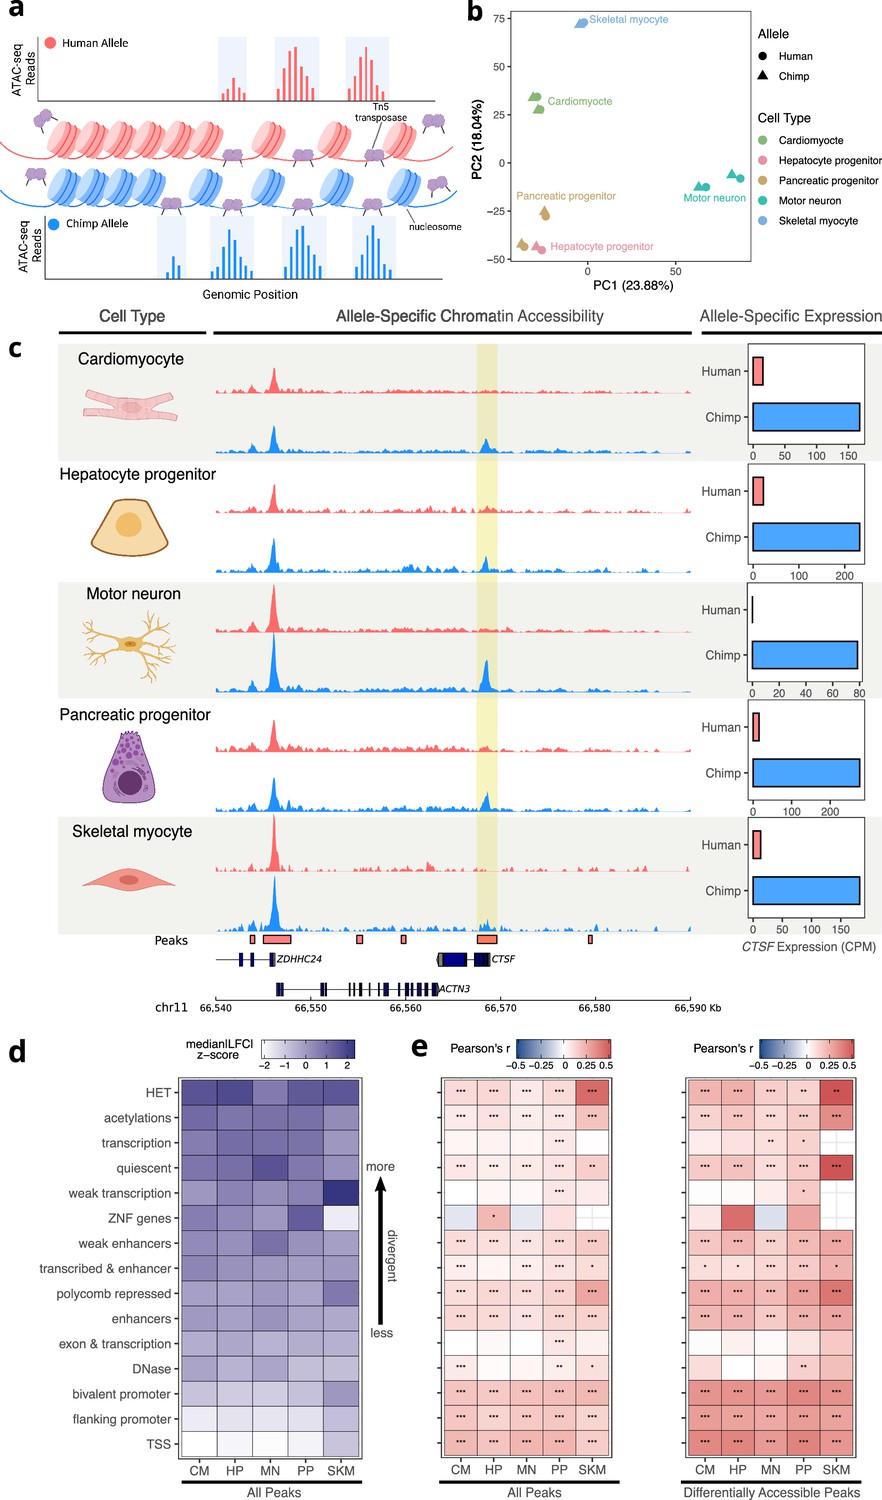
Allele-specific chromatin accessibility across diverse human-chimpanzee hybrid cell types.
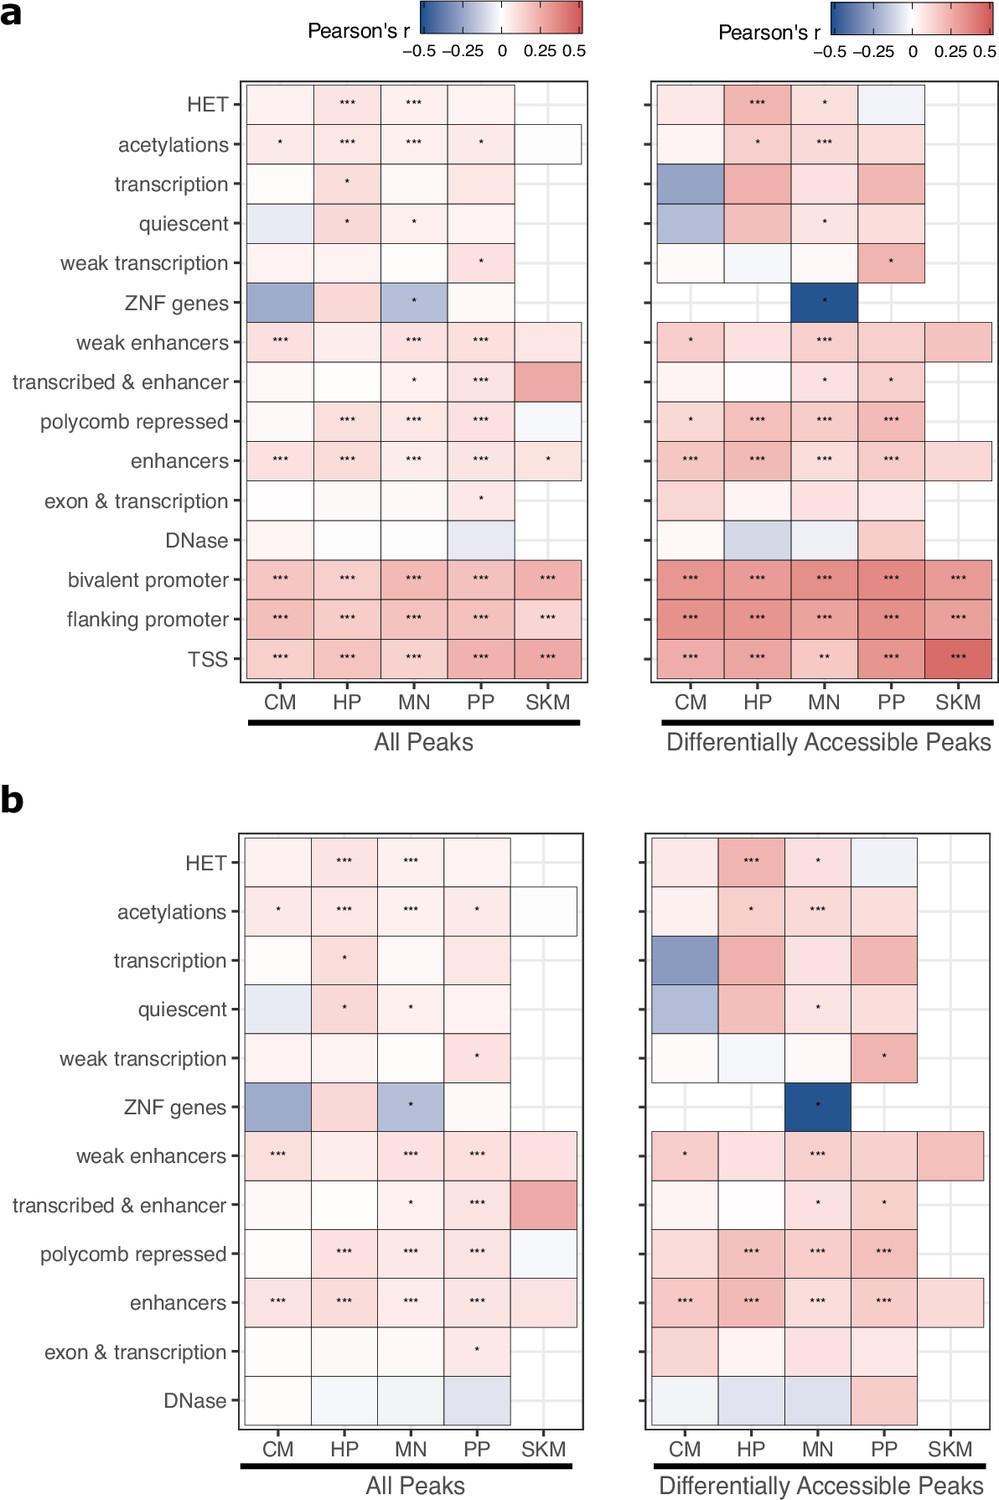
(a) Schematic outlining the ATAC-seq protocol. A hyperactive transposase cleaves accessible DNA and adds adapters enabling measurement of chromatin accessibility. (b) PCA on normalized allelic counts from ATAC-seq. (c) ASCA in the promoter of CTSF, and ASE for the CTSF gene. (d) Differences in ASCA were quantified and plotted separately based on chromHMM annotation. The order is based on the median of z-score transformed absolute log fold-change between human and chimpanzee across all cell types, with higher z-scores indicating greater divergence in accessibility. (e) Pearson correlation between ASE and ASCA for all cell types with all peaks (left) or only differentially accessible peaks (right, defined as peaks with nominal binomial p-value less than 0.05). Pearson’s r values are shown in the heatmap and significance is indicated by asterisks where *** indicates p<0.005, ** indicates p<0.01, and * indicates p<0.05. Zero asterisks (i.e. a blank box) indicates p>0.05.
© 2024, Wang et al. Figure 3a was created using BioRender, and is published under a CC BY-NC-ND 4.0 license. Further reproductions must adhere to the terms of this license.
Figure 3—figure supplement 1
Sequencing depth in the ATAC-seq dataset.
Raw read counts from fastq files are shown. CM, MN, and PP have two replicates. ATAC: assay for transposase accessible chromatin.
Figure 3—figure supplement 2

Number of CREs identified in each cell type.
ATAC-seq peaks from each cell type were categorized as ‘Promoter’ and ‘Non-Promoter CRE’ based on whether peaks overlapped with a TSS (see Methods). The high number in MN and low number in SKM are likely due to sequencing depth differences.
Figure 3—figure supplement 3
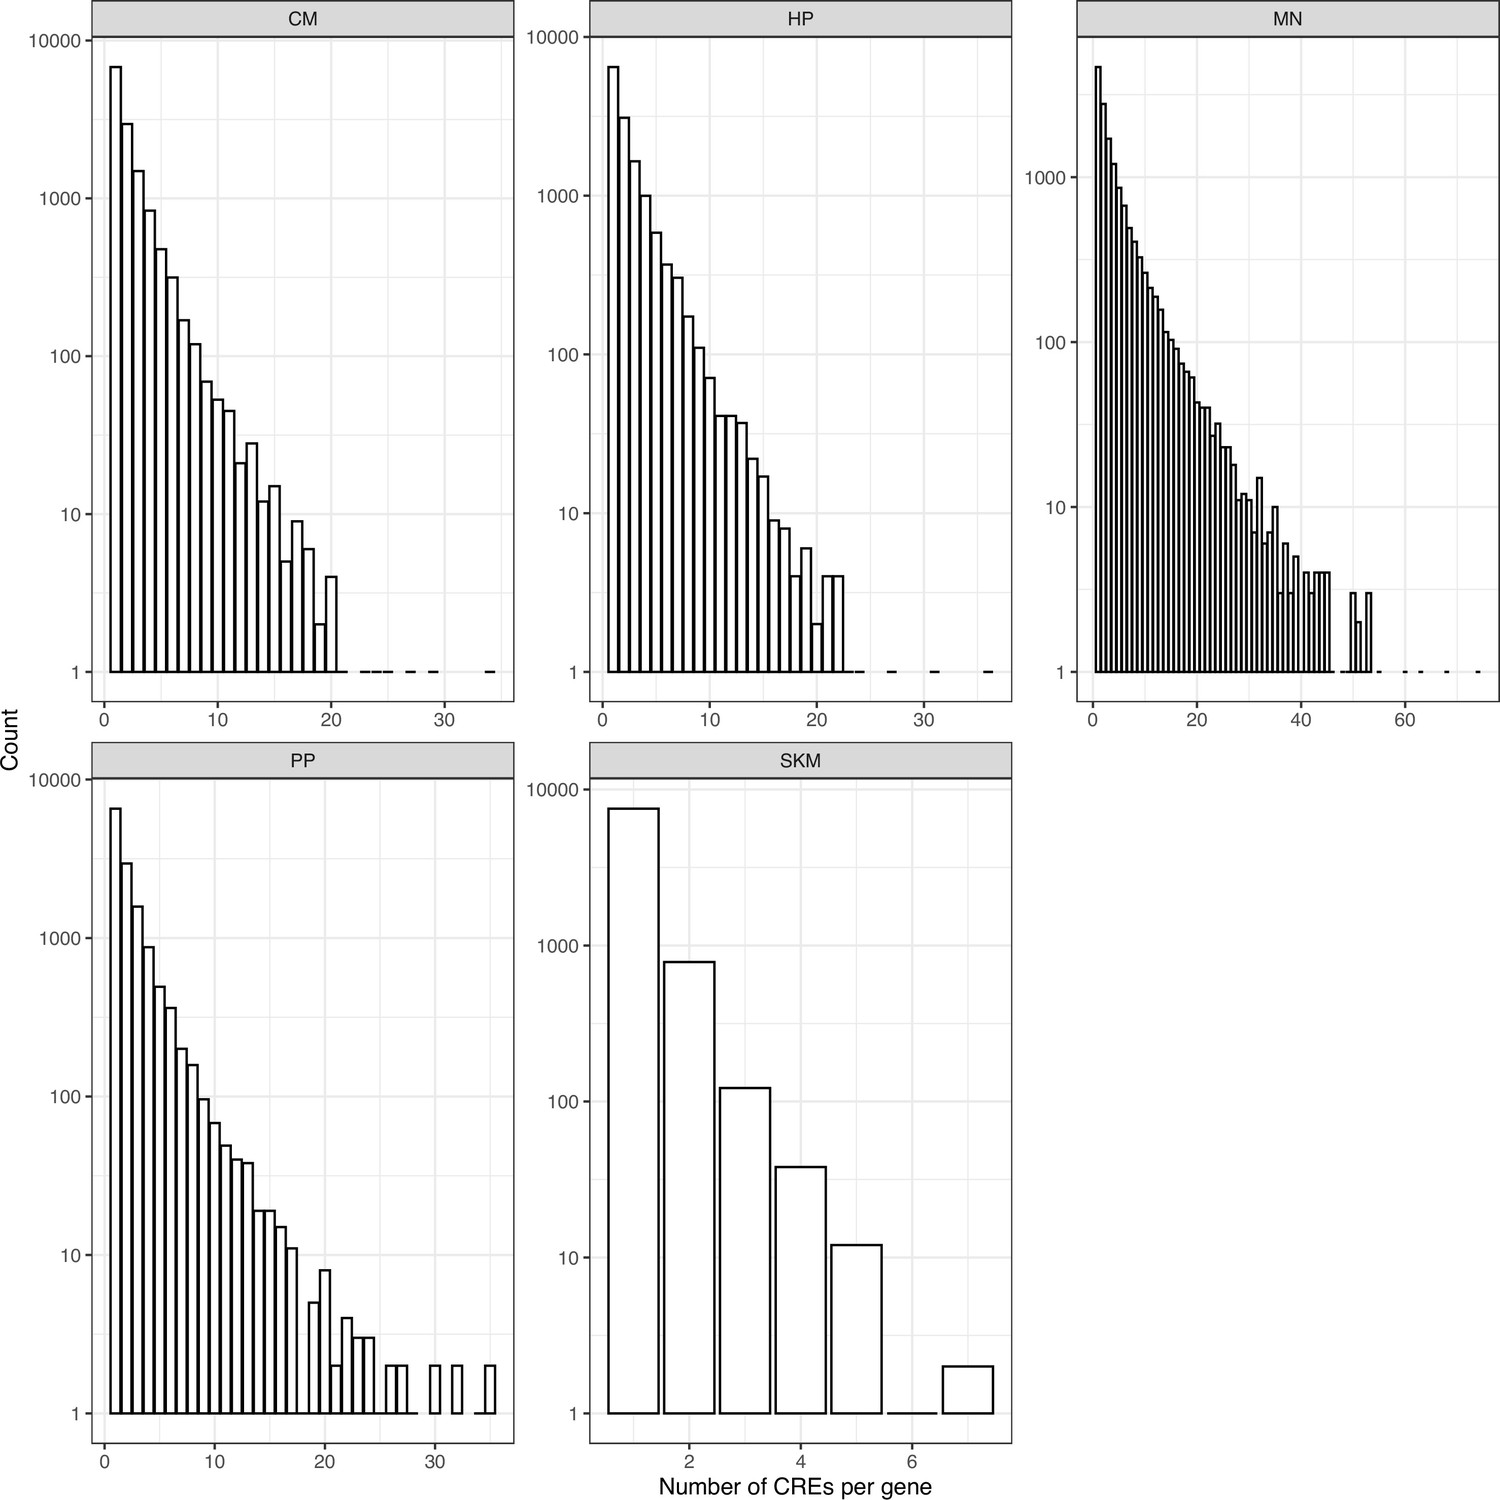
Number of CREs per gene identified in each cell type.
ATAC-seq peaks were assigned to the closest gene. The histogram of the number of CREs per gene is shown and note the y axis is on log scale.
Figure 3—figure supplement 4

Heatmap and clustering of ATAC-seq samples.
Heatmap and result of hierarchical clustering performed on normalized allelic counts for the ATAC-seq dataset. Samples primarily clustered by cell type except HP and PP which clustered by allele. H: human; C: chimp.
Figure 3—figure supplement 5

PCA of HP and PP ATAC-seq samples only.
Cell types are clearly separated by PC1 and species were clearly separated by PC2.
Figure 3—figure supplement 6
PCA separates the human and chimpanzee alleles in the ATAC-seq data.
PCA on allelic counts from ATAC-seq for each cell type that had more than one replicate is shown. Species are clearly separated by PC1 or PC2 when PCA was performed on each cell type.
Figure 3—figure supplement 7
ASCA predicts ASE across a variety of epigenetic states.
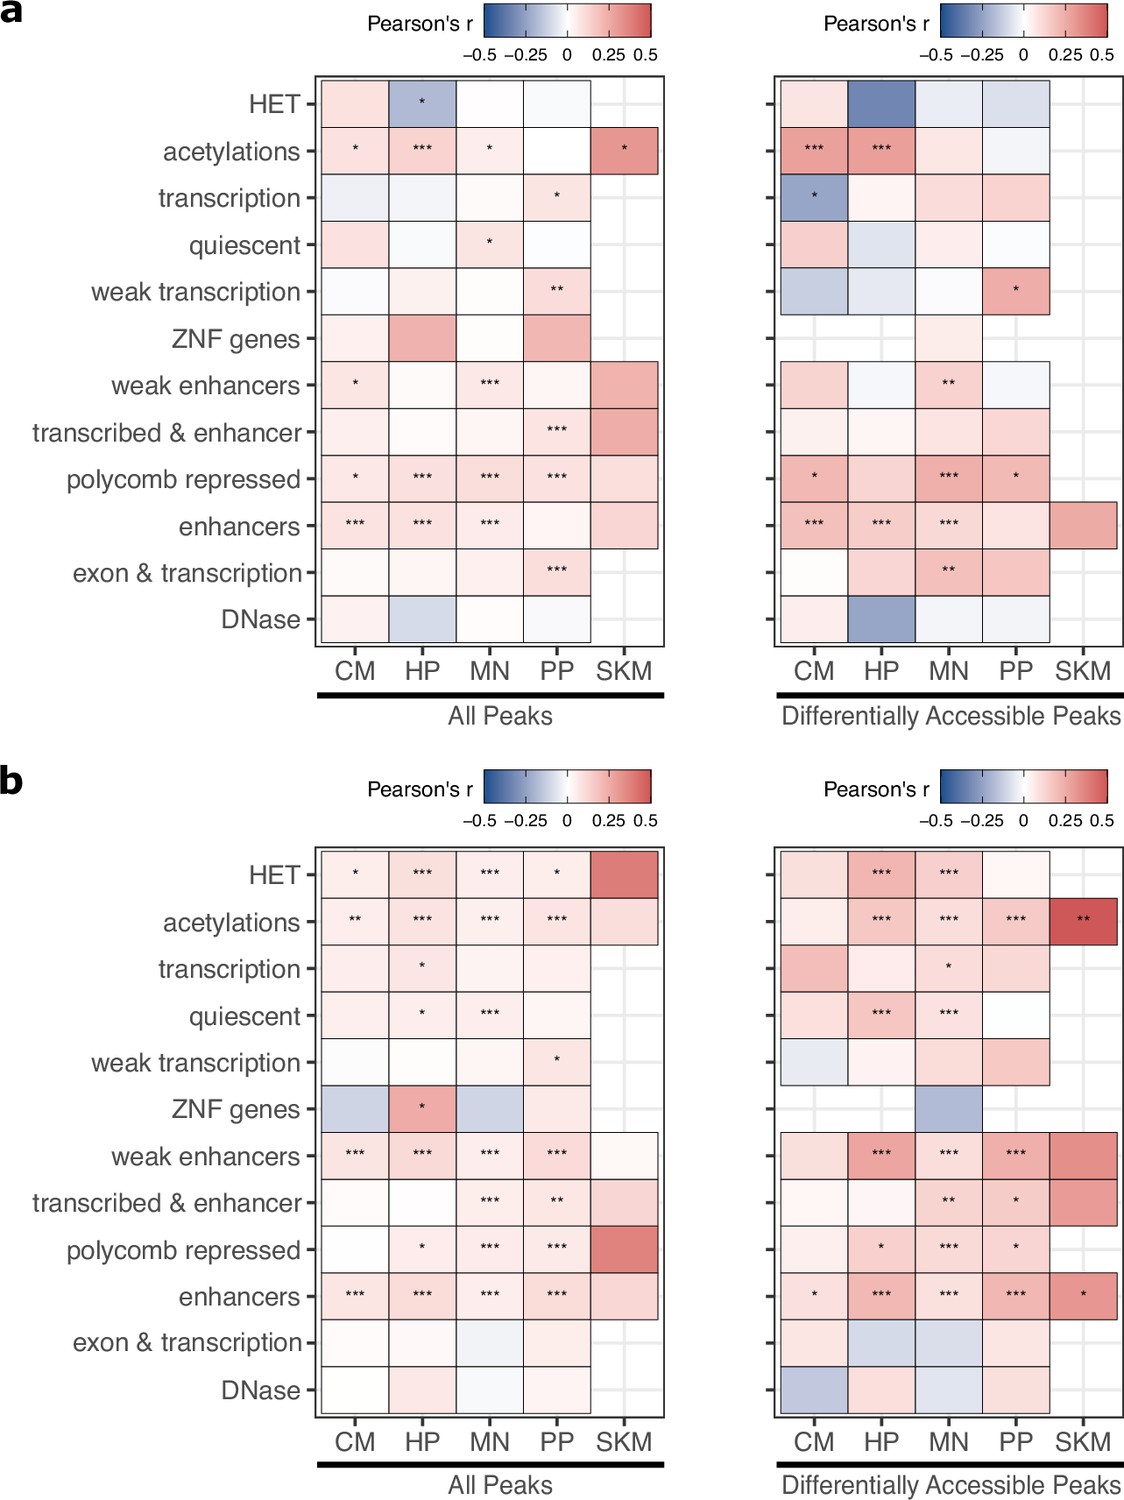
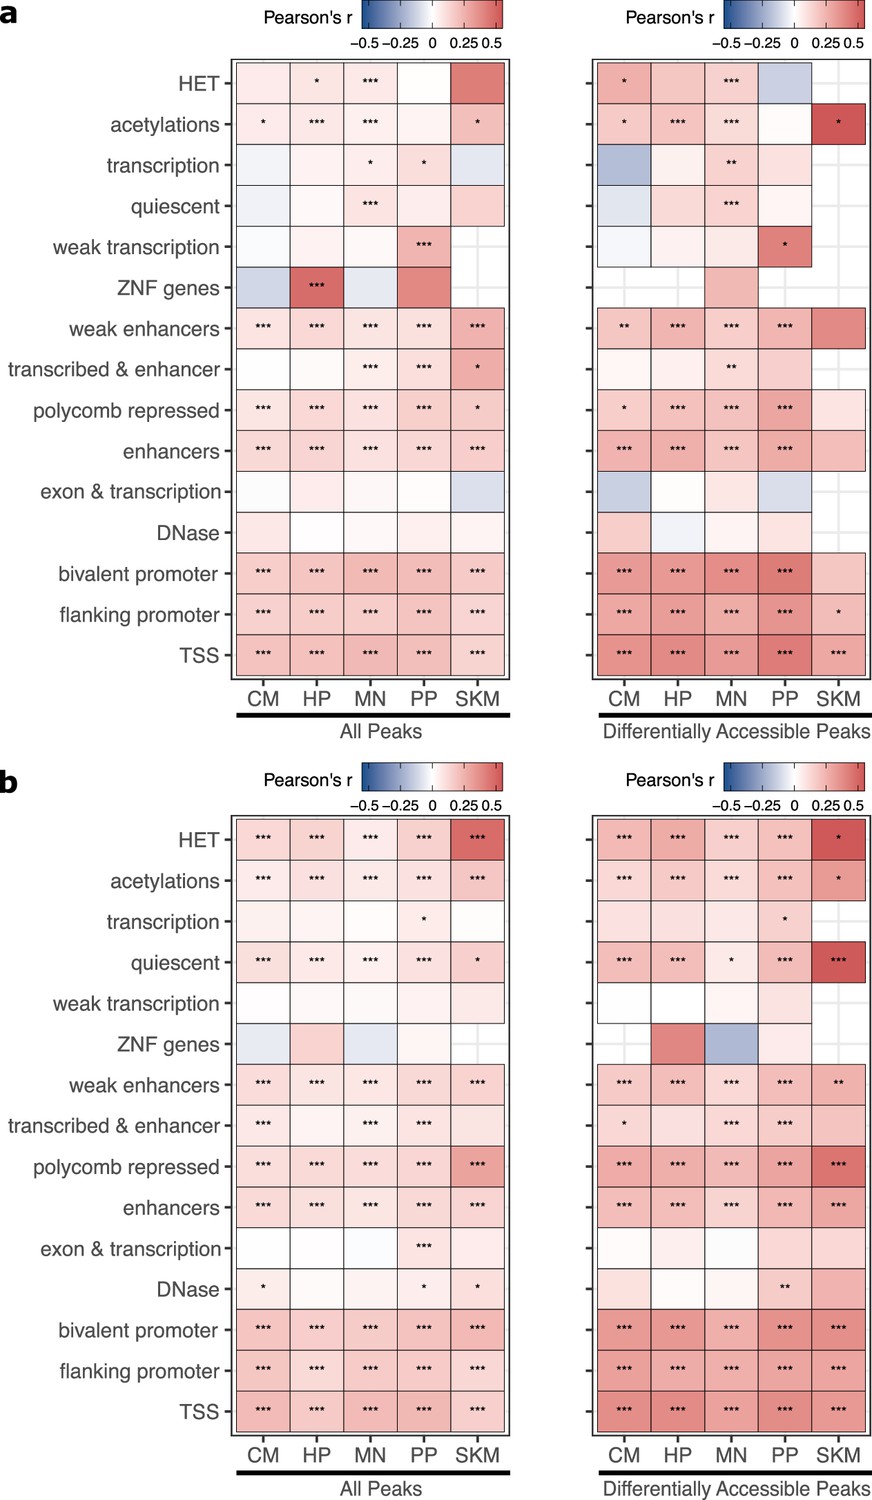
(a) Correlation between allele-specific chromatin accessibility (ASCA) and ASE the set of peaks assigned to each chromHMM state. Each peak was assigned to only the state that overlapped the largest proportion of the peak. Significance is indicated by asterisks where *** indicates p<0.005, ** indicates p<0.01, and * indicates p<0.05. (b) The same as in (a) but with peaks overlapping any promoter-related states (bivalent promoter, flanking promoter, and TSS) removed.
Figure 3—figure supplement 8
ASE and ASCA correlations for TSS-proximal and distal CREs.
Similar to Figure 3e except peaks were separated into (a) distance to assigned gene ≤ 30 kb, (b) distance to assigned gene >30 kb. Significance is indicated by asterisks where *** indicates p<0.005, ** indicates p<0.01, and * indicates p<0.05.
Figure 3—figure supplement 9
ASE and ASCA correlation for cell-type-specific and ubiquitously expressed genes.
Similar to Figure 3e except genes and corresponding peaks were separated into (a) cell-type-specific genes (see Methods) and (b) ubiquitously expressed genes. Significance is indicated by asterisks where *** indicates p<0.005, ** indicates p<0.01, and * indicates p<0.05.
Figure 3—figure supplement 10

Down-sampling eliminates sequencing depth-induced bias in the number of peaks called in each cell type.
(a) Number of peaks called in each cell type and number of common peaks shared among cell types. MN has the largest number of peaks and the largest number of unique peaks primarily because the samples from MN were sequenced the most deeply. (b) The same as in (a) using a down-sampled dataset so that all cell types have the same read depth. In this case, peaks shared across all cell types make up a much larger proportion of the total number of peaks.
Figure 3—figure supplement 11

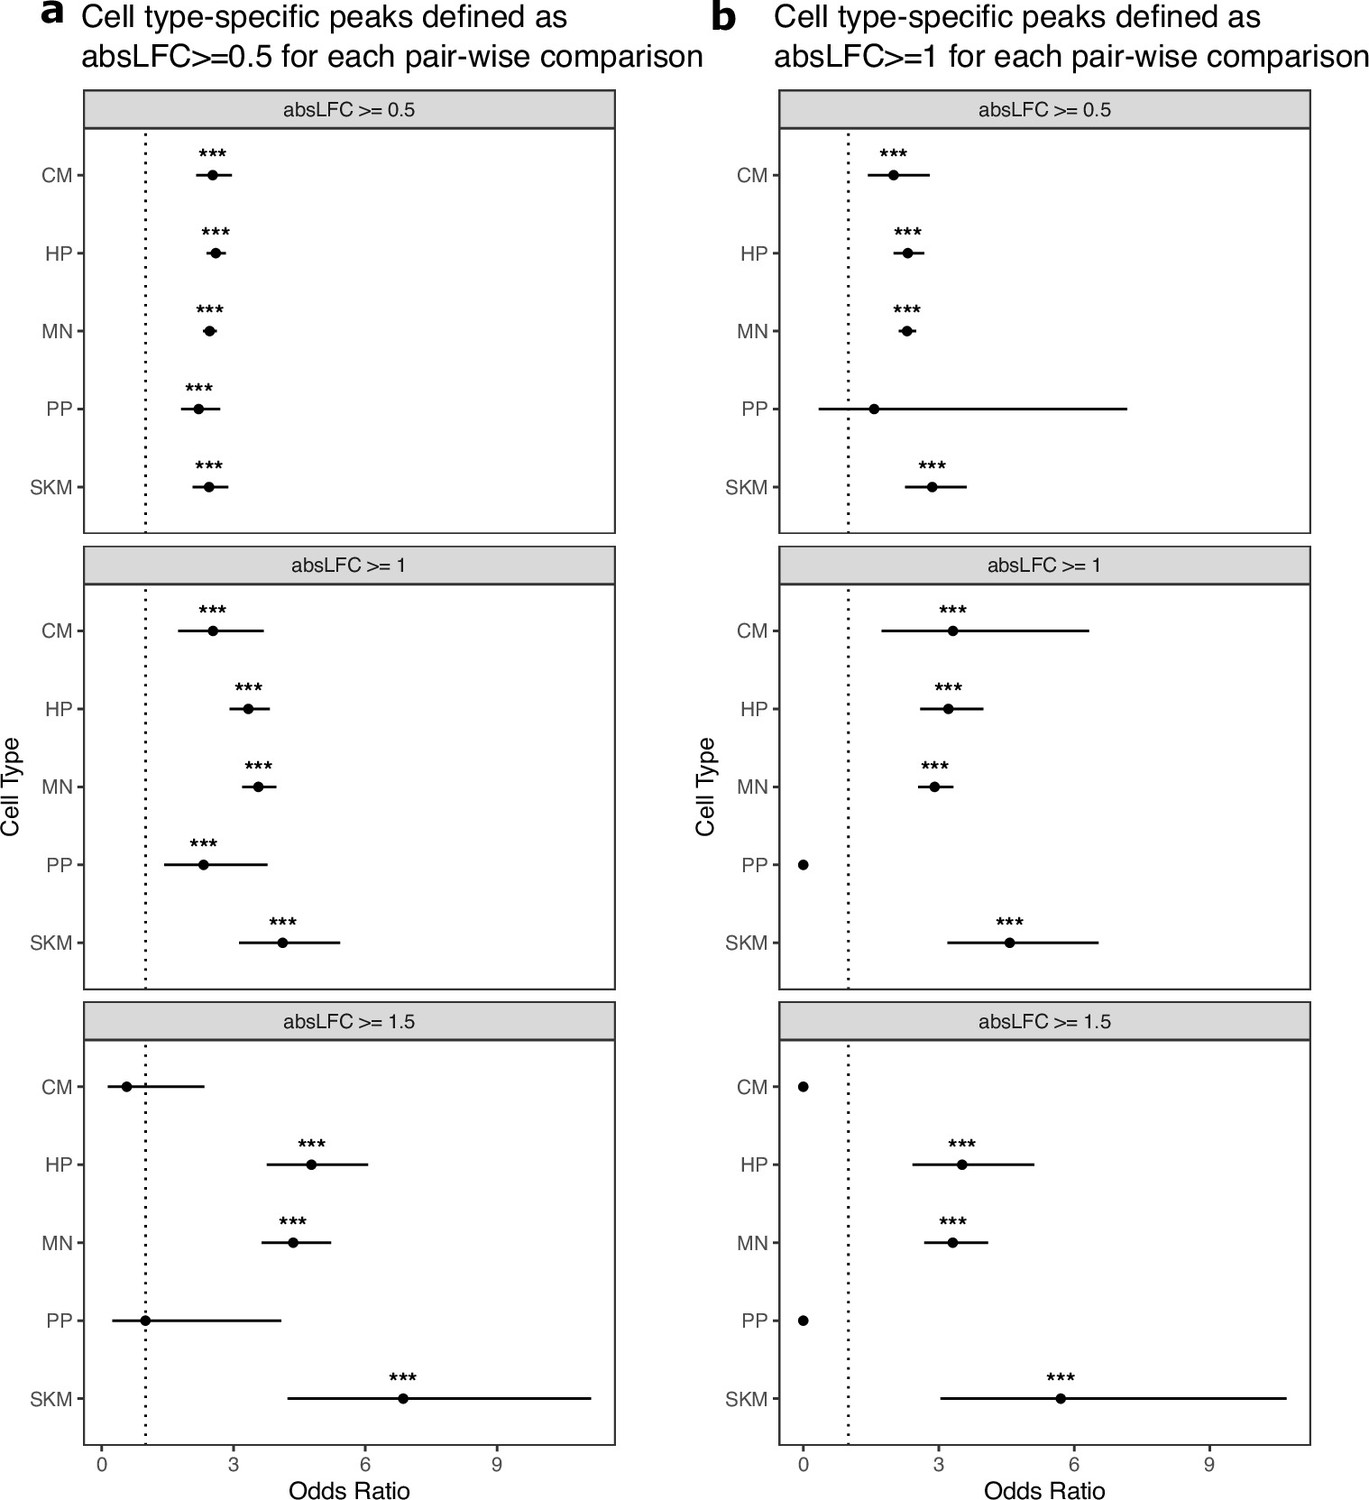
Cell-type-specific ATAC-seq peaks are enriched for ASCA across log fold-change cutoffs.
(A) Testing if cell-type-specific peaks are enriched for peaks showing ASCA. Cell-type-specific peaks were defined as peaks only called in that cell type, and peaks showing ASCA are defined using different absolute log fold-change cutoffs. Significance (using the Wald test) is indicated by asterisks where *** indicates p<0.005, ** indicates p<0.01, and * indicates p<0.05. (b) The same as in (a) but with down-sampled data.
Figure 3—figure supplement 12

Cell-type-specific ATAC-seq peaks are generally enriched for ASCA across p-value cutoffs.
(a) Testing if cell-type-specific peaks are enriched for peaks showing ASCA using p-value cutoffs. Cell-type-specific peaks were defined as peaks only called in that cell type and peaks showing ASCA were defined using different binomial test p-value cutoffs. The read counts from the human and chimpanzee alleles are used as input to the binomial test. Significance (using the Wald test) is indicated by asterisks where *** indicates p<0.005, ** indicates p<0.01, and * indicates p<0.05. (b) The same is in (a) but with down-sampled data.
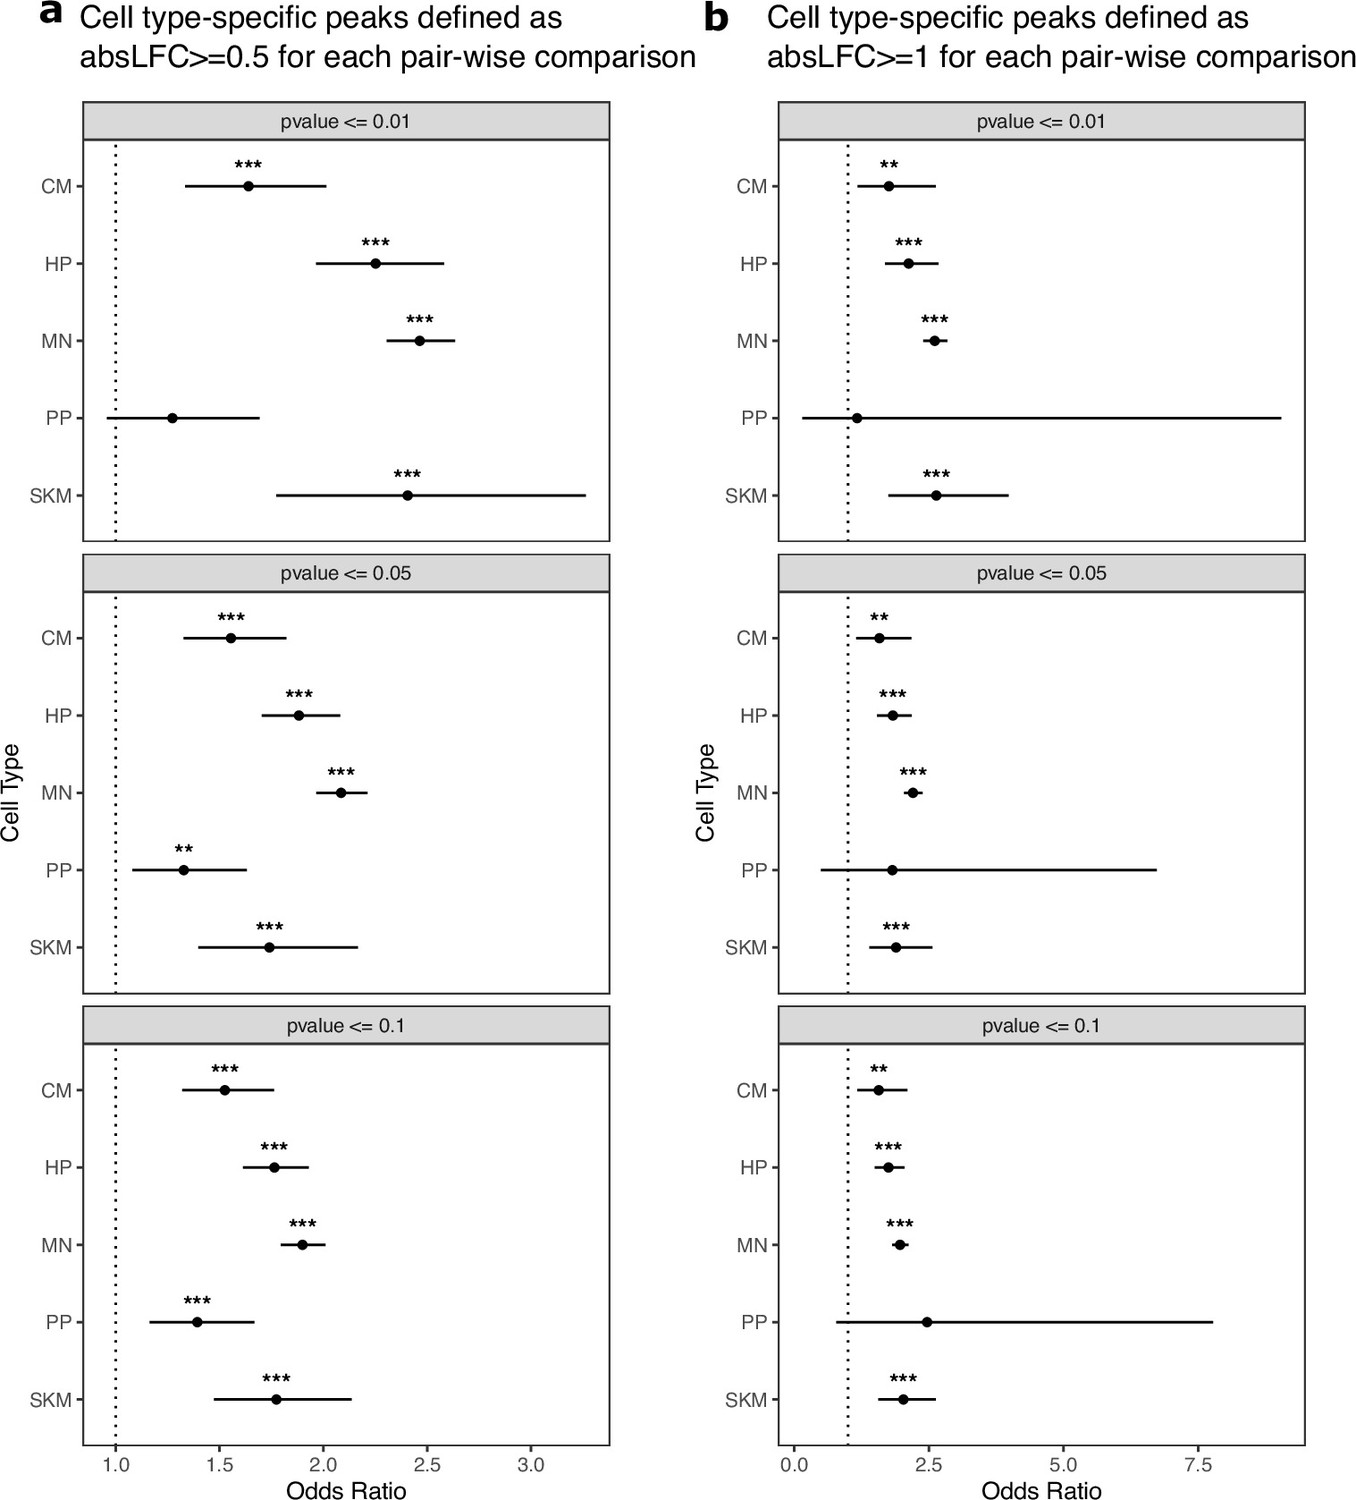
Figure 3—figure supplement 13
Cell-type-specific ATAC peaks are enriched for ASCA using a broader definition of cell-type-specific.
(a) We defined cell-type-specific peaks more broadly as peaks which are differentially accessible between this cell type and all others (i.e. absolute log fold-change greater than 0.5 across all pairwise comparisons between a cell type and all other cell types). Peaks with significant ASCA are defined using different absolute log fold-change cutoffs. All tests were performed on down-sampled data. Significance (using the Wald test) is indicated by asterisks where *** indicates p<0.005, ** indicates p<0.01, and * indicates p<0.05. (b) The same as in (a) but using an absolute log fold-change cutoff of 1 to define cell-type-specific ATAC peaks.
Figure 3—figure supplement 14
Cell-type-specific ATAC peaks are enriched for ASCA using a broader definition of cell-type-specific.
(a) We defined cell-type-specific peaks more broadly as peaks which are differentially accessible between this cell type and all others (i.e. absolute log fold-change greater than 0.5 across all pairwise comparisons between a cell type and all other cell types). Peaks with significant ASCA are defined using different p-value cutoffs from the binomial test applied to human and chimpanzee allelic counts. All tests were performed on down-sampled data. Significance (using the Wald test) is indicated by asterisks where *** indicates p<0.005, ** indicates p<0.01, and * indicates p<0.05. (b) The same as in (a) but using an absolute log fold-change cutoff of 1 to define cell-type-specific ATAC peaks.
Figure 3—figure supplement 15

Cell-type-specific ATAC peaks are generally enriched for ASCA regardless of sequence constraint.
Testing if cell-type-specific peaks are enriched for peaks showing ASCA when stratifying by conservation of genomic regions. Genes were split into equal size bins based on the maximum z-score value (maxZ), a metric for constraint based on comparing the observed number of mutations in a region to the expected number of mutations in a large set of whole genome sequencing samples from humans. Peaks in the 0–20% bin are the least constrained whereas peaks in the 80–100% bin are the most constrained. Cell-type-specific peaks were defined as peaks only called in that cell type, and differentially accessible peaks are defined as those with an absolute log fold-change greater than or equal to 0.5. Significance (using the Wald test) is indicated by asterisks where *** indicates p<0.005, ** indicates p<0.01, and * indicates p<0.05.
Figure 3—figure supplement 16

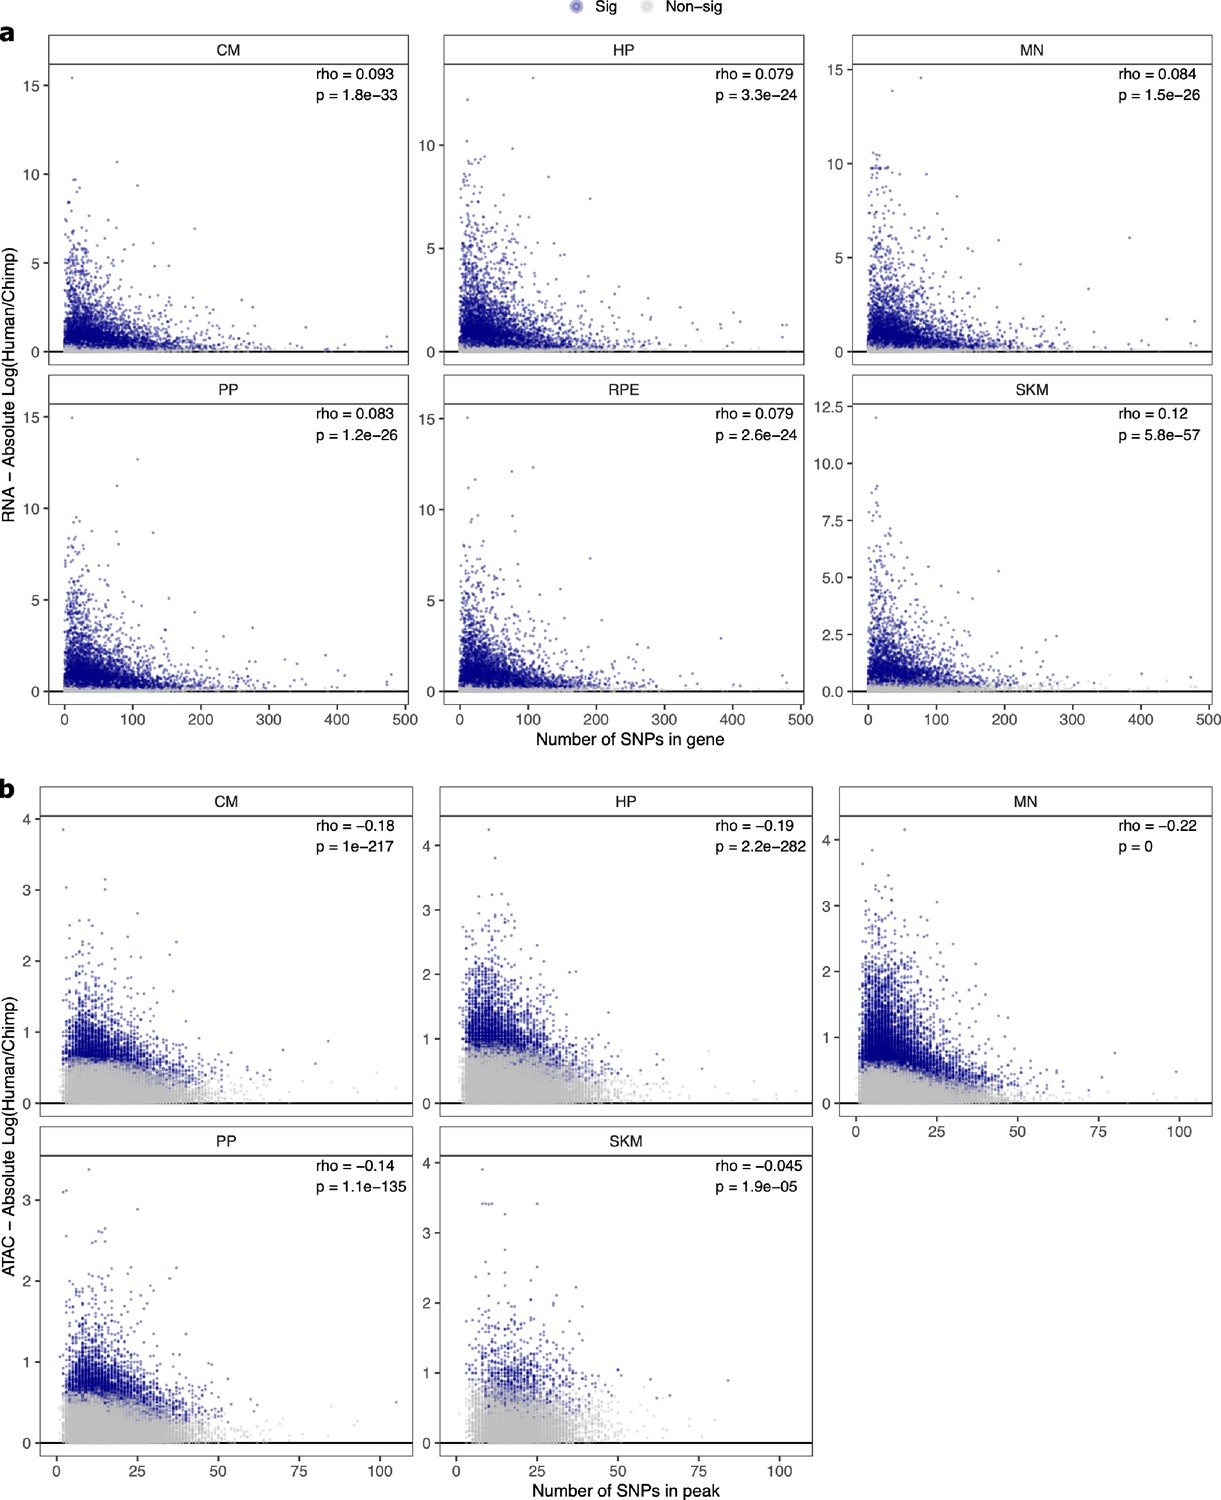
Relationship between number of SNPs and -log10(FDR) in (a) ASE and -log10(p-value) (b) ASCA.
These scatter plots show the relationship between the number of SNPs in a gene or peak and the -log10(FDR) for ASE or ASCA. Genes with significant ASE (FDR <0.05) and peaks with significant ASCA (binomial P-value <0.05) were annotated as blue dots, and all other genes and peaks were annotated as gray dots. All genes in each cell type in RNA-seq are shown. For clarity, the few outlier peaks with more than 200 SNPs are excluded from these plots.
Figure 3—figure supplement 17
Relationship between number of SNPs and absolute log2 fold-change in (a) ASE and (b) ASCA.
These scatter plots show the relationship between the number of SNPs in a gene or peak and the estimated absolute log2 fold-change for ASE or ASCA. Genes with significant ASE (FDR <0.05) and peaks with significant ASCA (binomial p-value <0.05) were annotated as blue dots, and all other genes and peaks were annotated as gray dots. All genes in each cell type in RNA-seq are shown. For clarity, the few outlier peaks with more than 200 SNPs are excluded from these plots.
Figure 3—figure supplement 18
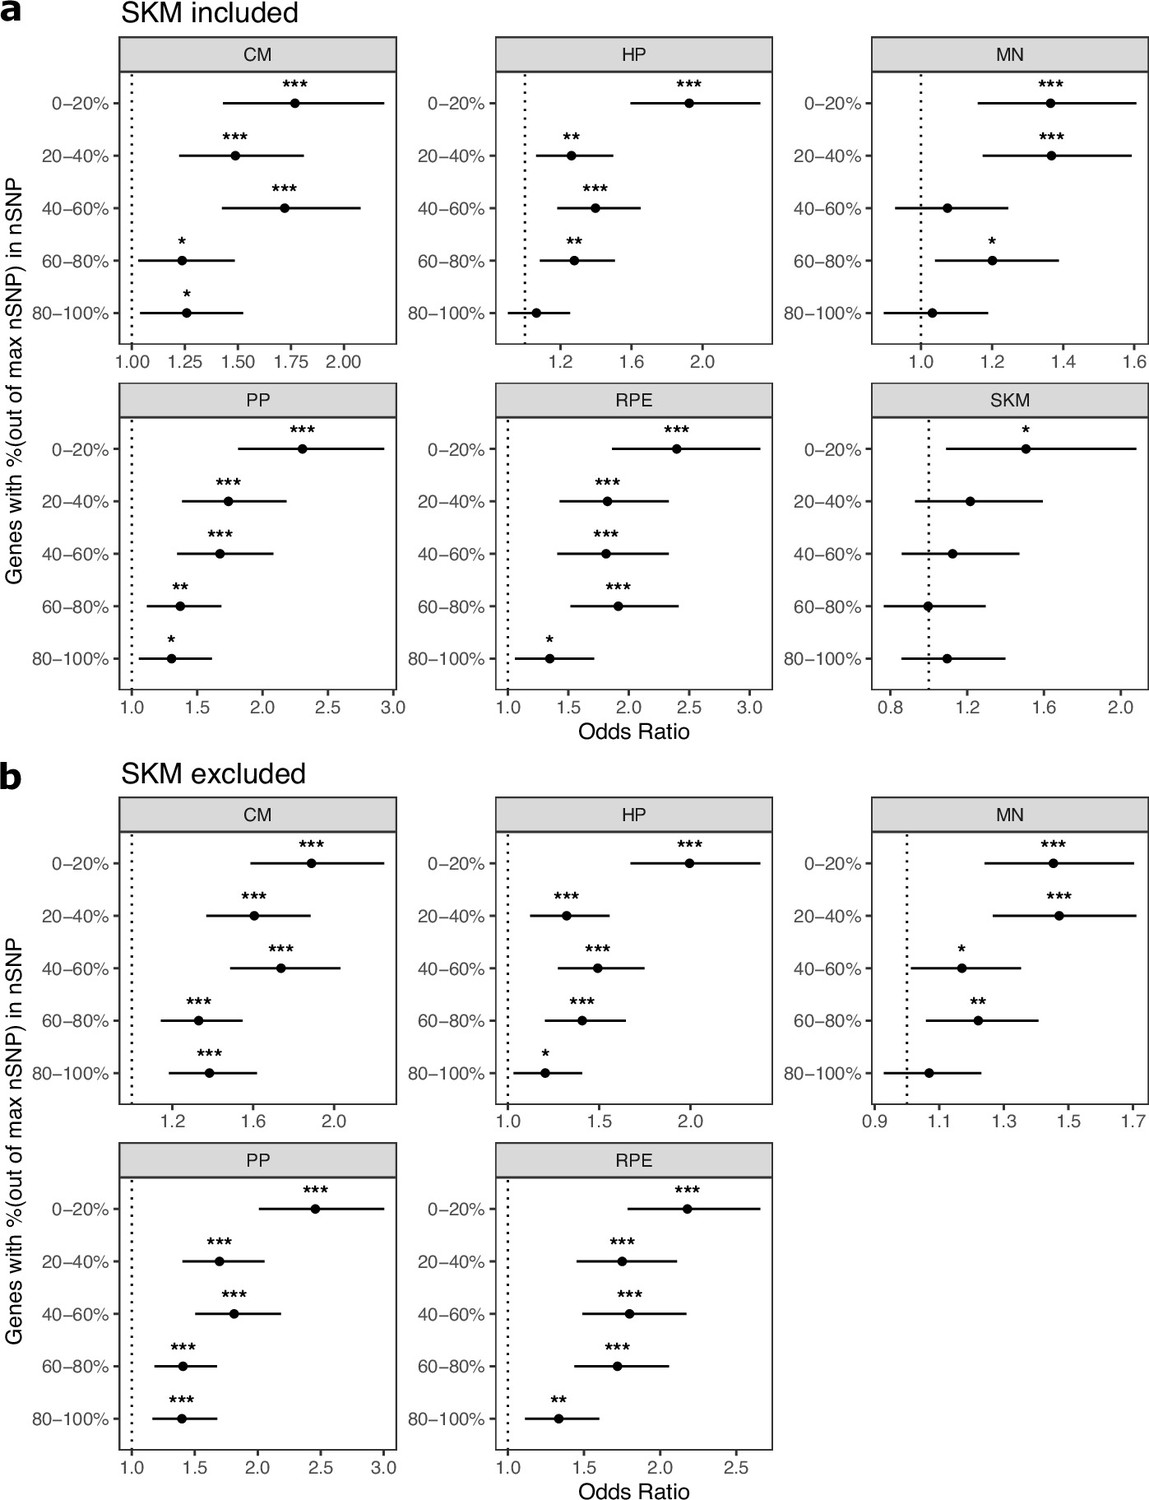
Cell type-specifically expressed genes are enriched for genes with ASE when stratifying by the number of SNPs per gene.
(a) Results when SKM is included. Genes were put into five bins with an equal number of genes in each bin. Genes with the fewest SNPs are in the 0–20% bin and genes with the most SNPs are in the 80–100% bin. Significance (using the Wald test) is indicated by asterisks where *** indicates p<0.005, ** indicates p<0.01, and * indicates p<0.05. (b) The same as in (a) but excluding SKM.
Figure 3—figure supplement 19
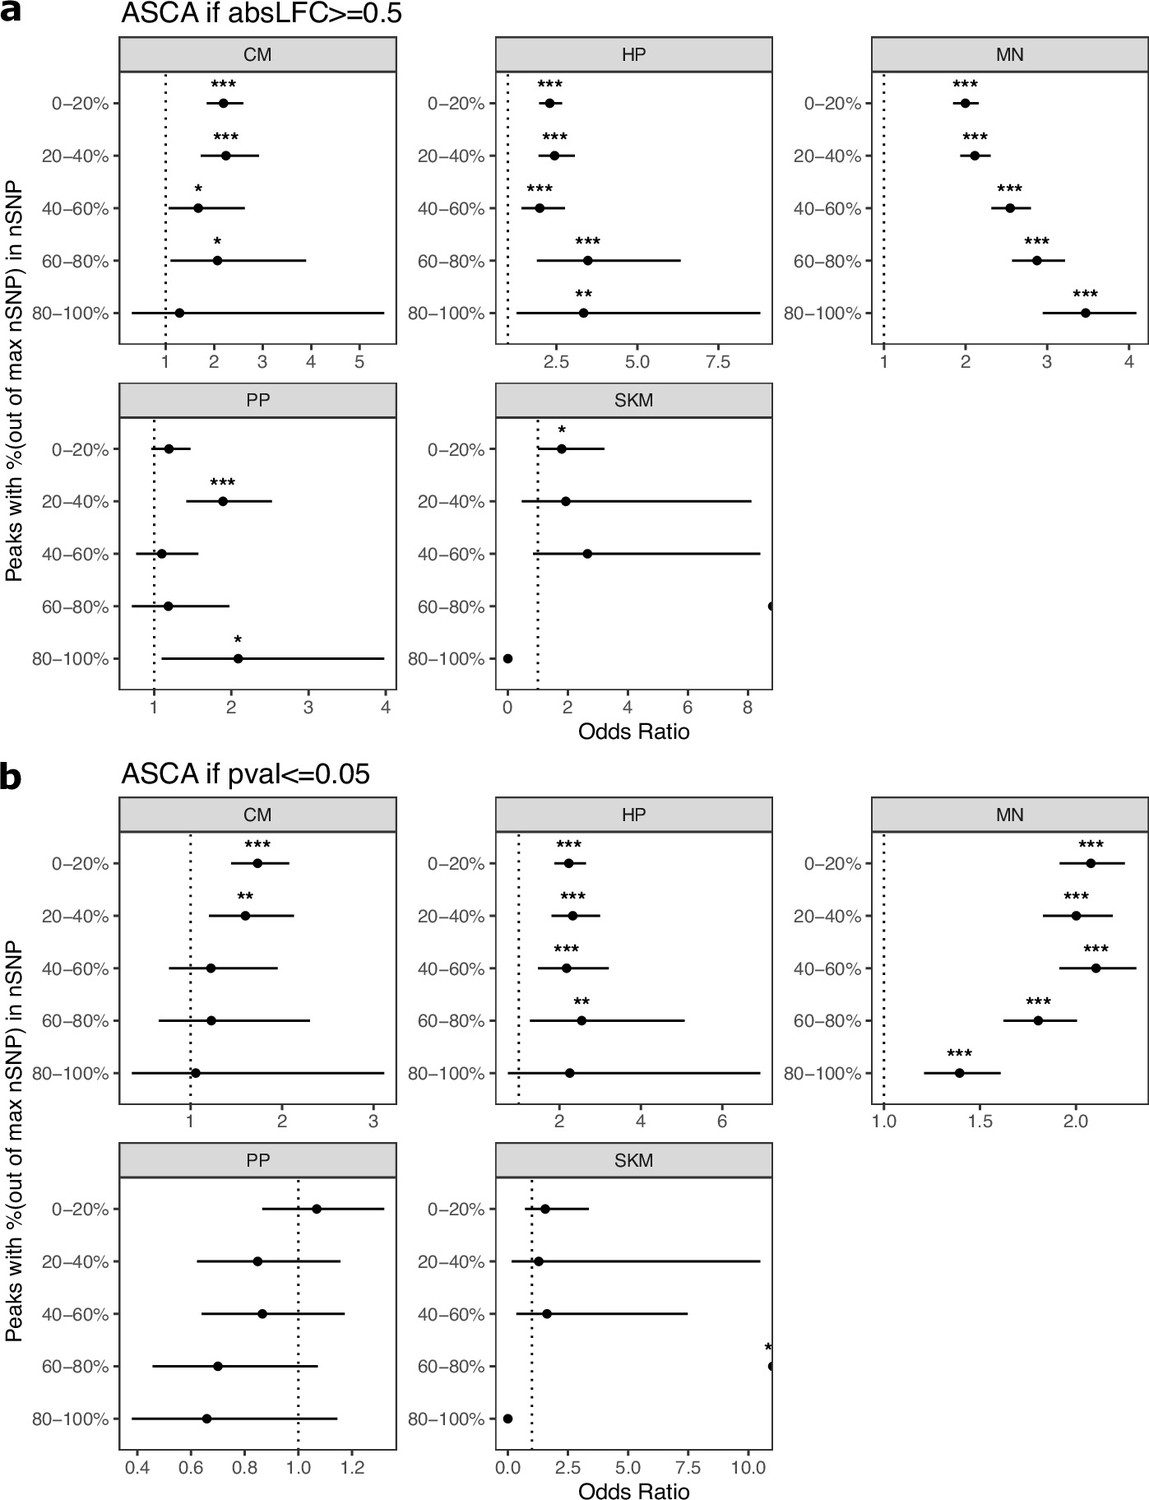
Cell-type-specific peaks are enriched for ASCA when stratifying by the number of SNPs per peak.
(a) Peaks with an absolute log2 fold-change greater than or equal to 0.5 were called as having ASCA. Peaks were put into five bins with an equal number of peaks in each bin. Peaks with the fewest SNPs are in the 0–20% bin and genes with the most SNPs are in the 80–100% bin. Significance (using the Wald test) is indicated by asterisks where *** indicates p<0.005, ** indicates p<0.01, and * indicates p<0.05. (b) The same as in (a) but peaks with a binomial p-value less than or equal to 0.05 were called as having ASCA.
Figure 3—figure supplement 20
Distribution of dEE across cell types.
(a) Histogram of differential expression enrichment (dEE) computed on ASE ratios for each cell type. The red color indicates inclusion of all genes whereas the blue color indicates inclusion of only genes with an absolute log fold-change greater than 0.5. (b) The same as in (a) but excluding RPE to more closely match the ATAC-seq dataset.
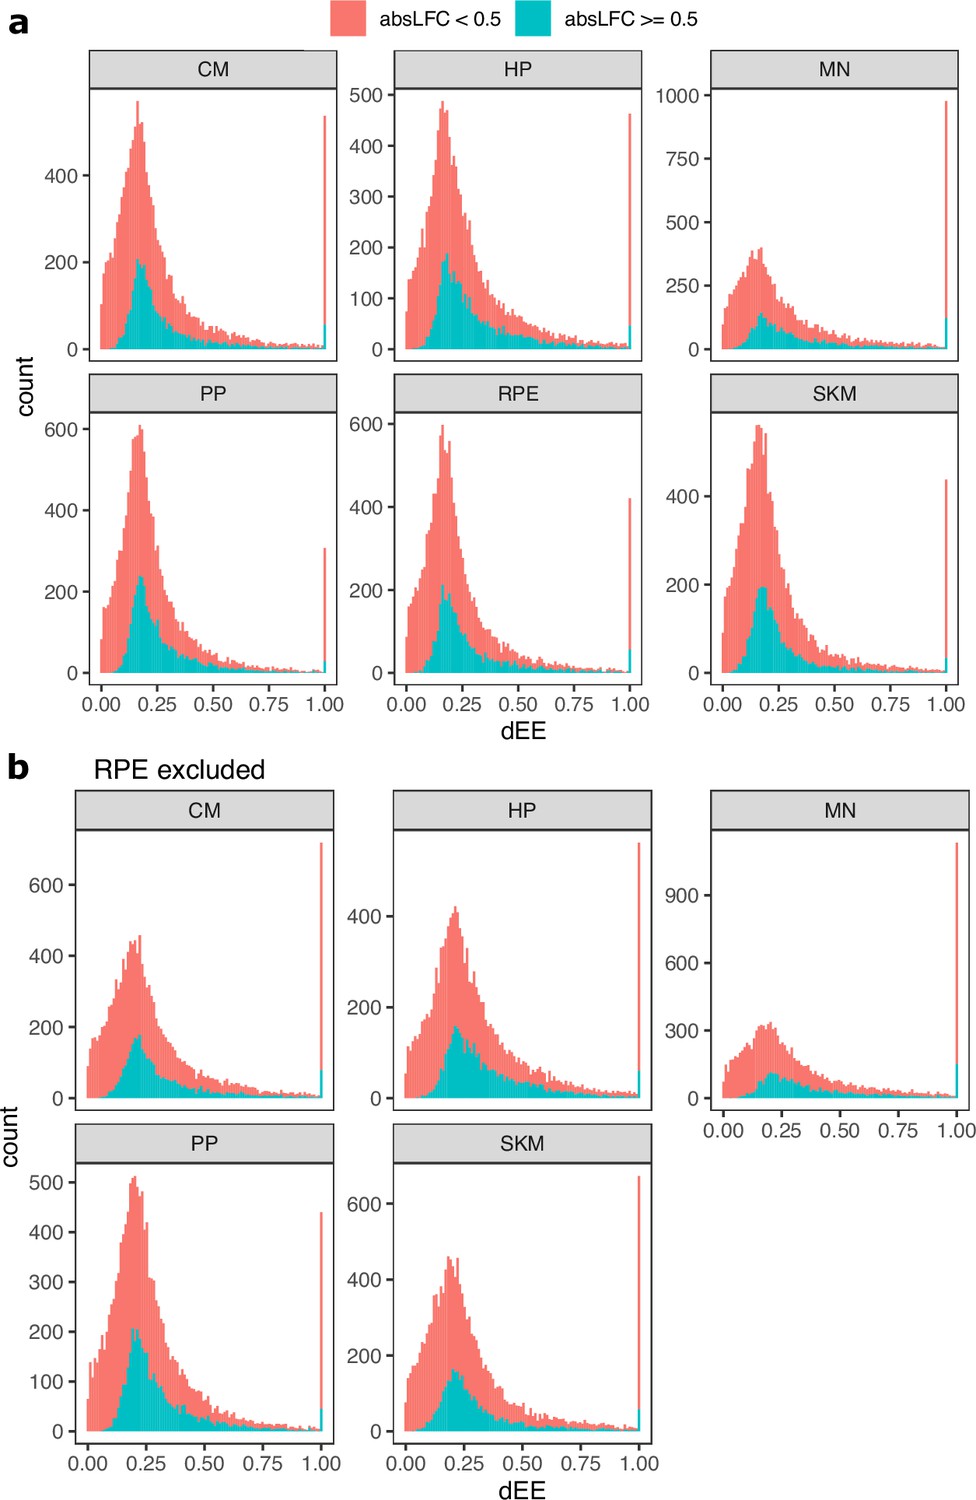
Figure 3—figure supplement 21
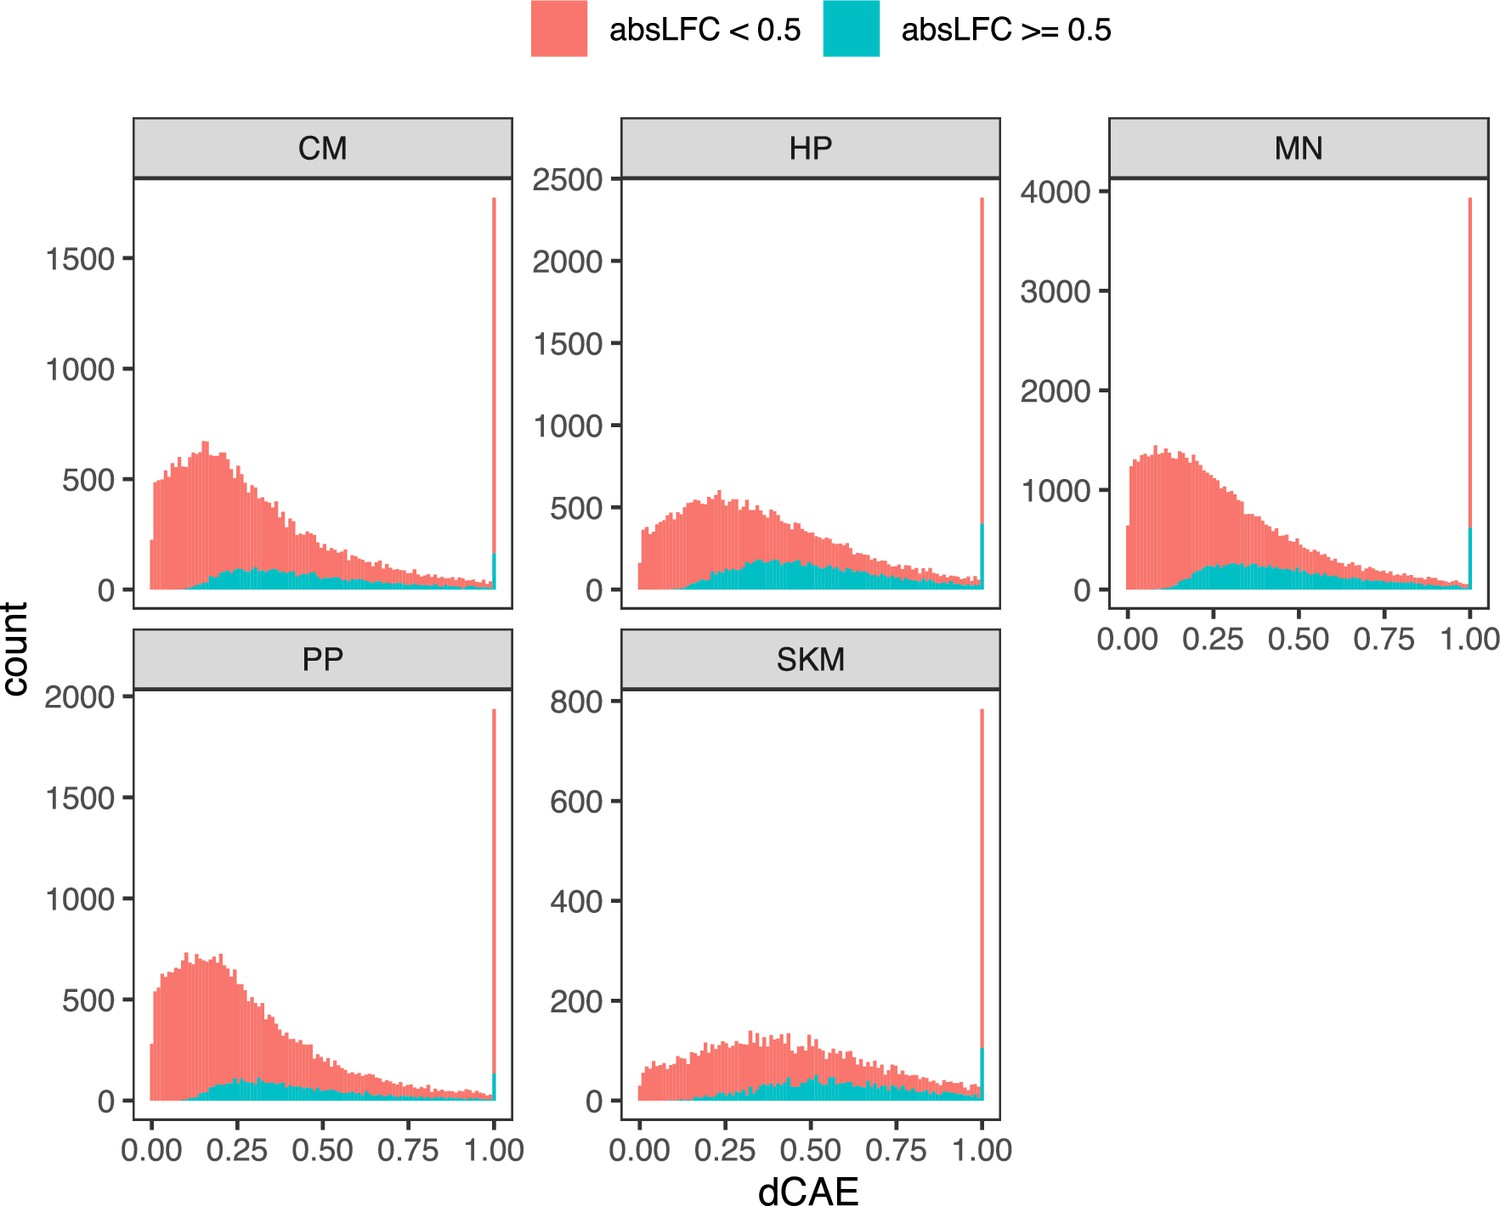
Distribution of dCAE across cell types.
Histogram of differential chromatin accessibility enrichment (dCAE) computed on ASCA ratios for each cell type. The red color indicates inclusion of all genes whereas the blue color indicates inclusion of only genes with an absolute log fold-change greater than 0.5.
Figure 4 with 1 supplement
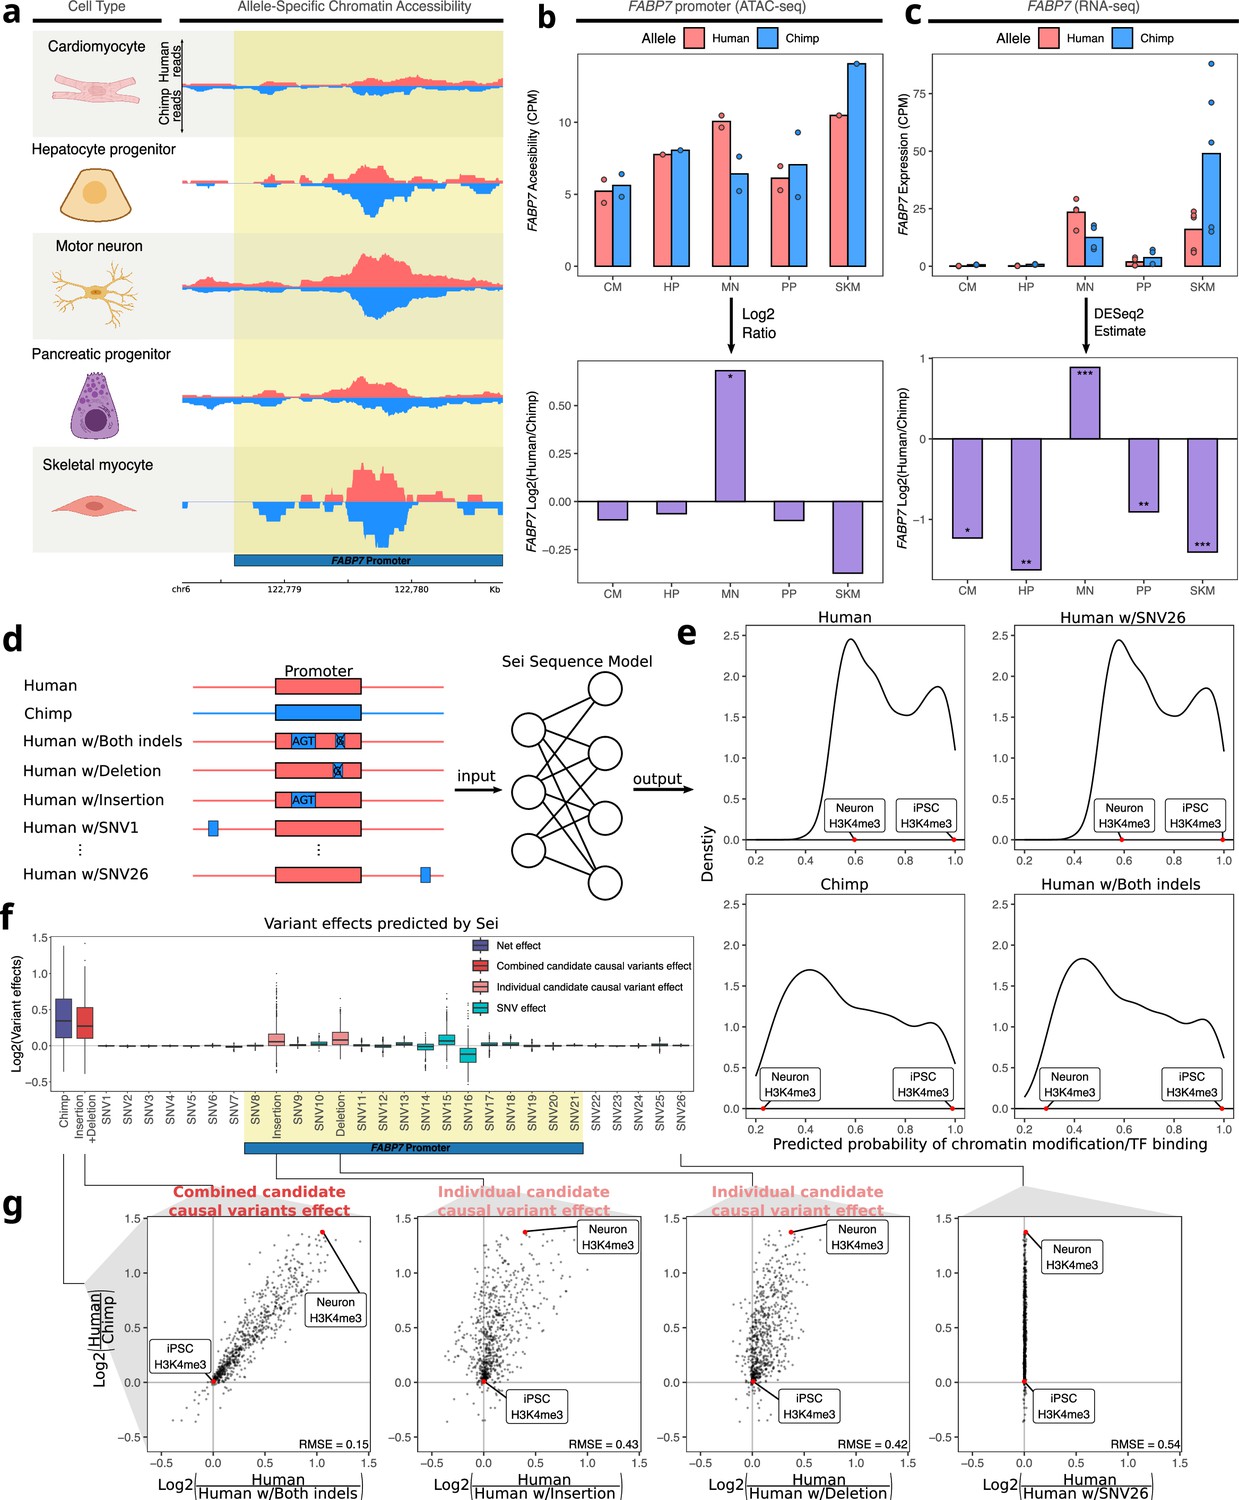
Motor neuron-specific human-biased ASE and ASCA for FABP7 and the promoter of FABP7.
(a) Allelic ATAC-seq tracks are shown in the peak containing the annotated FABP7 promoter (highlighted in yellow). (b) The top panel shows allelic CPM of the FABP7 promoter across cell types and the bottom panel shows the log fold-change across cell types. (c) The top panel shows allelic CPM of the FABP7 gene across cell types and the bottom panel shows the log fold-change across cell types. (d) Outline of the process for variant effect prediction with Sei for FABP7. All sequences input to Sei were centered at the FABP7 promoter. The human sequence, chimpanzee sequence, and partially “chimpanized” human sequences (modified by systematically switching the human allele to the chimpanzee allele separately for each human-chimpanzee difference) were fed into Sei to predict the effects of these variants on chromatin state. (e) Histogram of the probabilities of various chromatin states and transcription factor binding predicted by Sei was plotted for the human sequence, the chimpanzee sequence, and the human sequence with one human-chimpanzee difference swapped to match the chimpanzee sequence. The human sequence with SNV26 changed to the chimpanzee allele and the human sequence switched at both indels are shown as examples. A histone modification (H3K4me3) predicted in two cell types was labeled to illustrate how the predictions depend on both input sequence and cell type. (f) Plot of the predicted effects of all single nucleotide differences and indels between the human and chimpanzee genomes in the Sei input window (the FABP7 promoter is highlighted in yellow). (g) Scatterplots showing the correlation of the effects of both indels (left panel), each individual indel (middle two panels), and a representative SNV (right panel) on Sei predictions with the difference in Sei predictions between the human and chimpanzee sequences. The root mean square error (RMSE) was computed and shown in each figure.
Figure 4—figure supplement 1

Differential FABP7 expression across cortical cell types.
FABP7 expression in the human, chimpanzee and rhesus snRNA-seq dataset from the dorsolateral prefrontal cortex collected by Ma et al. (a) CPM and (b) log2 fold-change between human and non-human (chimpanzee or rhesus) are shown. Significance (using the DESeq2 likelihood ratio test) is indicated by asterisks where *** indicates FDR <0.005, ** indicates FDR <0.01, and * indicates FDR <0.05. Astro: astrocytes, Micro: microglia, Oligo: oligodendrocytes, OPC: oligodendrocyte progenitor cells. ADARB2 KCNG1, LAMP5 LHX6, LAMP5 RELN, PVALB, PVALB ChC, SST, SST HGF, SST NPY, and VIP are inhibitory interneuron cell types. IT (intratelencephalic), ET (extratelencephalic), NP (near-projecting), and CT (corticothalamic) neuronal types are excitatory projection neurons. As an example, L2-3 stands for cortical layers 2–3 and L5-6 stands for cortical layers 5–6.
Figure 5 with 5 supplements
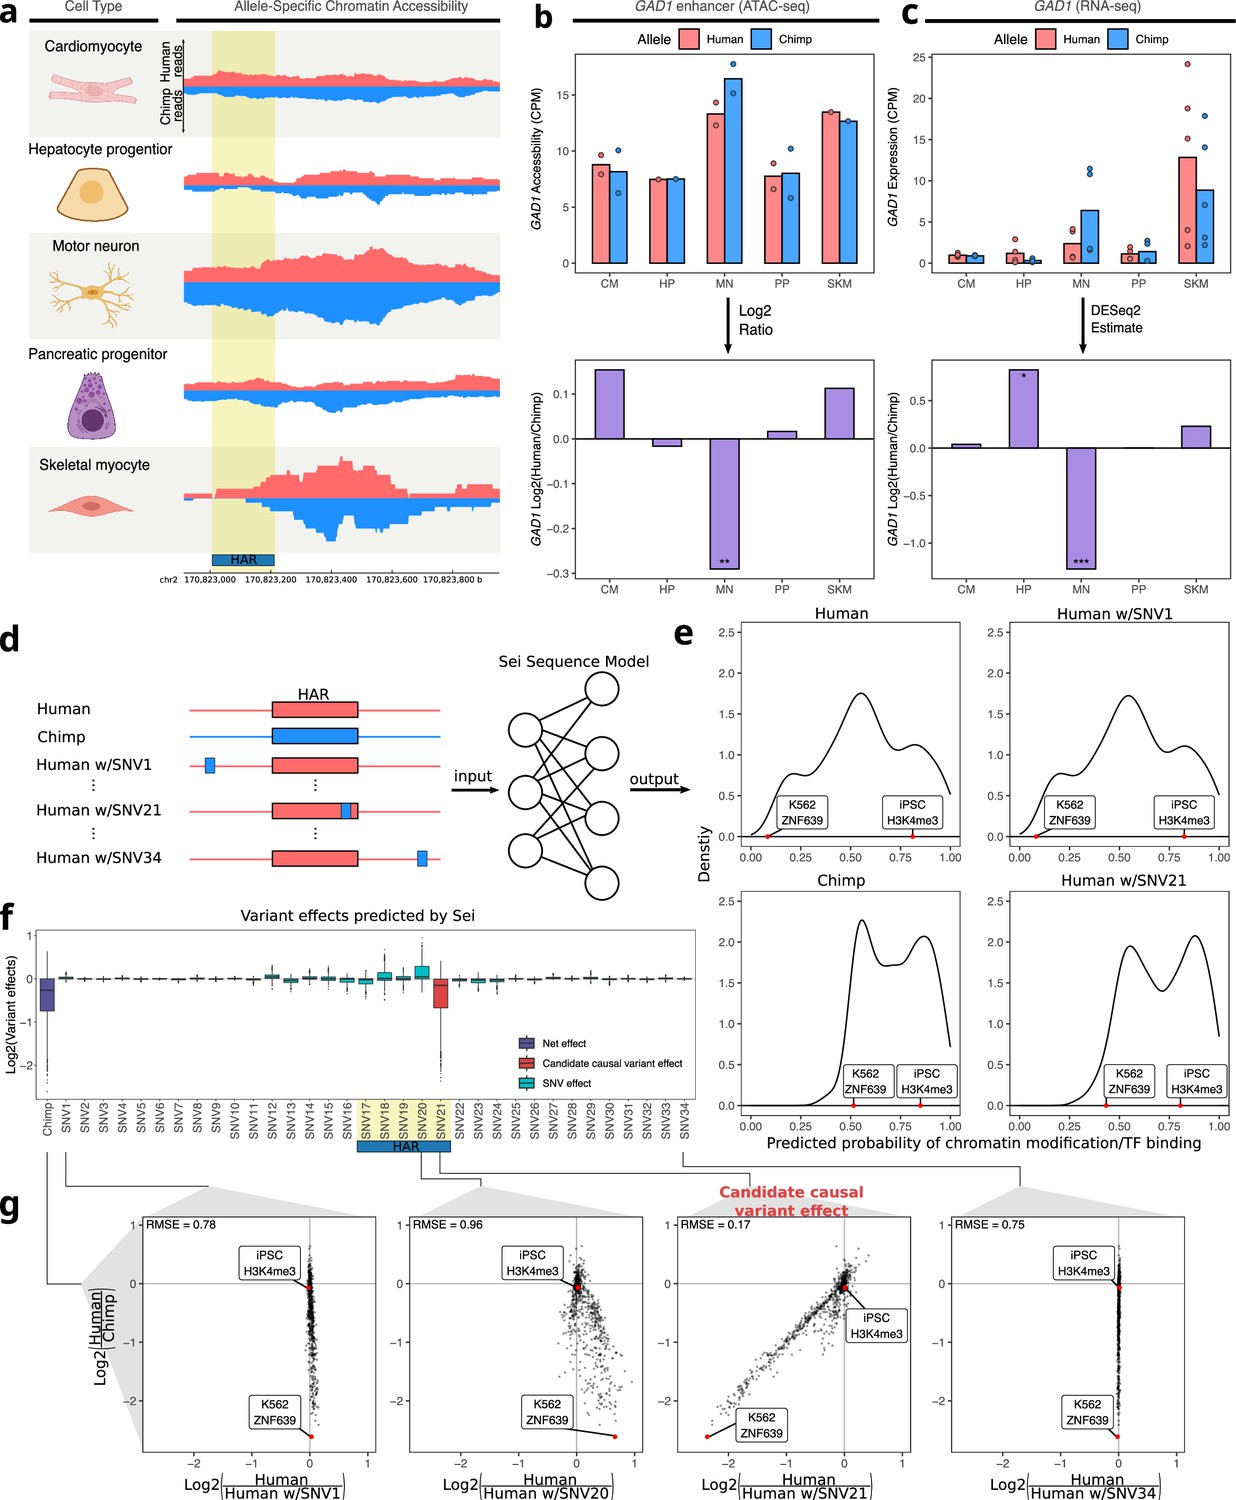
Motor neuron-specific chimpanzee-biased ASE for GAD1 and ASCA for a HAR near the GAD1 TSS.
(a) Allelic ATAC-seq tracks are shown for the peak near the GAD1 TSS that contains a HAR (highlighted in yellow). (b) The top panel shows allelic CPM of the CRE near the GAD1 TSS across cell types and the bottom panel shows the log fold-change across cell types. (c) The top panel shows allelic CPM of the GAD1 gene across cell types and the bottom panel shows the log fold-change across cell types. (d) Outline of the process for variant effect prediction with Sei for GAD1. All input sequences to Sei were centered at the HAR. The human sequence, the chimpanzee sequence, and modified sequences with the human sequence altered at each substitution to match the chimpanzee sequence were fed into the Sei sequence model to predict the effects of these variants on the chromatin state. (e) Histogram of the probabilities of various chromatin states and transcription factor binding predicted by Sei was plotted for the human sequence, the chimpanzee sequence, and two examples in which the human sequence with only one SNV “chimpanized” (human w/SNV) was input to Sei. The histogram of the probability of the sequence having a particular epigenomic annotation (predicted by Sei) was plotted for human, chimpanzee, human w/SNV1 changed to match the chimpanzee sequence, and human w/SNV21 changed to match the chimpanzee sequence. Two epigenomic annotations were labeled as examples that show the different values output by Sei with these two different sequence inputs. (f) Plot of the predicted effects of all single nucleotide differences between human and chimpanzee in the Sei input window centered at the HAR (highlighted in yellow). Positions were switched to the chimpanzee allele individually. (g) Scatterplots showing the correlation of the effects of four SNVs on Sei predictions with the difference in Sei predictions between the human and chimpanzee sequences. The root mean square error (RMSE) was computed and shown in each figure.
Figure 5—figure supplement 1

A HAR near the TSS of GAD1 is chimpanzee-biased only in motor neurons.
Allelic ATAC-seq tracks for a peak near the GAD1 TSS that contains a HAR (Figure 5a). The human signal is shown in red, and the chimpanzee signal is shown in blue. Differential track scores (log2(human/chimp)) were computed by position along the genomic coordinates and are shown on the right. The HAR region is highlighted in yellow. Motor neuron-specific chimpanzee biased accessibility was observed in the HAR region.
Figure 5—figure supplement 2

A human-specific SNP disrupts a potential Ascl1 binding site.
The potential effects of the human-chimpanzee difference at hg38 position chr2:170,823,193 (C in humans and G in chimpanzees) on transcription factor binding sites are shown.
Figure 5—figure supplement 3
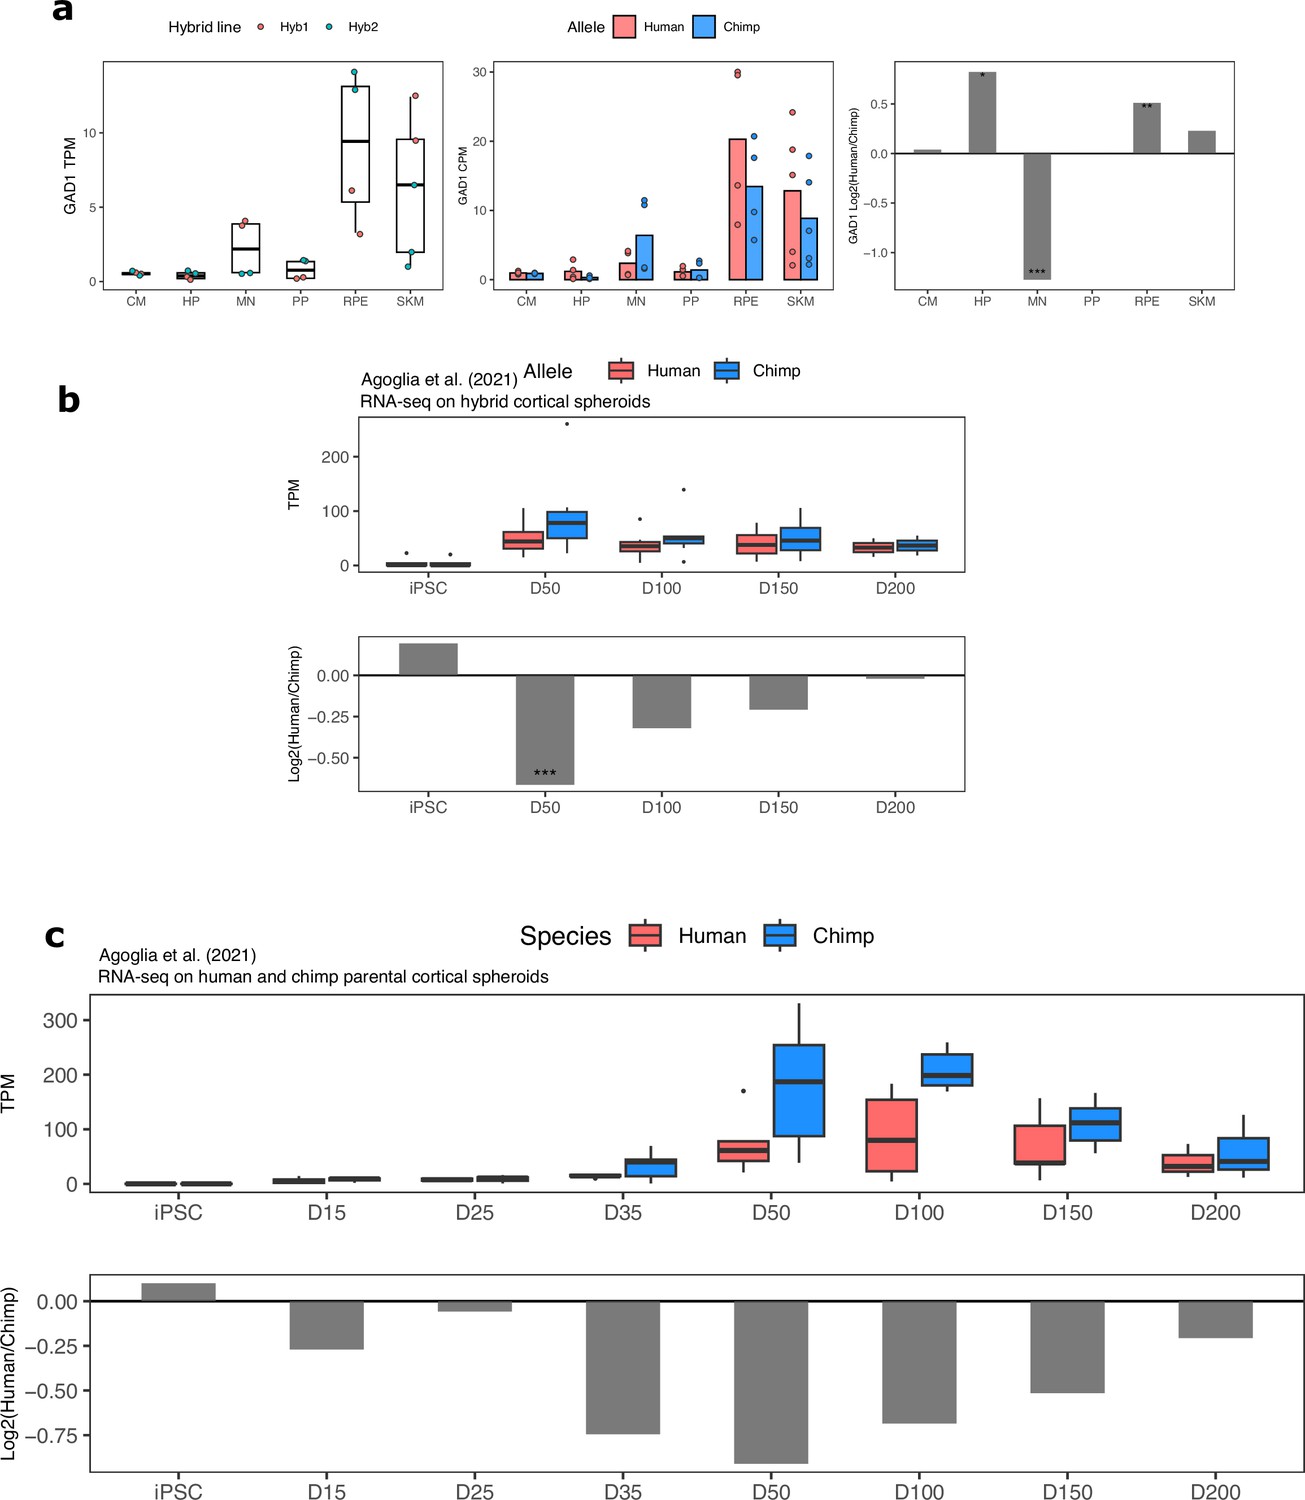
GAD1 ASE and differential expression across cell types and in cortical organoids.
(a) GAD1 TPM, ASE and DESeq2 log fold-change in all cell types in our dataset. Significance (using the DESeq2 likelihood ratio test) is indicated by asterisks where *** indicates FDR <0.005, ** indicates FDR <0.01, and * indicates FDR <0.05. (b) GAD1 ASE in hybrid cortical organoids at different time points. Allelic TPM is shown in the top plot and DESeq2 log fold-change is shown in the bottom plot. (c) GAD1 gene expression in human and chimpanzee parental cortical organoids. Allelic TPM is shown in the top plot and DESeq2 log fold-change is shown in the bottom plot.
Figure 5—figure supplement 4

GAD1 expression across GABAergic neuron differentiation in human and chimpanzee cortical organoids (Kanton et al., 2019).
The top panel shows the results when including all GABAergic neurons regardless of lineage. This closely matches the results when restricting to cells likely to represent the CGE (caudal ganglionic eminence), LGE (lateral ganglionic eminence), or MGE (medial ganglionic eminence) indicating that this difference is likely to affect all forebrain GABAergic lineages. Pseudotime was computed and cells were split into five equally sized bins with bin 1 having the lowest pseudotime value and bin 5 the highest. As no subclusters corresponding to the CGE, MGE, or LGE could be discerned in the progenitor cluster, all progenitors were included in each lineage and fall only into the first two pseudotime bins in each plot. Wilcoxon tests were performed on the non-zero counts and p-values are reported in each pseudotime bin on the figure.
Figure 5—figure supplement 5

Chromatin accessibility of the HAR near the GAD1 TSS across human striatal organoid development.
The peak containing the HAR near GAD1 shows a peak in accessibility during development in human from ATAC-seq on human striatal organoids from Trevino et al.
Author response image 1

Author response image 2

Author response image 3

Author response image 4

Author response image 5

Marker gene expression in different cell types.
In order, the panels show: a marker for pluripotency, a marker gene for dividing cells, marker genes for cardiomyocytes, marker genes for hepatocytes and hepatocyte progenitors, marker genes for motor neurons, marker genes for pancreatic progenitors and more mature pancreatic cell types, marker genes for retinal pigment epithelial cells, and marker genes for skeletal myocytes. Hepatocyte progenitors and pancreatic progenitors generally show similar gene expression profiles. TPM: transcript per million.
Author response image 6

Relationship between number of SNPs and -log10(FDR) in (a) ASE and -log10(pvalue) (b) ASCA.
These scatter plots show the relationship between the number of SNPs in a gene or peak and the -log10(FDR) for ASE or ASCA. Genes with significant ASE (FDR < 0.05) and peaks with significant ASCA (binomial p-value < 0.05) were annotated as blue dots, and all other genes and peaks were annotated as gray dots. All genes in each cell type in RNA-seq are shown. For clarity, the few outlier peaks with more than 200 SNPs are excluded from these plots.
Author response image 7

Relationship between number of SNPs and absolute log2 fold-change in (a) ASE and (b) ASCA.
These scatter plots show the relationship between the number of SNPs in a gene or peak and the estimated absolute log2 fold-change for ASE or ASCA. Genes with significant ASE (FDR < 0.05) and peaks with significant ASCA (binomial p-value < 0.05) were annotated as blue dots, and all other genes and peaks were annotated as gray dots. All genes in each cell type in RNA-seq are shown. For clarity, the few outlier peaks with more than 200 SNPs are excluded from these plots.
Author response image 8

Cell type-specifically expressed genes are enriched for genes with ASE when stratifying by the number of SNPs per gene.
a) Results when SKM is included. Genes were put into five bins with an equal number of genes in each bin. Genes with the fewest SNPs are in the 0-20% bin and genes with the most SNPs are in the 80-100% bin. Significance (using the Wald test) is indicated by asterisks where *** indicates p < 0.005, ** indicates p < 0.01, and * indicates p < 0.05. b) The same as in (a) but excluding SKM.
Author response image 9

Cell type-specific peaks are enriched for ASCA when stratifying by the number of SNPs per peak.
a) Peaks with an absolute log2 fold-change greater than or equal to 0.5 were called as having ASCA. Peaks were put into five bins with an equal number of peaks in each bin. Peaks with the fewest SNPs are in the 0-20% bin and genes with the most SNPs are in the 80-100% bin. Significance (using the Wald test) is indicated by asterisks where *** indicates p < 0.005, ** indicates p < 0.01, and * indicates p < 0.05. b) The same as in (a) but peaks with a binomial p-value less than or equal to 0.05 were called as having ASCA.
Additional files
-
Supplementary file 1
Results of running the test for selection described by Starr et al., 2023 on each cell type.
- https://cdn.elifesciences.org/articles/89594/elife-89594-supp1-v1.zip
-
Supplementary file 2
Peak-gene pairs that had concordant high dCAE and high dEE in each cell type.
- https://cdn.elifesciences.org/articles/89594/elife-89594-supp2-v1.zip
-
MDAR checklist
- https://cdn.elifesciences.org/articles/89594/elife-89594-mdarchecklist1-v1.docx
Download links
A two-part list of links to download the article, or parts of the article, in various formats.
Downloads (link to download the article as PDF)
Open citations (links to open the citations from this article in various online reference manager services)
Cite this article (links to download the citations from this article in formats compatible with various reference manager tools)
Cell-type-specific cis-regulatory divergence in gene expression and chromatin accessibility revealed by human-chimpanzee hybrid cells
eLife 12:RP89594.
https://doi.org/10.7554/eLife.89594.3


