C9orf72 polyPR directly binds to various nuclear transport components
- Zernike Institute for Advanced Materials, University of Groningen, Netherlands
Figures
Figure 1
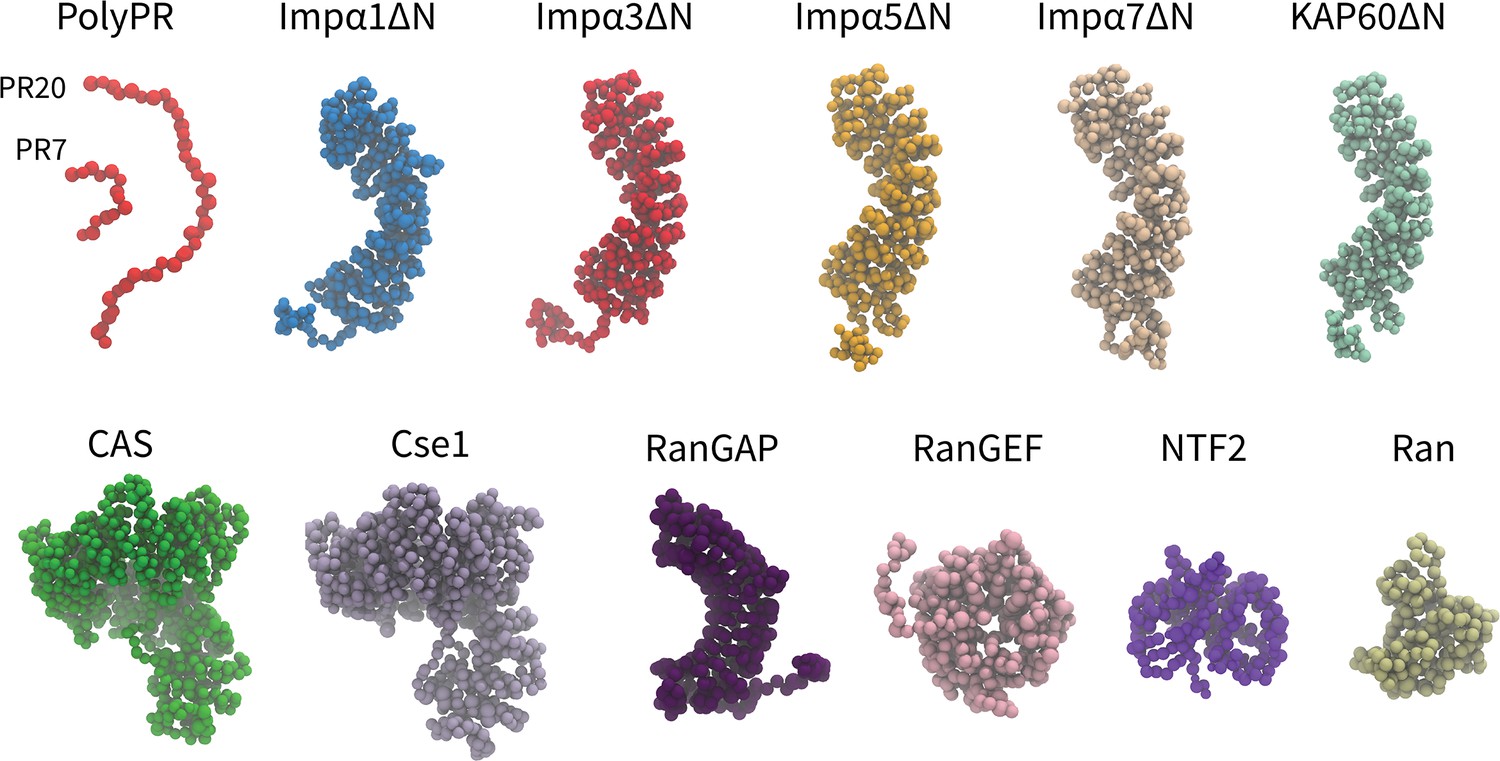
Coarse-grained (CG) models of polyPR and transport components used in this study.
One-bead-per-amino acid (1BPA) representation of PR7, 20, and the various transport components modeled in the current study. These are several members of the Impα family (excluding the N-terminal IBB domain), specific exporters of Impα (CAS and Cse1), RanGAP, RanGEF, NTF2, and Ran. Details regarding the CG models and protein sequences are listed in Supplementary file 1b and Supplementary file 1c.
Figure 2 with 1 supplement
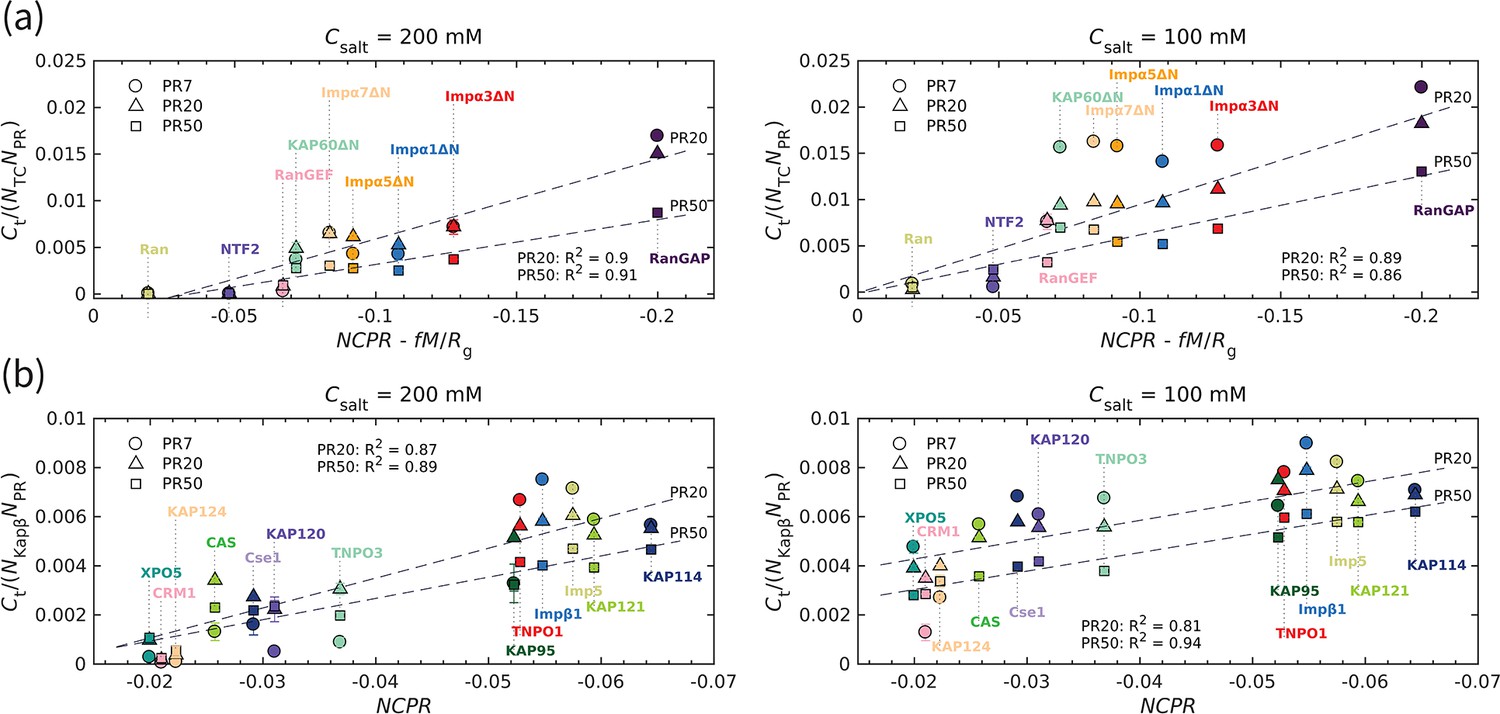
The transport component’s net charge per residue and dipole moment, together with polyPR length, affect polyPR interaction with various nuclear transport components.
(a) and (b) show the normalized time-averaged number of contacts for the interaction between polyPR with 7, 20, and 50 repeat units with different types of transport components. The results are shown for monovalent salt concentrations of mM (left panels) and mM (right panels). (a) shows the results for the transport components shown in Figure 1, excluding the specific exporters of Impα: CAS and Cse1. A linear correlation is observed between the normalized and , with calculated to be 0.0036 for the best fit. The net charge per residue is in units of elementary charge e, the dipole moment is in units of , and the radius of gyration is in units of nm. (b) shows the results for the Kapβ data set (data points taken from Jafarinia et al., 2022), together with CAS and Cse1. For this case, a linear correlation between the normalized and is observed. The dashed lines show linear fits for PR20 and PR50; see Supplementary file 1d for the linear equations of the fits. The fits for PR7 resulted in R2 values of 0.89 (a) and 0.83 (b) for 200 M and of 0.7 (a) and 0.59 (b) for 100 mM. Because of the low R2 values for 100 mM, the fits for PR7 are not shown. The error bars denote the standard error of the mean calculated from block averaging with three blocks at equilibrium. Where error bars are invisible, they are smaller than the marker size.
Figure 2—figure supplement 1
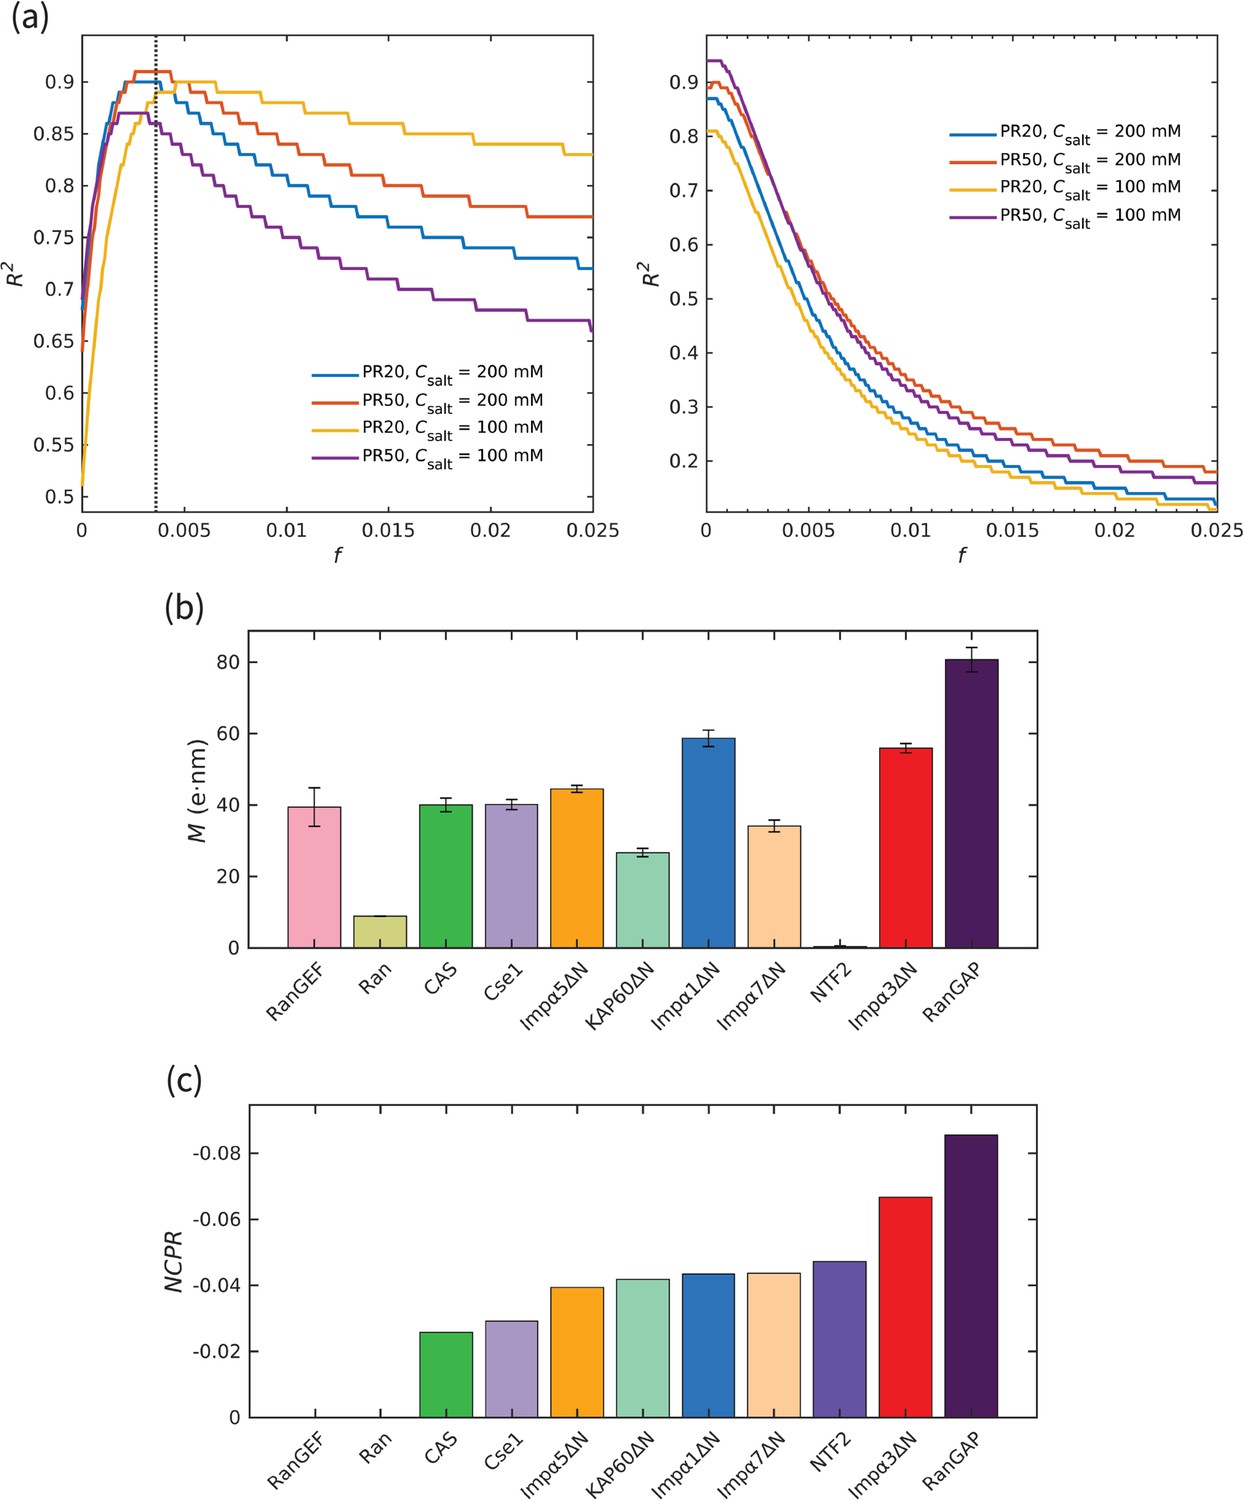
Quality of fit in Figure 2, and corresponding values of dipole moment and net charge per residue of transport components.
(a) The quality of fit () for different values of the dimensionless parameter in Equation 1 for (left panel) the transport components shown in Figure 1, excluding the specific exporters of Impα, CAS, and Cse1, and (right panel) the Kapβ set (studied here Jafarinia et al., 2022), together with CAS and Cse1. The results are shown for PR20, 50 and the two salt concentrations used in this study. The vertical dotted line in the left panel shows the value of for the best fit based on the four curves. (b) Dipole moment of the different transport components shown in Figure 1. (c) Net charge per residue of the different transport components shown in Figure 1.
Figure 3 with 2 supplements
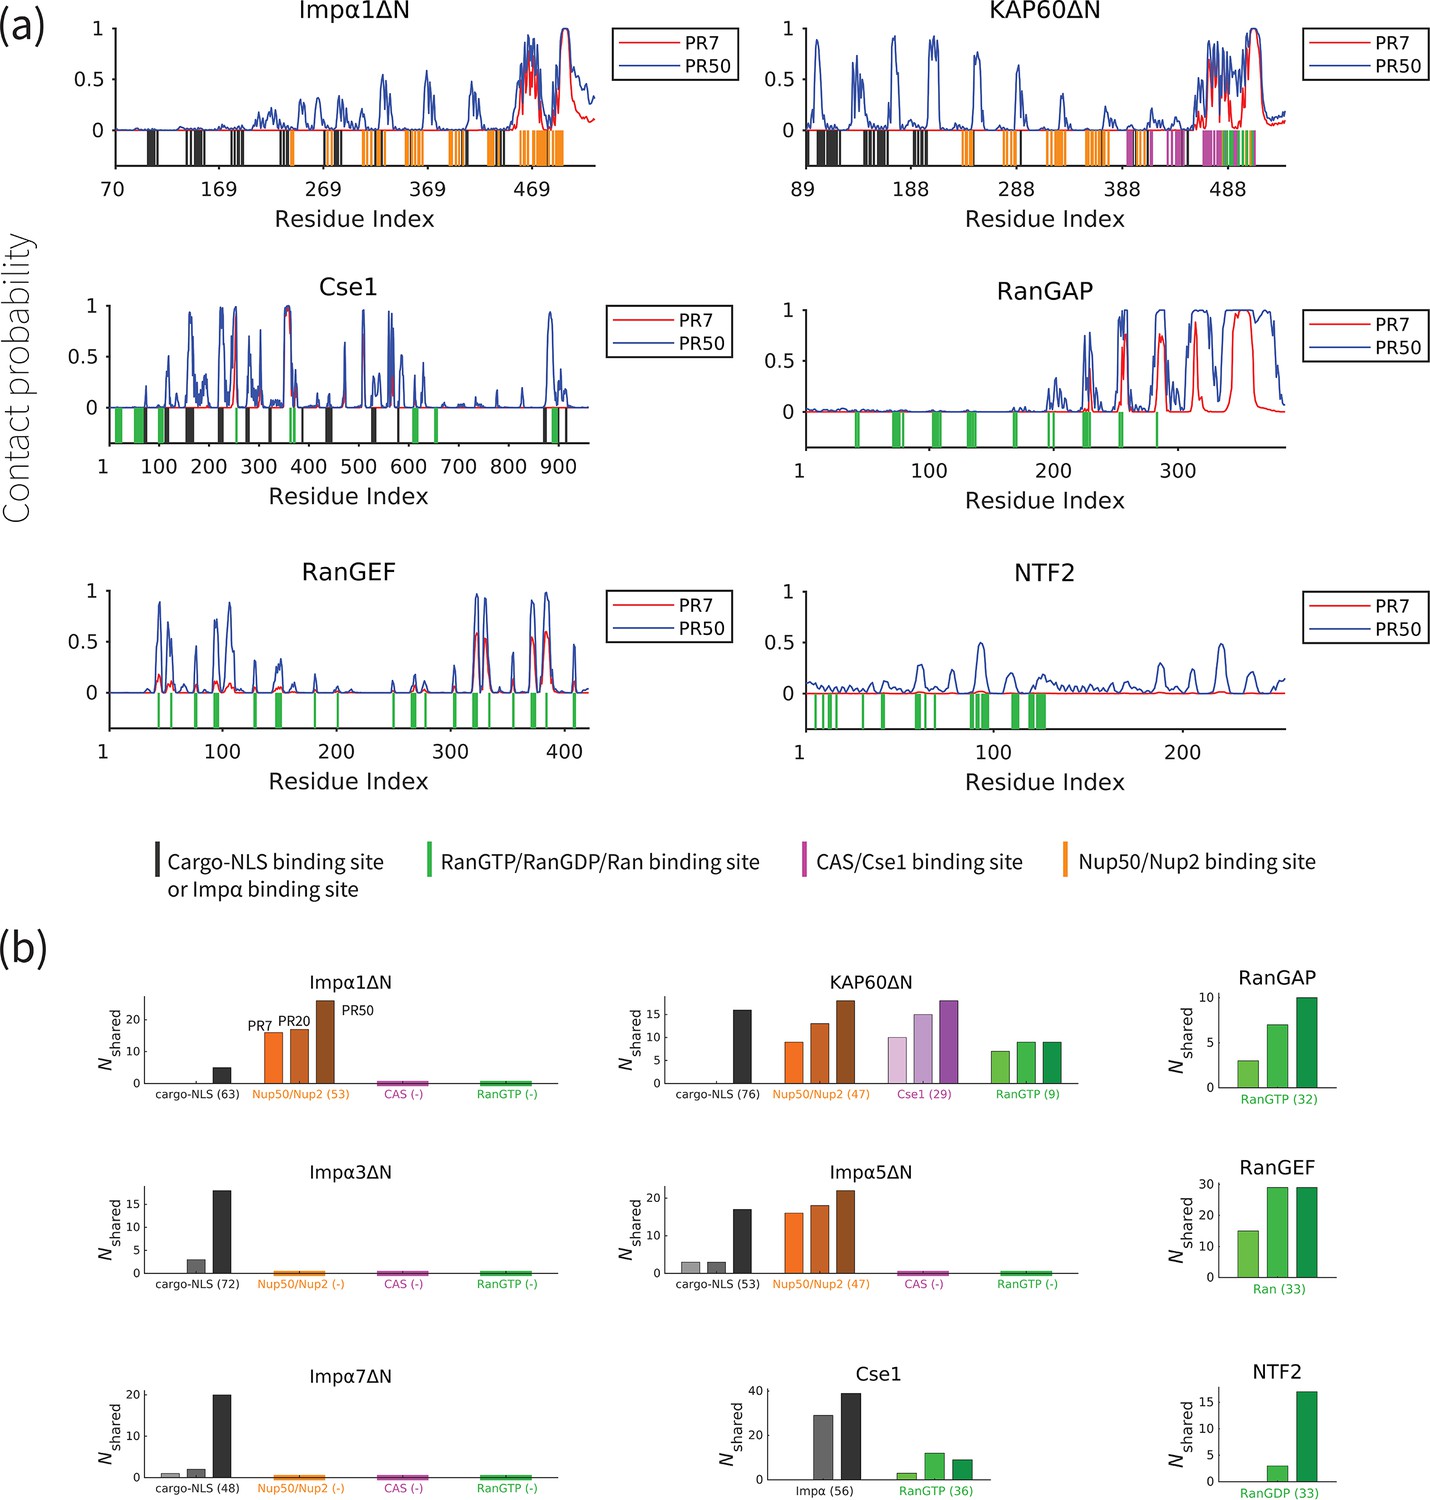
PolyPR interacts with several known binding sites of nuclear transport components in a length-dependent manner.
(a) The contact probability for each residue in the sequence of transport components interacting with polyPR. The plot displays the contact probability for six transport components – Impα1ΔN, KAP60ΔN, Cse1, RanGAP, RanGEF, and NTF2 – at a salt concentration of 100 mM. Results for Impα3ΔN, Impα5ΔN, Impα7ΔN, CAS, and Ran are shown in Figure 3—figure supplement 1. Each figure shows two curves for PR7 and PR50. The bottom part of each figure shows the binding sites for NLS-cargo, Impα, CAS/Cse1, RanGTP, and Nup50/Nup2 using different colors. These binding sites are obtained from the crystal structures of the bound states of transport components in the Protein Data Bank using PiSITE (see Supplementary file 1b for more details). For each transport component, the following binding sites are marked. For the Impα family: NLS-cargo (vertical black lines), CAS/Cse1 (vertical purple lines), and Nup50/Nup2 (vertical orange lines) binding sites. For CAS/Cse1: Impα (vertical black lines) and RanGTP (vertical green lines) binding sites. For RanGAP: RanGTP (vertical green lines) binding sites. For RanGEF: Ran (vertical green lines) binding sites. For NTF2: RanGDP (vertical green lines) binding sites. The Ran-binding sites marked for RanGEF are taken from the RanGEF-Ran complex (an intermediate step in the RanGEF function). (b) The number of shared contact sites between polyPR and the binding partners of the transport components, referred to as , is plotted for PR7, PR20, and PR50. In each bar plot, the numbers inside the parentheses on the horizontal axis show the number of known binding sites obtained from PiSITE. If there is no known binding site, a (-) mark is used instead. The results for PR7, PR20, and PR50 are reported from left to right for each set of bar plots. The bars with darker colors represent longer polyPR chains.
Figure 3—figure supplement 1
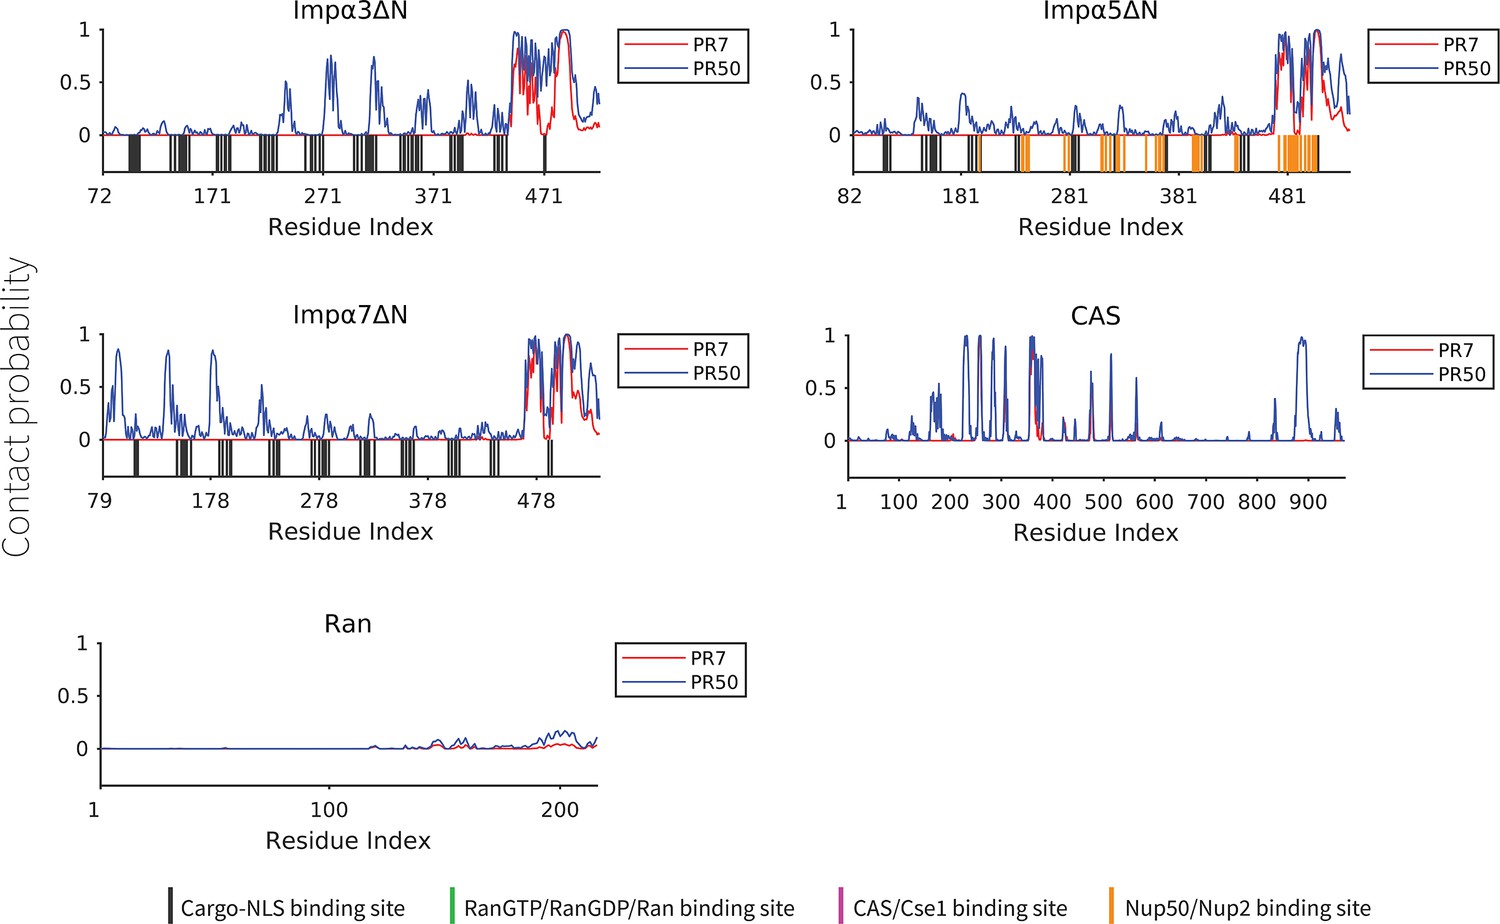
The contact probability for each residue in the sequence of transport components interacting with polyPR.
The plot displays the contact probability for five transport components: Impα3ΔN, Impα5ΔN, Impα7ΔN, CAS, and Ran at a salt concentration of 100 mM.
Figure 3—figure supplement 2
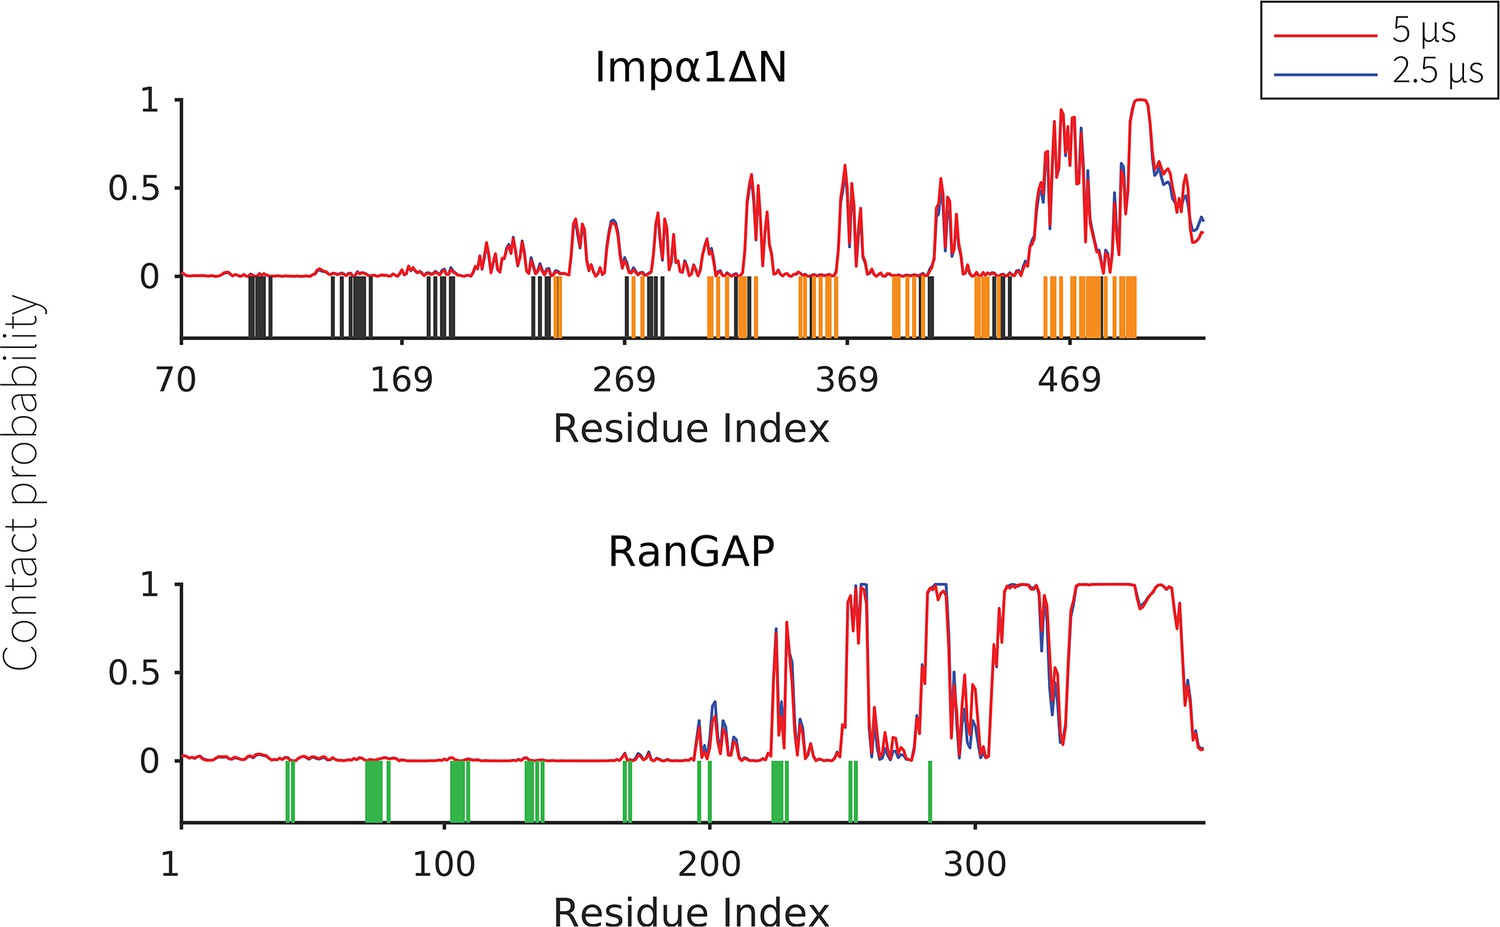
The contact probability for each residue in the sequence of transport components interacting with PR50.
The plot displays the contact probability calculated from simulations performed for 2.5 and 5 μs for Impα1ΔN and RanGAP, showing convergence of the computations.
Figure 4
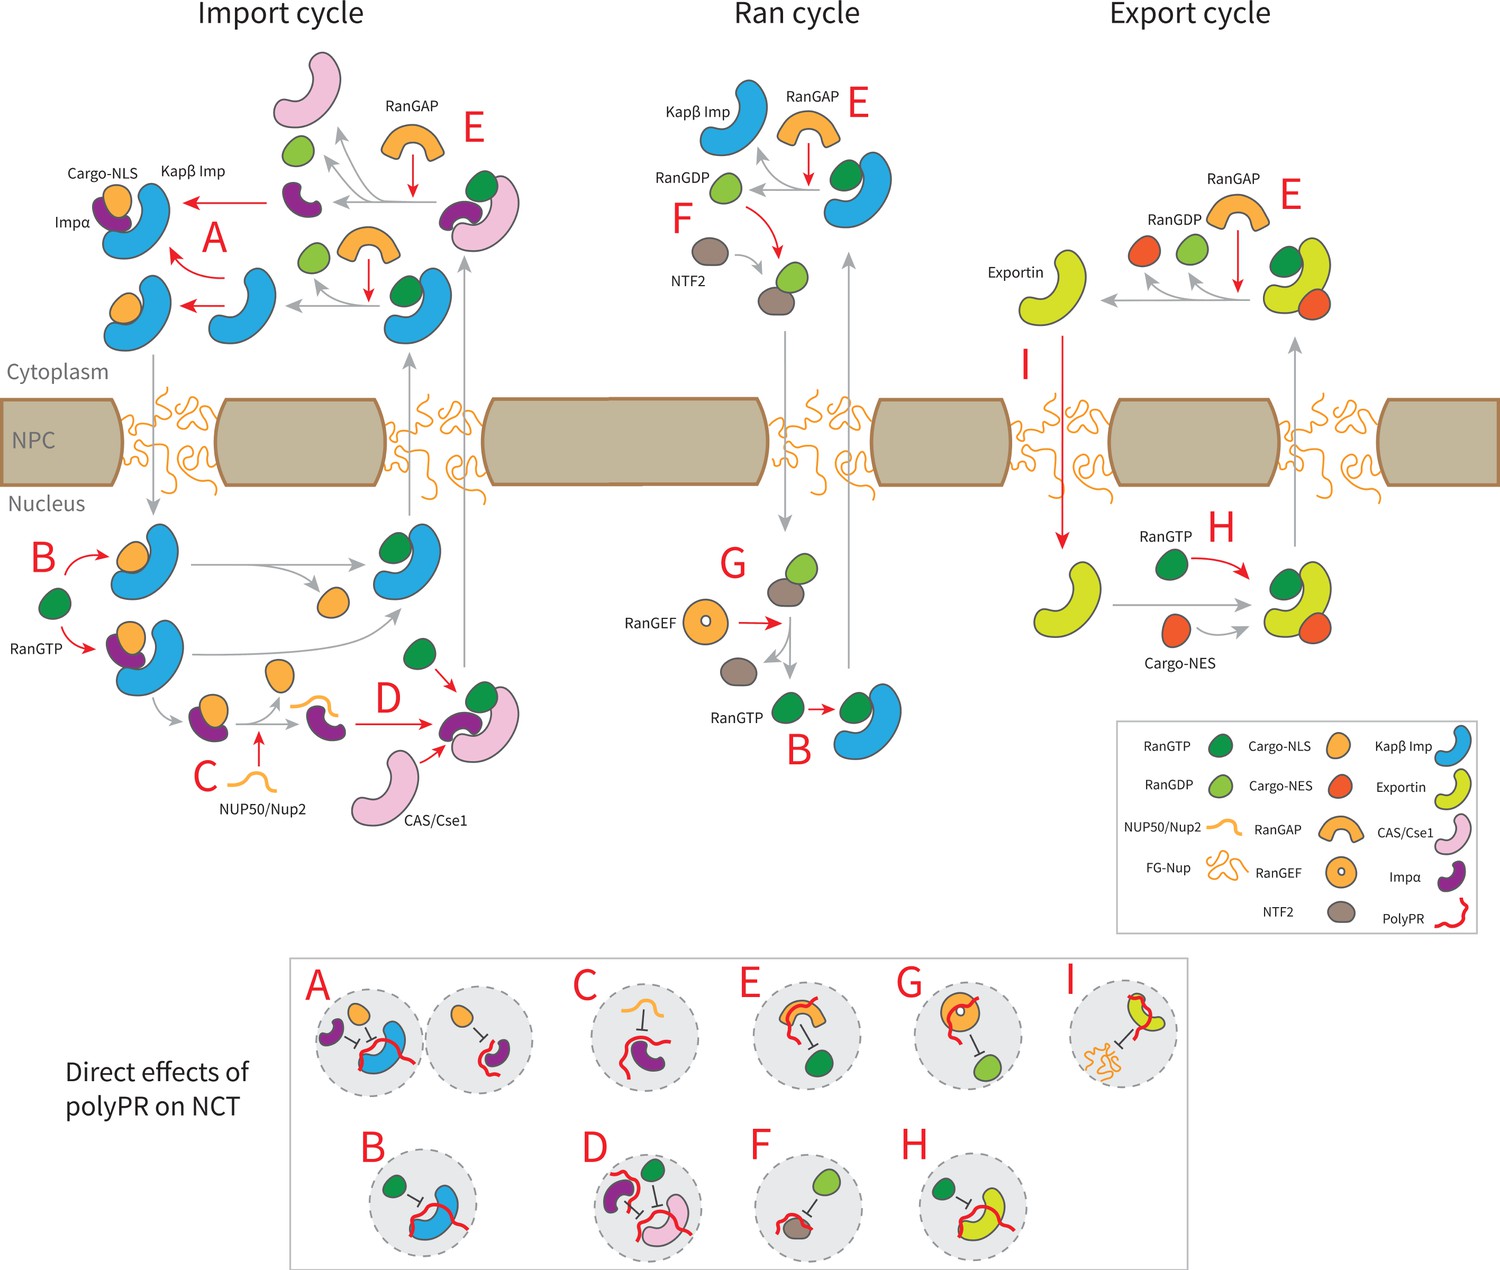
Suggested molecular mechanism of polyPR interference with the native function of transport components in the nucleocytoplasmic transport (NCT) cycle.
Proposed mechanistic pathways of polyPR interference with the import cycle (left panel), Ran cycle (middle panel), and export cycle (right panel). Steps in the NCT cycle are represented with gray arrows, and a red dashed arrow indicates where polyPR may interfere with the transport cycle. The letters A–H are used to illustrate how polyPR may disrupt the function of the transport components. Each letter corresponds to a mechanistic mechanism shown at the bottom of the figure in gray circles. It should be noted that the proposed mechanisms are not equally significant. The relative significance of the suggested molecular mechanisms can be obtained by considering their relative contributions based on the number of contacts and the number of contacts with important binding sites as presented in Figures 2 and 3, respectively.
Additional files
-
Supplementary file 1
Details of the force field parameters, coarse-grained models of transport components, and fitting parameters.
- https://cdn.elifesciences.org/articles/89694/elife-89694-supp1-v1.docx
-
MDAR checklist
- https://cdn.elifesciences.org/articles/89694/elife-89694-mdarchecklist1-v1.docx
Download links
A two-part list of links to download the article, or parts of the article, in various formats.
Downloads (link to download the article as PDF)
Open citations (links to open the citations from this article in various online reference manager services)
Cite this article (links to download the citations from this article in formats compatible with various reference manager tools)
C9orf72 polyPR directly binds to various nuclear transport components
eLife 12:RP89694.
https://doi.org/10.7554/eLife.89694.3


