Pleiotropic effects of trisomy and pharmacologic modulation on structural, functional, molecular, and genetic systems in a Down syndrome mouse model
- Biomedical MRI, Department of Imaging and Pathology, KU Leuven, Belgium
- Department of Human Genetics, KU Leuven, Belgium
- Laboratory of Biological Psychology, KU Leuven, Belgium
- Centre for Preclinical Imaging, Department of Molecular and Clinical Cancer Medicine, University of Liverpool, United Kingdom
- Departament de Biologia Evolutiva, Ecologia i Ciències Ambientals (BEECA), Facultat de Biologia, Universitat de Barcelona, Spain
- Clinical and Experimental Endocrinology, KU Leuven, Belgium
Figures
Figure 1
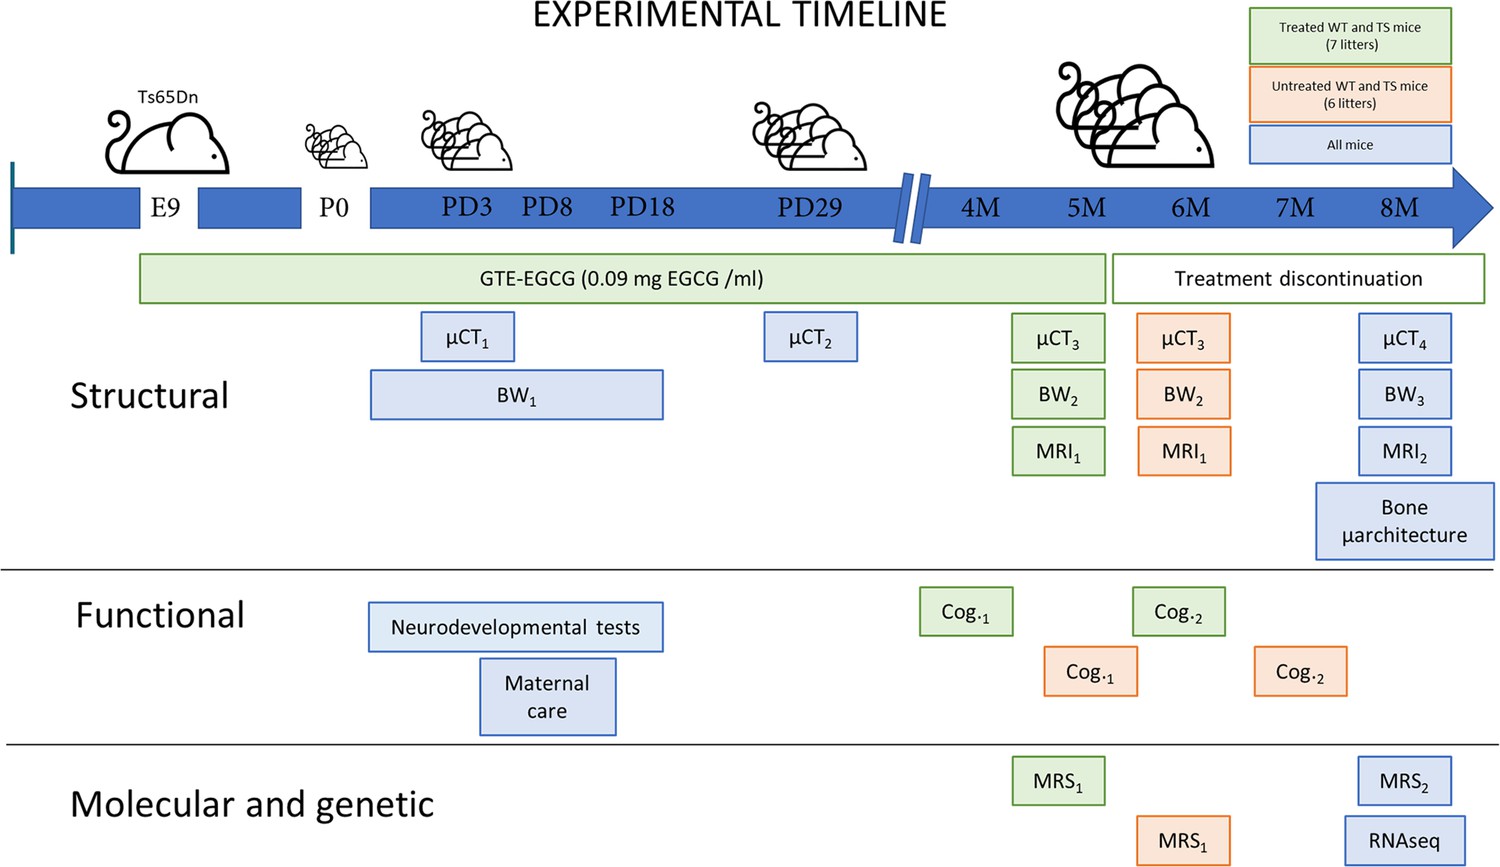
Experimental design comparing structural, functional, molecular, and genetic characteristics of wildtype (WT) and Ts65Dn (TS) mice over development and evaluating the effects of a prenatal chronic GTE-EGCG treatment and its discontinuation.
Ts65Dn and WT littermates were treated prenatally at a concentration of 0.09 mg EGCG/mL, which corresponds to a dose of 30 mg/kg/day, from embryonic day 9 (E9) until mice were 5 months old (5 M). A battery of neurodevelopmental tests was performed daily from postnatal day (PD) 1 to PD18 to evaluate early cognitive development. To monitor maternal care, mice home cages were recorded at PD8 for 24 hr. Mice body weight (BW) was recorded daily from PD1 to PD17 (BW1), and at two additional times before µCT scanning (BW2 and BW3). In vivo micro-computed tomography (µCT) scans were performed four times over development to follow skeletal development: µCT1 at PD3 and µCT2 at PD29 in all mice; µCT3 at 5 M in treated mice, and 6 M in untreated mice; and µCT4 at 8 M in all mice. Additionally, mice were scanned with in vivo magnetic resonance imaging (MRI) and magnetic resonance spectroscopy (MRS) before and after treatment discontinuation to quantify brain volumetric changes and metabolite concentrations in the hippocampal region: MRI1 and MRS1 at 5 M in treated mice and 6 M in untreated mice; and MRI2 and MRS2 at 8 M in all mice. Two batteries of cognitive tests of one-month duration each were performed to evaluate adult cognition: Cog.1 at 4 M in treated mice, and 5 M in untreated mice; and Cog.2 at 6 M in treated mice, and 7 M in untreated mice. At endpoint (8 M), the tibia of all mice was collected to measure its length using a digital caliper and analyze its microarchitecture using ex vivo µCT. At this last stage, cerebellar tissue was also collected to perform RNAseq gene expression analysis.
Figure 2 with 2 supplements
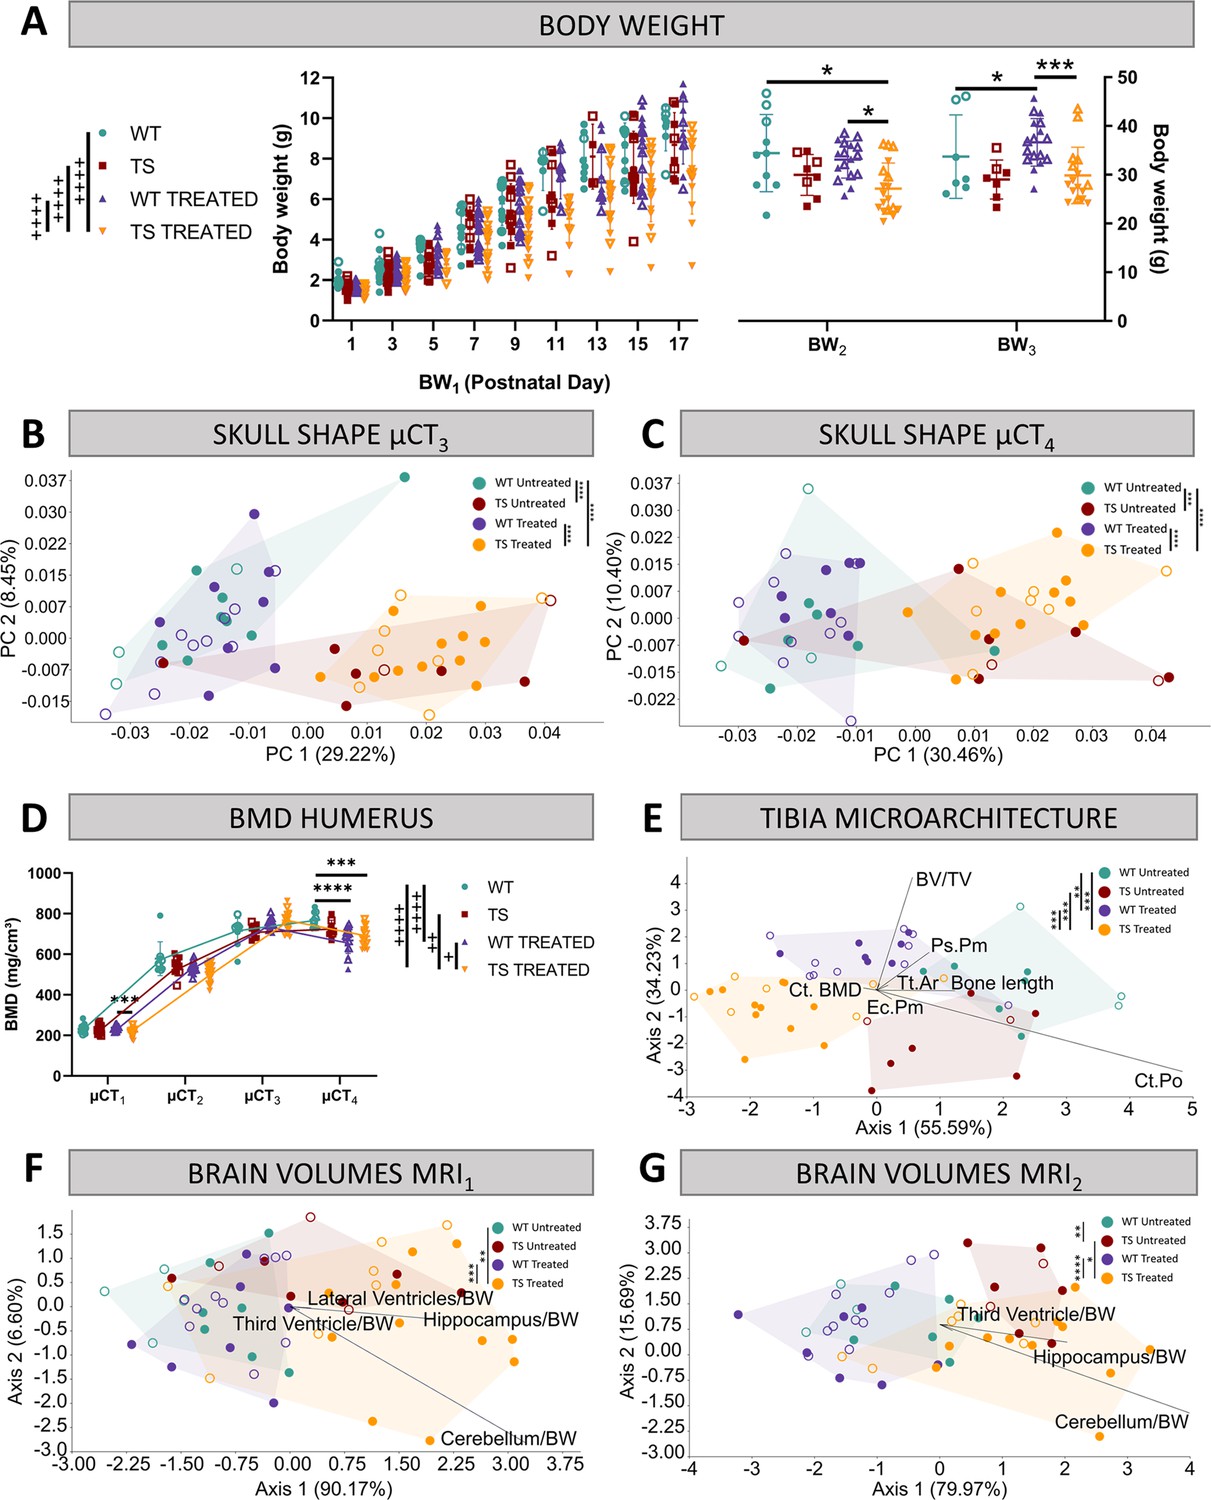
Evaluation of trisomy, prenatal chronic GTE-EGCG treatment and treatment discontinuation effects on structural traits.
(A) Body weight measurements over postnatal development in untreated and treated WT and TS mice. (B,C) Skull shape differences between adult WT and TS mice before (B) and after GTE-EGCG treatment discontinuation (C). Skull shape variation explored by a Principal Component Analysis (PCA) based on the 3D coordinates of landmarks recorded on the surfaces of 3D craniofacial reconstructions from in vivo µCT at µCT3 (B) and µCT4 (C) timepoints. The landmark configuration for each stage is defined in Supplementary file 1e. Scatter plots are presented along with the morphings associated with the negative and positive extremes of the PC1 axis. Statistical differences between groups were assessed by permutation tests based on the Procrustes distances. (D) Bone mineral density of the humerus over postnatal development. The in vivo µCT scans of the humerus were used to determine the BMD at µCT1, µCT2, µCT3, and µCT4 timepoints. (E) Linear discriminant analysis (LDA) based on the results from the tibia microarchitecture tests performed at endpoint (8 M), three months after chronic treatment discontinuation. (F,G) LDA based on the brain volumes obtained from in vivo MRI before (F) and after GTE-EGCG treatment discontinuation (G). The contribution of each variable to separate groups of mice across Axis 1 and Axis 2 is represented in each LDA as lines pointing in the direction of each axis, with longer lines indicating higher contributions. All data are presented as mean +/-standard deviation. (+) p<0.05; (++) p<0.01; (++++) p<0.0001; Mixed-effects analysis across timepoints; (***) p<0.001; (****) p<0.0001; pairwise comparisons. Mice analyzed may differ across stages due to due to uncontrollable technical issues inherent to longitudinal studies, such as scanning failure or mouse death during the experiment but represent overall ontogenetic trajectories. Male mice are indicated with empty symbols. Sample sizes used in each test are provided in Supplementary file 1a.
Figure 2—figure supplement 1
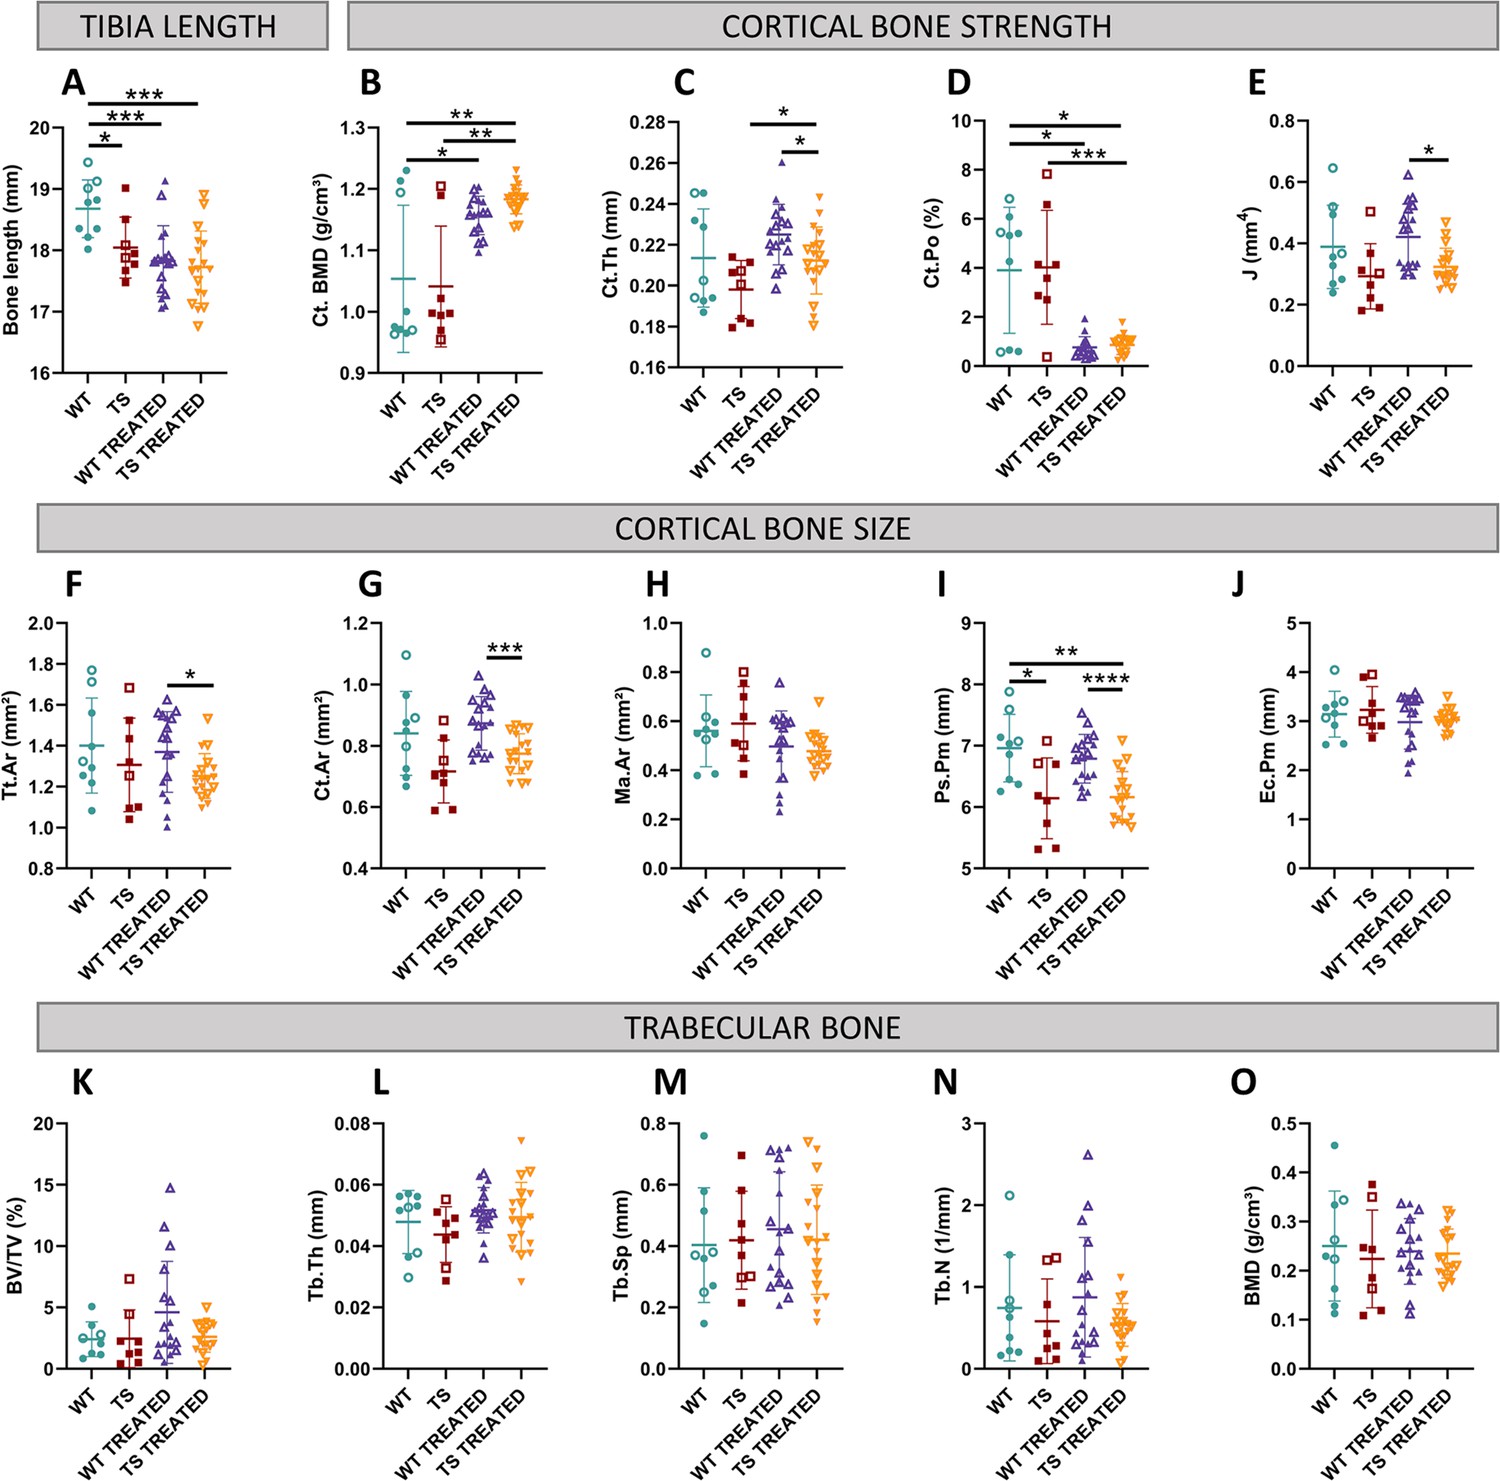
Univariate analysis of tibia microarchitecture in wildtype and trisomic mice at adulthood and effects of prenatal chronic GTE-EGCG treatment and 3 months of discontinuation.
(A) The tibia length was measured using a digital caliper at endpoint. The measurements assessing the microarchitecture of the tibia were obtained from ex vivo µCT scans and grouped in three categories according to structural bone domains: (1) Cortical bone strength: (B) cortical bone mineral density, (C) cortical thickness, (D) cortical porosity, and (E) polar moment of inertia; (2) Cortical bone size: (F) cross-sectional area, (G) bone area, (H) medullary area, (I) periosteal perimeter, and (J) endocortical perimeter. (3) Trabecular bone: (K) percentage of bone volume, (L) trabecular thickness, (M) trabecular separation, (N) trabecular number, and (O) bone mineral density. Data are presented as mean +/-standard deviation. (*) p<0.05; (**) p<0.01; (***) p<0.001; (****) p<0.0001; pairwise tests. Male mice are indicated with empty symbols. Sample sizes for each test are provided in Supplementary file 1a.
Figure 2—figure supplement 2
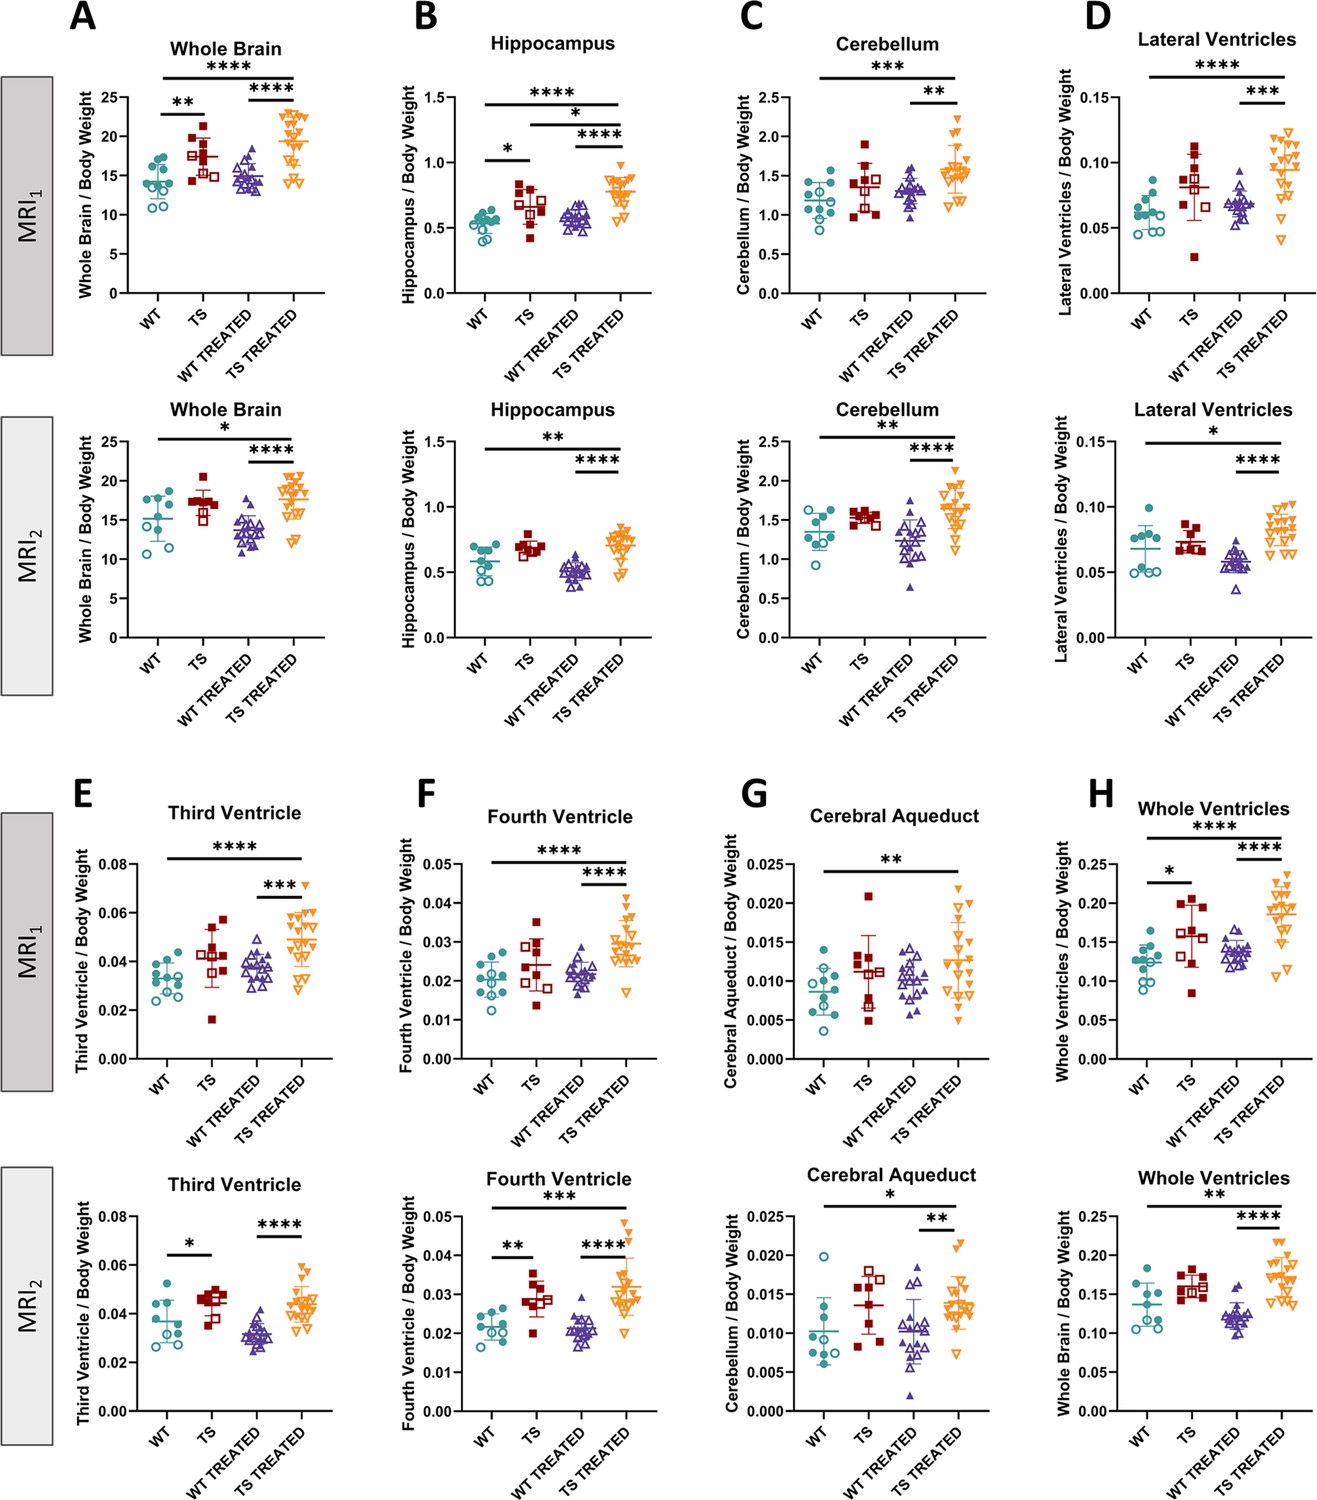
Univariate analysis of brain volumes in wildtype and trisomic mice at adulthood and effects of prenatal chronic GTE-EGCG treatment and its discontinuation.
The in vivo MRI scans performed at MRS1 and MRS2 were used to quantify the volumes of (A) the whole brain, (B) hippocampal region, (C) cerebellum, (D) lateral ventricles, (E) third ventricle, (F) the fourth ventricle, (G) cerebral aqueduct, and (H) whole ventricular system. All volumes were normalized to body weight. For each test, the results at MRI1 are presented on top and at MRI2 are presented on the bottom. Data are presented as mean +/-standard deviation. (*) p<0.05; (**) p<0.01; (***) p<0.001; (****) p<0.0001; pairwise tests. Male mice are indicated with empty symbols. Sample sizes for each test are provided in Supplementary file 1a.
Figure 3 with 3 supplements
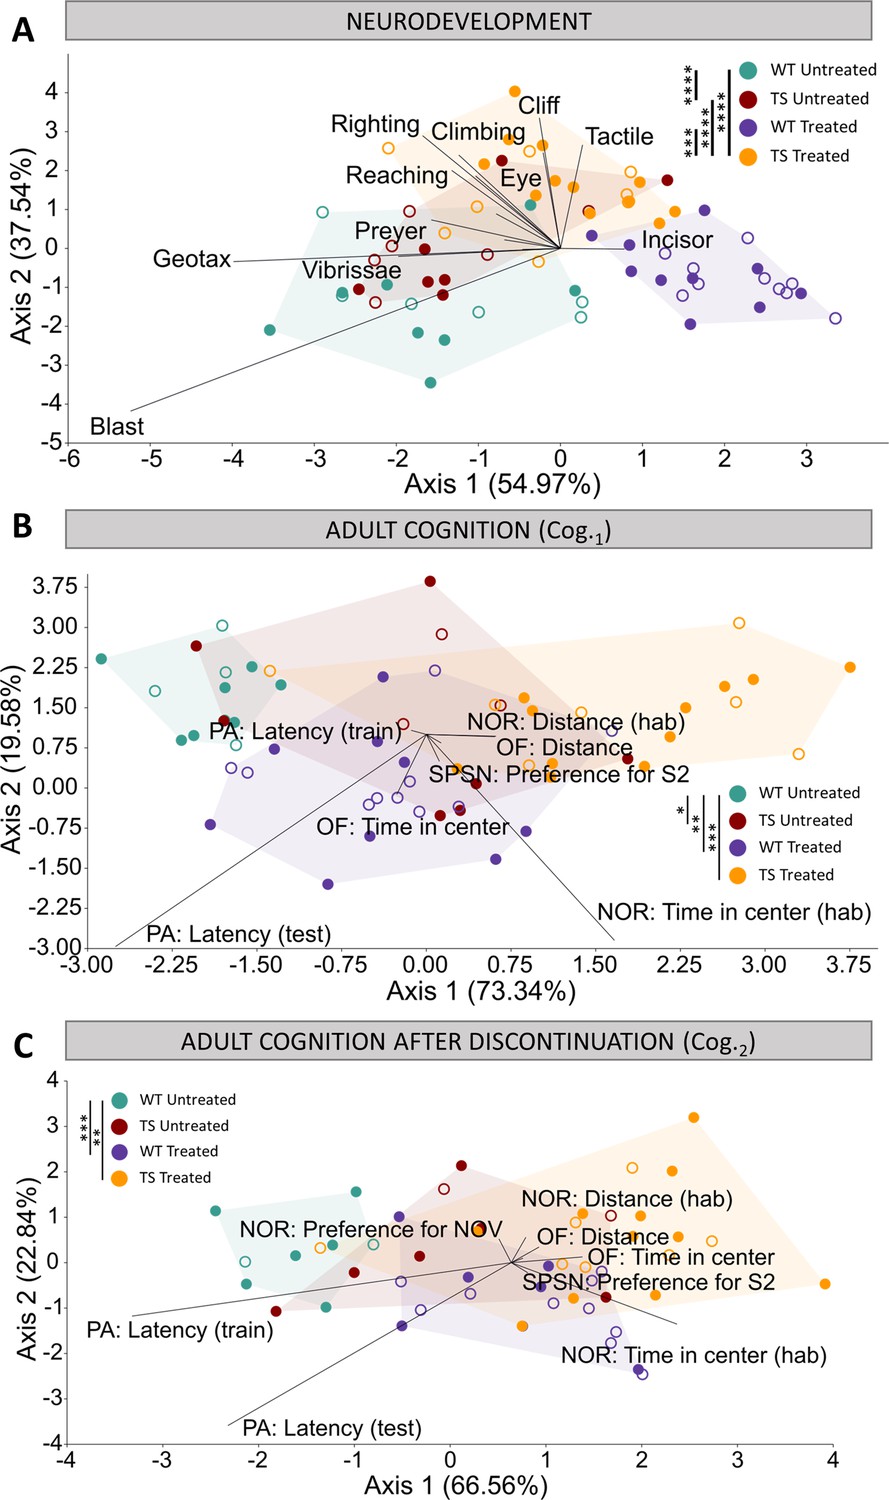
Evaluation of trisomy, prenatal chronic GTE-EGCG treatment and treatment discontinuation effects on cognitive function during development and at adulthood before and after treatment discontinuation.
(A) Linear discriminant analysis (LDA) based on the results from the neurodevelopmental tests performed from PD1 until PD18. (B,C) LDA based on the results from the cognitive tests performed at Cog.1 (B) and Cog.2 (C). The contribution of each variable to separate groups of mice across Axis 1 and Axis 2 is represented in each LDA as lines pointing in the direction of each axis, with longer lines indicating higher contributions. Male mice are indicated with empty symbols. Sample sizes for each test are provided in Supplementary file 1a.
Figure 3—figure supplement 1
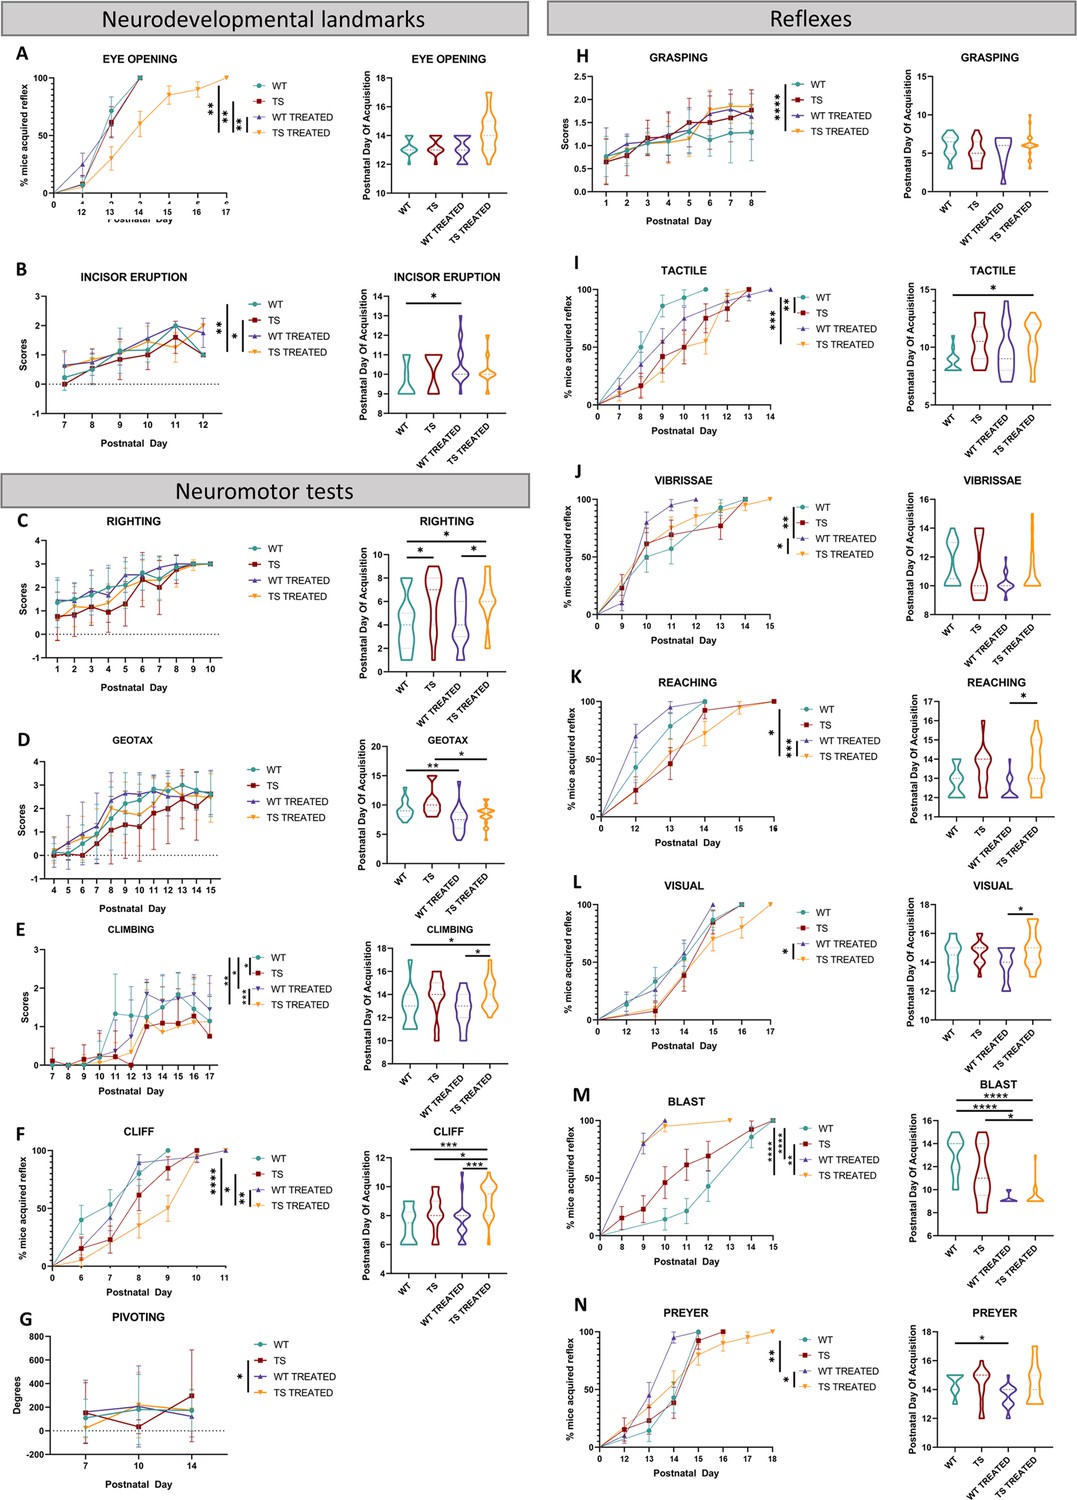
Univariate analysis of early postnatal neurodevelopment in WT and TS mice and effects of pre- and postnatal GTE-EGCG treatment.
Neurodevelopment tests were performed from PD1 to PD18 and grouped into three categories according to functional domains. (1) Neurodevelopmental landmarks: (A) eye opening, (B) incisor eruption, and pinna detachment (results not shown as no significant differences were detected). (2) Neuromotor development: (C) surface righting response, (D) negative geotaxis, (E) vertical climbing, (F) cliff drop aversion, (G) pivoting, homing and walking (results not shown as no significant differences were detected). (3) Reflexes: (H) grasping, (I) tactile orientation, (J) vibrissae placing, (K) reaching response, (L) visual placing response, (M) blast response and (N) Preyer reflex. For each test, developmental rate is presented on the left as mean +/-standard deviation and average day of successful test acquisition is presented on the right as violin plots. (*) p<0.05; (**) p<0.01; (***) p<0.001; (****) p<0.0001. Sample sizes for each test are provided in Supplementary file 1a.
Figure 3—figure supplement 2
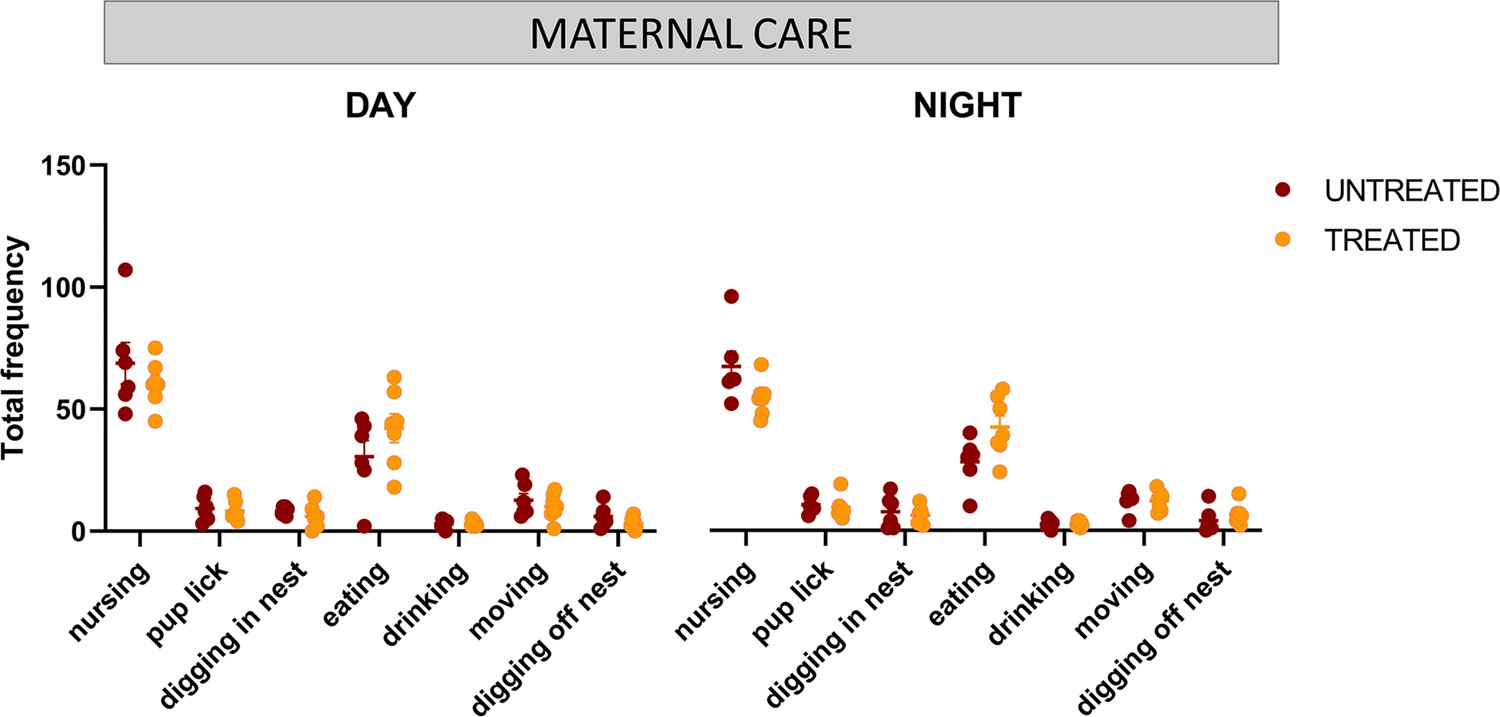
Maternal care evaluation and effects of GTE-EGCG treatment.
Frequency of nursing, pup grooming, digging in nest, eating, drinking, moving, and digging off nest behaviors scored manually from 24 hr videotapes at PD8. Sample sizes for each test are provided in Supplementary file 1a.
Figure 3—figure supplement 3
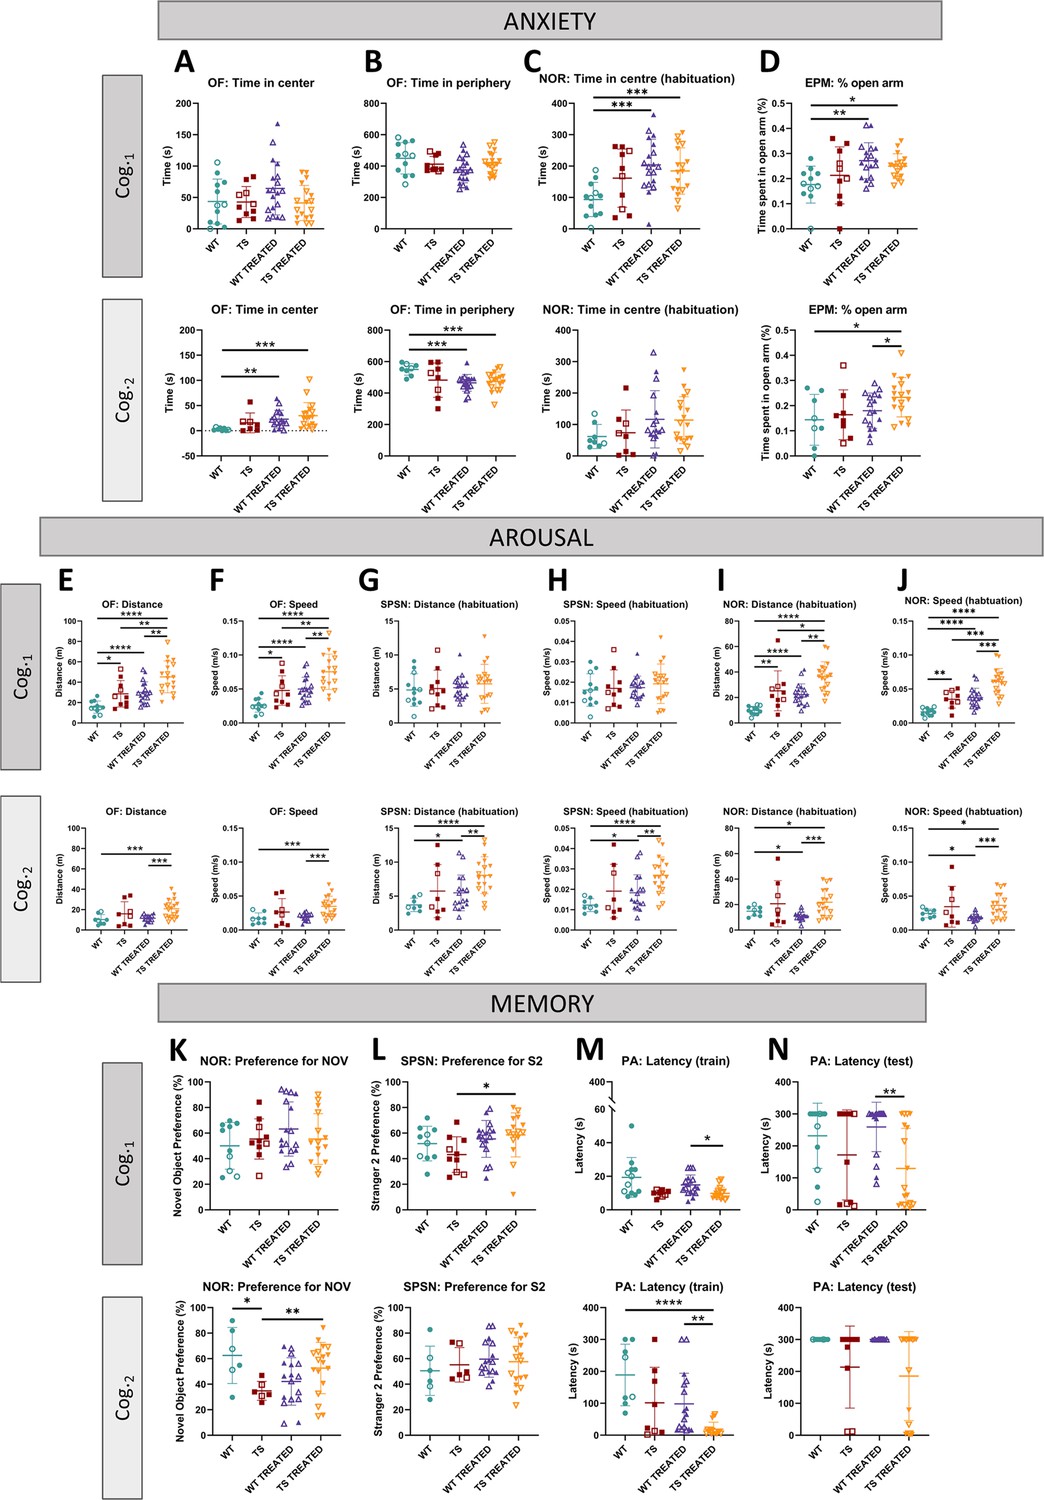
Univariate analysis of adult cognition in WT and TS mice and effects of prenatal chronic GTE-EGCG treatment and its discontinuation.
Results for open field (OF), novel object recognition (NOR), elevated plus maze (EPM), sociability/preference for social novelty (SPSN) and passive avoidance (PA) tests performed at Cog.1 (top) and Cog.2 (bottom) were grouped into three categories according to functional domains. (1) Anxiety tests: (A) time in center during OF, (B) time in periphery during OF, (C) time in center during habituation for NOR, and (D) percentage of time in open arm during EPM. (2) Arousal tests: (E) total distance covered during OF, (F) mean speed during OF, (G) total distance covered during SPSN, (H) mean speed during SPSN, (I) total distance covered during habituation for NOR, and (J) mean speed during habituation for NOR. (3) Memory tests: (K) preference for novel object during testing for NOR, (L) preference for second stranger during SNS2, (M) latency to enter dark chamber during training for PA, and (N) latency to enter dark chamber during testing for PA. For each test, the results at Cog.1 are presented on top and the results at Cog.2 are presented on the bottom. Data are presented as mean +/-standard deviation. (*) p<0.05; (**) p<0.001; (***) p<0.001; (****) p<0.0001. Male mice are indicated with empty symbols. Sample sizes for each test are provided in Supplementary file 1a.
Figure 4 with 1 supplement
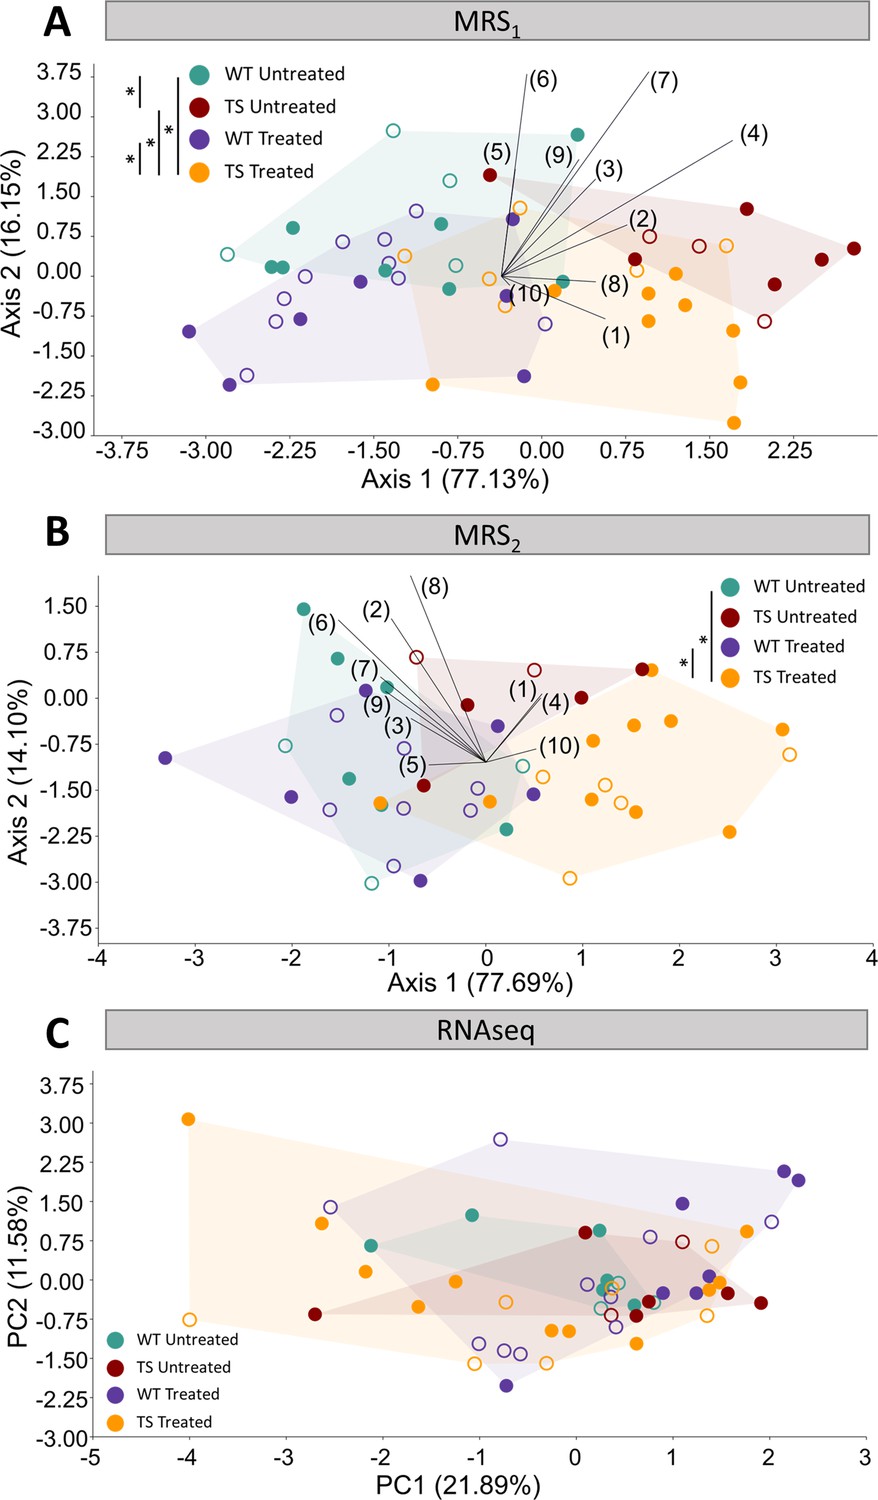
Evaluation of trisomy, prenatal chronic GTE-EGCG treatment and treatment discontinuation effects on molecular and gene expression parameters.
(A,B) Linear discriminant analysis (LDA) based on the relative integrals of 10 spectral regions obtained from MRS performed in the hippocampal region at MRS1 (A) and MRS2 (B). The contribution of each variable to separate groups of mice across Axis 1 and Axis 2 is represented in each LDA as lines pointing in the direction of each axis, with longer lines indicating higher contributions. (C) Principal component analysis (PCA) based on the normalized expression of the 125 triplicated genes obtained from RNAseq at 8 M. Male mice are indicated with empty symbols. Sample sizes for each test are provided in Supplementary file 1a.
Figure 4—figure supplement 1
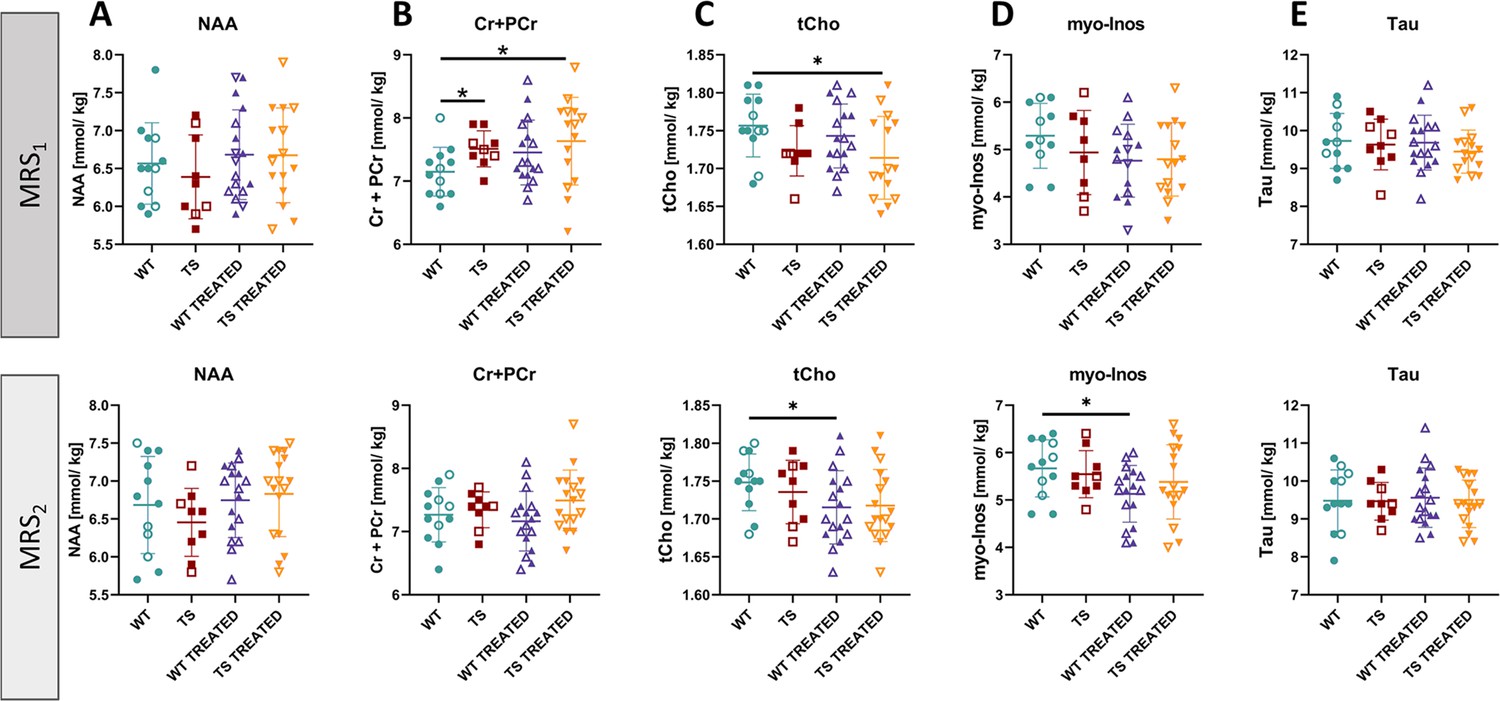
Univariate analysis of hippocampal metabolites in wildtype and trisomic mice at adulthood and effects of prenatal chronic GTE-EGCG treatment and its discontinuation.
The in vivo MRS scans performed in the hippocampal region at MRS1 (top) and MRS2 (bottom) were used to quantify the concentrations of (A) N-acetylaspartate (NAA), (B) creatine +phosphocreatine (Cr +PCr), (C) choline +phosphocholine + GPC (tCho), (D) myo-Inositol (myo-Inos) and (E) taurine (Tau). For each test, the results at MRS1 are presented on top and results at MRS2 are presented on the bottom. Data are presented as mean +/-standard deviation. (*) p<0.05; pairwise tests. Male mice are indicated with empty symbols. Sample sizes for each test are provided in Supplementary file 1a.
Additional files
-
Supplementary file 1
Experimental, statistical and methodological details.
(a) Sample size for each analysis, experiment, and developmental stage. Differences in sample size between stages are due to technical reasons such as micro-CT or MR scanner not operating on the scanning day, movement scanning artifacts, or mouse death during the experiment. For the tibia microarchitecture, differences in sample size are due to mice detected as outliers. For the MRS, differences in sample size are due to signal artifacts. For the adult cognitive tests, differences in sample size are due to artifacts during tracking. (b) Table showing the most concentrated metabolites contributing to the respective spectral regions in MRS. ala – alanine, arg – arginine, cre – creatine, cys – cysteine, Hα of AA – α hydrogen of amino acids, ile – iso leucine, leu – leucine, lys – lysine, gaba – γ-amino butyrate, gln – glutamine, glu – glutamane, gly – glycine, GPC – glycerol phosphocholine, his – histidine, NAA – N-acetyl aspartate, PChol – phosphocholine, PCr – phosphocreatine,tyr – tyrosine, val – valine. Figure showing MR spectra and integrated spectral regions for multivariate MRS analysis. The region from 0 to 4.3 ppm of a representative MR spectrum is shown. Regions 11 and 12, representing contaminations from macromolecules, were not included in the analysis as they showed large variability. (c) Litter information. For each mouse, the litter number, genotype, treatment received and sex are provided. (d) µCT scanning parameters used at each stage. (e) Table and figure showing the anatomical definition of craniofacial landmarks. N/A indicates that the landmarks were not acquired at this stage. (A) Set of 34 landmarks characterizing craniofacial shape at µCT1 from a 3D reconstruction of a µCT scan. (B) Set of 27 landmarks characterizing craniofacial shape at µCT2, µCT3 and µCT4 from a 3D reconstruction of a µCT scan. (f) Trabecular bone parameters measured from ex vivo micro-CT images at 8 M. (g) Cortical bone parameters measured from ex vivo micro-CT images at 8 M. (h) Normality, homoscedasticity, and statistical tests performed per parameter. If one of the four mice groups was not normally distributed or one pairwise comparison was not homoscedastic, the variable was considered as not normally distributed and/or not homoscedastic.i. Variables included in each Linear Discriminant Analysis or Principal Component Analysis.
- https://cdn.elifesciences.org/articles/89763/elife-89763-supp1-v1.xlsx
-
Supplementary file 2
P-values resulting from each test.
(a) P-values resulting from permutation tests (10,000 permutation rounds) based on Procrustes distances among groups for craniofacial shape. Bold font indicates statistically significant values. Pairwise comparisons marked as N/A were not calculated since they did not evaluate any relevant scientific question. (b) P-values resulting from the mixed-effects analysis and pairwise tests for humerus BMD. Bold font indicates statistically significant values after Benjamini–Hochberg correction. Pairwise comparisons marked as N/A were not calculated since they did not evaluate any relevant scientific question. (C) P-values resulting from the pairwise tests after a one-way PERMANOVA (9,999 permutation rounds) based on Mahalanobis distances for tibia microarchitecture parameters. Bold font indicates statistically significant values. Pairwise comparisons marked as N/A were not calculated since they did not evaluate any relevant scientific question. (d) P-values resulting from the pairwise tests after a one-way PERMANOVA (9,999 permutation rounds) based on Mahalanobis distances for brain volumes before treatment discontinuation. Bold font indicates statistically significant values. Pairwise comparisons marked as N/A were not calculated since they did not evaluate any relevant scientific question. (e) P-values resulting from the pairwise tests after a one-way PERMANOVA (9,999 permutation rounds) based on Mahalanobis distances for brain volumes after treatment discontinuation. Bold font indicates statistically significant values. Pairwise comparisons marked as N/A were not calculated since they did not evaluate any relevant scientific question. (f) P-values resulting from the pairwise tests after a one-way PERMANOVA (9,999 permutation rounds) based on Mahalanobis distances for early neurodevelopmental tests. Bold font indicates statistically significant values. Pairwise comparisons marked as N/A were not calculated since they did not evaluate any relevant scientific question. (g) P-values resulting from the pairwise tests after a one-way PERMANOVA (9,999 permutation rounds) based on Mahalanobis distances for adult cognitive tests before treatment discontinuation at Cog.1. Bold font indicates statistically significant values. Pairwise comparisons marked as N/A were not calculated since they did not evaluate any relevant scientific question. (h) P-values resulting from the pairwise tests after a one-way PERMANOVA (9,999 permutation rounds) based on Mahalanobis distances for adult cognitive tests after treatment discontinuation at Cog.2. Bold font indicates statistically significant values. Pairwise comparisons marked as N/A were not calculated since they did not evaluate any relevant scientific question. (i) P-values resulting from the pairwise tests after a one-way PERMANOVA (9,999 permutation rounds) based on Mahalanobis distances for MRS spectra before treatment discontinuation. Bold font indicates statistically significant values. Pairwise comparisons marked as N/A were not calculated since they did not evaluate any relevant scientific question. (j) P-values resulting from the pairwise tests after a one-way PERMANOVA (9,999 permutation rounds) based on Mahalanobis distances for MRS spectra after treatment discontinuation. Bold font indicates statistically significant values. Pairwise comparisons marked as N/A were not calculated since they did not evaluate any relevant scientific question. (k) P-values resulting from the pairwise tests after a one-way PERMANOVA (9,999 permutation rounds) based on Euclidean distances for normalized gene expression data at endpoint. Bold font indicates statistically significant values. Pairwise comparisons marked as N/A were not calculated since they did not evaluate any relevant scientific question.
- https://cdn.elifesciences.org/articles/89763/elife-89763-supp2-v1.xlsx
-
Supplementary file 3
Differentially expressed genes for each pairwise comparison.
- https://cdn.elifesciences.org/articles/89763/elife-89763-supp3-v1.xlsx
-
MDAR checklist
- https://cdn.elifesciences.org/articles/89763/elife-89763-mdarchecklist1-v1.pdf
Download links
A two-part list of links to download the article, or parts of the article, in various formats.
Downloads (link to download the article as PDF)
Open citations (links to open the citations from this article in various online reference manager services)
Cite this article (links to download the citations from this article in formats compatible with various reference manager tools)
Pleiotropic effects of trisomy and pharmacologic modulation on structural, functional, molecular, and genetic systems in a Down syndrome mouse model
eLife 12:RP89763.
https://doi.org/10.7554/eLife.89763.3


