Kit Ligand and Kit receptor tyrosine kinase sustain synaptic inhibition of Purkinje cells
- Department of Pediatrics & Human Development, College of Human Medicine, Michigan State University, United States
- Office of Research, Corewell Health, United States
- Department of Molecular and Systems Biology, Geisel School of Medicine at Dartmouth College, United States
Figures
Figure 1 with 1 supplement
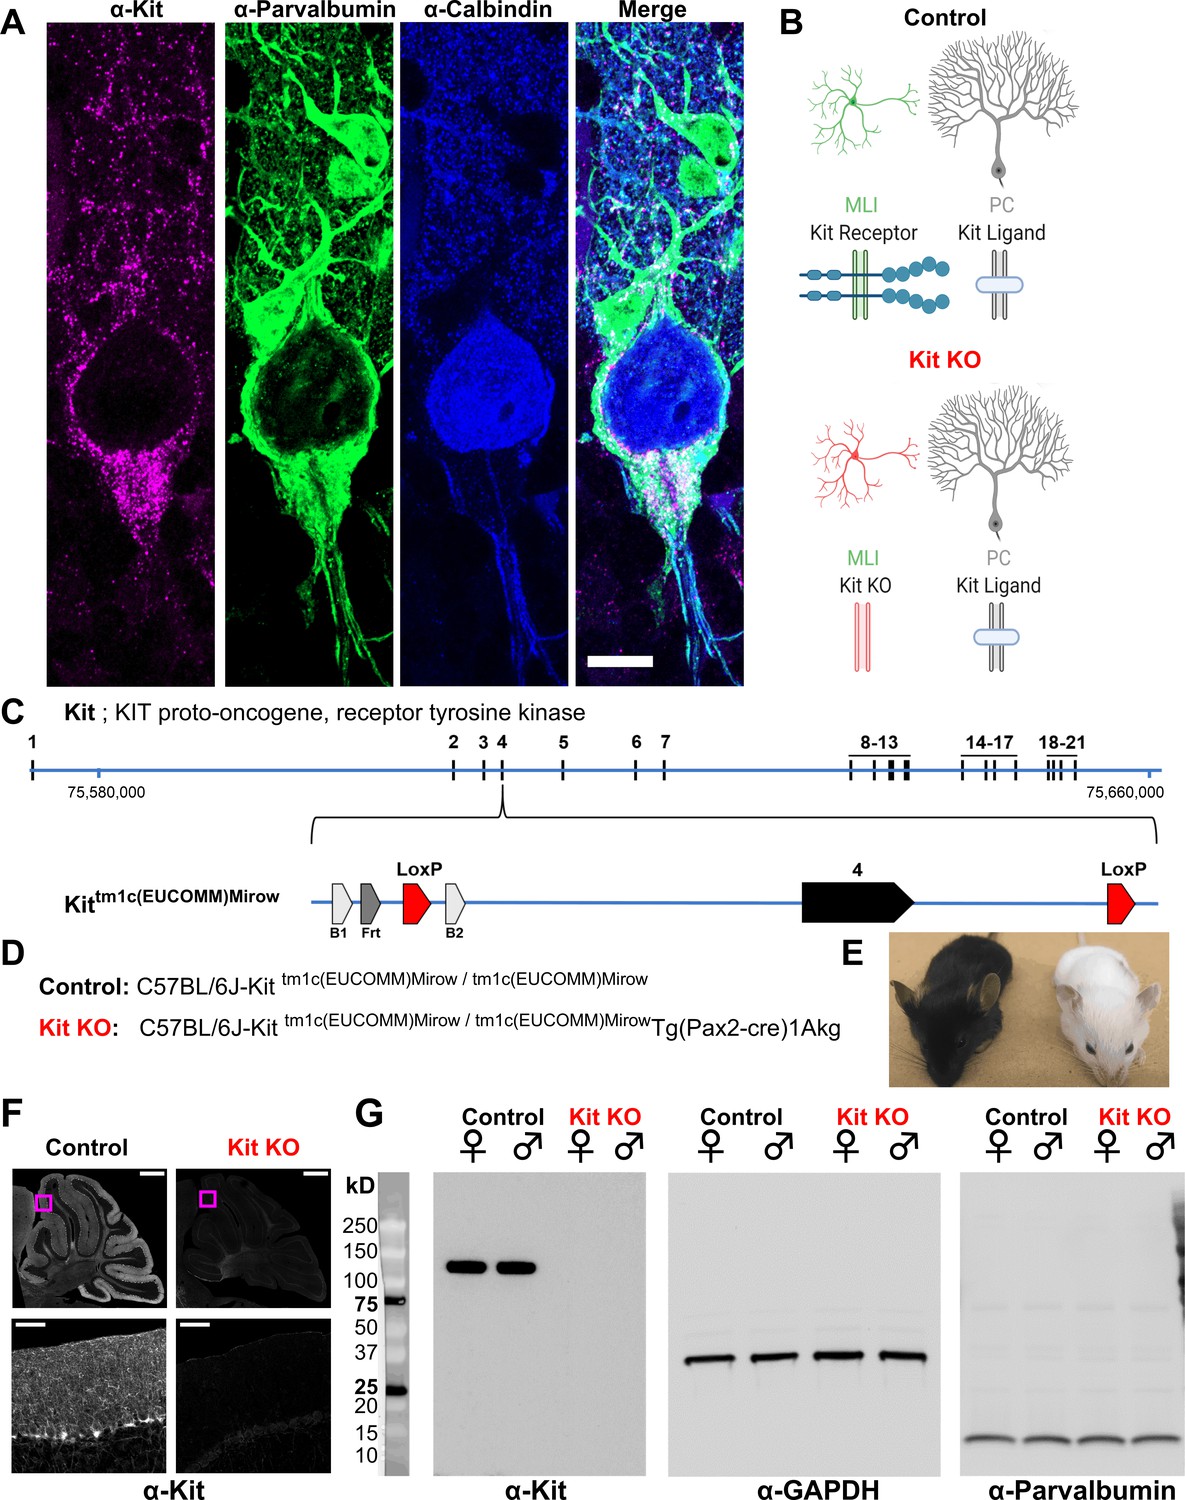
Design and validation of a Kit conditional knockout (KO) mouse.
(A, B) Kit receptor tyrosine kinase (Kit) is enriched in parvalbumin-positive GABAergic interneurons of the molecular layer (i.e., basket and stellate cells, MLIs) of the cerebellar cortex, where they synapse onto each other and onto Purkinje cells (PCs, Calbindin+), which express Kit Ligand (KL). Scale bar 10 microns. Expression pattern schematized in (B), Control. (C) In humans and mice, Kit protein is encoded by up to 21 exons, which in mouse is encoded on the plus strand of chromosome 5 at 75,735,647–75,817,382 bp. We generated a Kit conditional knockout mouse in which Kit exon 4 is floxed, flanked by LoxP sites. (D) We generated Control mice homozygous for the Kit floxed allele Kittm1c(EUCOMM)Mirow, which varied in (Pax2-Cre)1Akg transgene status, with the goal of depleting Kit from MLIs in embryonic development. (E) Pax2 Cre-mediated Kit KO mice were notably hypopigmented in hair and whiskers, though not eyes. (F) Confocal microscopy of Kit immunoreactivity in cerebella from age and sex-matched Control and Kit KO littermates demonstrates the established enrichment of Kit in the molecular layer of the Control cerebellar cortex, and its loss in Kit KO. Scale Bar 500 microns; top row, 50 microns inset. (G) Utilizing a distinct assay and different primary antibody, we confirm the detection of Kit immunoreactivity in Controls, and its loss in Kit KO litter mates of either sex by western blot of total protein lysates of cerebella. We affirmed equivalent protein loading by GAPDH and parvalbumin.
-
Figure 1—source data 1
Original unedited unlabeled blots for Figure 1G: Kit, GAPDH, and parvalbumin, respectively.
- https://cdn.elifesciences.org/articles/89792/elife-89792-fig1-data1-v1.zip
-
Figure 1—source data 2
Original unedited unlabeled blots for Figure 1G: Kit, GAPDH, and parvalbumin, respectively.
- https://cdn.elifesciences.org/articles/89792/elife-89792-fig1-data2-v1.zip
-
Figure 1—source data 3
Original unedited unlabeled blots for Figure 1G: Kit, GAPDH, and parvalbumin, respectively.
- https://cdn.elifesciences.org/articles/89792/elife-89792-fig1-data3-v1.zip
-
Figure 1—source data 4
Labeled blots for Figure 1G.
- https://cdn.elifesciences.org/articles/89792/elife-89792-fig1-data4-v1.zip
Figure 1—figure supplement 1
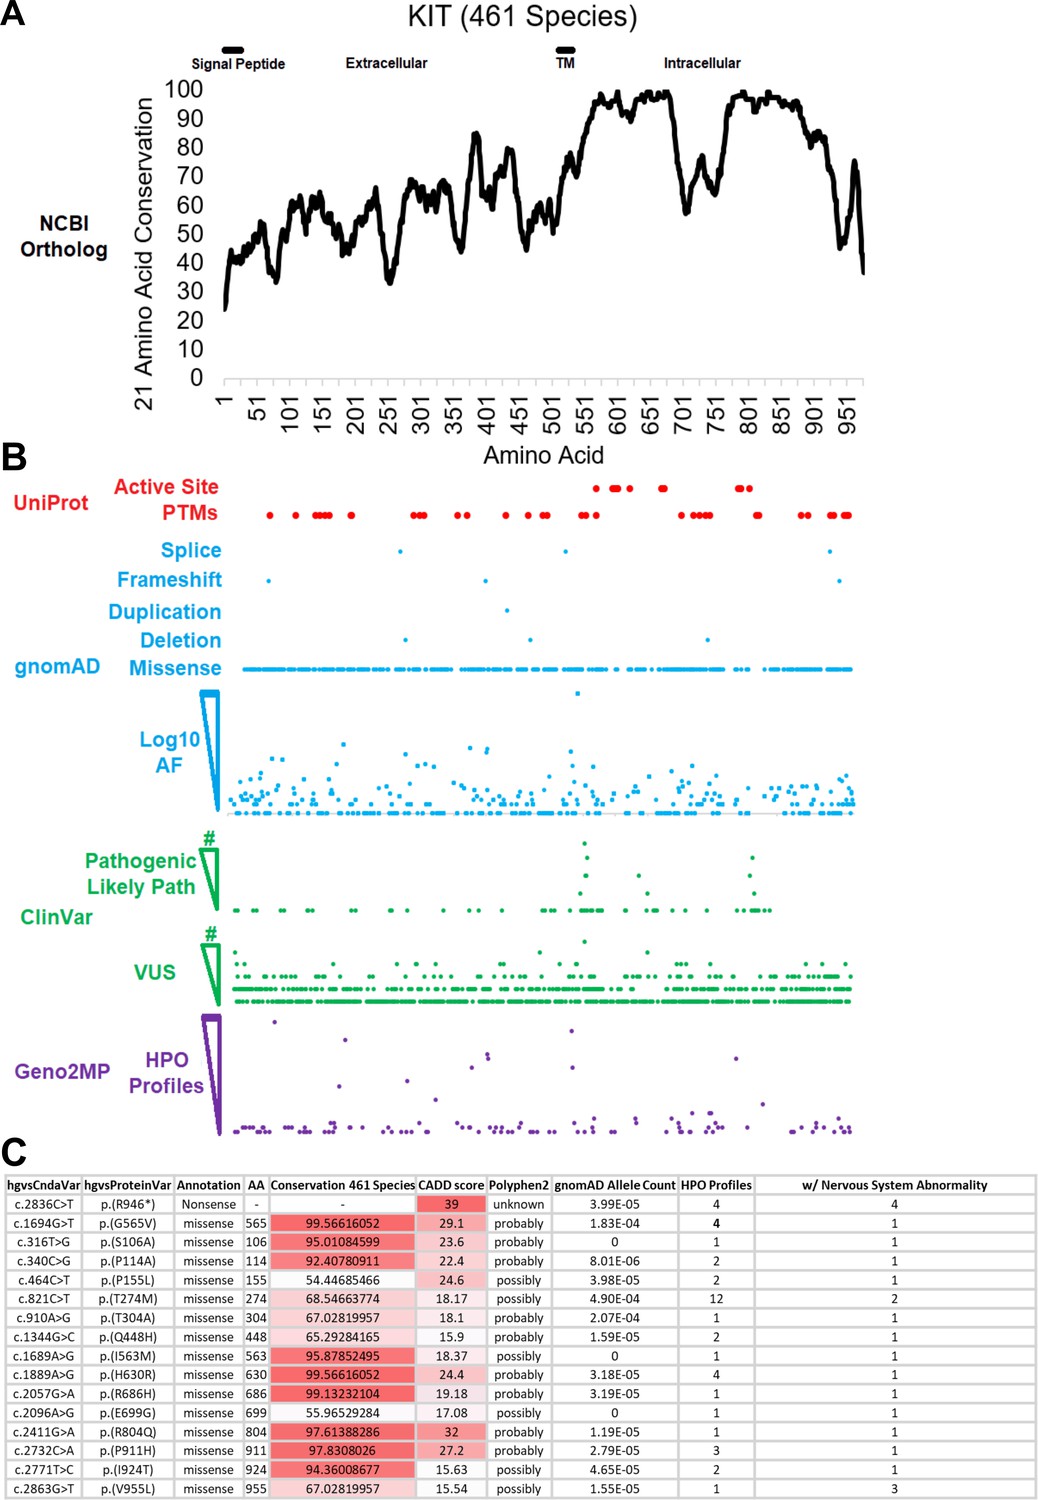
Kit receptor tyrosine kinase is a highly conserved gene affiliated with neurological impairment.
(A) KIT protein sequences were extracted from NCBI ortholog on March 2023 and aligned with MUSCLE. Conservation was placed on a 21 amino acid sliding window to calculate linear motifs. The intracellular domain possesses a split cytoplasmic kinase motif demonstrating the degree of conservation across 461 species. (B) Alignment of Active Site and Post-Translational Motif (PTMs) to Kit amino acid conservation and gnomAD, ClinVar, and Geno2MP human variants. (C) Human Genome Variation Society annotations for human DNA and corresponding encoded amino acid changes affiliated with their mutational class (Annotation), Site (AA), and Conservation across 461 species. Combined Annotation-Dependent Depletion (CADD) score for deleteriousness of SNV or indel variants. Polymorphism Phenotyping v2 (PolyPhen2) annotations predict impact of amino acid substitution on Kit structure function. Allele counts in Gnomad and the number of profiles in the Human Phenotype Ontology associated with Nervous System Abnormality. Dataset details at https://doi.org/10.6084/m9.figshare.25000106.v1.
Figure 2 with 4 supplements
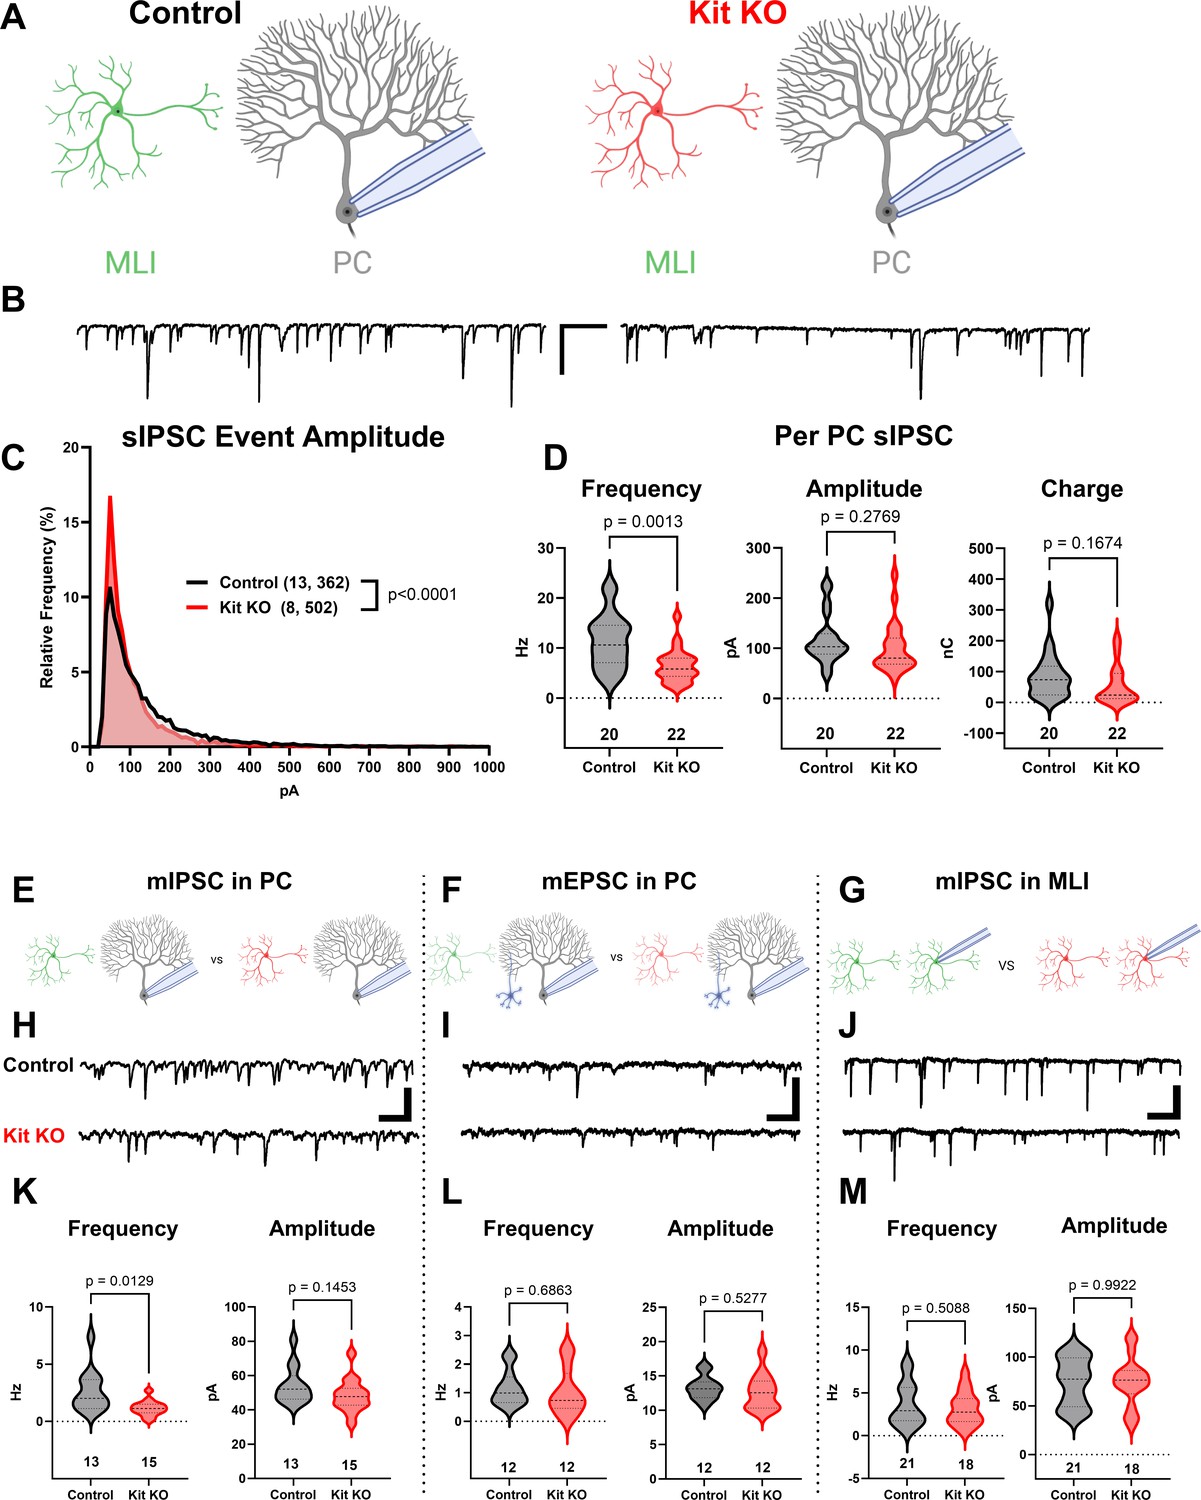
The knockout of Kit from cerebellar cortex interneurons impairs inhibition of Purkinje cells (PCs).
(A, B) Experimental schema and example traces of spontaneous inhibitory postsynaptic currents (sIPSC) in PCs from Control animals or from those with Kit KO from cerebellar cortex molecular layer interneurons (MLIs). Scale bar is 500 ms × 100 pA. (C) A frequency distribution plot for individual sIPSC event amplitudes recorded in PCs as in (A, B). A Kolmogorov–Smirnov (KS) test reveals a significant difference in the distribution of these event amplitudes; p < 0.0001, n in chart. (D) For each PC, the average sIPSC frequency and amplitude, and the total inhibitory charge transfer, was determined. There was a significant ~50% decrease in sIPSC frequency, but the decrease in amplitude or charge transfer was not significant. (E–G) Experimental schema: in separate experiments, we recorded miniature postsynaptic currents from PCs or from MLIs in Control and Kit KO animals. (H) Example traces of miniature inhibitory postsynaptic currents (mIPSCs) or (I) miniature excitatory postsynaptic currents (mEPSCs) recorded in PCs, and example traces of mIPSC in MLIs, all from Control or Kit KO animals. Scale for (H) and (J) is 50 pA, 25 pA for (I), all 500 ms. (K–M) Analysis of per cell average miniature event frequency and amplitude revealed that Kit KO significantly reduced mIPSC frequency, but not amplitude, in PCs by > 50%, p = 0.013. mEPSCs in PCs and mIPSC in MLIs were not significantly different between Control and Kit KO. n in charts refers to the number of cells. Error bars are SEM. p-Values were calculated by a two-tailed t-test, with Welch’s correction as needed.
© 2024, BioRender Inc. Figure 2 was created using BioRender, and is published under a CC BY-NC-ND license. Further reproductions must adhere to the terms of this license.
Figure 2—figure supplement 1
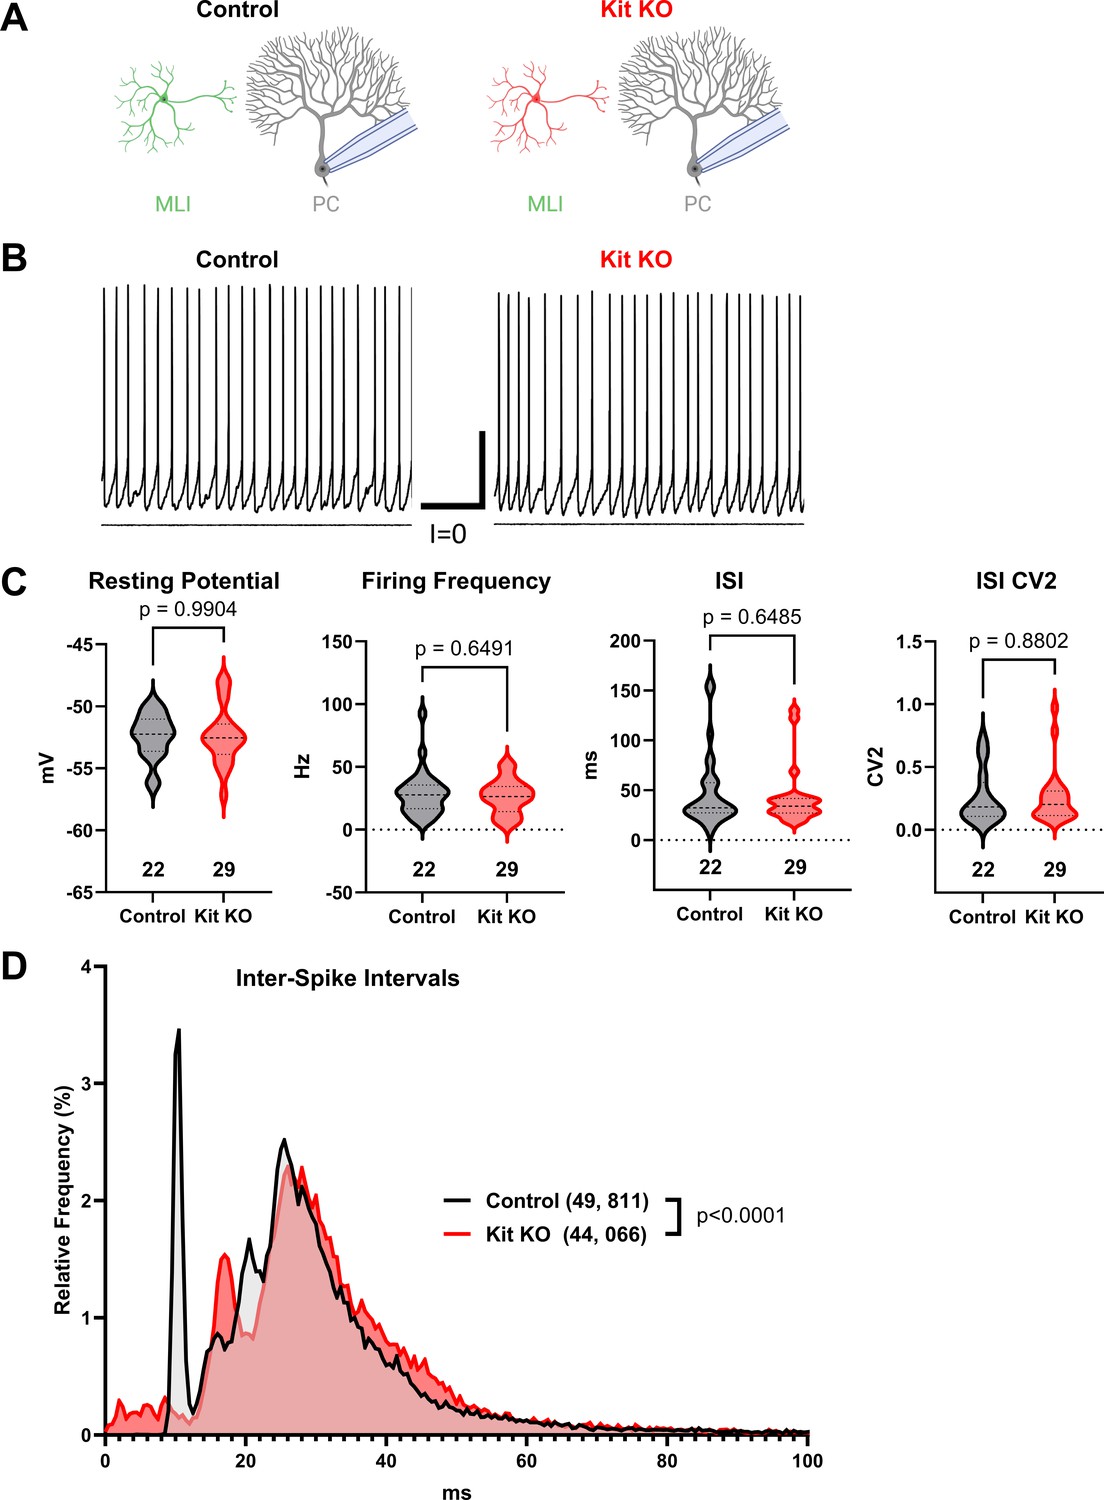
Kit knockout (KO) does not impact basal Purkinje cell (PC) firing.
(A) Experimental schema and (B) example traces. Whole-cell patch-clamp recordings were made from Purkinje cells in acute cerebellar slices from Control or from Kit KO mice. Scale 250 ms × 20 mV. (C) Analysis of PC resting membrane potential, spontaneous action potential firing frequency, average per cell inter-spike interval (ISI), or per cell ISI CV2, revealed no significant differences between conditions. p-Values calculated by two-tailed t-test with Welch’s correction as needed. (D) A histogram and KS test of individual ISIs illustrates some differences in the distribution of PC spike timing in Kit KO vs Control conditions.
© 2024, BioRender Inc. Figure 2—figure supplement 1 was created using BioRender, and is published under a CC BY-NC-ND license. Further reproductions must adhere to the terms of this license.
Figure 2—figure supplement 2
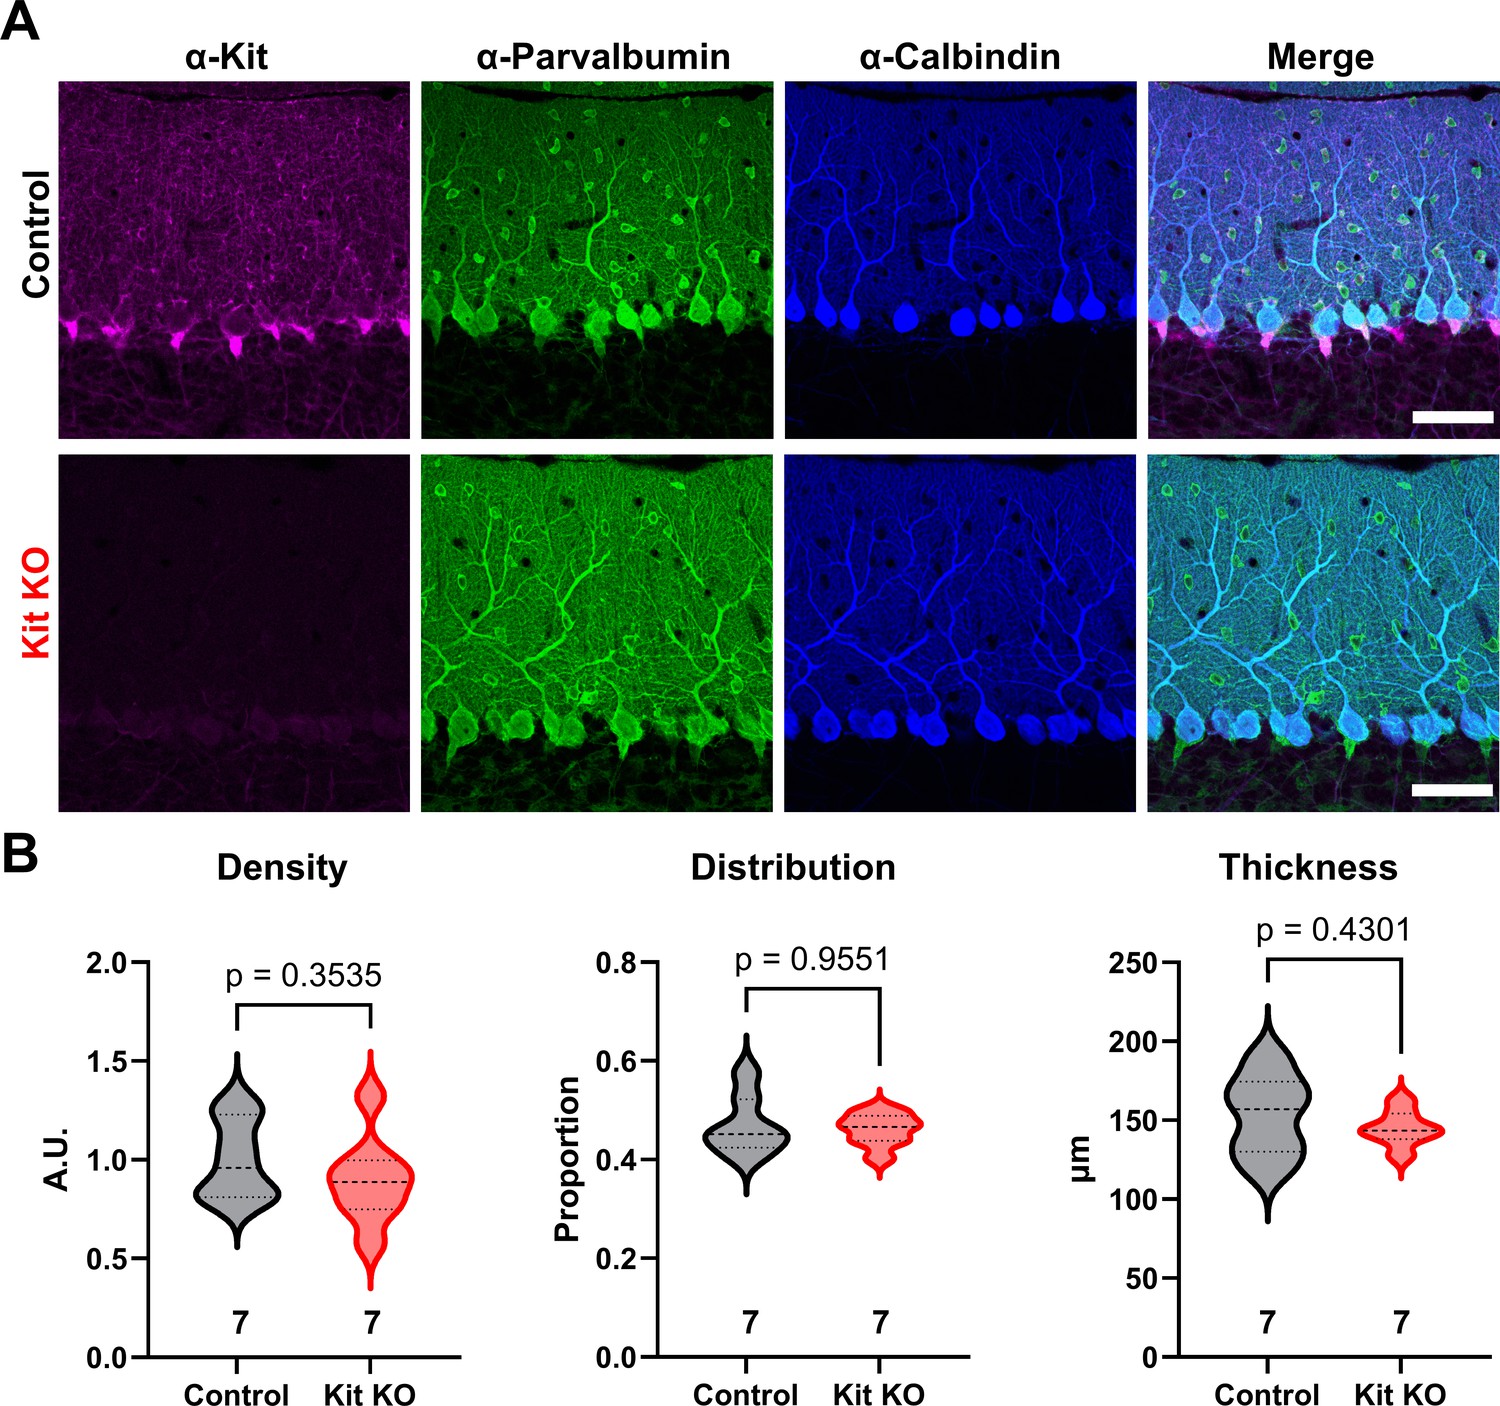
Kit knockout (KO) does not alter molecular layer interneuron (MLI) number or distribution.
(A) Immunohistochemistry and confocal microscopy of Control and Kit KO mouse cerebellar cortex validates the normal enrichment and targeted depletion of Kit in Control and Kit KO animals, respectively. Parvalbumin immunoreactivity is present in both MLIs and Purkinje cells, while the latter is selectively calbindin immunoreactive. Scale bar 50 microns. (B) Quantification of the density of parvalbumin-positive and or calbindin-negative somas within the molecular layer reveals that the density of MLIs is not reduced by Kit KO. Quantification of the average position of MLI somas between the basal (0) and distal (1) borders of the molecular layer reveals that the Control and Kit KO MLIs have comparable distributions within the molecular layer. Quantification of the thickness of the molecular layer reveals no significant difference between Control and Kit KO conditions. p-Values were calculated by a two-tailed t-test with Welch’s correction as necessary, except for distribution, which utilized Mann–Whitney. N refers to the number of different animals whose comparable tissues were evaluated.
Figure 2—figure supplement 3
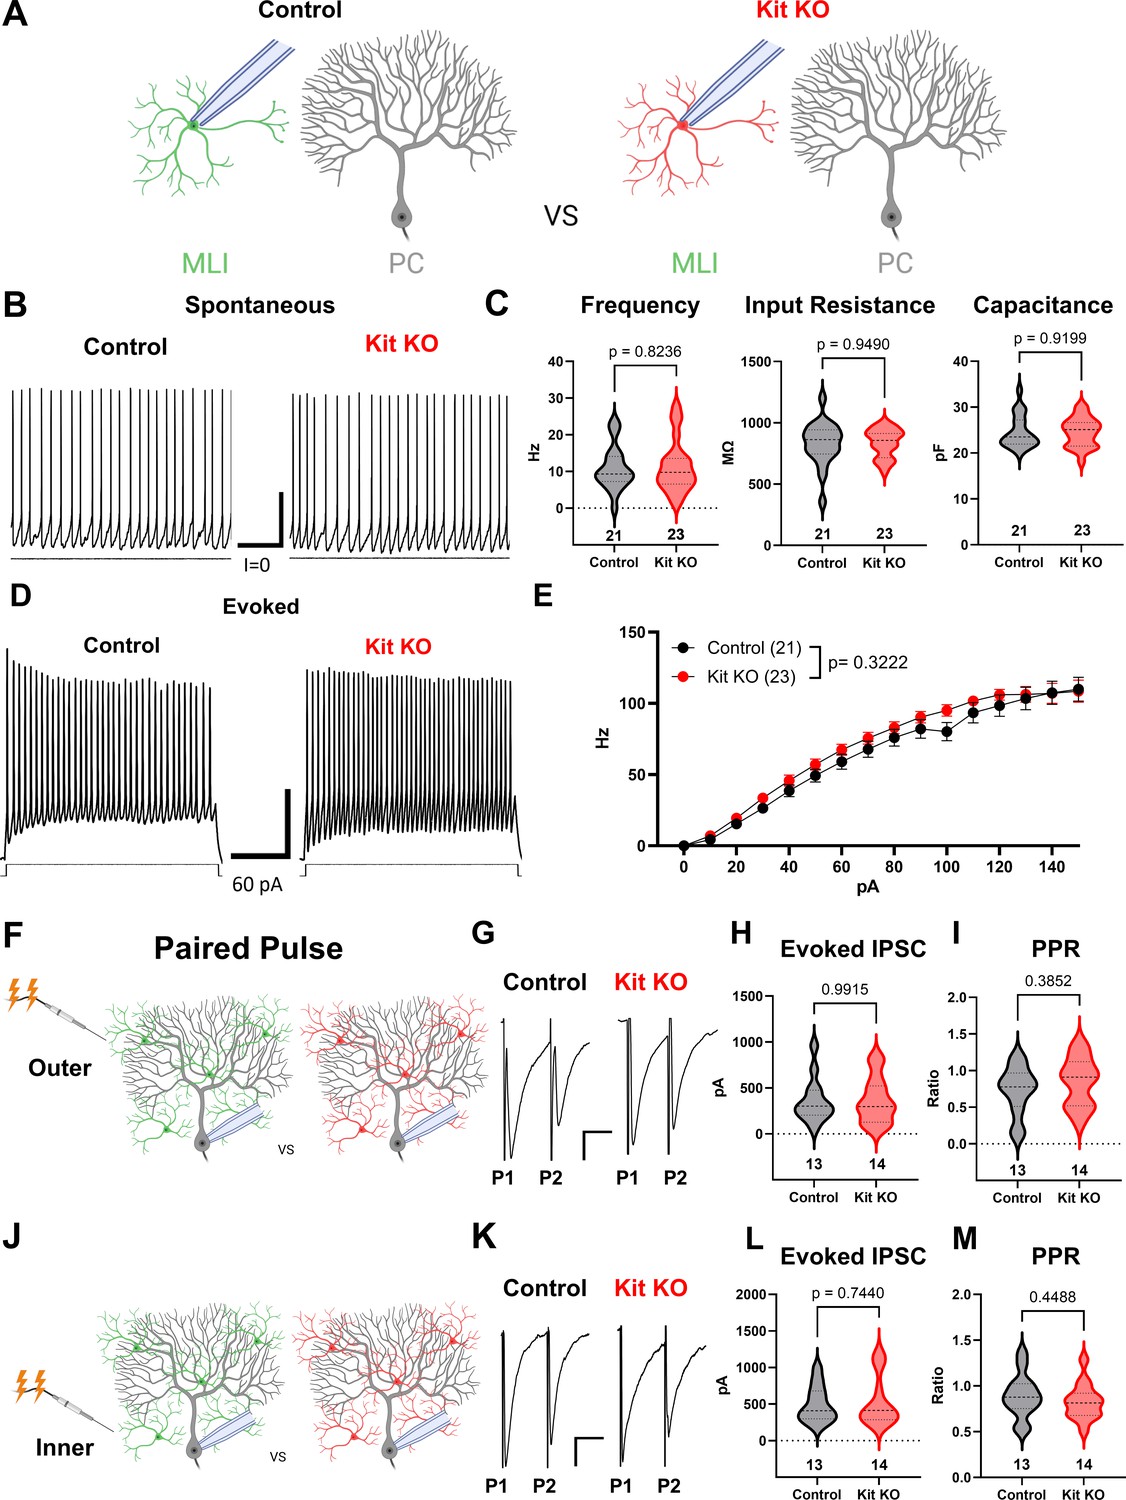
Kit knockout (KO) does not alter intrinsic properties of molecular layer interneurons (MLIs).
(A) Experimental schema. Patch-clamp recordings were performed on MLIs in acute cerebellar slice preparations from Control or Kit KO animals. (B, C) Patch-clamp recordings of spontaneous action potentials and intrinsic properties in Control and Kit KO MLIs revealed no significant difference in average firing frequency, membrane capacitance, or input resistance. Scale bar 100 ms × 10 mV. (D, E) Current steps were injected into Control or Kit KO MLIs, example traces (D) and quantification (E) revealed no significant interaction of genotype and current on evoked mean firing frequency. Scale bar 100 ms × 10 mV. (F, J) Experimental schema. Paired pulses were delivered via stimulating electrode placed in the outer or in the Inner molecular layer, and evoked Inhibitory postsynaptic currents were evaluated. Example traces in (G) and (K). (H, I, L, M) The average amplitude of the first evoked inhibitory current, or the paired pulse ratio, did not differ between control and Kit KO, under either stimulation of the outer or inner molecular layer. p-Values were calculated by a two-tailed t-test with Welch’s correction as necessary. n refers to the number of different recorded cells per condition.
© 2024, BioRender Inc. Figure 2—figure supplement 3 was created using BioRender, and is published under a CC BY-NC-ND license. Further reproductions must adhere to the terms of this license.
Figure 2—figure supplement 4
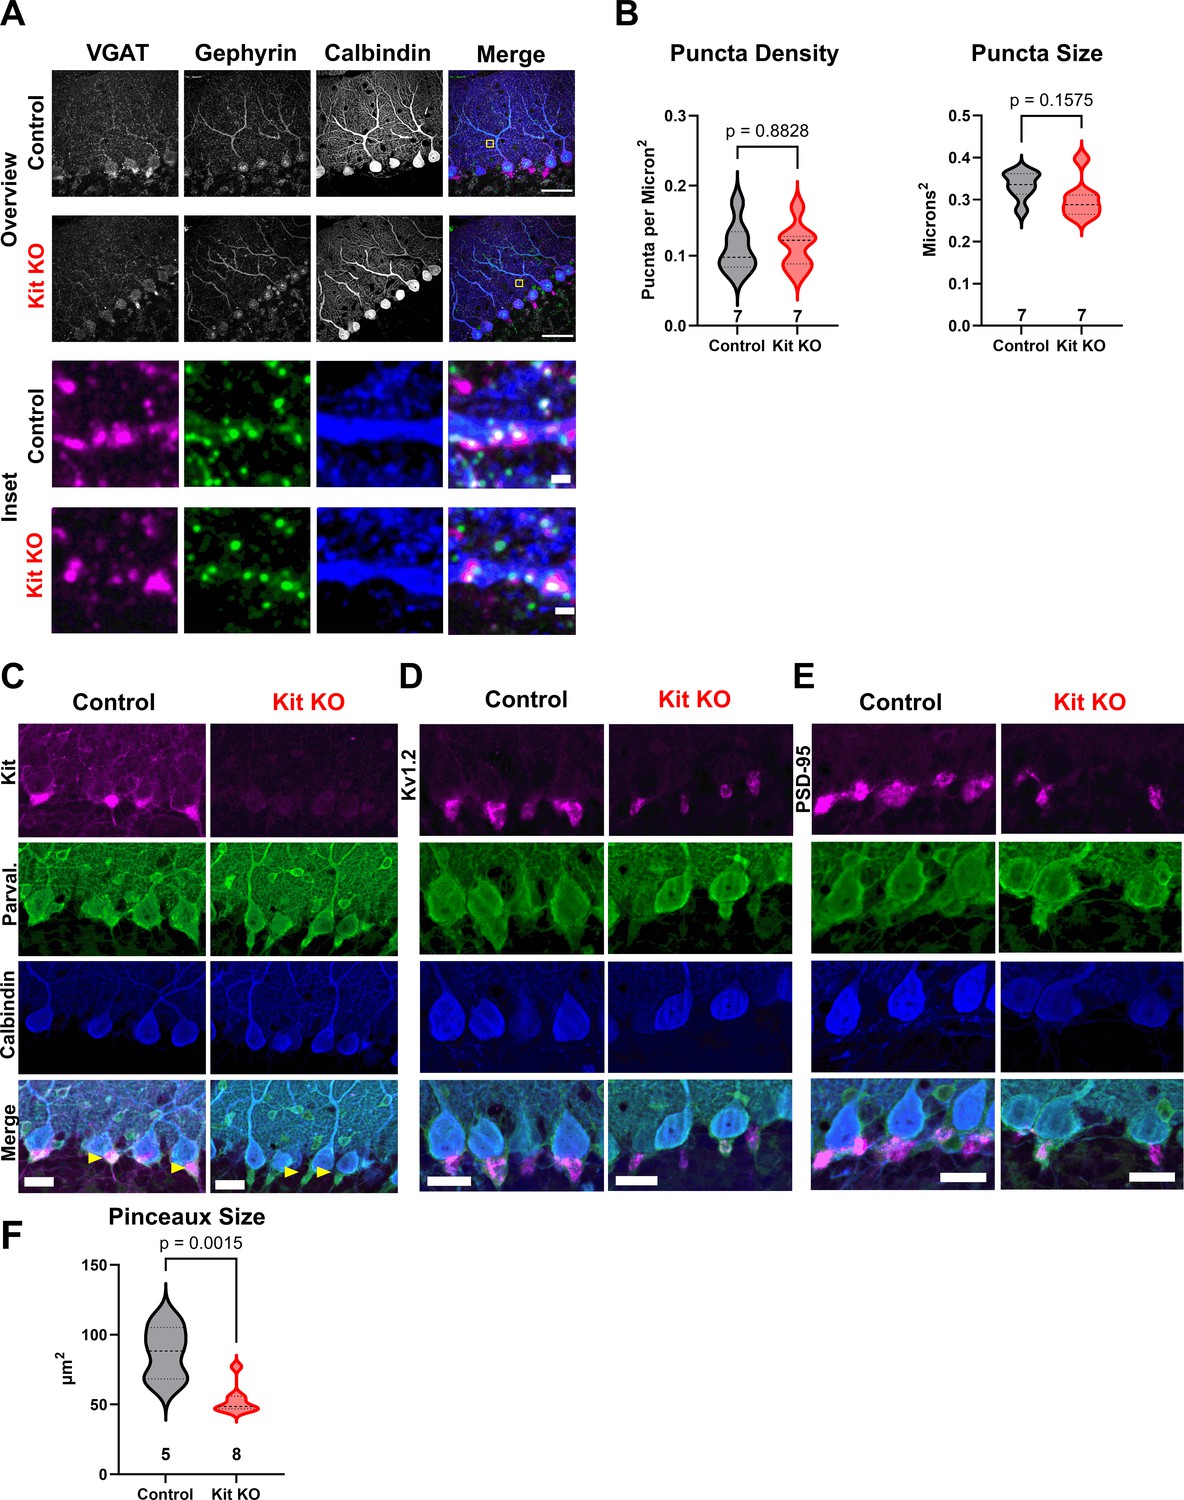
The impact of Kit knockout (KO) on the size of molecular layer interneuron (MLI) synaptic structures.
(A) Immunohistochemistry and confocal microscopy of presynaptic (VGAT) and postsynaptic (gephyrin) markers of GABAergic synapses onto Purkinje cells (PCs) (calbindin), for both Control and Kit KO. An Inset from Control (yellow box, first row merge ROI), demonstrates example triple-positive puncta. First two rows, scale bar 50 microns. (B) Neither the average density nor the average size (per animal) of GABAergic synaptic puncta onto PCs was significantly decreased by Kit KO. (C–E) Immunohistochemistry and confocal microscopy of markers of the pinceau formation (of MLI axons onto PC soma and initial axon segments). For both Control and Kit KO, calbindin and parvalbumin immunoreactivity was determined in conjunction with pinceau markers Kit, Kv1.2, or PSD-95. As evidenced by parvalbumin-positive calbindin-negative pinceau structures in Kit KO in (C), pinceau structures do still exist in Kit KO, though they appear smaller. This was affirmed by reduced area of Kv1.2 immunoreactivity and PSD-95 immunoreactivity, the latter of which is quantified in (F). Scale bars are 50 microns. p-Values were calculated by a two-tailed t-test with Welch’s correction as necessary. n refers to the number of different animals per condition.
Figure 3
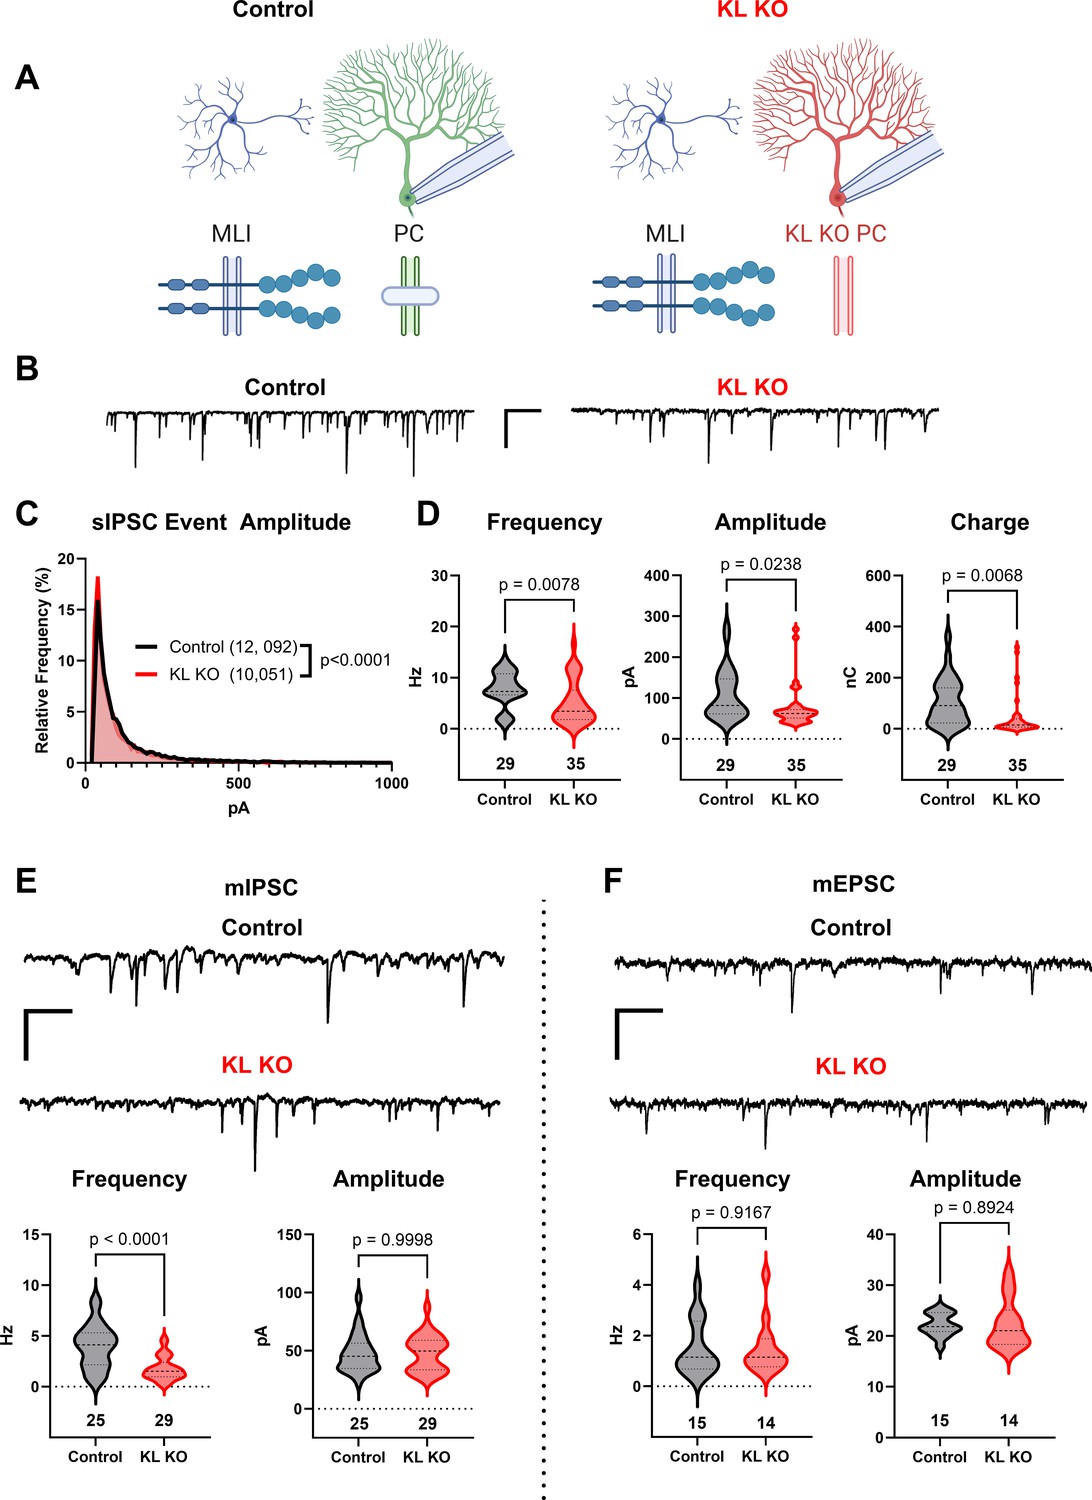
Knockout of Kit Ligand (KL KO) from Purkinje cells decreases the inhibitory input they receive.
(A, B) Experimental schema and example traces of inhibitory postsynaptic currents detected in PCs from Control animals or from those with KL KO accomplished by a Pcp2-Cre × KL (Kitl) floxed strategy. Scale bar is 500 ms × 100 pA. (C) A frequency distribution plot for individual spontaneous inhibitory postsynaptic current (sIPSC) event amplitudes recorded in PCs as in (A, B). A KS test reveals a significant difference in the distribution of these event amplitudes; p < 0.0001, n in chart. (D) For each PC, the average sIPSC frequency and amplitude, and the total inhibitory charge transfer, was determined. There was a significant ~40% decrease in sIPSC frequency, amplitude, and charge transferred to KL KO PCs. (E, F) The average miniature inhibitory postsynaptic currents (mIPSC) recorded in PC KL KO vs Control PCs had a > 50% decreased frequency p < 0.0001 without a corresponding decrease in amplitude. The average miniature excitatory postsynaptic current (mEPSC) frequency and amplitude recorded in separate PCs did not differ between Control and KL KO. Scale bar is 500 ms × 100 pA for mIPSC, 500 ms × 50 pA for mEPSC. n in charts refers to the number of cells. Error bars are SEM. p-Values were calculated by a two-tailed t-test, with Welch’s correction as needed.
© 2024, BioRender Inc. Figure 3 was created using BioRender, and is published under a CC BY-NC-ND license. Further reproductions must adhere to the terms of this license.
Figure 4 with 1 supplement
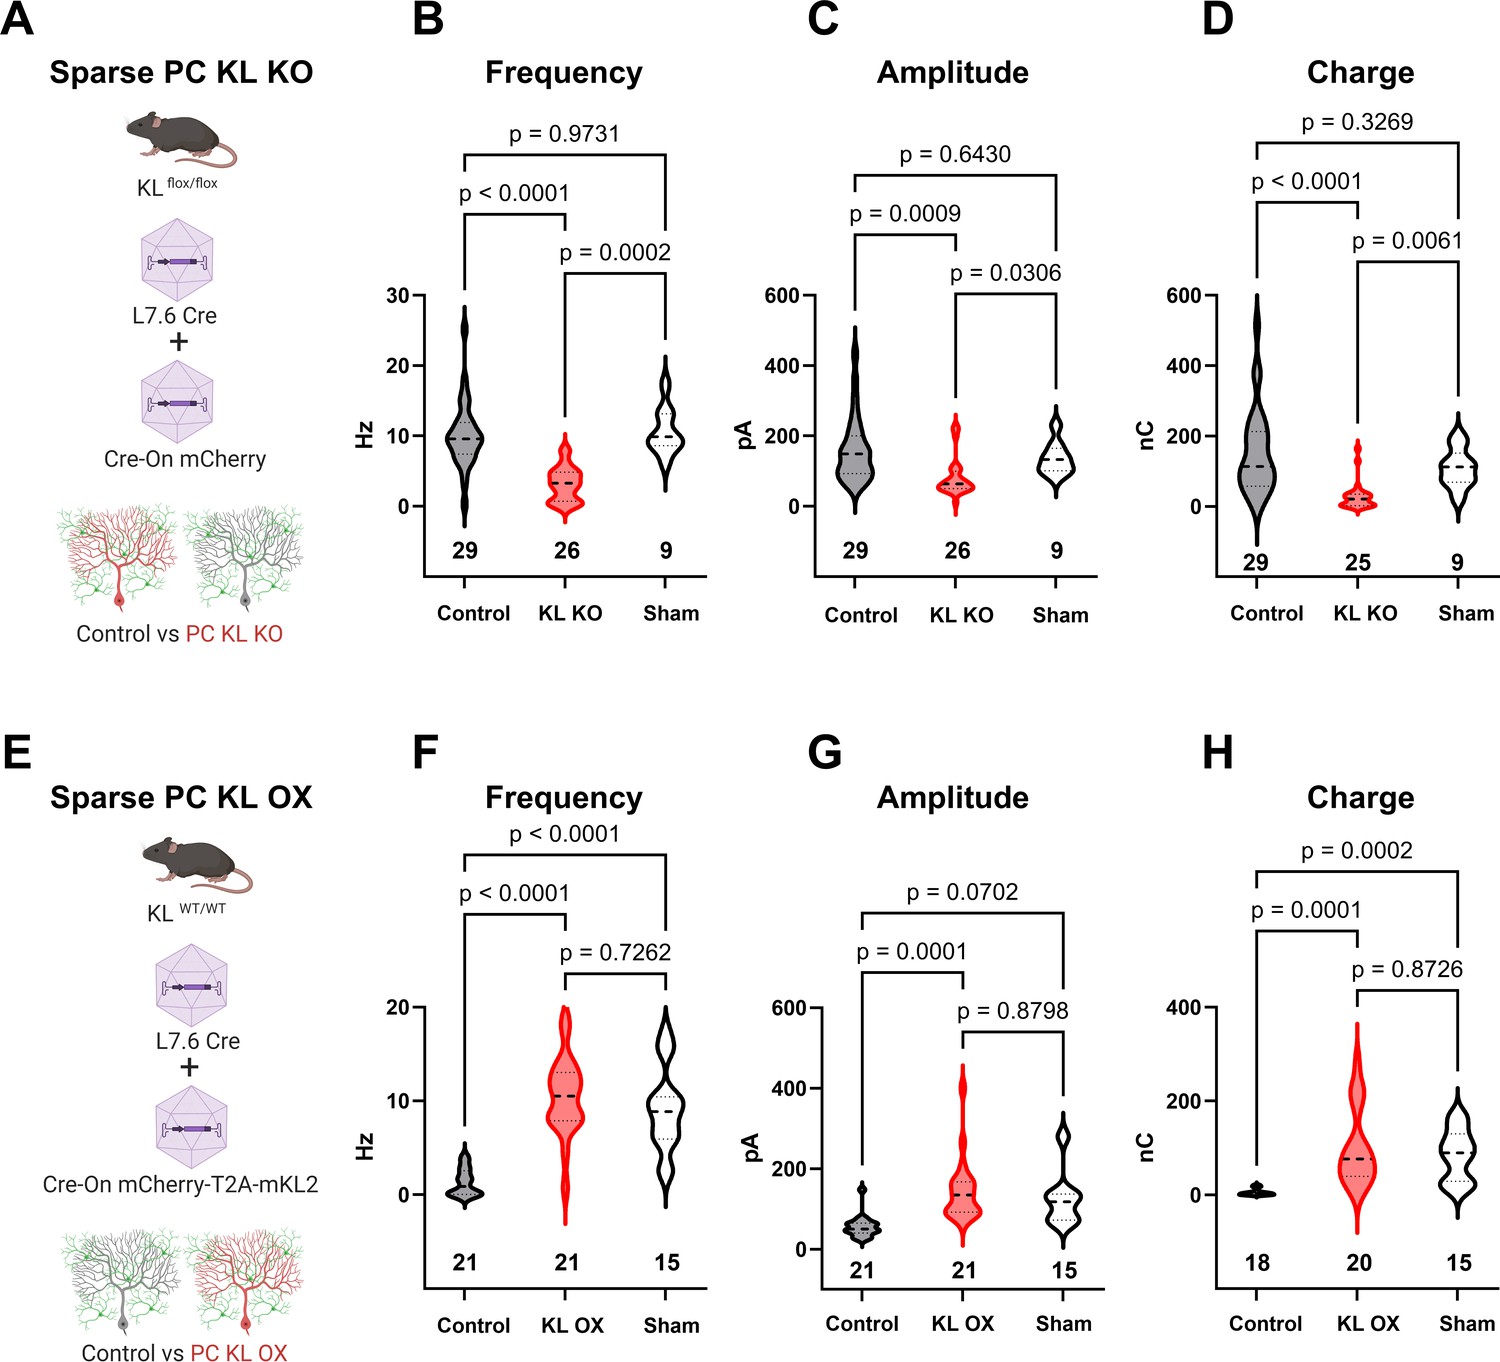
Local levels of Kit Ligand influence the inhibition Purkinje cells (PCs) receive.
(A) To accomplish in vivo Control and sparse Kit Ligand Knockout (KL KO) PCs, an adeno-associated virus (AAV) encoding Cre under the PC-specific L7.6 promoter was co-injected with an AAV encoding a Cre-On mCherry cassette under the Ef1α promoter into mice homozygous for the KL (Kitl) floxed allele. (B–D) In animals injected at P18, PC KL KO neurons demonstrated an ~70% decrease in spontaneous inhibitory postsynaptic current (sIPSC) event frequency compared to adjacent Control PCs (p < 0.0001) or PCs recorded from Sham control animals (p = 0.0002). Control vs Sham sIPSC frequency was not significantly different. The same pattern was found for both mean sIPSC amplitude (C) and for total inhibitory charge transferred (D). (E) To accomplish in vivo Control and sparse Kit Ligand overexpressing (KL OX) PCs, the L7.6 Cre AAV was co-injected with AAV expressing mCherry and (T2A) murine Kit Ligand isoform 2 under the Ef1α promoter. (F–H) In animals injected at P18, PC KL OX neurons demonstrated an approximately eightfold increase in sIPSC frequency vs neighboring Control PCs (p < 0.0001). The frequency of sIPSC events in KL OX PCs was not significantly different from PCs recorded in different Sham animals; this Sham PC sIPSC frequency (while comparable across studies) was sevenfold higher than Control PCs within the KL OX experimental animals (p < 0.0001). A similar pattern was found for sIPSC amplitude (G) and total inhibitory charge transferred (H). n in charts refers to the number of cells. Error bars are SEM. p-Values were calculated by Brown–Forsythe ANOVA with Dunnett’s T3 multiple-comparisons test.
© 2024, BioRender Inc. Figure 4 was created using BioRender, and is published under a CC BY-NC-ND license. Further reproductions must adhere to the terms of this license.
Figure 4—figure supplement 1
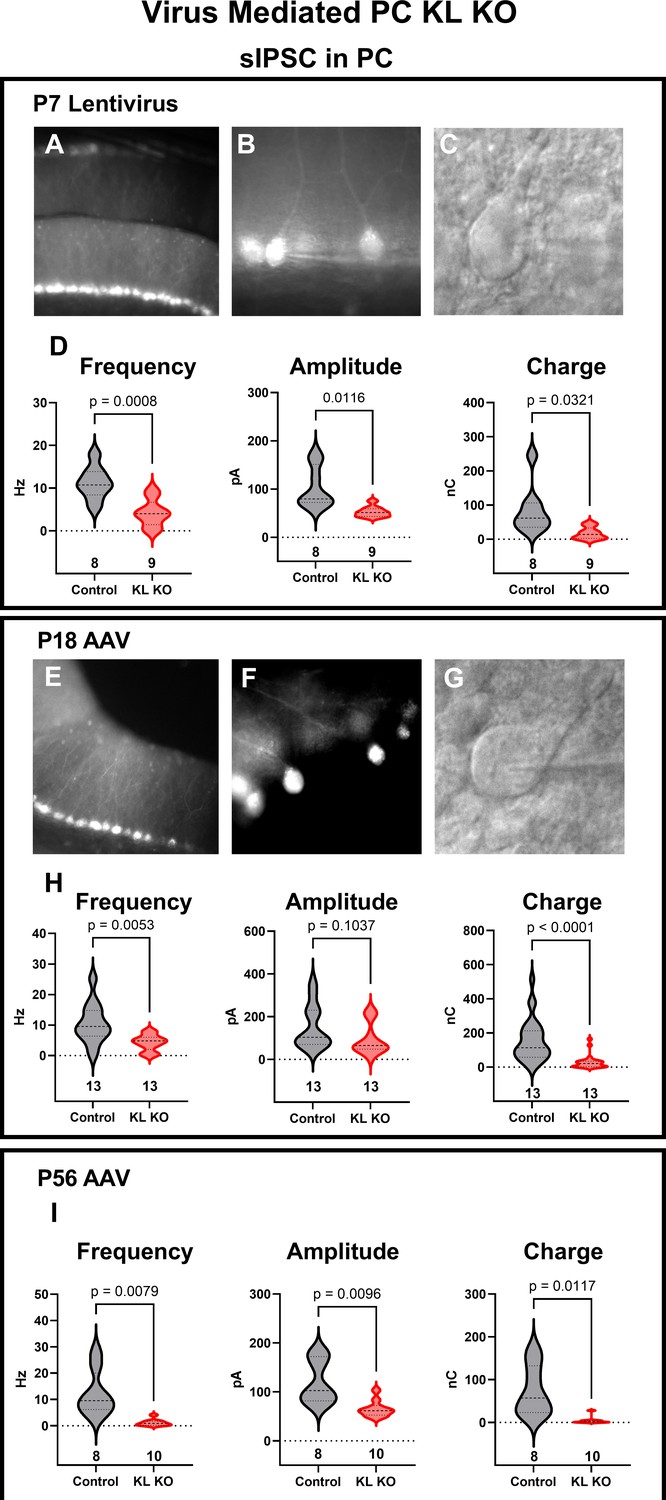
Sparse acute depletion of Kit Ligand reduces GABAergic input to Purkinje cells (PCs).
(A–C) Lentivirus encoding mCherry-T2A-Cre under the PC-specific promoter L7.6 was injected into postnatal day 7 mice homozygous for a Kit Ligand (KL, Kitl) floxed allele at P7. Demonstrated in (A) is an area of direct hit and high transduction. (B) Areas with sparse PC transduction were used to record from KL KO or from uninfected adjacent Control PCs, with an example of an IR-DIC identified and patched PC (C). (D). Analysis of the spontaneous inhibitory postsynaptic currents (sIPSCs) recorded from P7 Control or sparse KL KO PCs revealed that KL KO reduced both the mean frequency (p = 0.0008) and amplitude (p = 0.012) and the total inhibitory charge transfer of GABAergic inhibitory currents in PCs by ~50%. (E–G) Adeno-associated virus (AAV) encoding Cre under the L7.6 promoter was co-injected with an AAV encoding Cre-On mCherry under the Ef1α promoter into the cerebellum of postnatal day 18 or 56 KL floxed homozygous mice. Demonstrated in (E) is a direct hit with high transduction, areas as in (F) with sparse transduction were selected for recordings of mCherry-positive KL KO PCs and adjacent uninfected Control PCs patched under IR-DIC (G). (H, I). Analysis of the sIPSCs in Control and KL KO PCs at either P18 (H) or at P56 (I) revealed that mean sIPSC frequency and amplitude and total inhibitory charge transferred were all markedly reduced by postnatal PC KL KO. p-Values were calculated by a two-tailed t-test with Welch’s correction as necessary. N in columns refers to the number of different cells recorded.
Additional files
Download links
A two-part list of links to download the article, or parts of the article, in various formats.
Downloads (link to download the article as PDF)
Open citations (links to open the citations from this article in various online reference manager services)
Cite this article (links to download the citations from this article in formats compatible with various reference manager tools)
Kit Ligand and Kit receptor tyrosine kinase sustain synaptic inhibition of Purkinje cells
eLife 12:RP89792.
https://doi.org/10.7554/eLife.89792.3


