A retrospective cohort study of Paxlovid efficacy depending on treatment time in hospitalized COVID-19 patients
- WHO Collaborating Center for Infectious Disease Epidemiology and Control, School of Public Health, LKS Faculty of Medicine, The University of Hong Kong, Hong Kong Special Administrative Region, China
- Laboratory of Data Discovery for Health Limited, China
- Department of Genetics, University of Cambridge, United Kingdom
- Center for Infectious Disease Modeling and Analysis, Yale School of Public Health, United States
- Department of Molecular Biosciences, John Ring LaMontagne Center for Infectious Disease Institute for Cellular and Molecular Biology, University of Texas at Austin, United States
- Department of Integrative Biology, University of Texas at Austin, United States
- Santa Fe Institute, United States
Figures
Figure 1 with 1 supplement
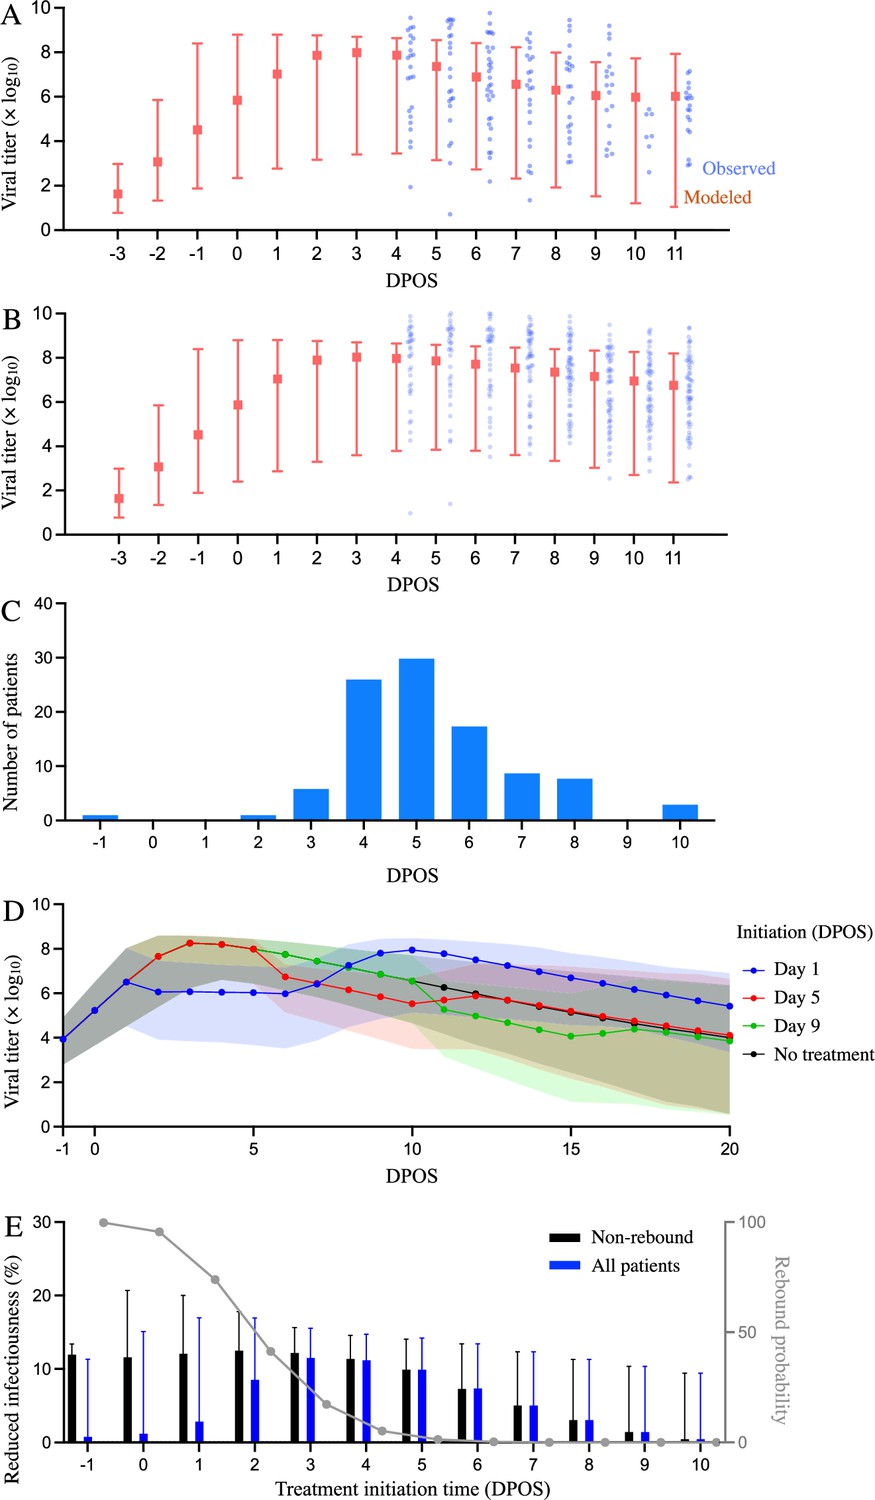
Estimated efficacy of Paxlovid for suppressing SARS-CoV-2 viral load depending on timing of treatment.
Observed and model estimated viral load kinetics for each day post onset of symptoms (DPOS) for hospitalized COVID-19 patients who (A) received Paxlovid treatment (N=104) or (B) did not receive antiviral treatment (N=104) between 6 January and 1 May 2022 in Hong Kong. Blue points correspond to actual individual patients; red squares and error bars indicate medians and 95% interpercentile ranges across simulated patients. Day zero corresponds to the first day of symptoms. (C) Distribution of treatment initiation times for the 104 patients who received Paxlovid (Supplementary file 4). (D) Estimated patient viral loads for three different Paxlovid treatment initiation times. Points and shading represent the estimated medians and 95% interpercentile ranges across 1000 simulations. (E) Chance of a post-treatment rebound (gray line, right y-axis) and expected reduction in infectiousness across all patients (blue bars, left y-axis) and patients who do not experience a rebound (black bars, left y-axis), depending on the timing of treatment initiation. Rebound probabilities are estimated by the fraction out of 1000 simulations in which the viral titer reached higher values after treatment than before treatment. Reduced infectiousness is estimated by comparing the areas under the estimated infectiousness curves for untreated versus treated patients. Bars and whiskers indicate medians and 95% interpercentile ranges across 1000 pairwise comparisons.
Figure 1—figure supplement 1
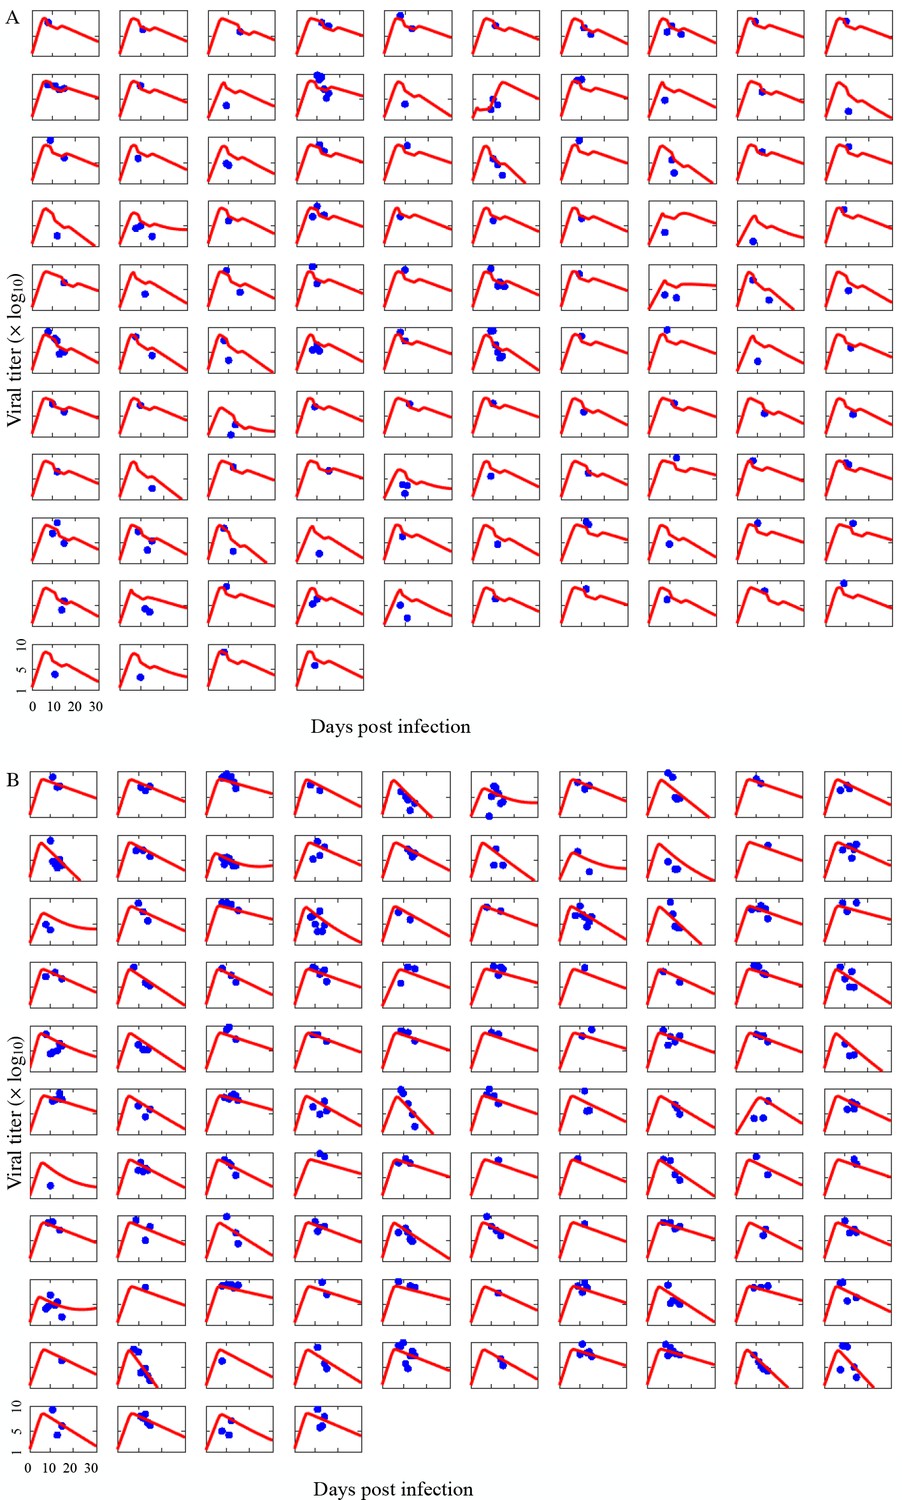
Comparison of individual COVID-19 patient viral titer data to model estimates.
Each graph corresponds to measurements for hospitalized COVID-19 patients who either (A) received Paxlovid treatment (N=104) or (B) did not receive any antiviral drug (N=104) between 6 January and 1 May 2022 in Hong Kong (blue points). Red lines show estimates from the fitted model for each individual. Day zero indicates the first day of infection.
Figure 2
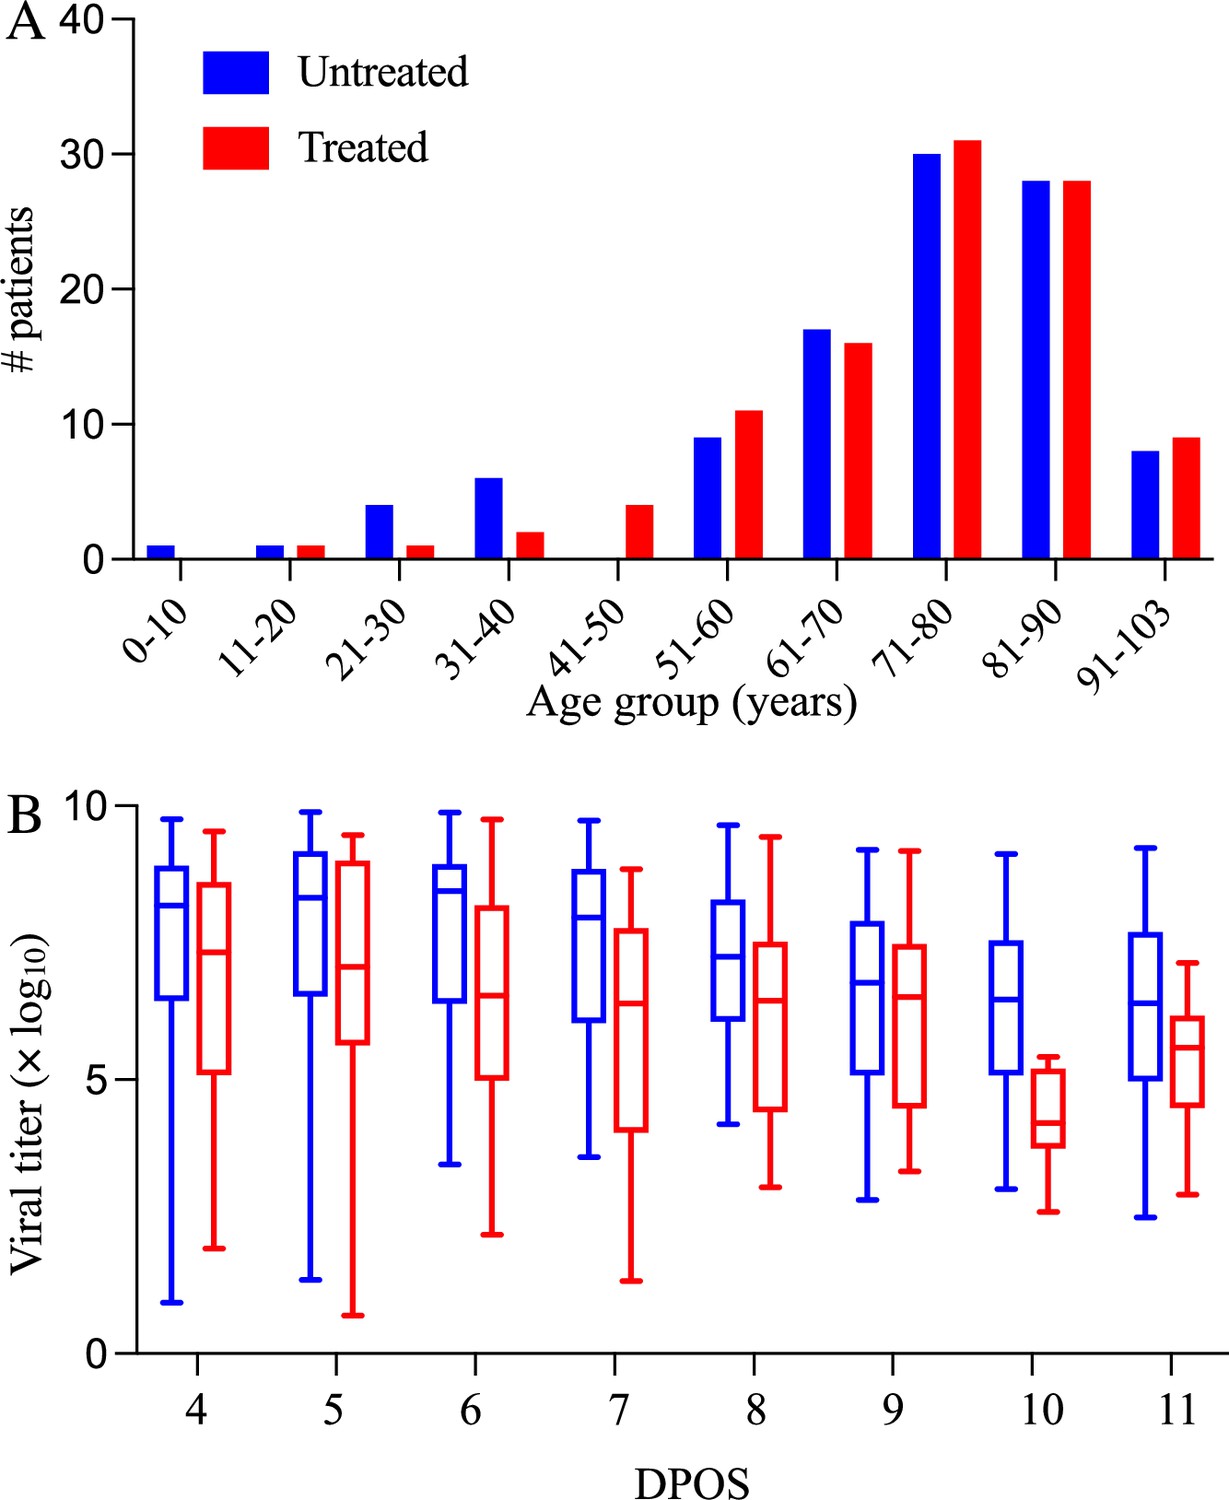
Demographic and virologic characteristics of the 208 hospitalized COVID-19 patients in the study.
The distribution of (A) ages and (B) daily viral titers across the 104 hospitalized COVID-19 patients who received Paxlovid treatment (red) and the 104 patients who did not receive any antiviral drug (red) between January 6 and May 1, 2022 in Hong Kong. The box plots in panel B indicate the median, interquartile range, and range of the observed viral titers across patients for each day after symptom onset (DPOS). Day zero corresponds to the first day that symptoms occur.
Author response image 1

Tables
Author response table 1
Comparison of population estimates of parameters in our study and ref.
(Ke et al., 2021). The means and 95% confidence intervals (CI) are derived assuming that individual parameters follow log-normal distributions
| Parameter | Estimated value | Estimate from ref. (Ke et al., 2021) |
| Cell infection rate in 10-9 mL/Copies in days-1 () | 17 [7, 45] | 32 [12, 85] |
| Rate in log10 for the interferon-induced conversion of target cells to refractory cells (Φ) | -9.37 [-14.81, -3.93] | 3.11 [-0.52, 4.77] |
| Rate in 10-3 at which refractory cells become target cells again (ρ) | 5.2 [2.1, 12.8] | 4.4 [3.0, 6.5] |
| Infected cell clearance rate in days-1 () | 0.5 [0.2, 1.6] | 1.7 [1.1, 2.7] |
| Virus production rate in Copies/ mL in days-1 (π) | 68.6 [32.7, 145.0] | 45.3 [28.3, 72.5] |
Additional files
-
Supplementary file 1
Within-host model parameter estimates.
We used a nonlinear mixed-effects method to fit a within-host model of viral kinetics to the viral titer measurements from 208 patients, 104 were treated with Paxlovid and 104 did not receive any antiviral drugs (Traynard et al., 2020). The reported medians and variation across individuals (95% interpercentile ranges) integrate both fixed and random effects estimates for each parameter.
- https://cdn.elifesciences.org/articles/89801/elife-89801-supp1-v2.docx
-
Supplementary file 2
Population-wide parameter estimates for the within-host model.
The table provides population-wide fixed and random effects estimates for the viral dynamic parameters, whereas Supplementary file 1 provides the estimated median and variation across individuals for each parameter. The values assume that antiviral efficacy follows a logit-normal distribution and all other parameters follow log normal distributions*. Values in parentheses are relative standard errors (RSE) as a percent.
- https://cdn.elifesciences.org/articles/89801/elife-89801-supp2-v2.docx
-
Supplementary file 3
Estimated reduction in overall infectiousness and likelihood of a post-treatment rebound, depending on the timing of Paxlovid initiation in days post onset of symptoms (DPOS).
To estimate the probability of a rebound, we computed the fraction out of 1000 simulations in which the viral titer rebounded to higher values following treatment than observed prior to treatment. To estimate reduction in infectiousness, we run 1000 pairs of treatment versus no treatment simulations. Following each simulation, we calculate the total infectiousness from the time of infection until 15 DPOS using estimates relating viral titer to infectiousness provided in Marc et al., 2021. For each pair, we then compute the percent difference in total infectiousness of the treatment simulation relative to the no treatment simulation. The table reports medians and 95% CIs across all treated patients, patients who do not experience a post-treatment rebound, and patients who do.
- https://cdn.elifesciences.org/articles/89801/elife-89801-supp3-v2.docx
-
Supplementary file 4
The distribution of treatment initiation times for the 104 patients who received Paxlovid.
Day zero corresponds to the first day of symptoms.
- https://cdn.elifesciences.org/articles/89801/elife-89801-supp4-v2.docx
-
MDAR checklist
- https://cdn.elifesciences.org/articles/89801/elife-89801-mdarchecklist1-v2.docx
Download links
A two-part list of links to download the article, or parts of the article, in various formats.
Downloads (link to download the article as PDF)
Open citations (links to open the citations from this article in various online reference manager services)
Cite this article (links to download the citations from this article in formats compatible with various reference manager tools)
A retrospective cohort study of Paxlovid efficacy depending on treatment time in hospitalized COVID-19 patients
eLife 13:e89801.
https://doi.org/10.7554/eLife.89801


