Evolution towards simplicity in bacterial small heat shock protein system
- Intercollegiate Faculty of Biotechnology UG-MUG, University of Gdansk, Poland
Figures
Figure 1
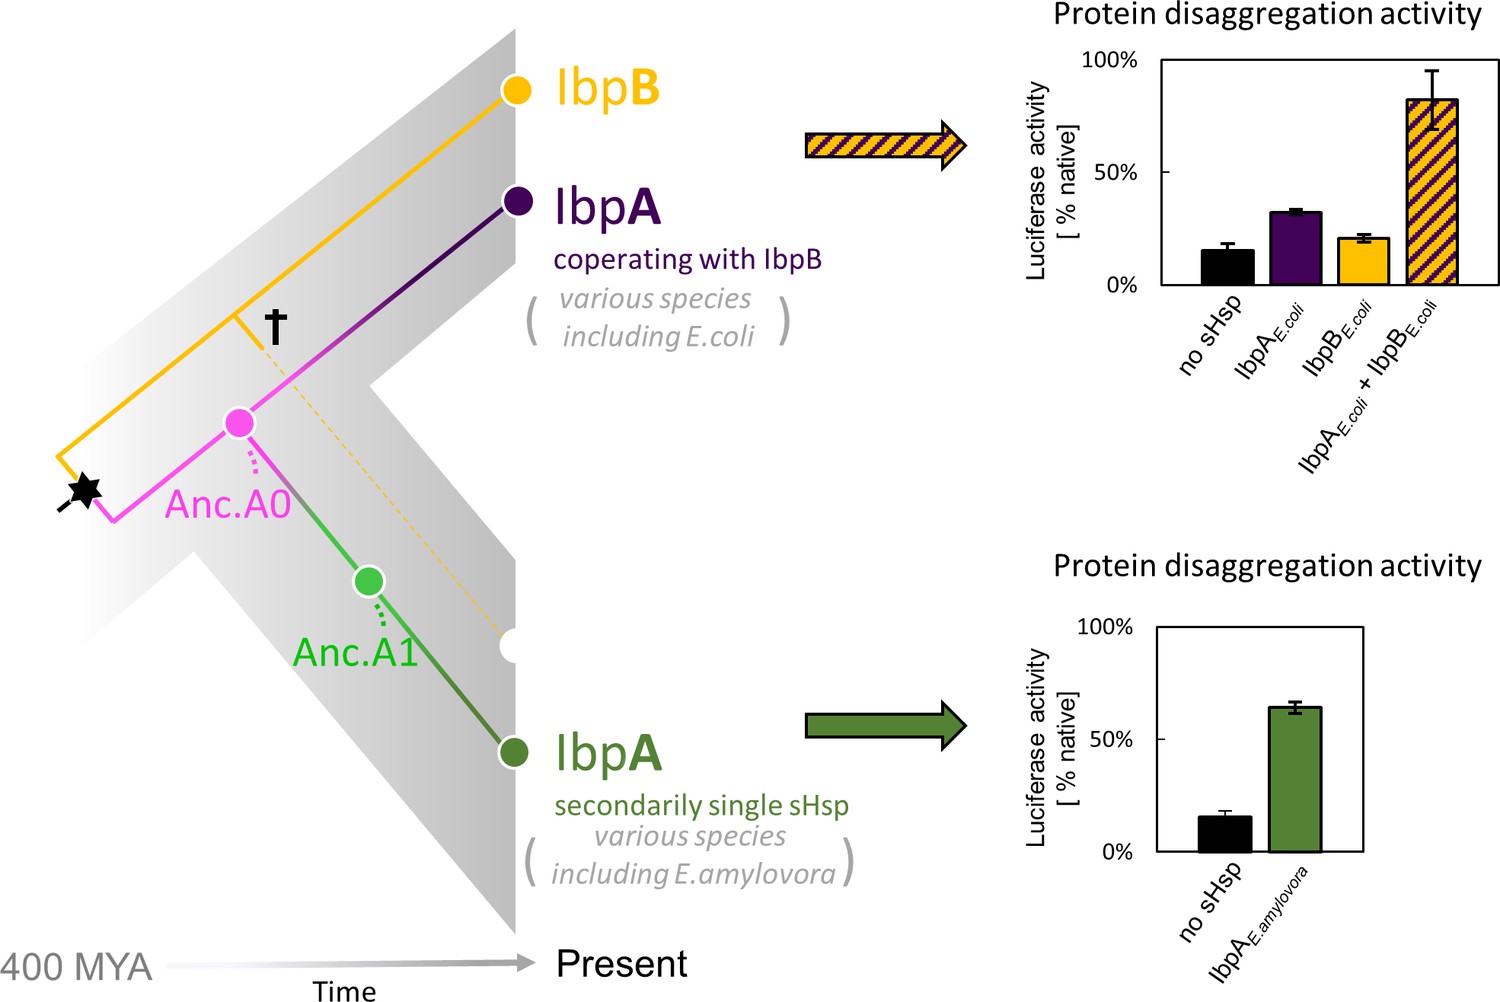
small heat shock protein (sHsp) systems in Enterobacteriacrae and Erwiniaceae.
Left - schematic phylogeny of sHsps in Enterobacterales. Gene duplication resulting in IbpA + IbpB two-protein system is marked with a star, while the loss of ibpB gene in Erwiniaceae clade is marked with a cross. AncA0 - reconstructed last common ancestor of IbpA from Erwiniaceae and Enterobacteriaceae, expressed as a part of two-protein system. AncA1 - reconstructed last common ancestor of secondarily single IbpA from Erwiniaceae. Right - representative extant sHsps’ ability to stimulate luciferase refolding. sHsps were present during the luciferase thermal denaturation step. Refolding of denatured luciferase was performed by the Hsp70-Hsp100 chaperone system. Activity of luciferase was measured after 1 hr refolding at 25 °C and shown as an average of 3 repeats. Error bars represent standard deviation.
-
Figure 1—source data 1
Spreadsheet containing raw data for the luciferase refolding graphs shown in Figure 1.
- https://cdn.elifesciences.org/articles/89813/elife-89813-fig1-data1-v1.xlsx
Figure 2
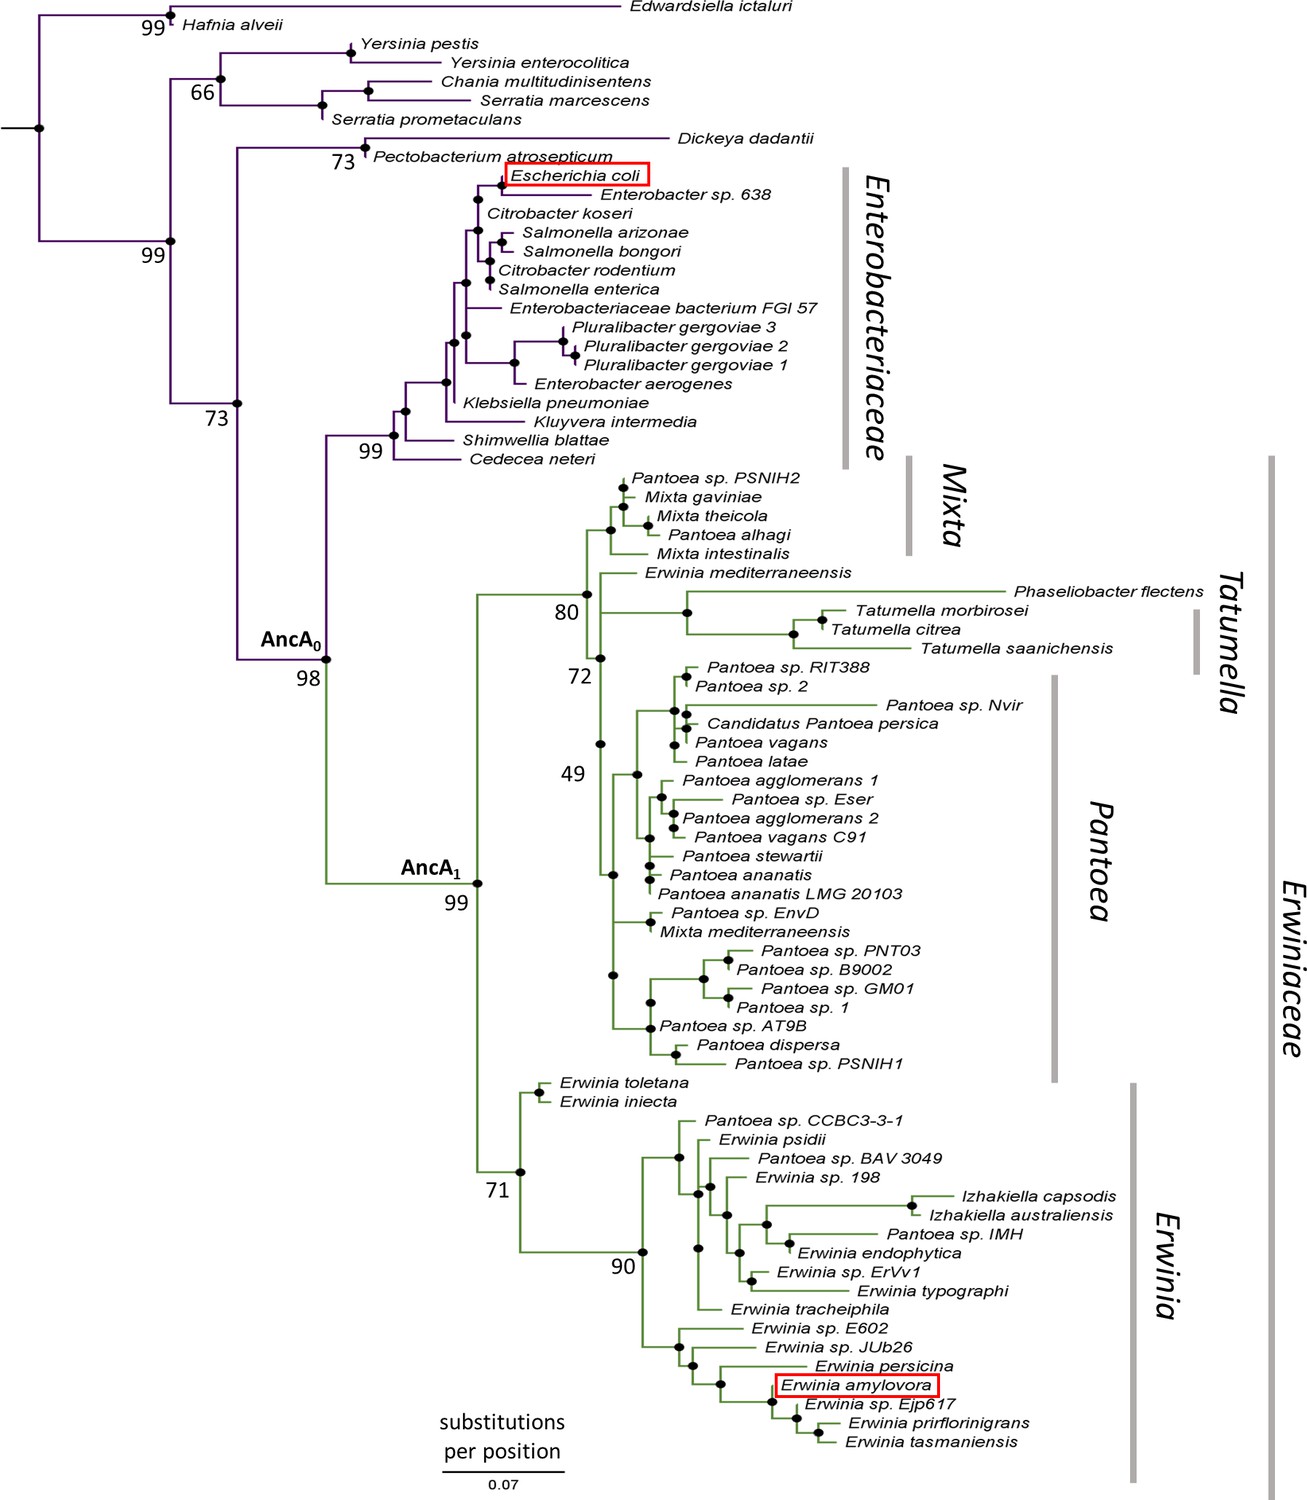
IbpA phylogeny in Enterobacterales.
Phylogeny was reconstructed from 77 IbpA orthologs from Enterobacterales using the Maximum Likelihood algorithm with JTT + R3 substitution model. AncA0 - node representing the last common ancestor of IbpA from Erwiniaceae and Enterobacteriaceae. AncA1 - node representing the last common ancestor of IbpA from Erwiniaceae. Bootstrap support is noted for the major nodes. Extant IbpAs from E. coli and E. amylovora are marked with a red frame. Scale bar - substitutions per position.
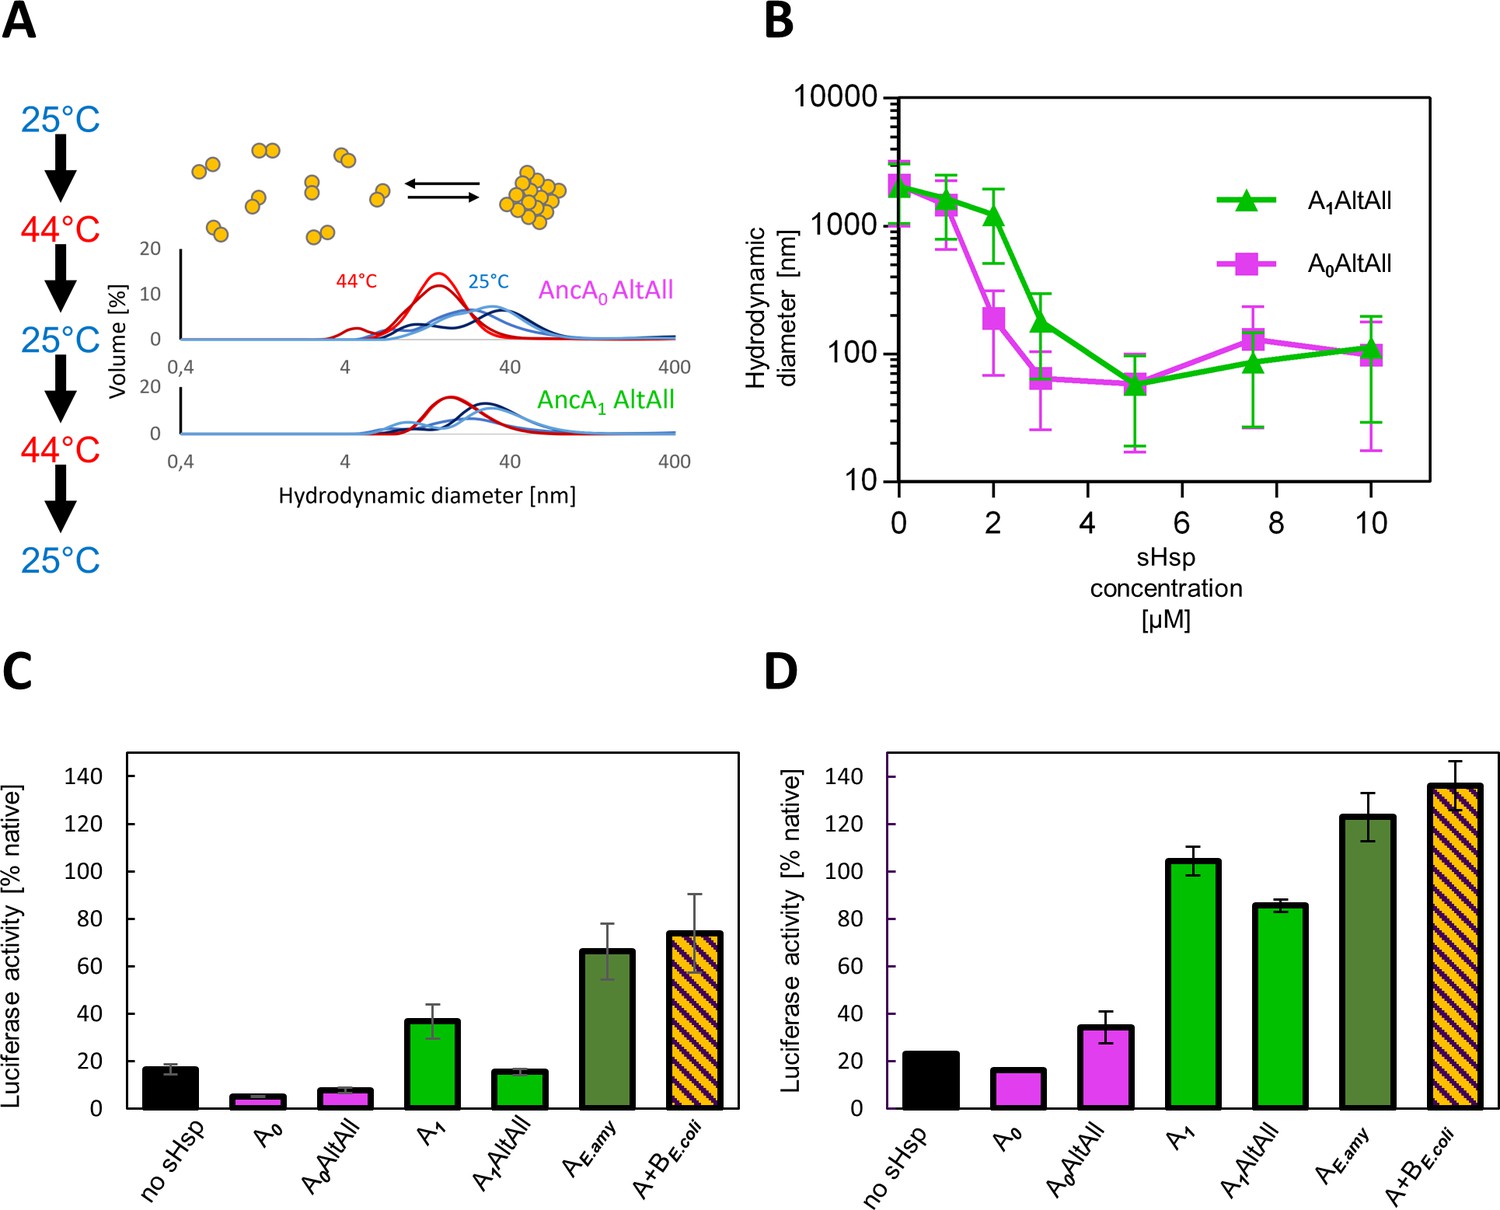
Figure 3 with 3 supplements
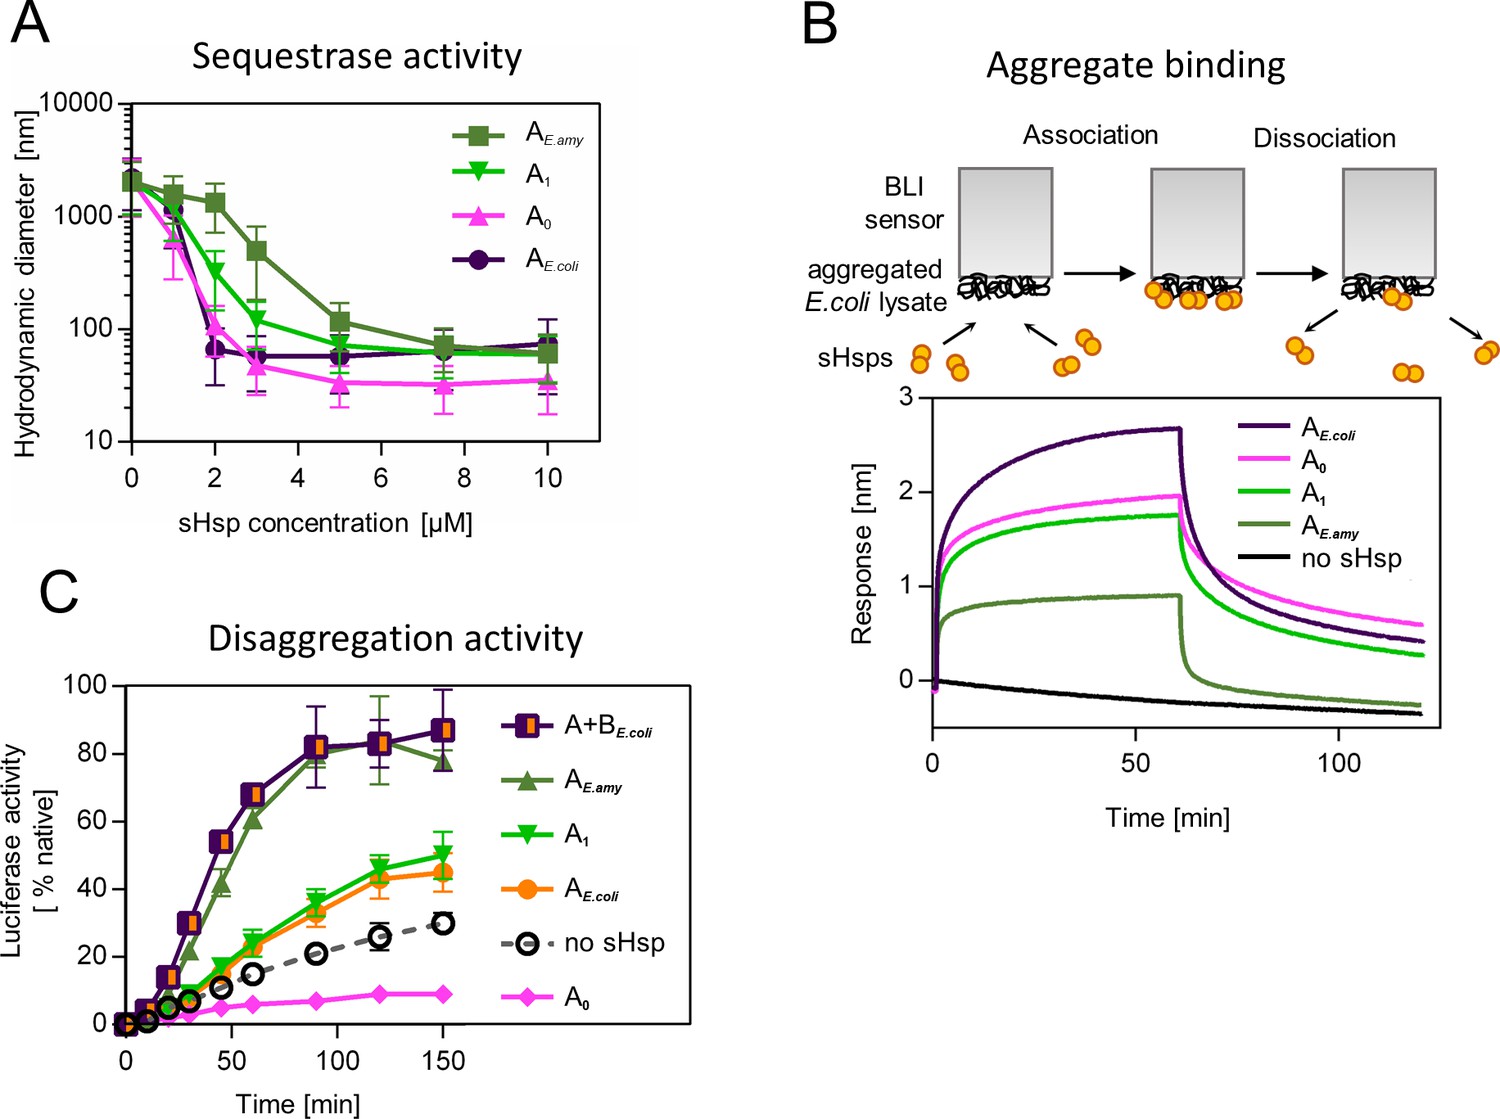
Functional changes during the evolution of secondarily single small heat shock protein (sHsp) in Erwiniaceae.
(A) Sequestrase activity of extant and ancestral sHsps. Luciferase was heat denatured in the presence of different concentrations of sHsps and size of formed sHsps-substrate assemblies was measured by DLS. For every measurement, ten subsequent series of ten 10-s runs were averaged and particle size distribution was calculated by fitting to 70 size bins between 0.4 and 10,000 nm. Results are presented as an average hydrodynamic diameter of measured particles weighted by intensity (Z-average), calculated with Malvern Zetasizer Software 7.13. Error bars represent standard deviation obtained from the distribution. (B) Binding of extant and ancestral sHsps to heat-aggregated E. coli proteins. E. coli proteins were heat aggregated and immobilized on a Biolayer interferometry (BLI) sensor. sHsps were heat-activated before the binding step. (C) Extant and ancestral sHsps’ ability to stimulate luciferase refolding. Experiment was performed at 25 °C. Luciferase activity at each timepoint was shown as an average of 3 repeats. Error bars represent standard deviation.
-
Figure 3—source data 1
Spreadsheet containing raw data for the sequestrase activity graph shown in Figure 3A.
- https://cdn.elifesciences.org/articles/89813/elife-89813-fig3-data1-v1.xlsx
-
Figure 3—source data 2
Spreadsheet containing raw data for the binding and dissociation curve shown in Figure 3B.
- https://cdn.elifesciences.org/articles/89813/elife-89813-fig3-data2-v1.xlsx
-
Figure 3—source data 3
Spreadsheet containing raw data for the luciferase refolding graph shown in Figure 3C.
- https://cdn.elifesciences.org/articles/89813/elife-89813-fig3-data3-v1.xlsx
Figure 3—figure supplement 1

Both reconstructed proteins reversibly deoligomerize at heat shock temperature, similarly to extant proteins.
Hydrodynamic diameter distributions of small heat shock protein (sHsp) oligomers incubated subsequently at 25 °C (blue graphs) and 44 °C (red graphs). Size distributions were measured by DLS.
-
Figure 3—figure supplement 1—source data 1
Spreadsheet containing raw data for DLS curves shown in Figure 3—figure supplement 1.
- https://cdn.elifesciences.org/articles/89813/elife-89813-fig3-figsupp1-data1-v1.xlsx
Figure 3—figure supplement 2
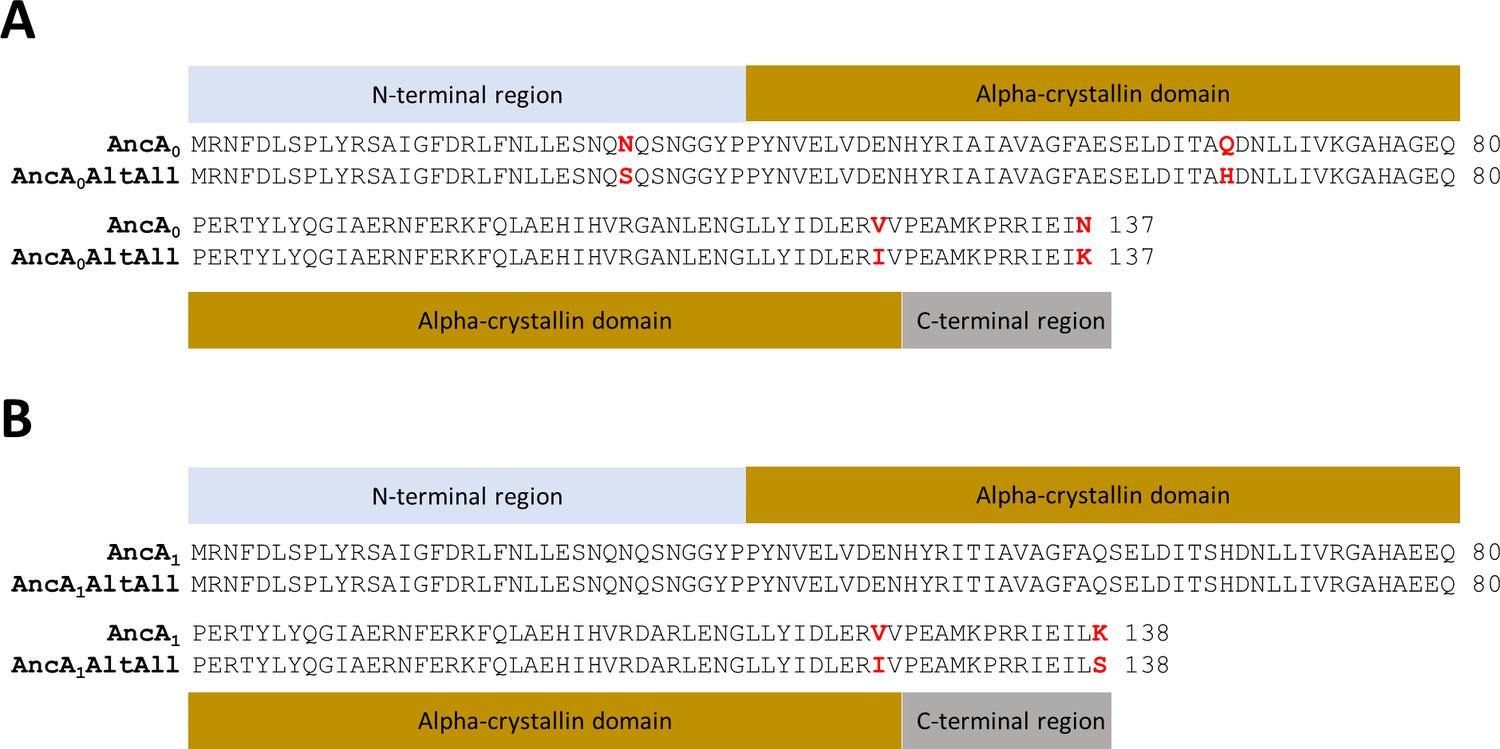
Amino acid sequences of most likely (ML) and AltAll variants of reconstructed ancestral proteins.
AncA0, AncA1 - ML variants; AncA0AltAll, AncA1AltAll - AltAll variants. Positions differing between most likely (ML) and AltAll variants are marked in red. (A) Alignment of AncA0 and AncA0AltAll sequences. (B) Alignment of AncA1 and AncA1AltAll sequences.
Figure 3—figure supplement 3
AltAll variants of AncA0 and AncA1 have similar properties to most likely (ML) variants.
(A) Reversible deoligomerization at heat shock temperature; measurement were performed as in Figure 3—figure supplement 1. (B) Sequestrase activity. Luciferase sequestration assay was performed as in Figure 3B. For every measurement, ten subsequent series of ten 10-s runs were averaged and particle size distribution was calculated by fitting to 70 size bins between 0.4 and 10,000 nm. Results are presented as an average hydrodynamic diameter of measured particles weighted by intensity (Z-average), calculated with Malvern Zetasizer Software 7.13. Error bars represent standard deviation obtained from the distribution. (C–D) Ability to stimulate Hsp70-Hsp100-dependent luciferase disaggregation; Luciferase refolding assay was performed as in Figure 1. Activity of luciferase was measured after 1 hr refolding at 25 °C and shown as an average of 3 repeats. Error bars represent standard deviation; assays were performed at two concentrations of Hsp70 system: (C) standard (1 µM DnaK, 0.4 µM DnaJ 0.3 µM GrpE) or (D) increased (2 µM DnaK, 0.8 µM DnaJ 0.6 µM GrpE).
-
Figure 3—figure supplement 3—source data 1
Spreadsheet containing raw data for DLS curves shown in Figure 3—figure supplement 3A.
- https://cdn.elifesciences.org/articles/89813/elife-89813-fig3-figsupp3-data1-v1.xlsx
-
Figure 3—figure supplement 3—source data 2
Spreadsheet containing raw data for sequestrase activity measurements shown in Figure 3—figure supplement 3B.
- https://cdn.elifesciences.org/articles/89813/elife-89813-fig3-figsupp3-data2-v1.xlsx
-
Figure 3—figure supplement 3—source data 3
Spreadsheet containing raw data for luciferase refolding graphs shown in Figure 3—figure supplement 3C.
- https://cdn.elifesciences.org/articles/89813/elife-89813-fig3-figsupp3-data3-v1.xlsx
-
Figure 3—figure supplement 3—source data 4
Spreadsheet containing raw data for luciferase refolding graphs shown in Figure 3—figure supplement 3D.
- https://cdn.elifesciences.org/articles/89813/elife-89813-fig3-figsupp3-data4-v1.xlsx
Figure 4 with 2 supplements
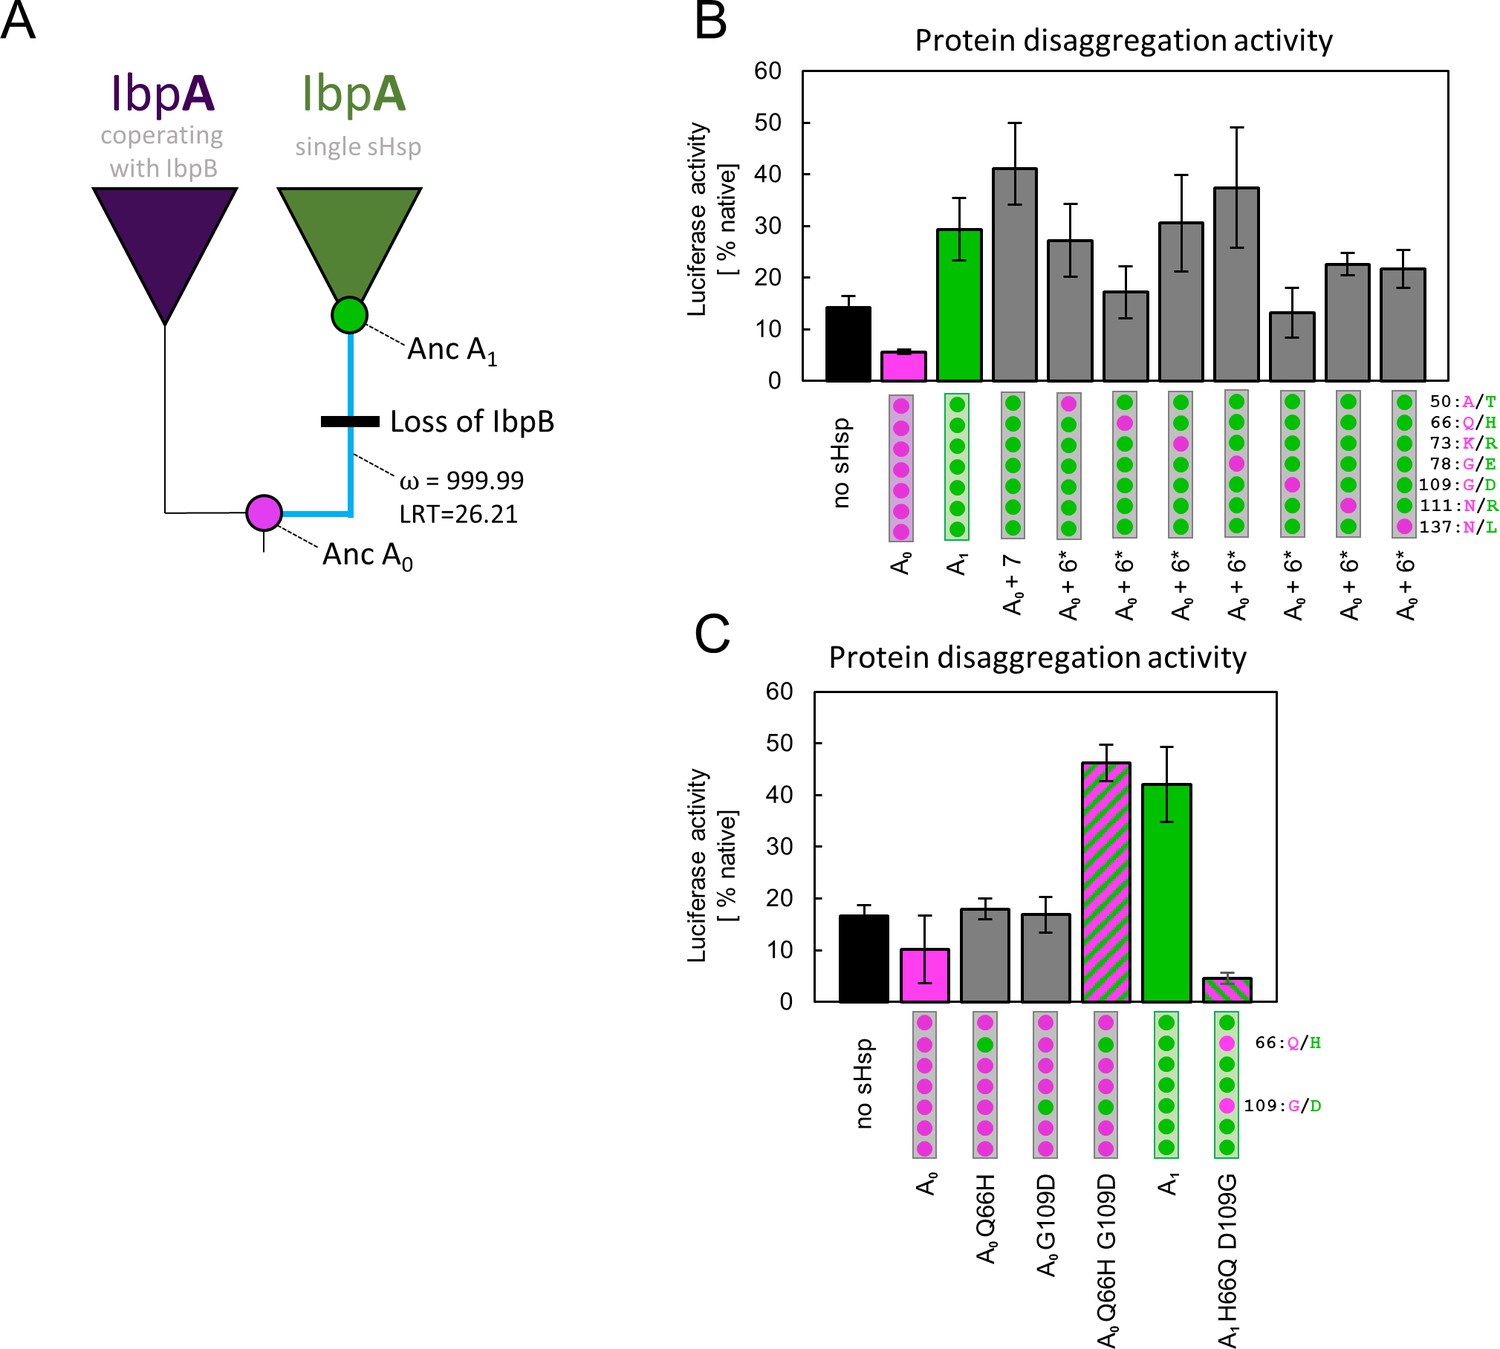
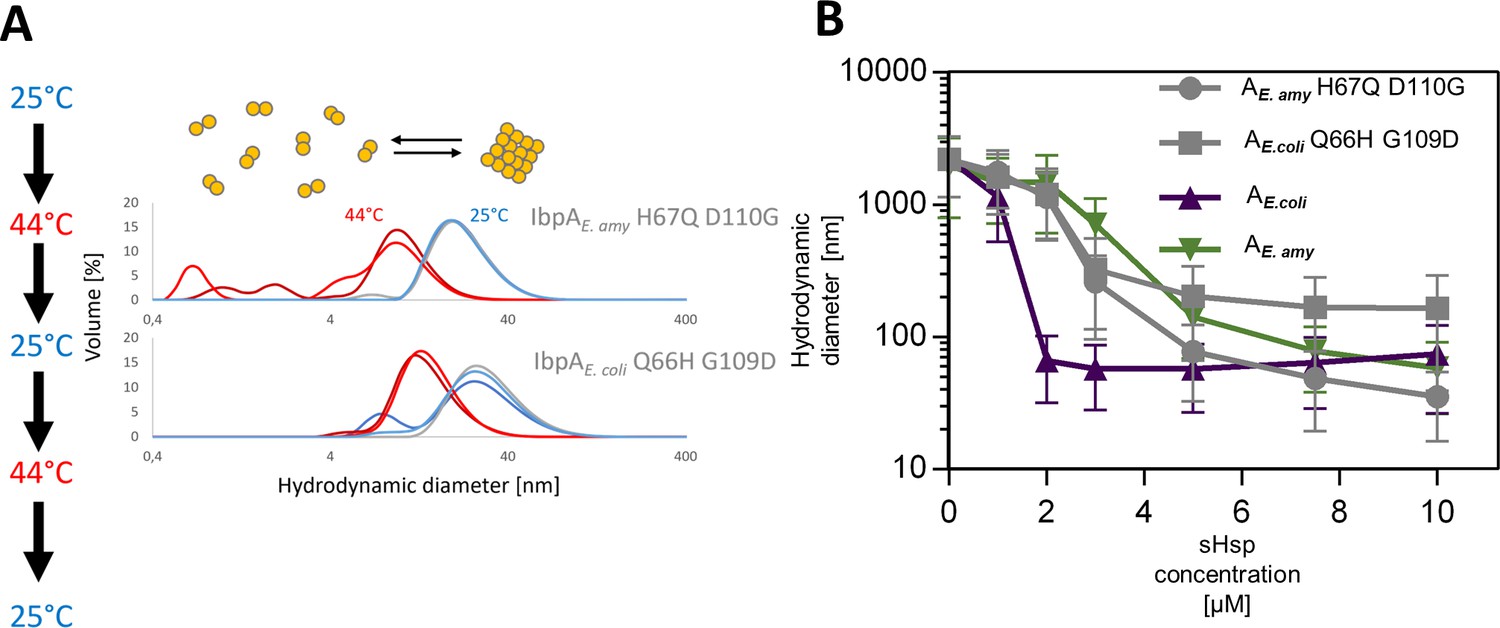
Substitutions at positions 66 and 109 that occurred between nodes A0 and A1 are crucial for ancestral small heat shock proteins (sHsps) to work as a single protein.
Luciferase refolding assay was performed as in Figure 1. Activity of luciferase was measured after 1 hr refolding at 25 °C and shown as an average of 3 repeats (6 in the case of no sHsp and proteins AncA0 and AncA1 in panel C). Error bars represent standard deviation. (A) Schematic phylogeny of Enterobacterales IbpA showing increased ratio of nonsynonymous to synonymous substitutions (ω) on the branch between nodes AncA0 and AncA1. Loss of cooperating IbpB is marked on a tree. Value of the Likelihood Ratio Test (LRT) is given for the selection model. (B) Identification of substitutions necessary for AncA0 to obtain AncA1-like activity in luciferase disaggregation; seven candidate mutations were introduced into AncA0 (AncA0 + 7); subsequently, in series of six mutants, each of the candidate positions was reversed to a more ancestral state (AncA0 + 6* variants) (C) Effect of substitutions at positions 66 and 109 on the ability of AncA0 and AncA1 to stimulate luciferase refolding.
-
Figure 4—source data 1
Spreadsheet containing raw data for the luciferase refolding graph shown in Figure 4B.
- https://cdn.elifesciences.org/articles/89813/elife-89813-fig4-data1-v1.xlsx
-
Figure 4—source data 2
Spreadsheet containing raw data for the luciferase refolding graph shown in Figure 4C.
- https://cdn.elifesciences.org/articles/89813/elife-89813-fig4-data2-v1.xlsx
Figure 4—figure supplement 1

Amino acid sequence differences between AncA0 and AncA1: Differing positions used in further analysis were marked in red, an differing positions omitted from further analysis due to low conservation in extant Erwiniaceae were marked in bold.
Figure 4—figure supplement 2
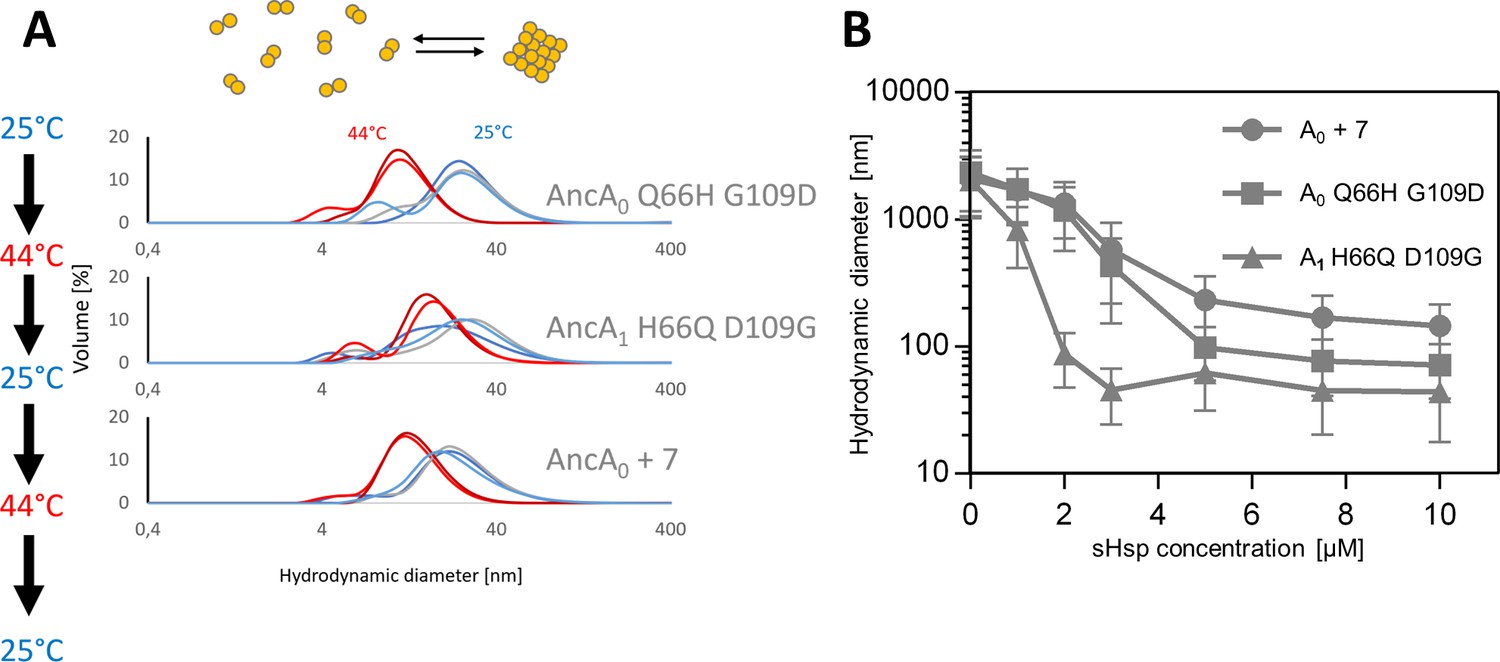
AncA0 Q66H G109D, AncA0 + 7 and AncA1 H66Q D109G exhibit sequestrase activity and reversibly deoligomerize at heat shock temperature.
(A) Reversible deoligomerization at heat shock temperature; measurements were performed as in Figure 3—figure supplement 2. (B) Sequestrase activity; luciferase sequestration assay was performed as in Figure 3B. For every measurement, ten subsequent series of ten 10-s runs were averaged and particle size distribution was calculated by fitting to 70 size bins between 0.4 and 10,000 nm. Results are presented as an average hydrodynamic diameter of measured particles weighted by intensity (Z-average), calculated with Malvern Zetasizer Software 7.13. Error bars represent standard deviation obtained from the distribution.
-
Figure 4—figure supplement 2—source data 1
Spreadsheet containing raw data for DLS curves shown in Figure 4—figure supplement 2A.
- https://cdn.elifesciences.org/articles/89813/elife-89813-fig4-figsupp2-data1-v1.xlsx
-
Figure 4—figure supplement 2—source data 2
Spreadsheet containing raw data for sequestrase activity measurements shown in Figure 4—figure supplement 2B.
- https://cdn.elifesciences.org/articles/89813/elife-89813-fig4-figsupp2-data2-v1.xlsx
Figure 5 with 5 supplements
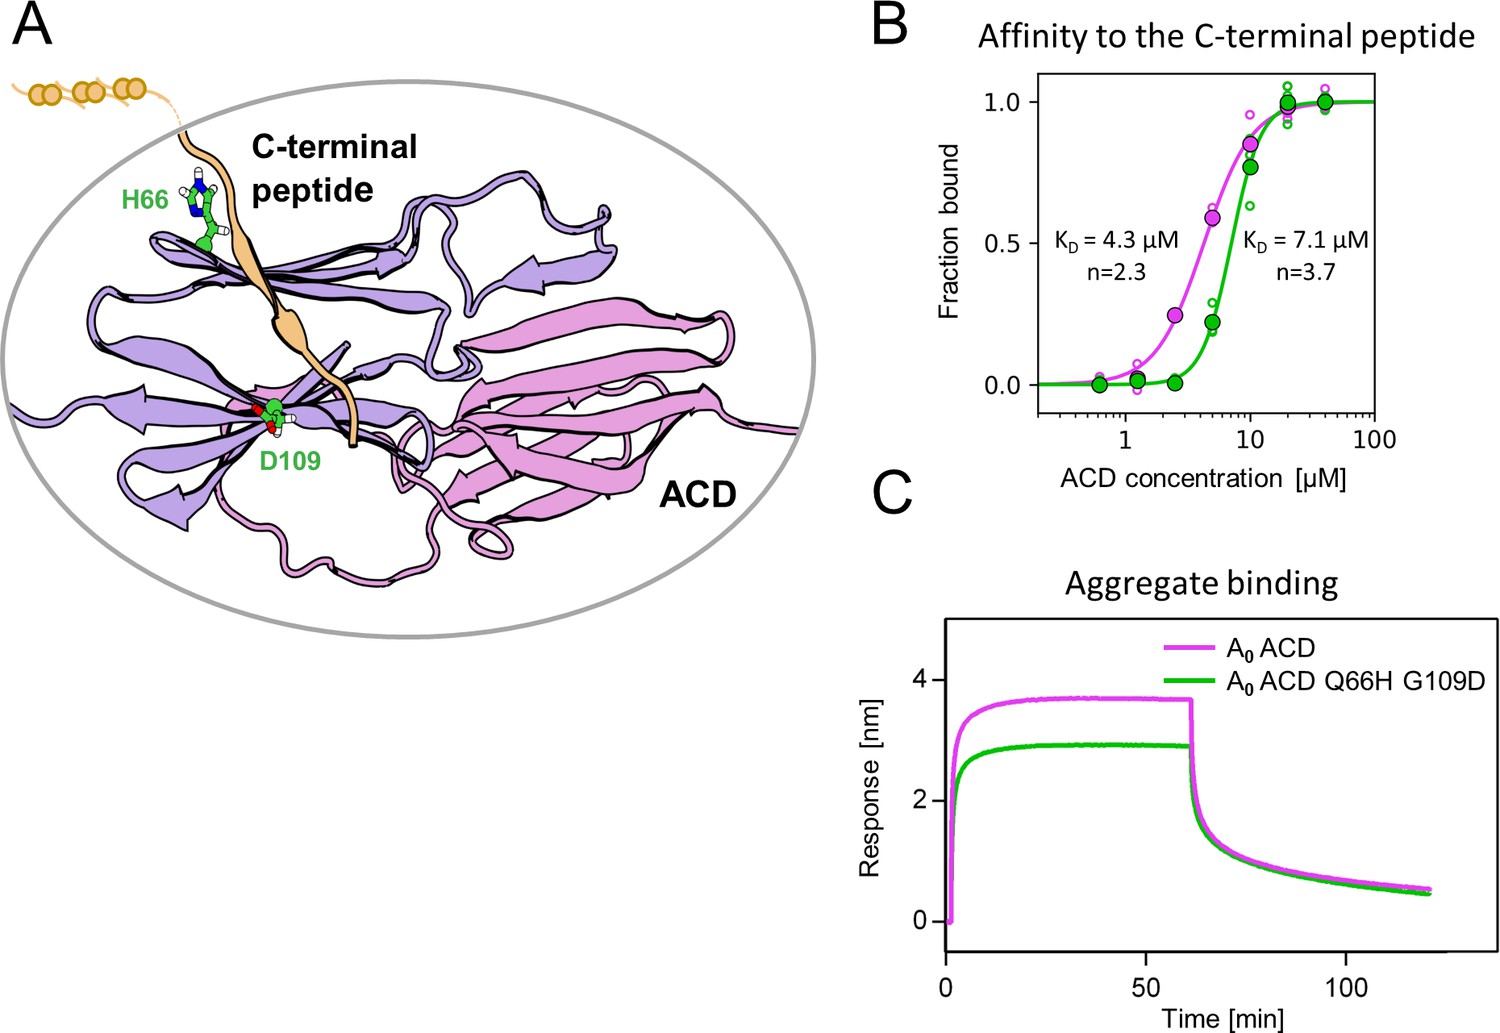
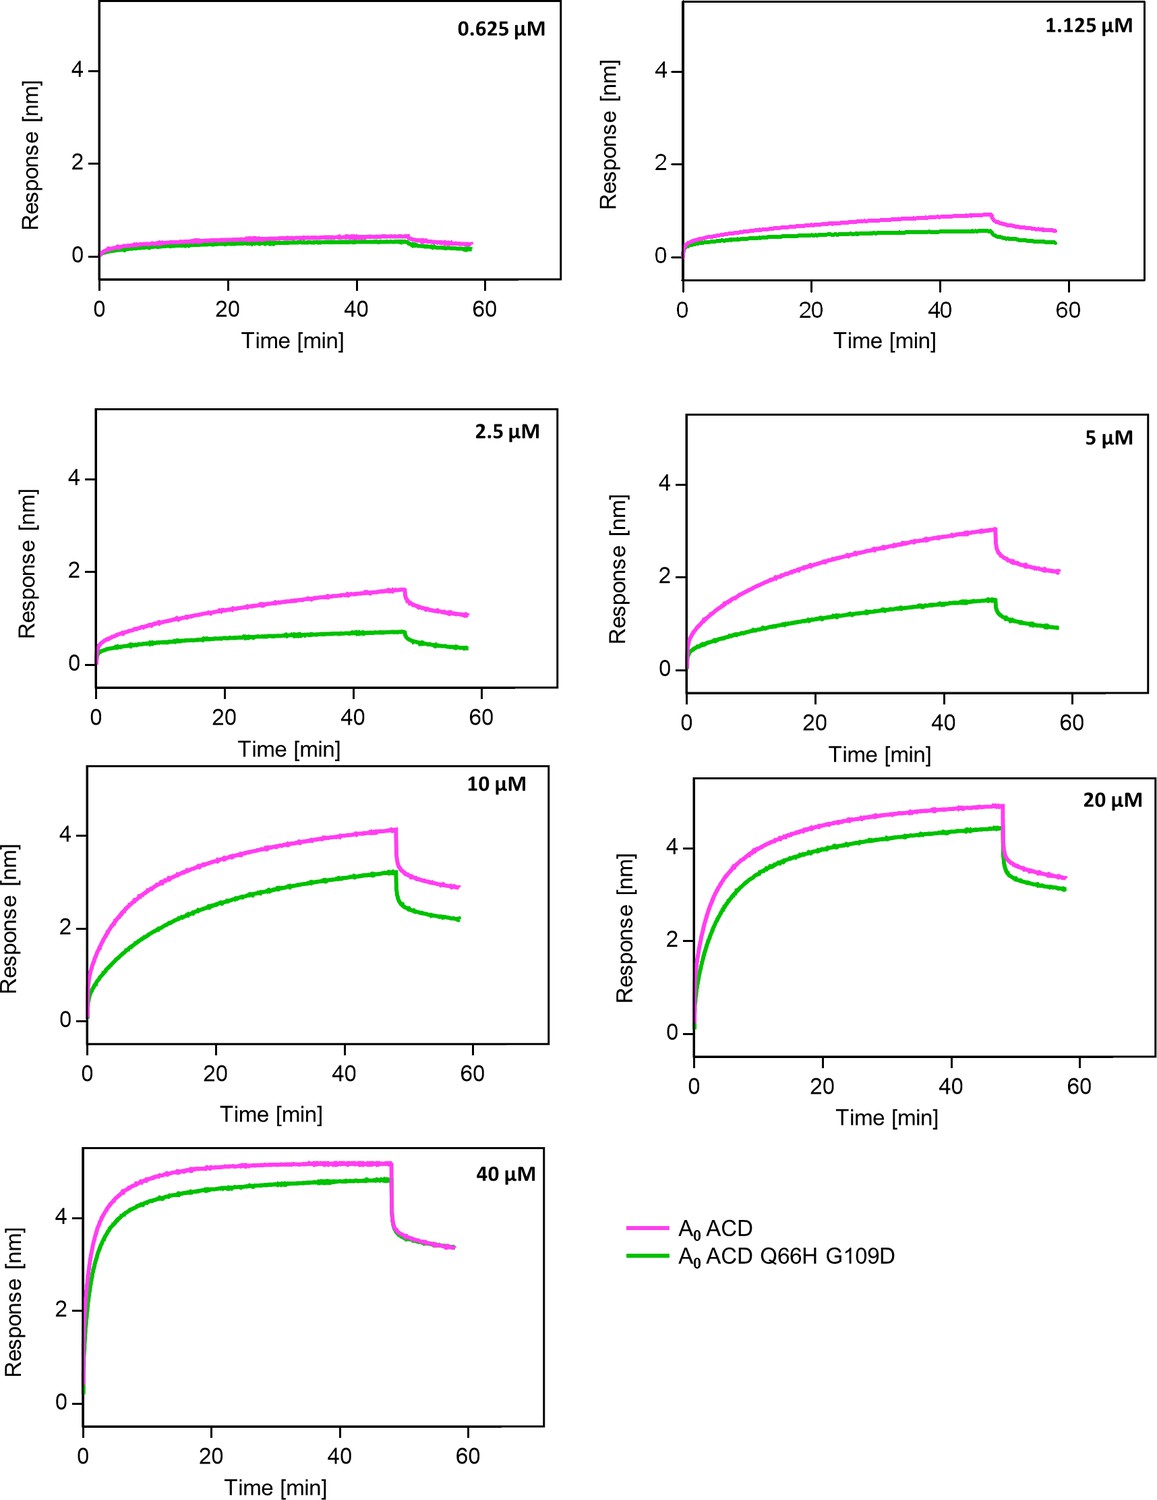
Substitutions at positions 66 and 109 decreased the affinity of AncA0 ACD to C-terminal peptide and aggregated substrate.
(A) Structural model of complex formed by AncA0 Q66H G109D ɑ-crystallin domain dimer (purple and lilac) and AncA0 C-terminal peptide (orange). (B) Effect of Q66H G109D substitutions (green) on AncA0 (purple) ACD’s affinity to the C-terminal peptide assayed by Biolayer interferometry (BLI). Biolayer thickness at the end of the association step was used to calculate the fraction of bound peptide. Filled circles represent means of triplicate measurements, individual data points are shown as hollow circles and were fitted to the cooperative binding model (Hill equation). Values of fitted binding affinities [K0.5] (AncA0 4.3 ± 0.2 µM, AncA0 Q66H G109D 7.1 ± 0.2 µM) and Hill coefficients [n] (AncA0 2.3 ± 0.17, AncA0 Q66H G109D 3.7 ± 0.34) are indicated on the plot. (C) Effect of Q66H G109D substitutions on AncA0 ACD’s affinity to aggregated E. coli proteins bound to BLI sensor. Analysis was performed as in Figure 3A.
-
Figure 5—source data 1
PDB file of the structural model of complex formed by AncA0 Q66H G109D ɑ-crystallin domain dimer and AncA0 C-terminal peptide shown in Figure 5A and Figure 5—figure supplement 2.
- https://cdn.elifesciences.org/articles/89813/elife-89813-fig5-data1-v1.zip
-
Figure 5—source data 2
Spreadsheet containing raw values of biolayer thickness at the end of the association step (for binding to the C-terminal peptide and nonspecific binding to His6-SUMO), used for fitting the curve shown in Figure 5B.
- https://cdn.elifesciences.org/articles/89813/elife-89813-fig5-data2-v1.xlsx
-
Figure 5—source data 3
Spreadsheets containing raw data for binding and dissociation curves used to obtain biolayer thickness at the end of association curve values shown in Figure 5—source data 2.
Different repeats as well as curves representing nonspecific binding of α–crystallin domains (ACDs) to His6-SUMO are in separate sheets. Repeat 1 was used as a representative binding curves shown in Figure 5—figure supplement 3.
- https://cdn.elifesciences.org/articles/89813/elife-89813-fig5-data3-v1.xlsx
-
Figure 5—source data 4
Spreadsheets containing raw data for binding and dissociation curves shown in Figure 5C.
- https://cdn.elifesciences.org/articles/89813/elife-89813-fig5-data4-v1.xlsx
Figure 5—figure supplement 1

AncA0 residues 66 and 109 contact the C-terminal peptide, although overall contact pattern remains similar upon introduction of Q66H G109D substitutions.
Heatmaps illustrating contact probabilities, derived from last 400 ns of equilibrium molecular dynamics (MD) simulations, between residues of the α–crystallin domain (ACD) (vertical-axis) and the C-terminal peptide (horizontal axis) for AncA0 (left) and AncA0 Q66H G109D (right). Number within each cell of the heatmap and cell shading represent contact probability. Schematic next to the vertical axis of AncA0 heatmap represents positioning of the ACD residues within secondary structure elements. Substituted ACD residues are underlined.
Figure 5—figure supplement 2

Comparison of the structural models of AncA0 (purple) and AncA0 Q66H G109D (green) α–crystallin domain (ACD) dimers complexed with the C-terminal peptides.
Models represent middle structures of largest clusters obtained from equilibrium molecular dynamics simulation trajectories based on the AlphaFold2 prediction. Models were superimposed on the backbone heavy atoms of the C-terminal-peptide interacting ACD monomer without dimerization loop (residues 40–74 and 95–126) and the stably interacting C-terminal peptide fragment (residues 132–137), RMSD of the superimposed regions backbone atoms – 0.81 Å, RMSD of the whole complex backbone atoms – 3.42 Å. Substituted residues in positions 66 and 109 are shown in licorice representation.
-
Figure 5—figure supplement 2—source data 1
PDB file of the structural model of complex formed by AncA0 ɑ-crystallin domain dimer and AncA0 C-terminal peptide shown in Figure 5—figure supplement 2.
For PDB file of the structural model of complex formed by AncA0 Q66H G109D ɑ-crystallin domain dimer and AncA0 C-terminal peptide see Figure 5—source data 1.
- https://cdn.elifesciences.org/articles/89813/elife-89813-fig5-figsupp2-data1-v1.zip
Figure 5—figure supplement 3
Substitutions Q66H G109D decrease affinity of AncA0 ACD to AncA0 C-terminal peptide.
Representative binding curves for different concentrations of AncA0 ACD and AncA0 Q66H G109D ACD interacting with AncA0 C-terminal peptide; background was not subtracted. Peptide was immobilized on BLI NTA sensor via His6-Sumo tag.
Figure 5—figure supplement 4
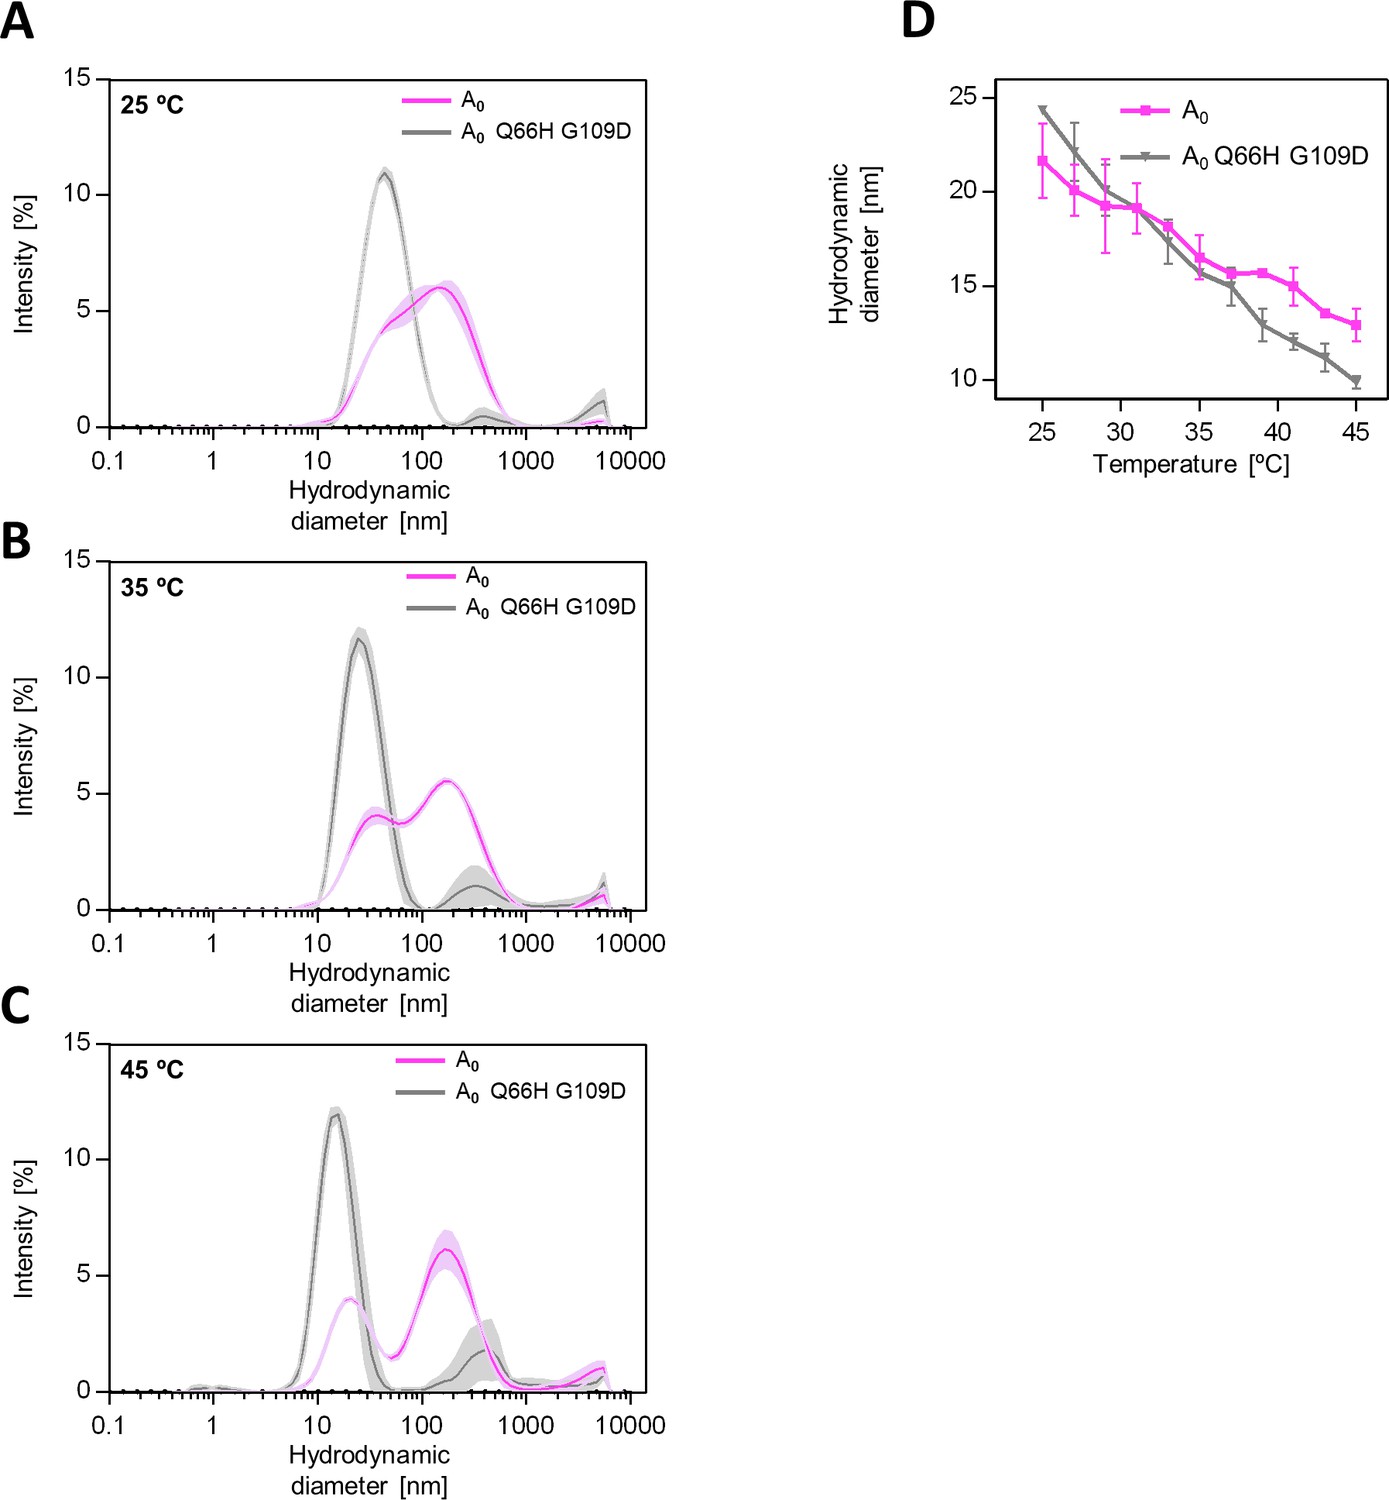
Substitutions Q66H G109D influence AncA0 oligomerization.
(A) Hydrodynamic diameter distributions shown as DLS signal intensity for better visualization purposes of AncA0 and AncA0 Q66H G109D measured at 25, 35, and 45 °C. Size distributions were measured by DLS. Results are shown as an average of 3 repeats. Error bars (shades) represent standard deviation. (B) Changes of hydrodynamic diameter representing maximum of the dominant peak of hydrodynamic diameter distribution by volume with temperature. Results are shown as an average of 3 repeats. Error bars represent standard deviation.
-
Figure 5—figure supplement 4—source data 1
Spreadsheet containing raw data for DLS curves shown in Figure 5—figure supplement 4A–C.
- https://cdn.elifesciences.org/articles/89813/elife-89813-fig5-figsupp4-data1-v1.xlsx
-
Figure 5—figure supplement 4—source data 2
Spreadsheet containing raw data for graph shown in Figure 5—figure supplement 4D.
- https://cdn.elifesciences.org/articles/89813/elife-89813-fig5-figsupp4-data2-v1.xlsx
Figure 5—figure supplement 5
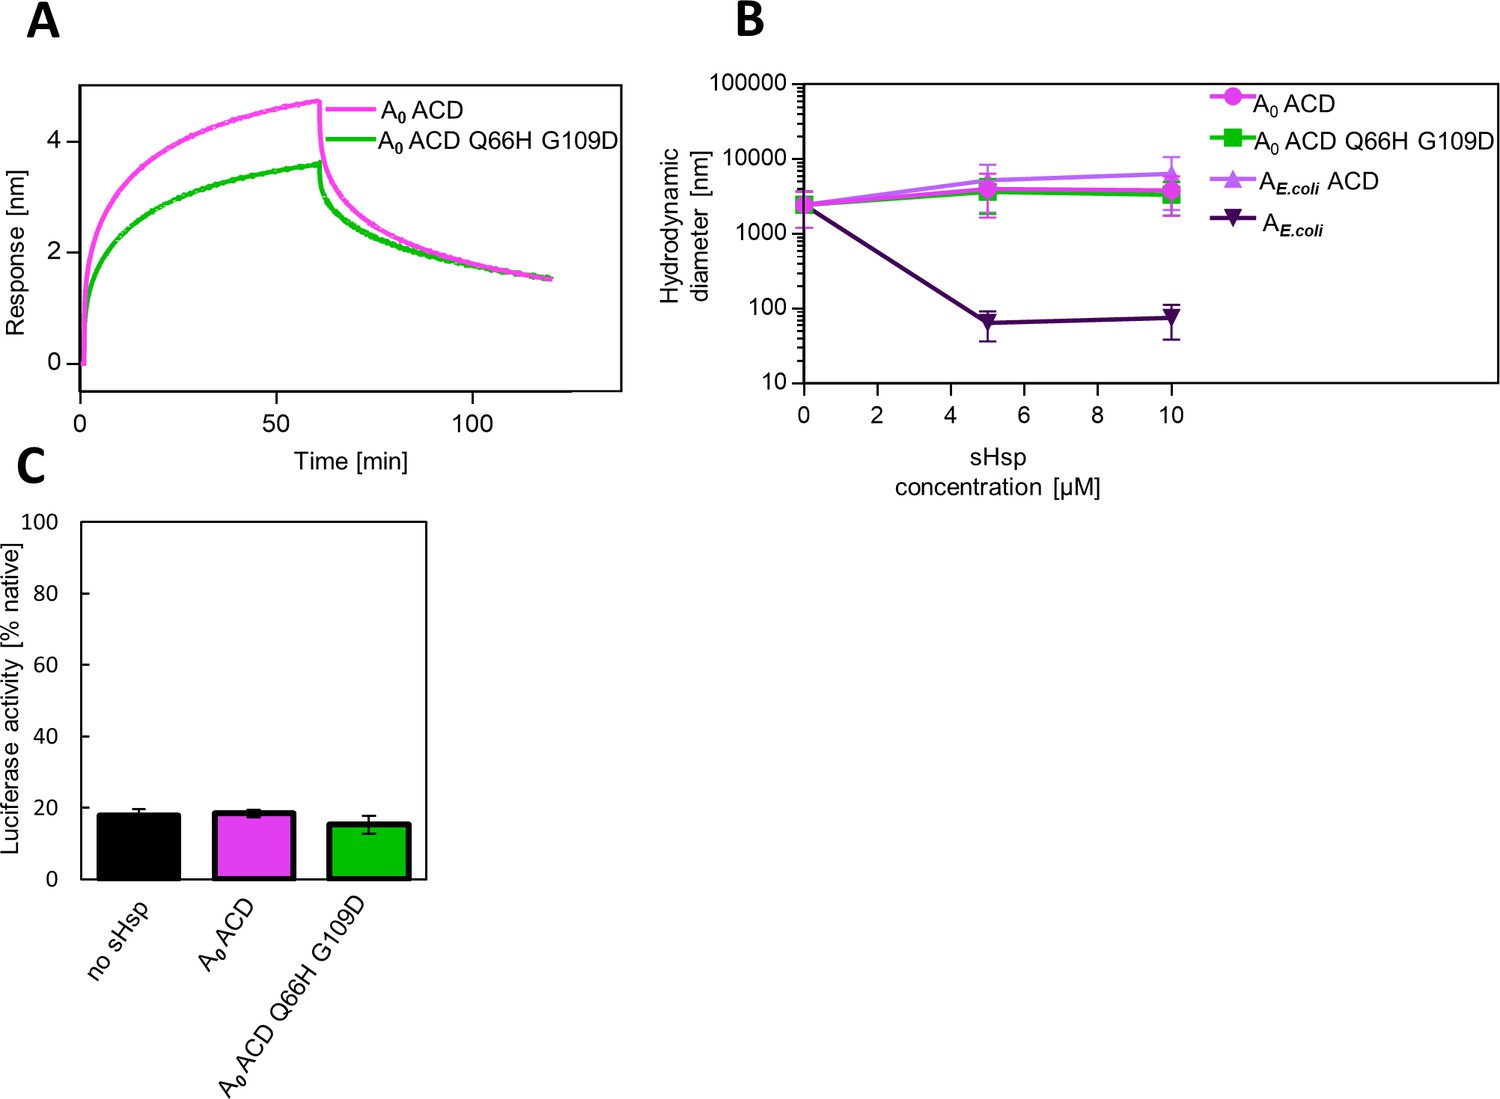
AncA0 ACD and AncA0 ACD Q66H G109D can bind to aggregated luciferase, but do not exhibit sequestrase activity or ability to stimulate luciferase refolding.
(A) Effect of Q66H G109D substitutions on AncA0 ACD affinity to aggregated luciferase; analysis was performed as in Fig.Figure 3A. (B) Ability of AncA0 ACD and AncA0 Q66H G109D ACD to sequester aggregating luciferase. Results were compared to α–crystallin domain (ACD) of extant E. coli IbpA, as well as full-length extant E. coli IbpA. Analysis was performed as in Figure 3B. For every measurement, ten subsequent series of ten 10-s runs were averaged and particle size distribution was calculated by fitting to 70 size bins between 0.4 and 10,000 nm. Results are presented as an average hydrodynamic diameter of measured particles weighted by intensity (Z-average), calculated with Malvern Zetasizer Software 7.13. Error bars represent standard deviation obtained from the distribution. (C) Ability of AncA0 ACD and AncA0 Q66H G109D ACD to stimulate Hsp70-Hsp100-dependent luciferase disaggregation. Luciferase refolding assay was performed as in Figure 1. Activity of luciferase was measured after 1 hr refolding at 25 °C and shown as an average of 3 repeats. Error bars represent standard deviation.
-
Figure 5—figure supplement 5—source data 1
Spreadsheet containing raw data for binding and dissociation curves shown in Figure 5—figure supplement 5A.
- https://cdn.elifesciences.org/articles/89813/elife-89813-fig5-figsupp5-data1-v1.xlsx
-
Figure 5—figure supplement 5—source data 2
Spreadsheet containing raw data for sequestrase measurements shown in Figure 5—figure supplement 5B.
- https://cdn.elifesciences.org/articles/89813/elife-89813-fig5-figsupp5-data2-v1.xlsx
-
Figure 5—figure supplement 5—source data 3
Spreadsheet containing raw data for luciferase refolding graphs shown in Figure 5—figure supplement 5C.
- https://cdn.elifesciences.org/articles/89813/elife-89813-fig5-figsupp5-data3-v1.xlsx
Figure 6 with 1 supplement
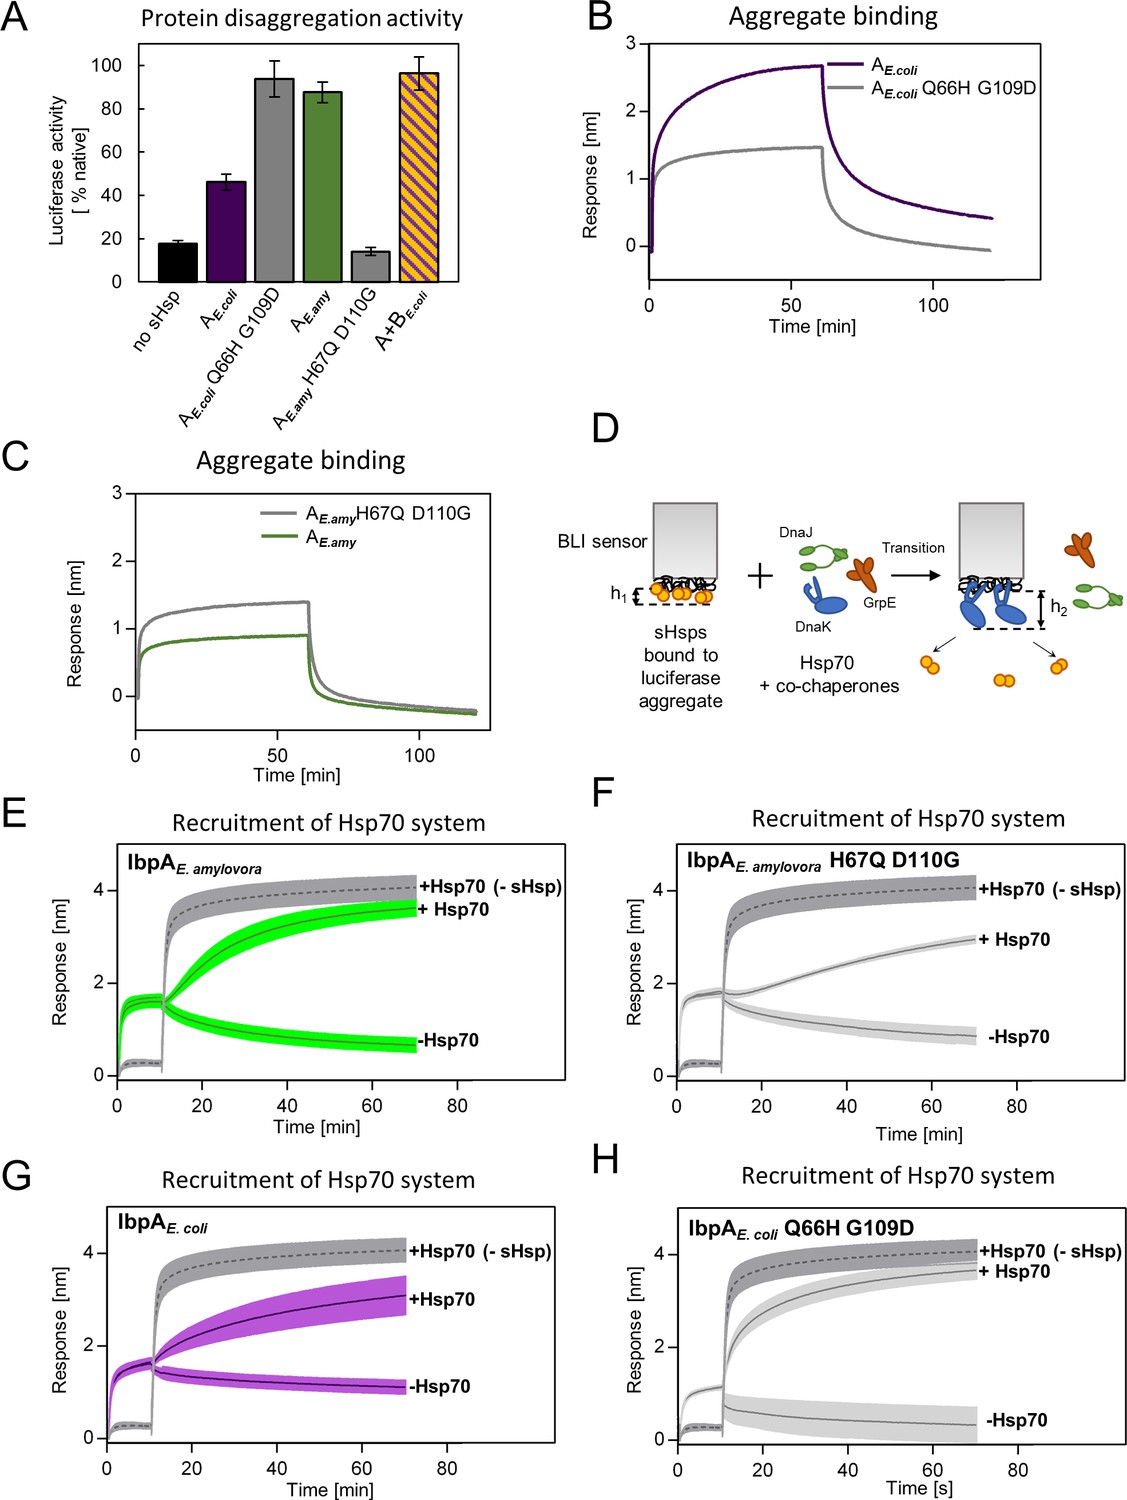
Differences at positions 66 and 109 determine functional differences between extant IbpA proteins from E. coli and E. amylovora.
(A) Effect of substitutions at position 66 and 109 (and homologous) on the ability of IbpA from E. amylovora and E. coli to stimulate luciferase refolding. Assay was performed as in Figure 1B. Activity of luciferase was measured after 1 h refolding at 25 °C and shown as an average of 3 repeats. Error bars represent standard deviation. (B, C) Effect of substitutions at analyzed positions on binding of IbpA from E. coli (B) and E. amylovora (C) to heat - aggregated E. coli proteins. Assay was performed as in 3 A. (D–H) Effect of substitutions at analyzed positions on inhibition of Hsp70 system binding to aggregates by extant small heat shock proteins (sHsps) (D) Experimental scheme. (E–H) Aggregate-bound sHsps differently inhibit Hsp70 binding. Biolayer interferometry (BLI) sensor with immobilized aggregated luciferase and aggregate bound sHsps was incubated with Hsp70 or buffer (spontaneous dissociation curve).Dark gray traces (dashed line) represent Hsp70 binding to immobilized aggregates in the absence of sHsps. Results are presented as an average of 5 (in the case of IbpA E. coli in panel G), 4 (in the case of IbpA E. coli Q66H G109d with Hsp70 in panel H), 2 (in the case of IbpA E. coli Q66H G109d without Hsp70 in panel H) or 3 repeats (in the case of the remaining curves). Error bars (shades) represent standard deviation.
-
Figure 6—source data 1
Spreadsheet containing raw data for the luciferase refolding graph shown in Figure 6A.
- https://cdn.elifesciences.org/articles/89813/elife-89813-fig6-data1-v1.xlsx
-
Figure 6—source data 2
Spreadsheet containing raw data for binding and dissociation curve shown in Figure 6B.
- https://cdn.elifesciences.org/articles/89813/elife-89813-fig6-data2-v1.xlsx
-
Figure 6—source data 3
Spreadsheet containing raw data for binding and dissociation curve shown in Figure 6C.
- https://cdn.elifesciences.org/articles/89813/elife-89813-fig6-data3-v1.xlsx
-
Figure 6—source data 4
Spreadsheet containing raw data for binding and dissociation curves shown in Figure 6E.
- https://cdn.elifesciences.org/articles/89813/elife-89813-fig6-data4-v1.xlsx
-
Figure 6—source data 5
Spreadsheet containing raw data for binding and dissociation curves shown in Figure 6F.
- https://cdn.elifesciences.org/articles/89813/elife-89813-fig6-data5-v1.xlsx
-
Figure 6—source data 6
Spreadsheet containing raw data for binding and dissociation curves shown in Figure 6G.
- https://cdn.elifesciences.org/articles/89813/elife-89813-fig6-data6-v1.xlsx
-
Figure 6—source data 7
Spreadsheet containing raw data for binding and dissociation curves shown in Figure 6H.
- https://cdn.elifesciences.org/articles/89813/elife-89813-fig6-data7-v1.xlsx
Figure 6—figure supplement 1
lbpAE.coli H66Q G109D and IbpAE.amyl H67Q D110G exhibit sequestrase activity and reversibly deoligomerize at heat shock temperature: (A) Reversible deoligomerization of IbpAE. coli H66Q G109D and IbpAE.amyl H67Q D110 at heat shock temperature.
Measurements were performed as in Figure 3—figure supplement 2. (B) Sequestrase activity of IbpAE. coli H66Q G109D and IbpAE.amyl H67Q D110 at heat shock temperature. Measurements were performed as in Figure 3B. For every measurement, ten subsequent series of ten 10-s runs were averaged and particle size distribution was calculated by fitting to 70 size bins between 0.4 and 10,000 nm. Results are presented as an average hydrodynamic diameter of measured particles weighted by intensity (Z-average), calculated with Malvern Zetasizer Software 7.13. Error bars represent standard deviation obtained from the distribution.
-
Figure 6—figure supplement 1—source data 1
Spreadsheet containing raw data for DLS curves shown in Figure 6—figure supplement 1A.
- https://cdn.elifesciences.org/articles/89813/elife-89813-fig6-figsupp1-data1-v1.xlsx
-
Figure 6—figure supplement 1—source data 2
Spreadsheet containing raw data for sequestrase activity measurements shown in Figure 6—figure supplement 1B.
- https://cdn.elifesciences.org/articles/89813/elife-89813-fig6-figsupp1-data2-v1.xlsx
Tables
Key resources table
| Reagent type (species) or resource | Designation | Source or reference | Identifiers | Additional information |
|---|---|---|---|---|
| Software, algorithm | Clustal Omega | Clustal Omega | RRID:SCR_001591 | European Bioinformatics Institute |
| Software, algorithm | iq-tree | IQ-TREE | ||
| Software, algorithm | FastML | FastML | RRID:SCR_016092 | Tel Aviv University |
| Software, algorithm | codeml | codeml | RRID:SCR_014932 | Part of PAML software package |
| Software, algorithm | Gromacs 2019.2 | GROMACS | RRID:SCR_014565 | |
| Software, algorithm | AlphaFold-Multimer | AlphaFold-Multimer | ColabFold implementation | |
| Software, algorithm | PyMol | PyMol | RRID:SCR_000305 | |
| Recombinant DNA reagent | pET3a – AncA0 (plasmid) | This paper | pET3a plasmid carrying AncA0 gene was ordered from Genscript on the basis of reconstructed amino acid sequence. For the sequence of synthesized gene see Supplementary file 5 | |
| Recombinant DNA reagent | pET3a – AncA1 (plasmid) | This paper | pET3a plasmid carrying AncA1 gene was ordered from Genscript on the basis of reconstructed amino acid sequence. For the sequence of synthesized gene see Supplementary file 5 | |
| Recombinant DNA reagent | pET3a – AncA0alt_all (plasmid) | This paper | pET3a plasmid carrying AncA0alt_all gene was ordered from Genscript on the basis of reconstructed amino acid sequence For the sequence of synthesized gene see Supplementary file 5 | |
| Recombinant DNA reagent | pET3a – AncA1alt_all (plasmid) | This paper | pET3a plasmid carrying AncA1alt_all gene was ordered from Genscript on the basis of reconstructed amino acid sequence. For the sequence of synthesized gene see Supplementary file 5 | |
| Recombinant DNA reagent | pET3a – AncA0 + 7 (plasmid) | This paper | pET3a plasmid carrying AncA0 + 7 gene was ordered from Genscript on the basis of reconstructed amino acid sequence. For the sequence of synthesized gene see Supplementary file 5 | |
| Recombinant DNA reagent | pET3a – IbpAEa (plasmid) | This paper | pET3a plasmid carrying gene encoding Erwinia amylovora IbpA protein was ordered from Genscript on the basis of amino acid sequence obtained from PDB database (accession number E5BAR7). For the sequence of synthesized gene see Supplementary file 5 | |
| Recombinant DNA reagent | pET28a-AncA0 ACD (plasmid) | This paper | pET28a plasmid carrying AncA0 ACD gene was ordered from Genscript on the basis of reconstructed amino acid sequence. For the sequence of synthesized gene see Supplementary file 5 | |
| Recombinant DNA reagent | pET28a-AncA0 Q66H H109D ACD (plasmid) | This paper | pET28a plasmid carrying AncA0 ACD Q66H G109D gene was ordered from Genscript on the basis of reconstructed amino acid sequence. For the sequence of synthesized gene see Supplementary file 5 | |
| Recombinant DNA reagent | Champion pET SUMO Expression System (plasmid) | Thermo Fisher Scientific | Cat. # K30001 | |
| Recombinant DNA reagent | pET28a – His6-SUMO-C-peptide (plasmid) | This paper | pET28a plasmid carrying His6-SUMO-C-peptide gene was ordered from Genscript on the basis of reconstructed amino acid sequence of AncA0 C-terminal peptide. For the sequence of synthesized gene see Supplementary file 5 | |
| Peptide, recombinant protein | OuantiLum Recombinant Luciferase | Promega | Cat. # E1701 | |
| Peptide, recombinant protein | Creatin Kinase | Roche | Cat. # 10127566001 | |
| Peptide, recombinant protein | DnaK | DOI:10.1016 /j.jmb.2008.12.009 | DnaK protein from E. coli | |
| Peptide, recombinant protein | DnaJ | DOI:10.1016 /j.jmb.2008.12.009 | DnaJ protein from E. coli | |
| Peptide, recombinant protein | ClpB | DOI:10.1016 /j.jmb.2008.12.009 | ClpB protein from E. coli | |
| Peptide, recombinant protein | IbpAEc | DOI:10.1016 /j.jmb.2008.12.009 | IbpA protein from E. coli | |
| Peptide, recombinant protein | IbpBEc | DOI: 10.1016 /j.jmb.2021.167054 | IbpB protein from E. coli | |
| Peptide, recombinant protein | GrpE | DOI: j.jmb.2008.12.009 | GrpE protein from E. coli | |
| Peptide, recombinant protein | His-tagged luciferase | DOI: 10.1371/journal.pgen.1008479 | ||
| Commercial assay or kit | Luciferase Assay System | Promega | Cat. # E151A, E152A | |
| Strain, strain background (Escherichia coli) | E. coli BL21 (DE3) | ther | Laboratory collection |
Additional files
-
Supplementary file 1
Multiple sequence alignment of Enterobacterales IbpA orthologs used for phylogenetic analysis and ancestral reconstruction in fasta format.
- https://cdn.elifesciences.org/articles/89813/elife-89813-supp1-v1.zip
-
Supplementary file 2
Phylogenetic tree of Enterobacterales IbpA protein family in newick format (see Figure 2).
- https://cdn.elifesciences.org/articles/89813/elife-89813-supp2-v1.zip
-
Supplementary file 3
Posterior probability statistics for ancestral sequence reconstruction of AncA0 and AncA1 nodes.
For each position amino acids reconstructed with posterior probability higher than 0.2 are shown. Single-letter symbols of reconstructed amino acids are followed by posterior probability of reconstruction (in brackets). Positions at which most likely amino acid differ between AncA0 and AncA1 are marked in bold and italics. Posterior probabilities were estimated using the FastML program based on the Maximum Likelihood and Empirical Bayes method.
- https://cdn.elifesciences.org/articles/89813/elife-89813-supp3-v1.docx
-
Supplementary file 4
Statistics for selection analysis.
(A) Branch model statistics for IbpA orthologs from Enterobacterales. Models assumed either branch between nodes AncA0 and AncA1 or entire Erwiniaceae clade as foreground; NS – Not significant. (B) Branch-site model statistics for IbpA orthologs from Enterobacterales. Models assumed either branch between nodes AncA0 and AncA1 or entire Erwiniaceae clade as foreground; NS – Not significant.
- https://cdn.elifesciences.org/articles/89813/elife-89813-supp4-v1.docx
-
Supplementary file 5
Nucleotide sequences of de novo synthesized genes ordered from Genscript.
- https://cdn.elifesciences.org/articles/89813/elife-89813-supp5-v1.docx
-
MDAR checklist
- https://cdn.elifesciences.org/articles/89813/elife-89813-mdarchecklist1-v1.pdf
Download links
A two-part list of links to download the article, or parts of the article, in various formats.
Downloads (link to download the article as PDF)
Open citations (links to open the citations from this article in various online reference manager services)
Cite this article (links to download the citations from this article in formats compatible with various reference manager tools)
Evolution towards simplicity in bacterial small heat shock protein system
eLife 12:RP89813.
https://doi.org/10.7554/eLife.89813.3


