Dynamics of macrophage polarization support Salmonella persistence in a whole living organism
- LPHI, Université de Montpellier, CNRS, INSERM, France
- ICFO - Institute of Photonic Sciences, The Barcelona Institute of Science and Technology, Spain
- Institute for Integrative Biology of the Cell-I2BC, Université Paris-Saclay, CEA, CNRS, France
- MGX-Montpellier GenomiX, Université de Montpellier, CNRS, INSERM, France
Figures
Figure 1 with 1 supplement
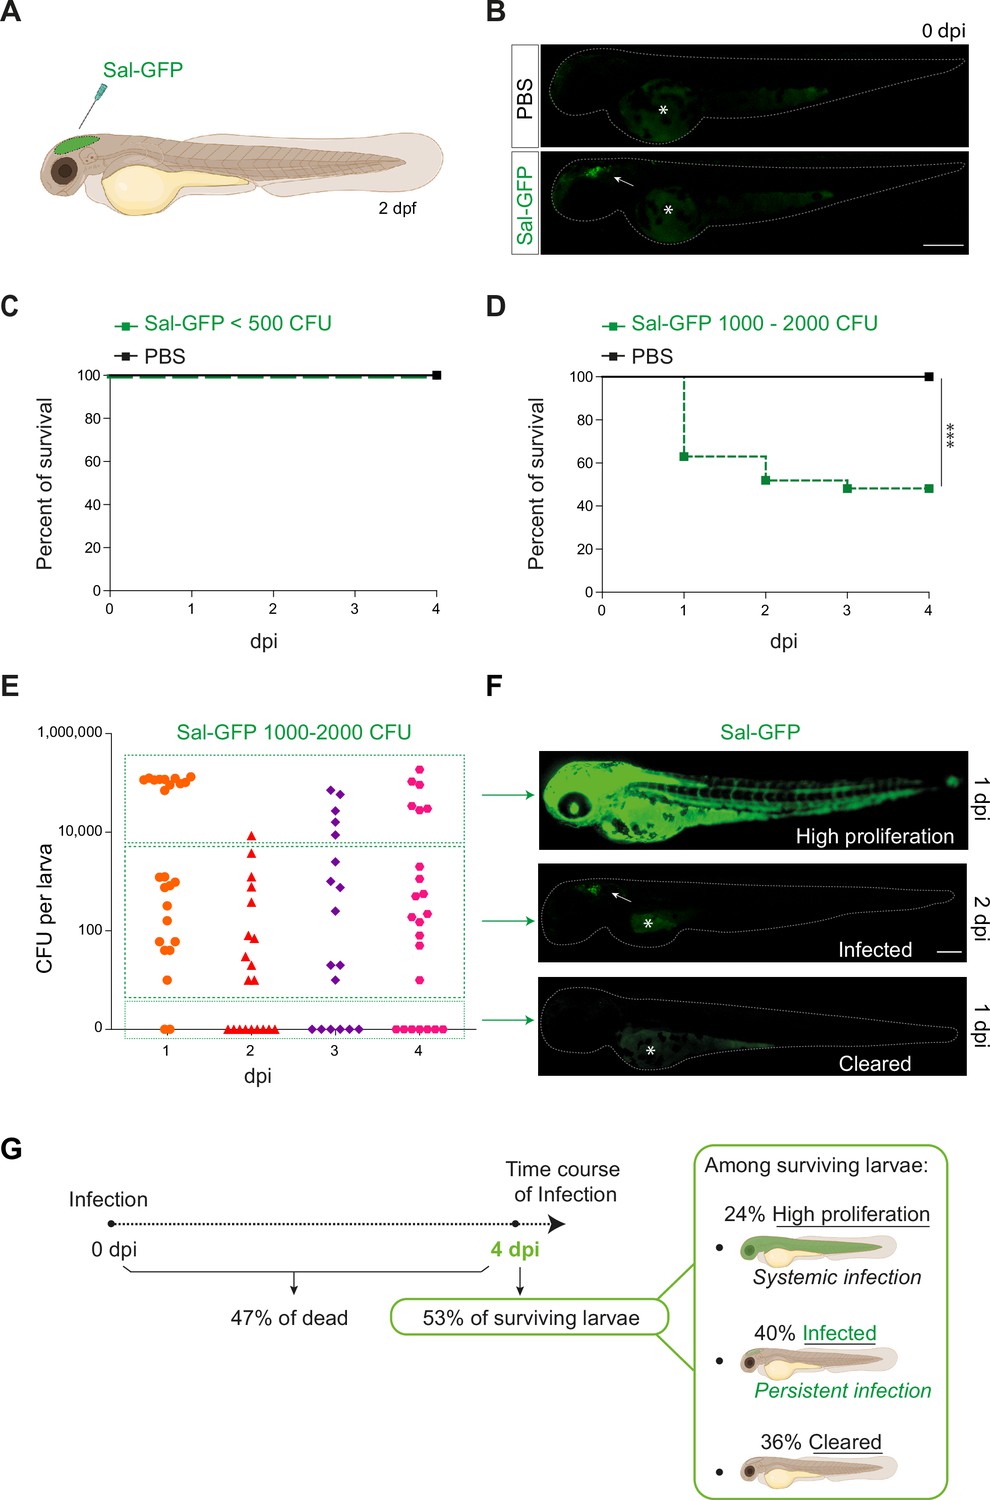
Zebrafish is a pertinent model for persistent Salmonella infection.
(A) Schematic illustration of 2 dpf zebrafish embryo infected in the hindbrain ventricle (HBV) with Sal-GFP, a GFP-expressing strain. (B) Representative fluorescent images of HBV-injected larvae with either PBS or 1000 CFU of Sal-GFP shortly after microinjection. White arrow: bacteria in the HBV. Dots outline the larva. Asterisk: auto-fluorescence of the yolk. Scale bar: 200 μm. Survival curves of injected embryos with either PBS or different doses of Sal-GFP, that is (C) <500 CFU or (D) 1000–2000 CFU. One representative of three replicates (n = 24 larvae per condition). Log rank test, ***p < 0.001. (E) CFU counts per embryos infected with a range of 1000–2000 CFU of Sal-GFP at 1, 2, 3, and 4 dpi. Pool of four independent experiments (n1 dpi = 25, n2 dpi = 20, n3 dpi = 20, n4 dpi = 25 larvae). Kruskal–Wallis test (unpaired, non-parametric): not significant. (F) Representative fluorescent images of Sal-GFP-infected larvae. Bacteria are in green. Dots outline the larva. Asterisk: auto-fluorescence of the yolk. Scale bar: 200 μm. (G) Schematic representation of the different infection outcomes, High Proliferation, Infected, and Cleared, induced by injection of 1000–2000 CFU of Sal-GFP. From 0 to 4 dpi, 47% of the infected larvae developed a systemic infection where the bacteria displayed highly proliferation leading to larval death (High Proliferation). At 4 dpi, among the surviving larvae, 24% still exhibited a systemic infection, while 36% recovered from the infection with no detectable CFU (Cleared) and 40% contained persistent bacteria (Infected).
Figure 1—figure supplement 1

Salmonella localized infection leads to persistence in zebrafish embryos.
(A) Embryos were injected in hindbrain ventricle with either PBS or (1000–2000 CFU) Sal-GFP. CFU counts per PBS-injected embryos. Data of one representative of four replicates. For each replicate, five embryos were sacrificed per time points. (B) Embryos were injected in HBV with either PBS or (500 CFU) Sal-GFP. CFU counts per embryos at 1 and 4 dpi. Data of three replicates pooled together (nPBS = 9, nSal = 16 per time points). (C) CFU counts per Sal-GFP-infected embryos, using 1000 CFU of Sal-GFP, at 14 dpi (n = 12 larvae randomly chosen among surviving larvae).
Figure 2 with 1 supplement
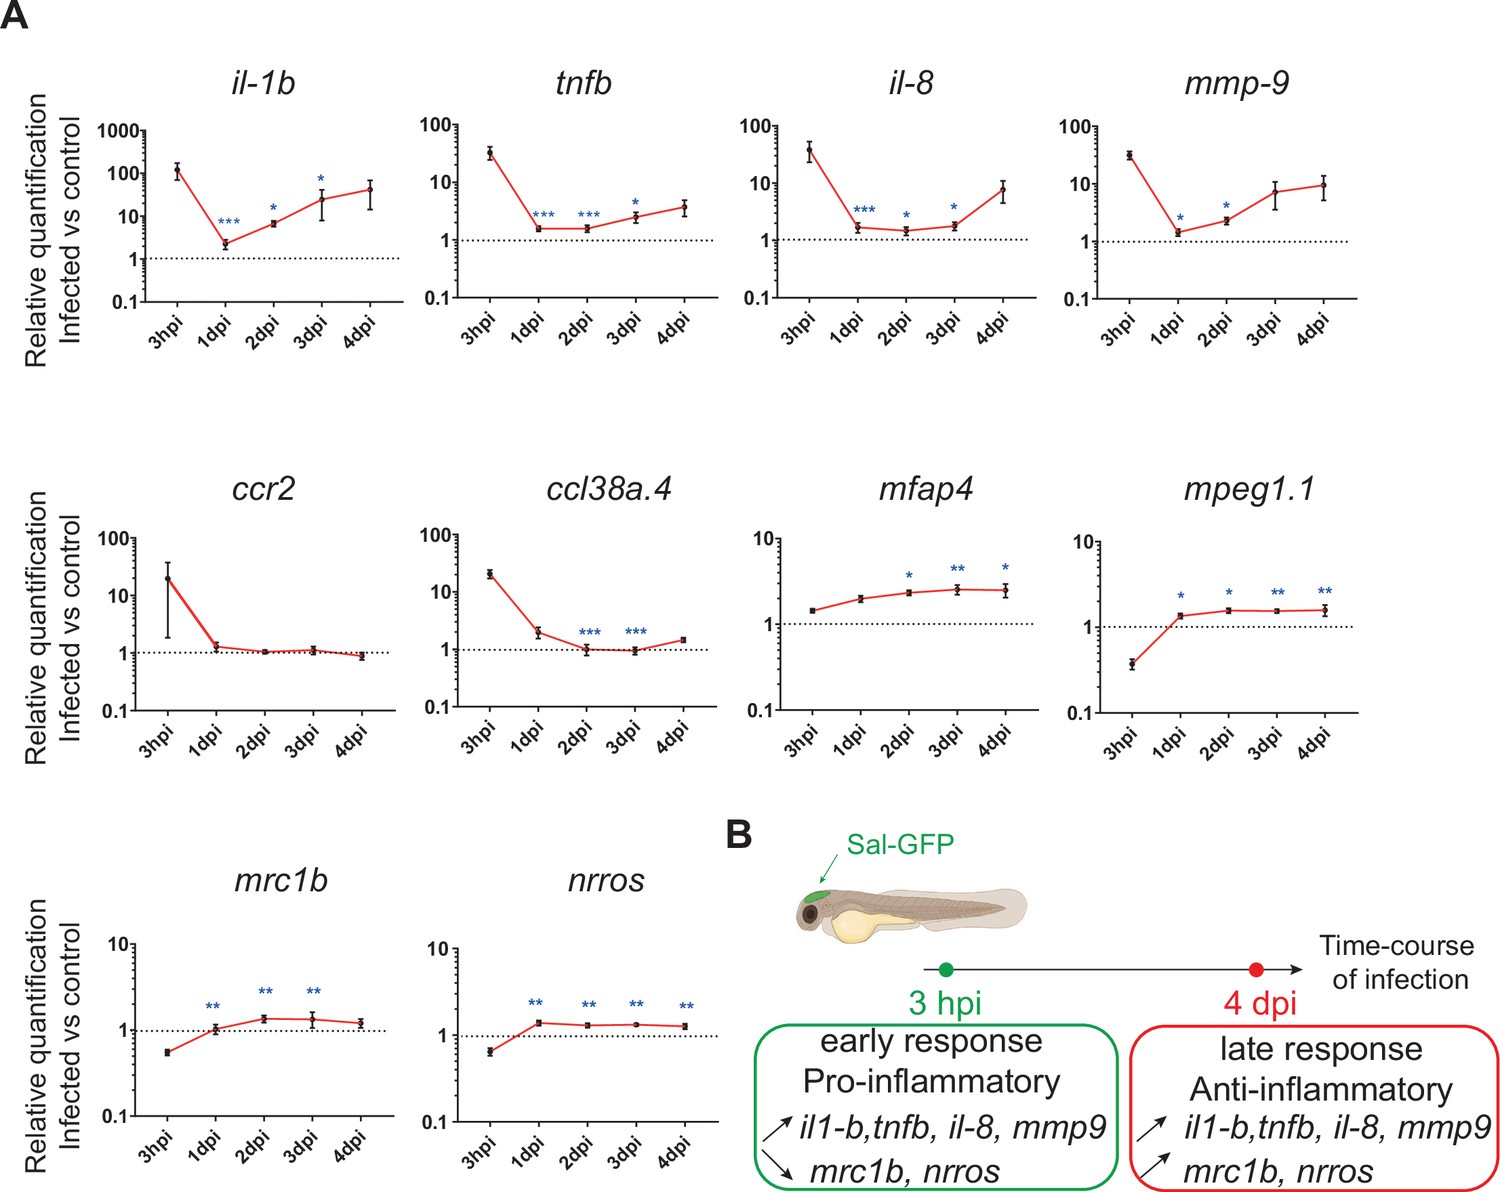
The global host inflammatory response to Salmonella infection.
(A) RT-qPCR analysis of il1b, tnfb, il8, mmp9, ccr2, ccl38a.4, mpeg1, mfap4, mrc1b, and nrros, mRNA expression infected versus non-infected, normalized with ef1a. Larvae were either PBS- or Sal-GFP injected and RNA samples were extracted from whole larvae at 3 hpi, 1, 2, 3 and 4 dpi. After infection, larvae displaying ‘high proliferation’ of bacteria or bacteria ‘cleared’ were excluded from the analysis. Data are presented as relative expression in the infected larvae compared with the relevant PBS-injected controls (2−ΔΔCp). Values are the means ± standard error of the mean (SEM) of eight replicates (n = 8 larvae per time point). Kruskal–Wallis test (unpaired, non-parametric). *p < 0.05; **p < 0.01; ***p < 0.001 show significant differences compared to 3 hpi. (B) Diagram of global host inflammatory response to Salmonella infection.
Figure 2—figure supplement 1
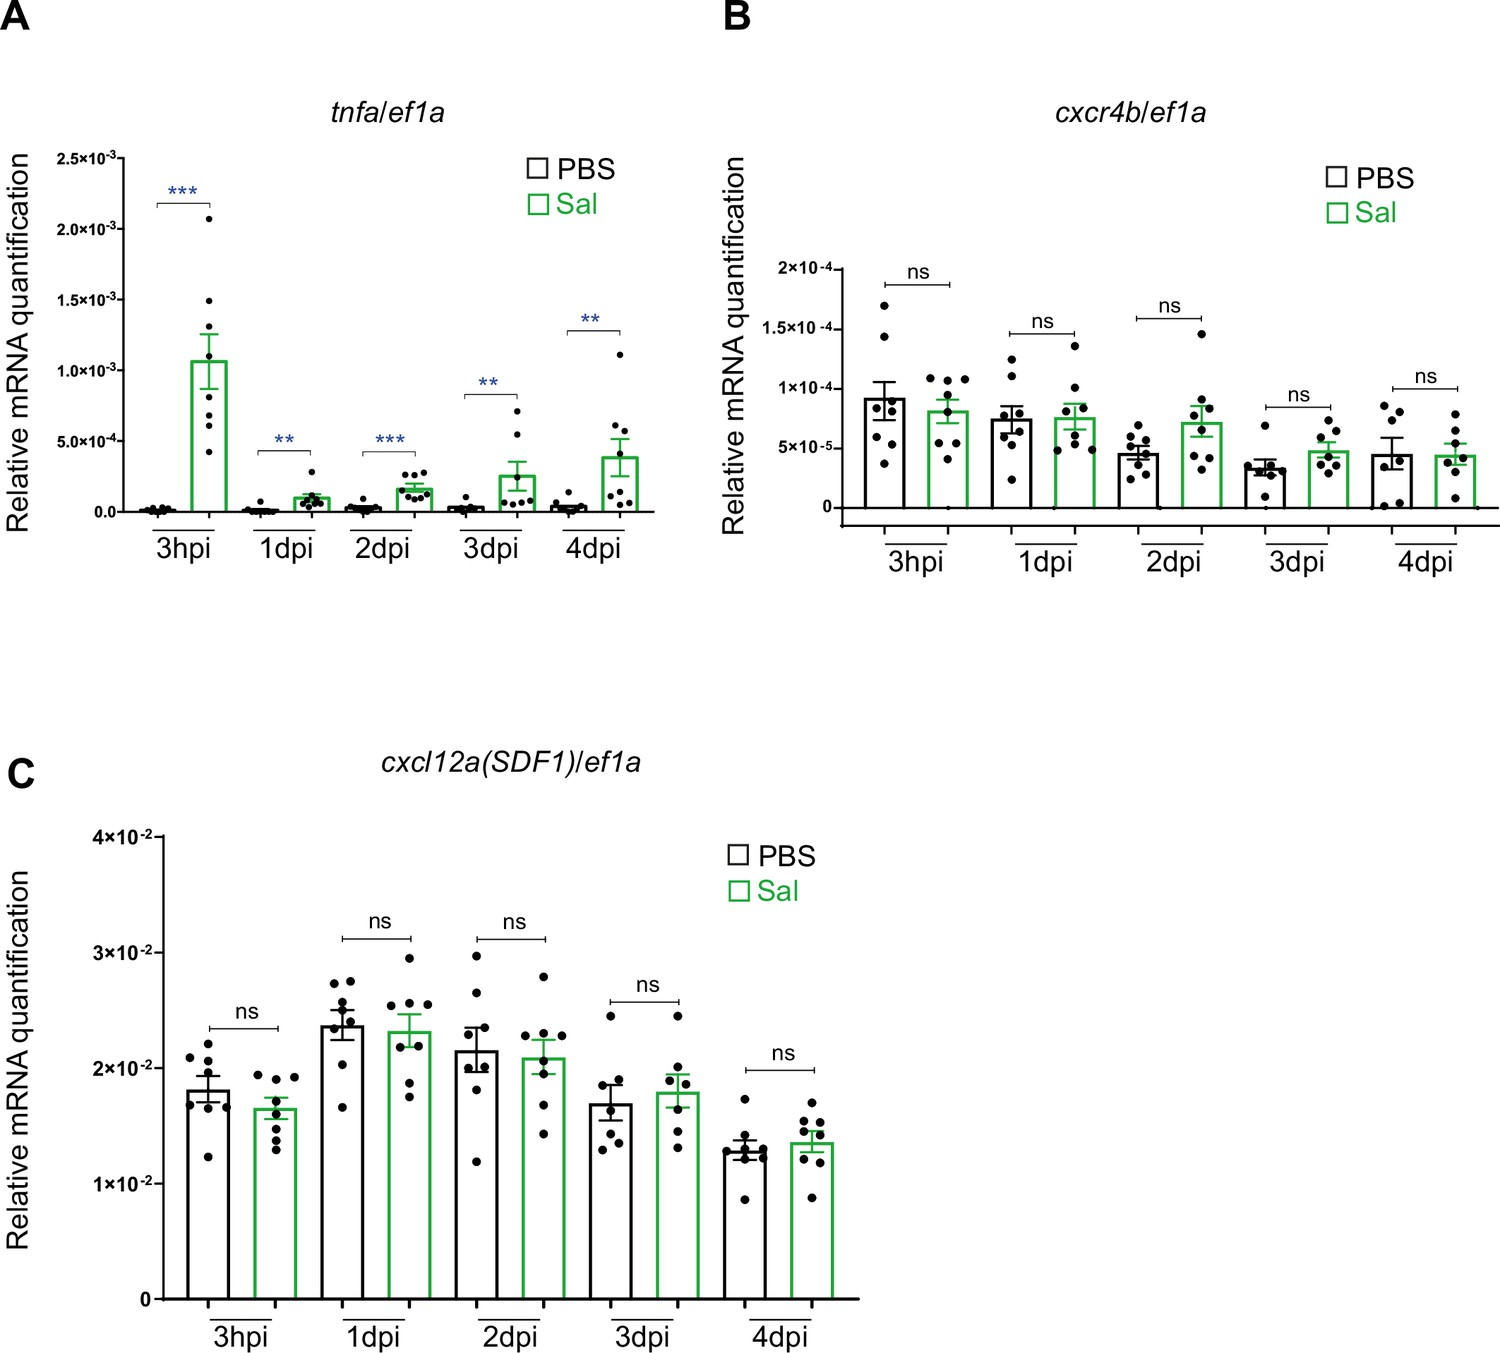
Expression of tnfa, cxcr4b, cxcl12a mRNA during Salmonella infection.
RT-qPCR analysis of (A) tnfa, (B) cxcr4b, and (C) cxcl12a mRNA expression. Embryos were either injected with PBS or Sal-GFP and larvae presenting a high bacterial proliferation were excluded from the analysis. RNA samples were extracted from whole larvae at 3 hpi, 1 dpi, 2 dpi, 3 dpi, and 4 dpi. Data are presented as relative target gene/ef1a expression in the Sal-infected or PBS-injected larvae using the formula 2−ΔCp. Of note, as tnfa expression was usually not detected in PBS condition, data could not be presented as relative expression (Infected versus PBS) as for other genes. Values are the means ± SEM of eight replicates. Per replicate, eight larvae per time points were used (Mann–Whitney test, two-tailed **p < 0.01; ***p < 0.001, ns: not significant).
Figure 3 with 2 supplements
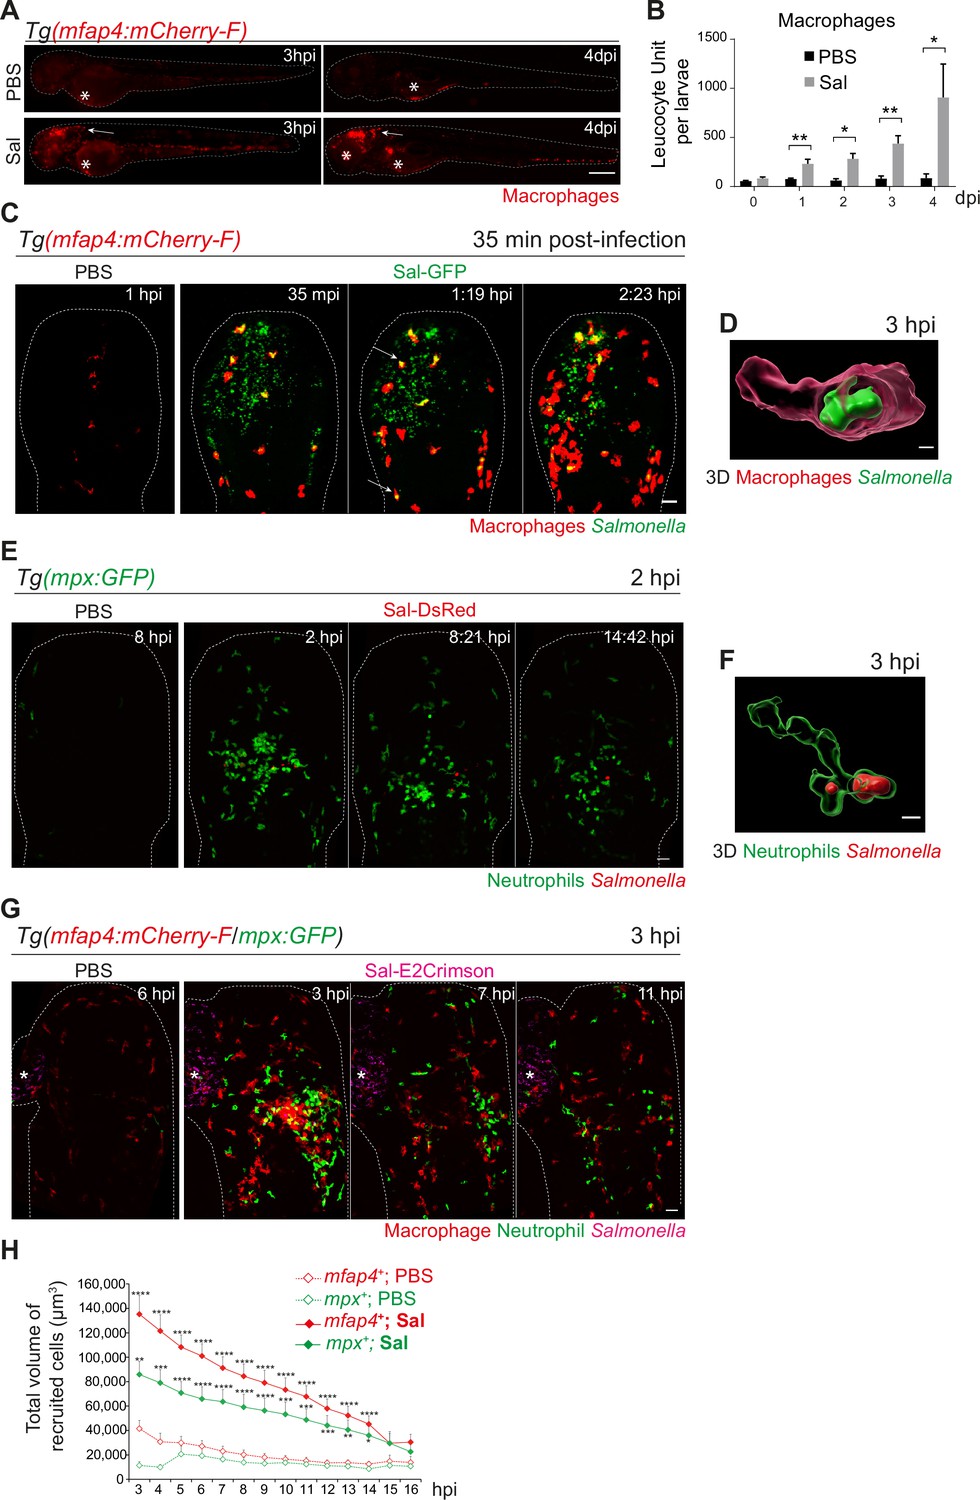
Early phase of Salmonella hindbrain ventricle (HBV) infection induces strong macrophage and neutrophil responses.
(A–D) Tg(mfap4:mCherry-F) larvae were injected with either PBS or Sal-GFP in HBV. (A) Representative fluorescent images of larvae showing macrophage recruitment at the site of injection at 3 hpi and at 4 dpi. Asterisk: auto-fluorescence. Scale bar: 200 μm. (B) Quantification of total macrophages at 0, 1, 2, 3, and 4 dpi. One representative of three replicates (mean number of leukocyte units/larva ± SEM, n0 dpi = 24, n1 dpi = 11, n2 dpi = 6, n3,4 dpi = 5 per condition, Mann–Whitney test, two-tailed, *p < 0.05, **p < 0.01). (C) Representative maximum projections of fluorescent images extracted from 4D sequences using light sheet fluorescence microscopy starting 35 min post-infection during 2 hr, showing recruitment of macrophages (red) to the infection site (Salmonella, green). Scale bar: 30 μm. (D) 3D reconstruction of a macrophage phagocytosing Salmonella at 3 hpi. Scale bar: 5 μm. (E, F) Tg(mpx:GFP) larvae were injected with PBS or Sal-DsRed in HBV. (E) Representative maximum projections of fluorescent images extracted from 4D sequences using confocal microscopy at 2 hpi during 13 hr, showing recruitment of neutrophils (green) to the infection site (Salmonella, red). Scale bar: 35 μm. (F) 3D reconstruction of a neutrophil phagocytosing Salmonella at 2 hpi. Scale bar: 5 μm. (G, H) Tg(mfap4:mCherry-F/mpx:GFP) larvae were injected with either PBS or Sal-E2Crimson in HBV. (G) Representative maximum projections extracted from 4D sequences using confocal microscopy from 3 to 14 hpi showing recruitment of both neutrophils (green) and macrophages (red) to the infection sites. Asterisk: auto-fluorescence. Scale bar: 50 μm. (H) Quantification of the total volume of recruited cells (mfap4+ or mpx+ cells) from 3 to 16 hpi. Data of three replicates pooled (mean volume/larva ± SEM, n = 11 from 3 to 4 hpi, n = 15 from 5 to 14 hpi, n = 4 from 15 to 16 hpi per condition, Mann–Whitney test, two-tailed, significance of Sal versus PBS conditions *p < 0.05, **p < 0.01, ***p < 0.001, ****p < 0.0001).
Figure 3—figure supplement 1
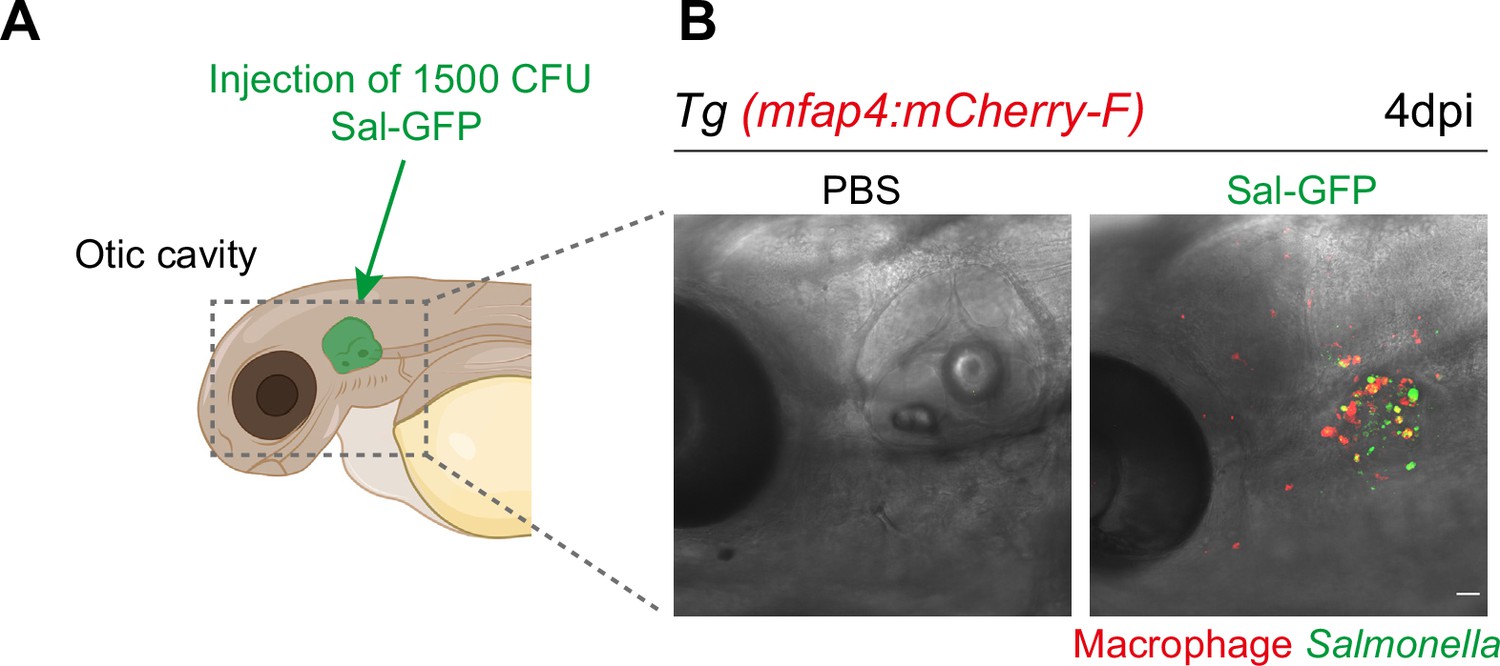
Macrophage response upon Salmonella injection in the otic vesicle.
(A) Schematic illustration of the otic vesicle injection site in 2 dpf zebrafish embryos. (B) Representative maximum projections of fluorescent confocal images of Tg(mfap4:mCherry-F) reporter embryos injected into the otic vesicle with either PBS- (left) or 1000 CFU of Sal-GFP (right), showing interactions of macrophages (red) and persistent Salmonella (green) at 4 dpi. Scale bar: 30 μm.
Figure 3—figure supplement 2

Macrophages are essential to control Salmonella infection in zebrafish.
(A) Schematic illustration showing the mode of action of the nitroreductase (NTR) enzyme (encoded by Escherichia coli nfsb) in macrophages that converts the metronidazole (MTZ) pro-drug into a cytotoxic drug. (B) Schedule of the macrophage depletion experiment. Tg(mpeg1:GAL4/UAS:nfsB-mCherry) larvae were treated with MTZ (NTR+MTZ+) at 48 hpf, 24 hr before infection. DMSO treatment on the same line (NTR+MTZ−) or MTZ treatment on WT siblings (NTR−MTZ+) were used as controls. After MTZ treatment, larvae were injected in the hindbrain ventricle (HBV) either with PBS or with a sublethal dose (500 CFU) of Sal-GFP in the HBV. Infected larvae were analyzed for their survival from 0 to 4 dpi. (C) Representative mCherry fluorescent images of DMSO or MTZ-treated transgenic larvae at 1 day post-treatment (dpT). Asterisk: auto-fluorescence of the yolk, dotted line outlines the larva. Scale bar: 200 μm. (D) Quantification of total NTR+ macrophages in DMSO (MTZ−) and MTZ+-treated larvae at 1 dpT. Data of one representative of two replicates (mean number of cells/larva ± standard error of the mean [SEM], n = 15 per condition, Mann–Whitney test, one-tailed, ****p < 0.0001). (E) Survival curves of DMSO or MTZ-treated NTR+ PBS-injected embryos. Data of one representative of two replicates (n = 24 larvae per condition). (F) Survival curves of DMSO or MTZ-treated NTR+ Sal-GFP-infected embryos. Data of one representative of two replicates (n = 24 larvae per condition), log rank test, ****p < 0.0001. (G) Bacterial load quantification by fluorescent pixel count (FPC) from 1 to 4 dpi in DMSO or MTZ treated in NTR+ Sal-GFP-infected embryos. Data of one representative of two replicates (mean values/larva ± SEM, at 1 dpi: nNTR+MTZ+ = 17, nNTR−MTZ+ = 16, Mann–Whitney test, two-tailed, ****p < 0.0001, ***p < 0.001). (H) Representative fluorescent images of DMSO and MTZ-treated Tg(mpeg1:GAL4/UAS:nfsB-mCherry) Sal-GFP-infected larvae at 1 dpi showing mCherry (macrophage) and GFP (Salmonella) fluorescence. Asterisk: auto-fluorescence of the yolk, white arrowhead: Sal-GFP in the HBV. Scale bar: 200 μm.
Figure 4
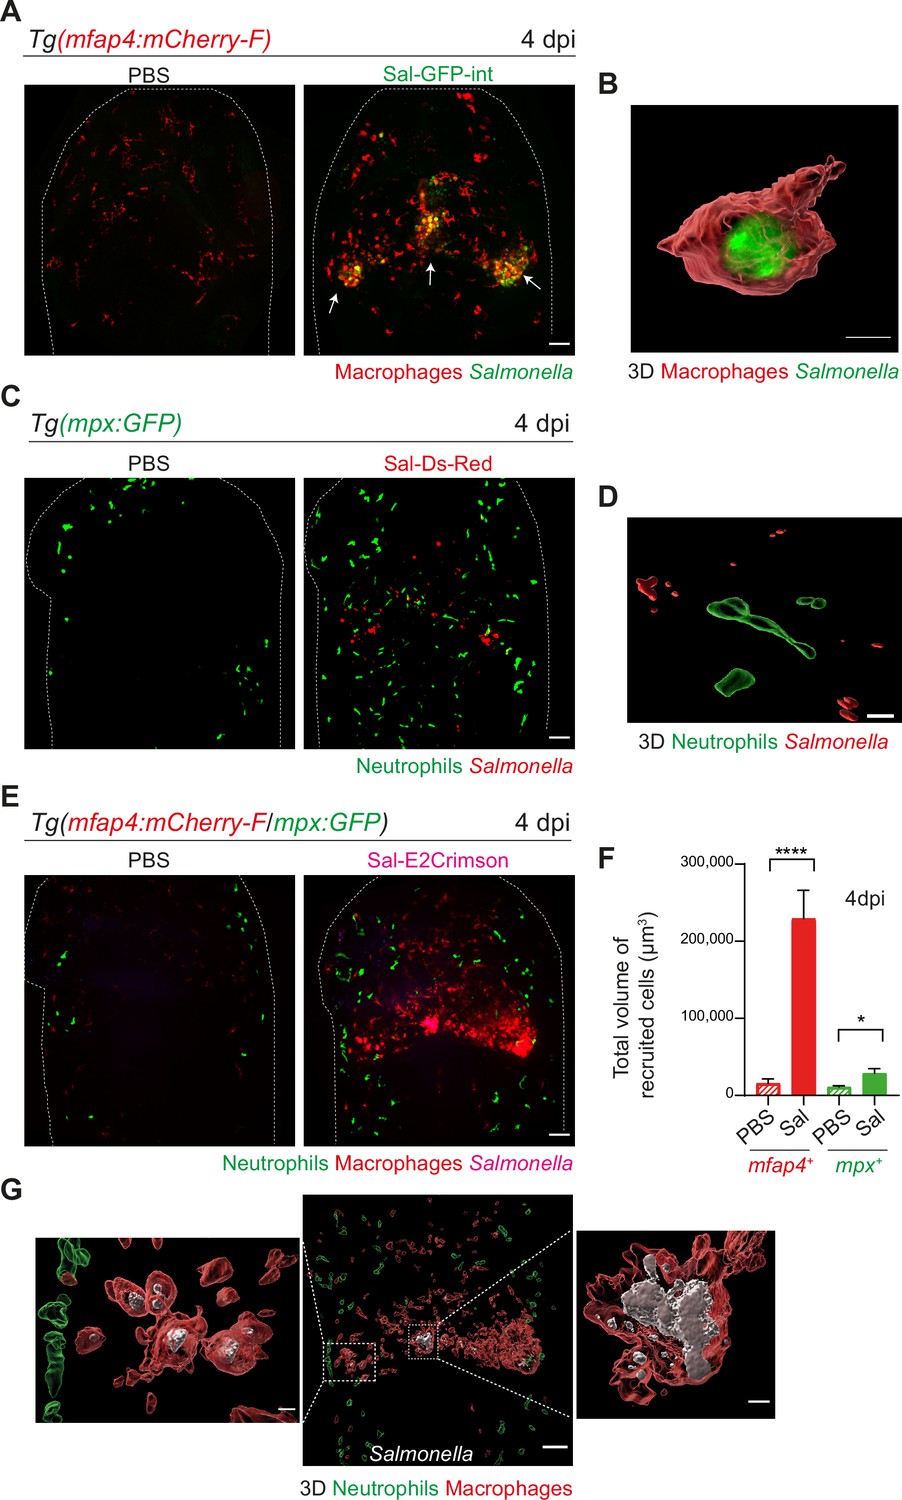
Salmonella hindbrain ventricle (HBV) infection induces hyper-accumulation of macrophages harboring persistent bacteria at late time point of infection.
(A) Tg(mfap4:mCherry-F) larvae were injected with either PBS or Sal-GFP-int in HBV. Representative maximum projections of fluorescent confocal images, showing accumulation of macrophages (red) that co-localize with persistent Salmonella (green) at 4 dpi. Scale bar: 50 μm. (B) 3D reconstruction of persistent Salmonella residing inside a macrophage at 4 dpi. Scale bar: 5 μm. (C) Tg(mpx:GFP) larvae injected with either PBS or Sal-DsRed in HBV. Representative maximum projections of fluorescent confocal images showing that Salmonella (red) do not co-localize with neutrophils (green) at 4 dpi. Scale bar: 50 μm. (D) 3D reconstruction of neutrophils and persistent Salmonella at 4 dpi. Scale bar: 30 μm. (E–G) Tg(mfap4:mCherry-F/mpx:GFP) larvae were injected with either PBS or Sal-E2Crimson in HBV. (E) Representative maximum projections of fluorescent confocal images showing macrophage clusters (red), persistent Salmonella (magenta) and neutrophils (green) at 4 dpi. Scale bar: 50 μm. (F) Quantification of the total volume of recruited cells (mfap4+ or mpx+ cells) at 4 dpi. Data of three replicates pooled (mean volume/larva ± SEM, nSal = 20, nPBS = 8, Mann–Whitney test, two-tailed, *p < 0.05, ****p < 0.0001). (G) 3D reconstruction of the HBV (middle panel) showing macrophage clusters (red) in which Salmonella (gray) persist, surrounded by neutrophils (green) at 4 dpi. Right and left panels are zooms of regions boxed by dotted lines. Scale bar: 30 μm. Scale bar zooms: 10 μm.
Figure 5
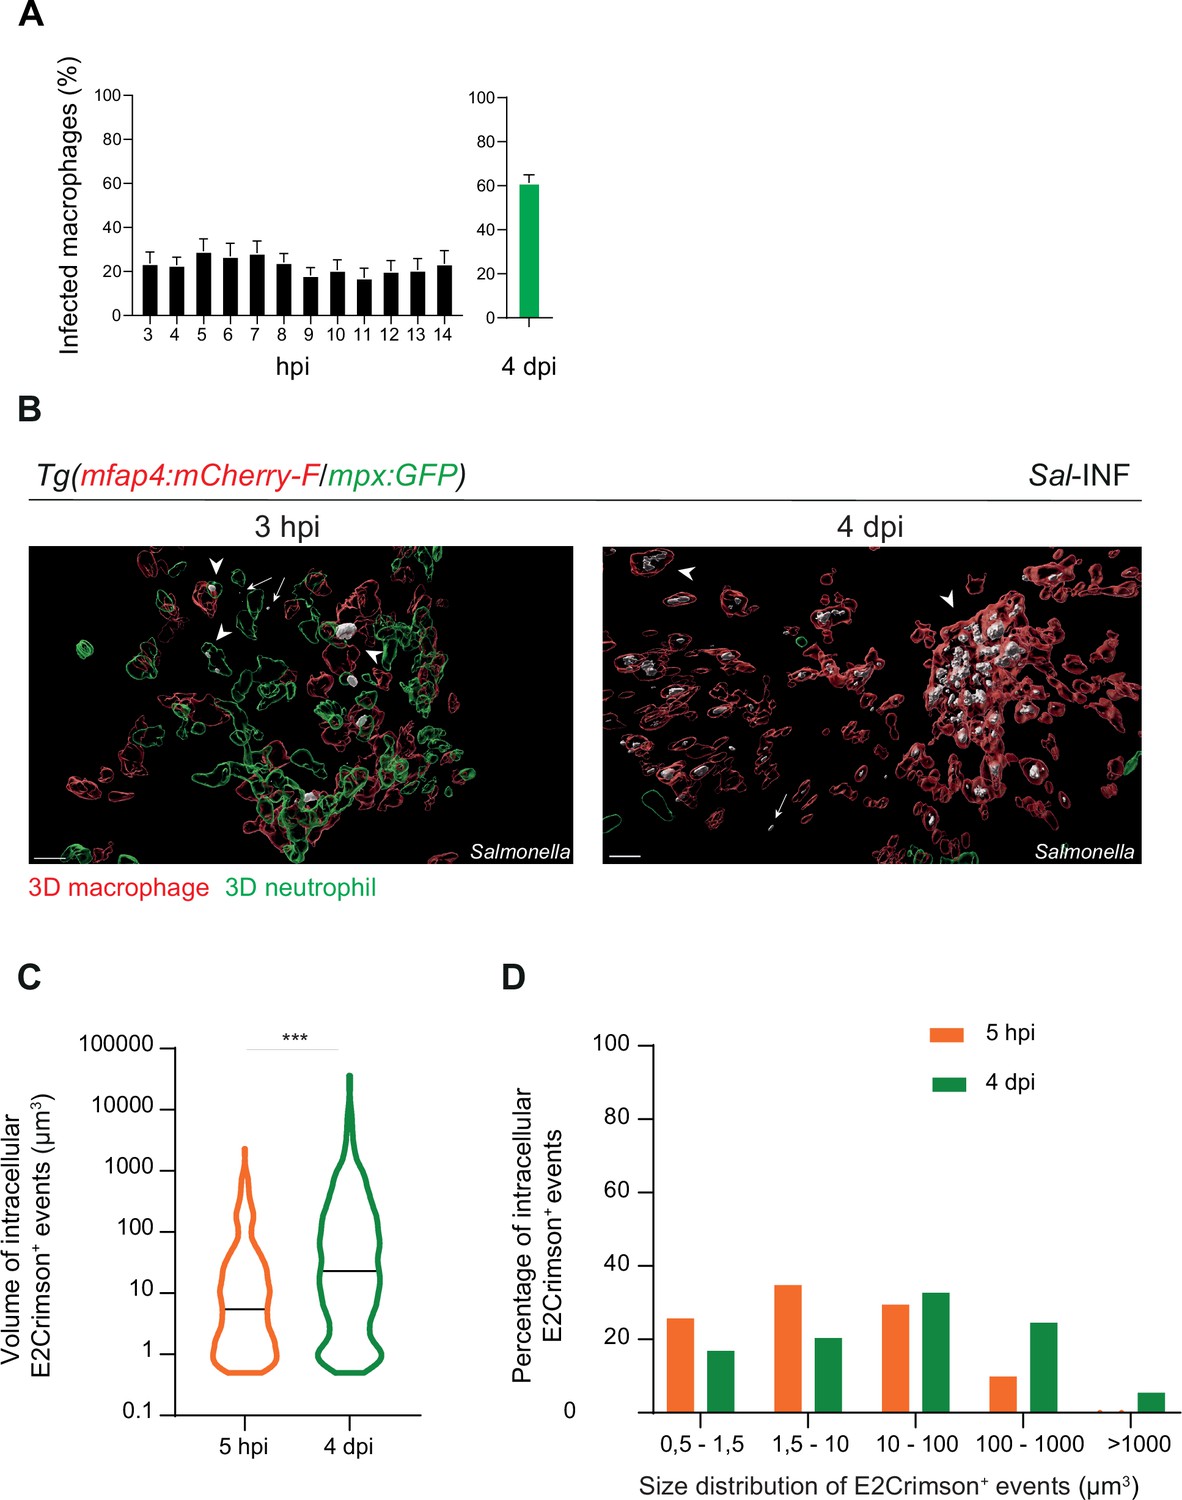
Salmonella persistence leads to a higher proportion of macrophages containing bacteria.
Tg(mfap4:mCherry-F/tnfa:GFP-F) and Tg(mfap4:mCherry-F/mpx:GFP) larvae were injected with PBS or Sal-E2Crimson in HBV. (A) Quantification of the percentage of infected macrophages in Sal-infected larvae at indicated time post-infection. Data of three replicates pooled (mean percentage/larva ± SEM, n3–14 hpi = 15 embryos and n4 dpi = 43 embryos). (B) 3D reconstruction confirming the intramacrophagic and intraneutrophilic localization of a bacterial aggregate at 3 hpi and 4 dpi. Scale bar: 20 μm. (C) Size of intracellular E2Crimson+ events (in μm3), quantified following 3D reconstruction. Median volume, n5 hpi = 506, n4 dpi = 990, Mann–Whitney test, two-tailed, ***p < 0.001. (D) Size repartition of E2Crimson+ events (10 embryos were imaged at each time point).
Figure 6 with 1 supplement
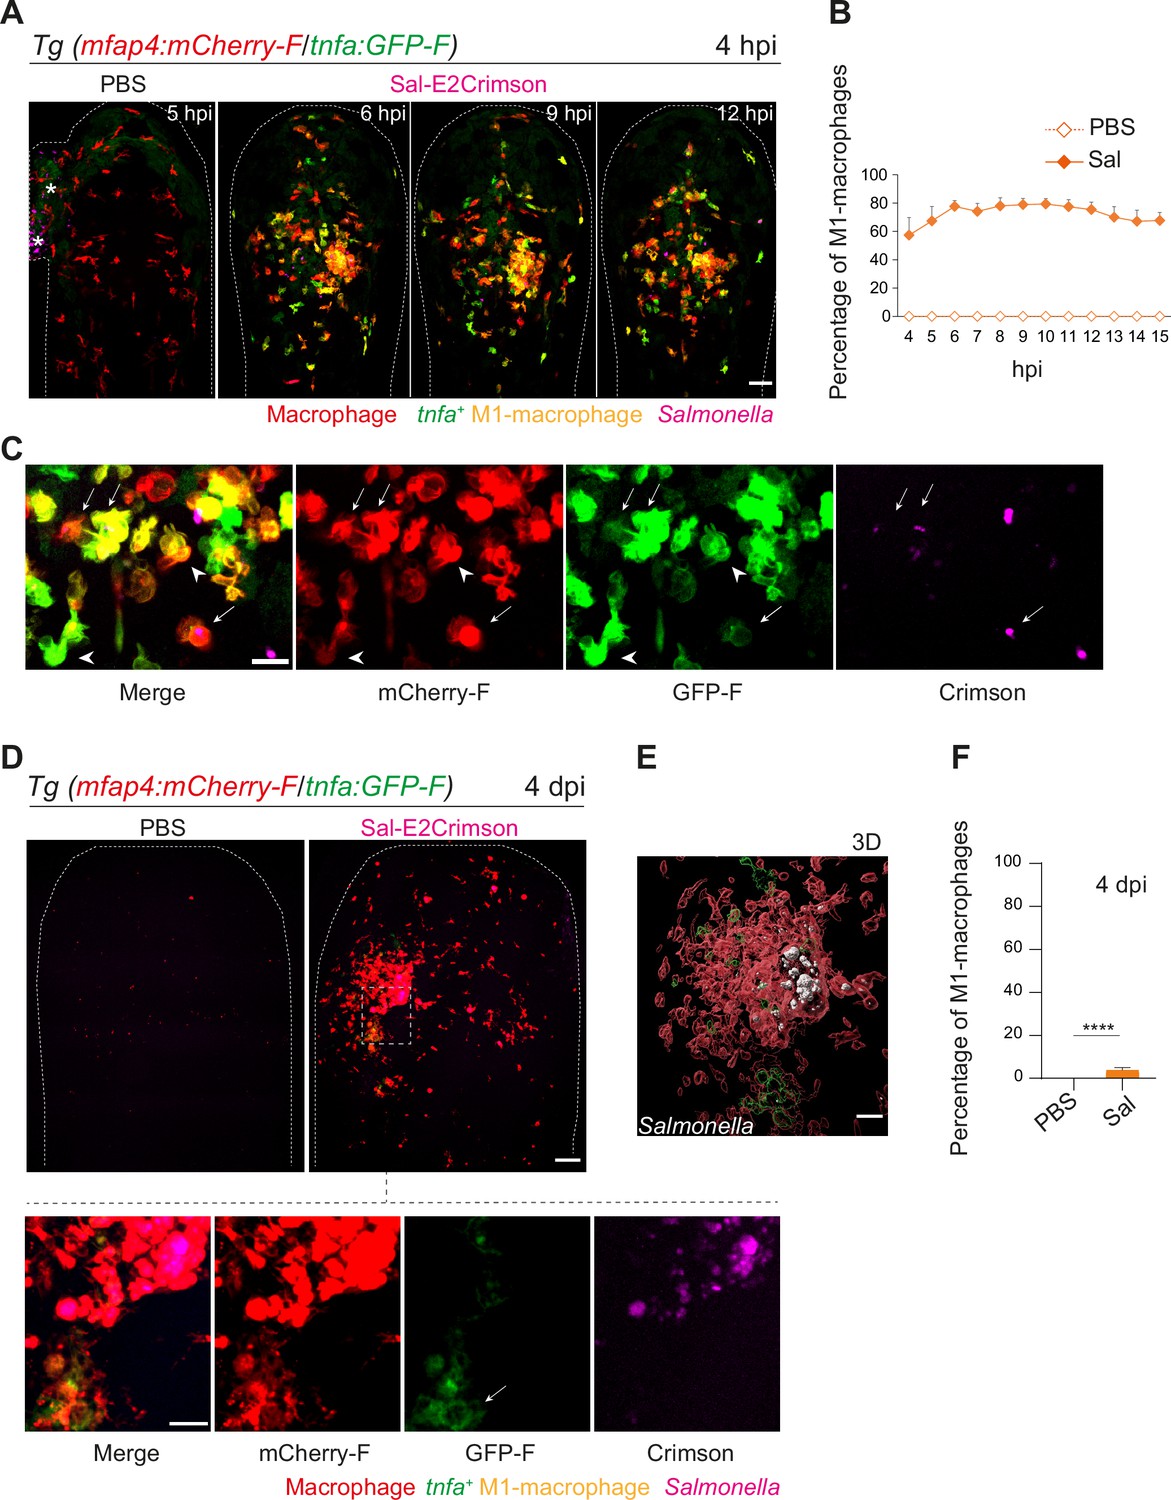
Macrophages polarize toward a pro-inflammatory M1-like phenotype upon Salmonella infection at early stage but not at late stage.
(A–F) Tg(mfap4:mCherry-F/tnfa:GFP-F) larvae were injected with PBS or Sal-E2Crimson in HBV. (A) Representative maximum projections of fluorescent confocal images extracted from a 4D sequence, showing recruitment of macrophages (mfap4+ cells, red) and M1-like activation (mfap4+-tnfa+ cells, yellow) to Salmonella (magenta) from 4 to 15 hpi. Asterisk: auto-fluorescence. Scale bar: 50 μm. (B) Quantification of the percentage of M1 macrophages at indicated time post-infection. Data of two replicates pooled (mean percentage/larva ± SEM, n = 12 per condition). (C) Zoom of fluorescent confocal images in A. Scale bar: 20 μm, arrow: infected tnfa+ macrophages and arrowhead tnfa+ bystander macrophages. (D) Representative maximum projections of fluorescent confocal images of PBS-injected and Sal-E2Crimson-infected larvae at 4 dpi (upper panels). Scale bar: 50 μm. Zooms of regions boxed by dotted lines (bottom panels). Scale bar zoom: 10 μm. (E) 3D reconstruction of macrophage clusters (red) containing persistent Salmonella (gray), surrounded by few tnfa+ macrophages (green) at 4 dpi. Scale bar: 10 μm. (F) Quantification of the percentage of M1 macrophages at 4 dpi. Data of four replicates pooled (mean percentage/larva ± SEM, 4 dpi, nSal = 23 larvae, nPBS = 20, one sample Wilcoxon test, ****p < 0.0001).
Figure 6—figure supplement 1
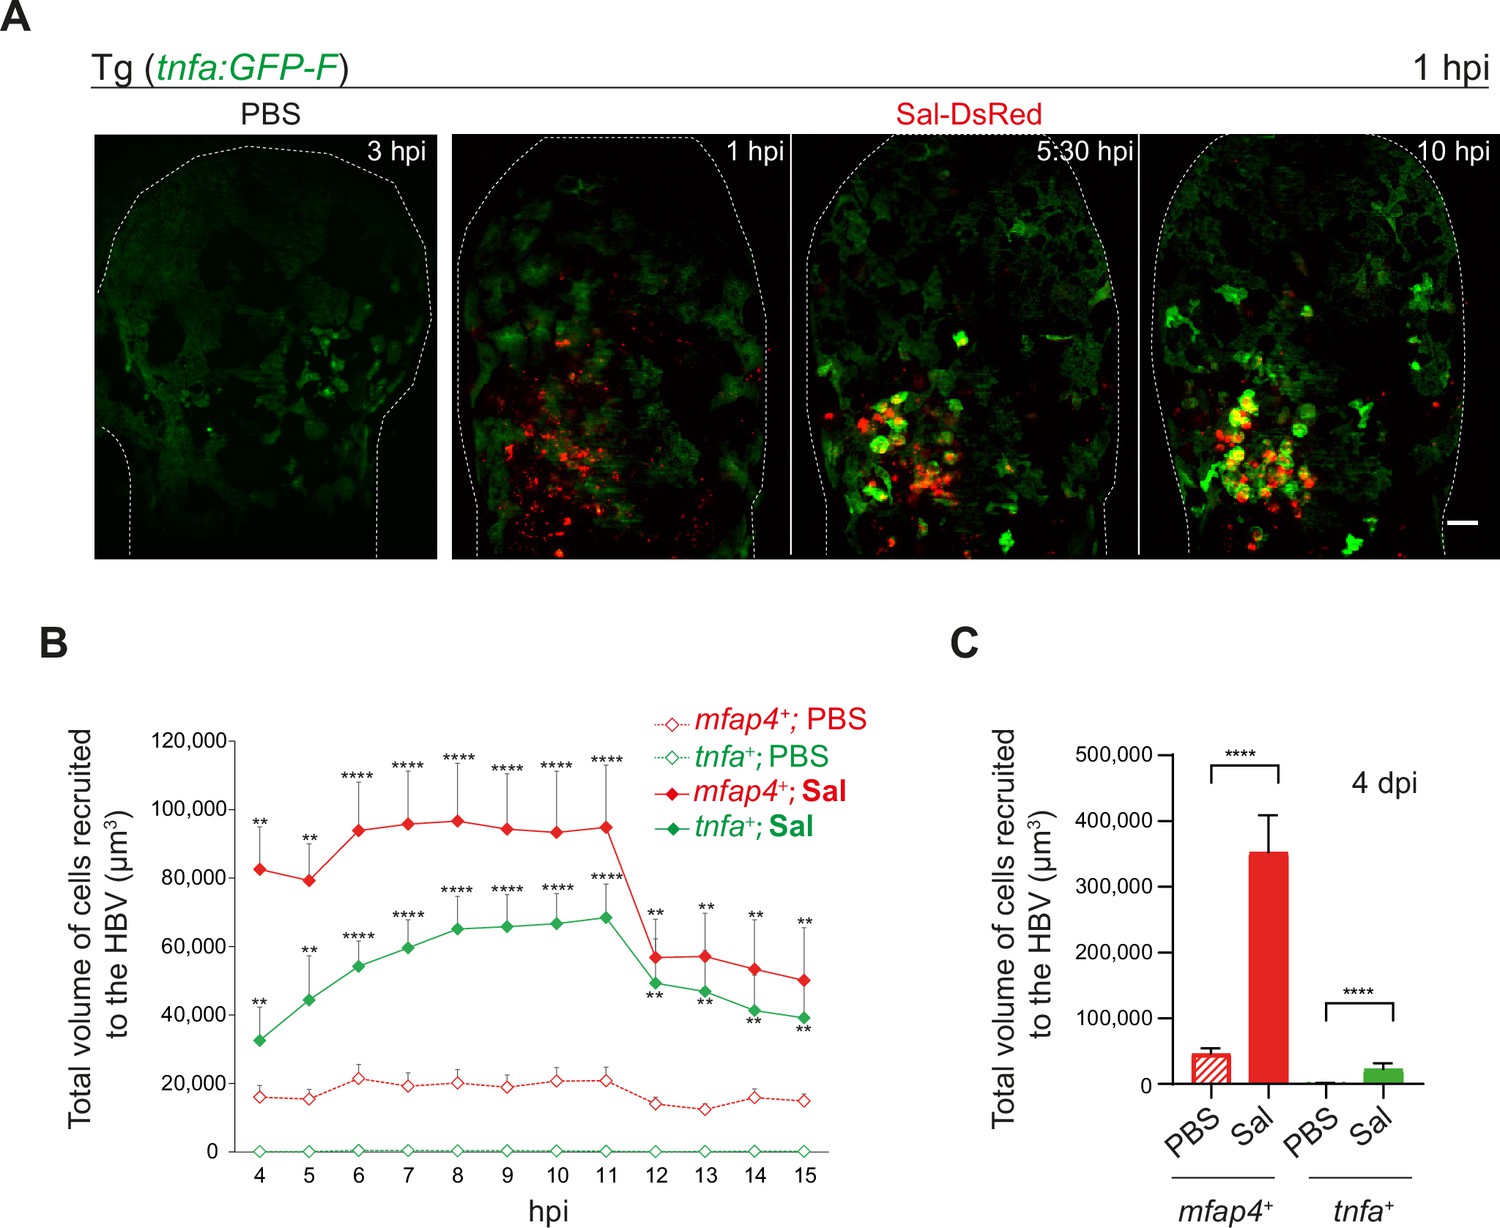
Salmonella early infection induces a strong activation of tumor necrosis factor (TNF)-expressing cells.
(A) Tg(tnfa:GFP-F) larvae were injected with PBS (left panel) or Sal-DsRed (right panels) in the HBV. Representative maximum projections from video sequences using light sheet fluorescence microscopy starting at 1 hpi during 10 hr, showing recruitment of tnfa+ cells (green) to the infection site (Salmonella, red). Scale bar: 30 μm. (B) Tg(mfap4:mCherry-F/tnfa:GFP-F) larvae were injected with PBS or Sal-E2Crimson in HBV and 4D acquisition was performed using confocal microscopy from 4 to 15 hpi. Quantification of the total volume of recruited cells, mfap4+ or tnfa+ cells, from 4 to 15 hpi. Data of two replicates pooled (mean volume/larva ± SEM, n = 12 per condition, Mann–Whitney test, two-tailed, ****p < 0.0001, **p < 0.01). (C) Tg(mfap4:mCherry-F/tnfa:GFP-F) larvae were injected with PBS or Sal-E2Crimson in HBV and imaged at 4 dpi using confocal microscopy. Quantification of the total volume of recruited cells, mfap4+ or tnfa+ cells, is shown at 4 dpi. Data of four replicates pooled (mean volume/larva ± SEM, nSal = 23, nPBS = 20, Mann–Whitney test, two-tailed, ****p < 0.0001).
Figure 7 with 4 supplements
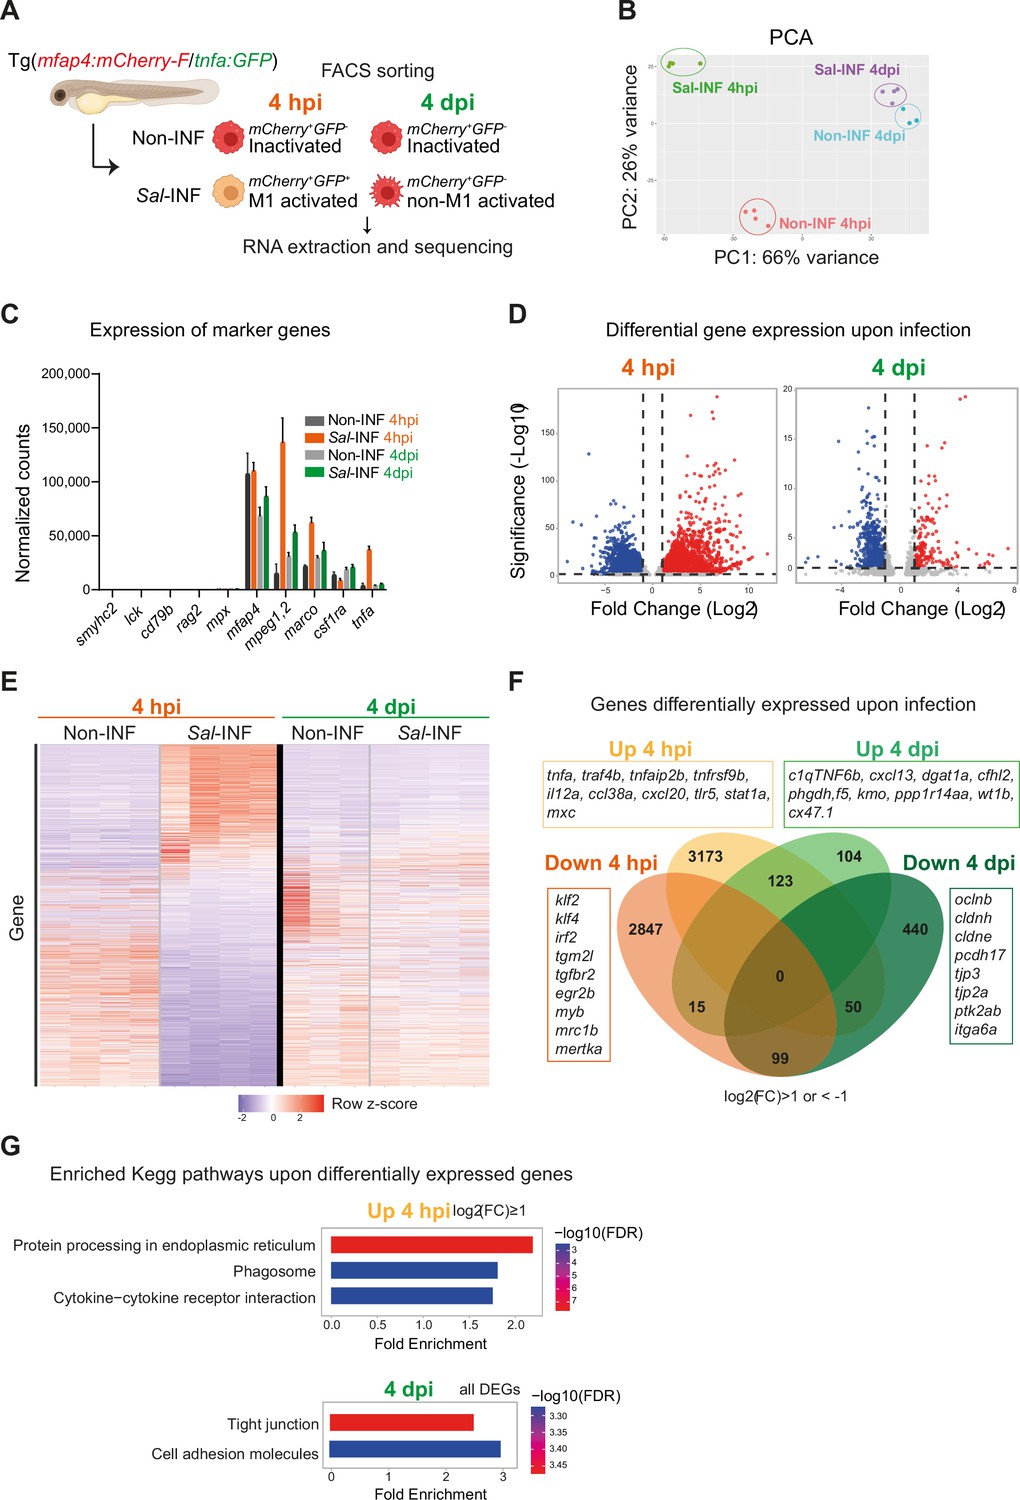
RNAseq analysis reveals macrophage transcriptome switch during Salmonella infection.
(A) Schematic diagram of macrophage RNA-sequencing experimental design. Tg(mfap4:mCherry-F/tnfa:GFP-F) larvae were either infected with Salmonella (Sal-INF) or non-infected (Non-INF). Fluorescence-Activated Cell Sorting (FACS) was used to isolate mfap4+-tnfa− cells (mCherry+ GFP−) and mfap4+-tnfa+ cells (mCherry+ GFP+) at 4 hpi and 4 dpi. (B) Principal component analysis (PCA) score plot of mfap4+-tnfa− cells in Non-INF condition (n = 4) and mfap4+-tnfa+ cells in Sal-INF condition (n = 4) at 4 hpi and of mfap4+-tnfa− cells in Non-INF condition (n = 3) and mfap4+-tnfa− cells in Sal-INF condition (n = 4) at 4 dpi. (C) Normalized expression of several marker genes of muscle cells, lymphocytes, neutrophils, and macrophages in the different sorted macrophage populations. (D) Volcano plot showing differentially expressed genes (DEGs) between Non-INF and Sal-INF conditions at 4 hpi and 4 dpi. Adjusted p value (p-adj) <0.05 was used as the threshold to judge the significance of the difference in gene expression. Red plots: up-regulated genes; blue plots: down-regulated genes; gray plots: unchanged genes. (E) Heatmap of DEGs between macrophage populations across infection (p-adj <0.05|Log2(FC) ≥1). Selected top DEGs from each population are shown. Color coding, decreased expression: blue, no expression: white, high expression: red. (F) Venn diagram showing unique and intersecting up- or down-regulated genes (indicated as Up and Down, respectively) upon infection from macrophage transcriptome at 4 hpi and 4 dpi. The numbers of up- and down-regulated genes are indicated in bold in each unique and overlapping sector of the Venn diagram. The most noteworthy genes of each unique sector of the Venn diagram are indicated (p-adj <0.05|(Log2(FC) ≥1 or ≤1)). (G) Chart representation of Kyoto Encyclopedia of Genes and Genomes (KEGG) pathways enriched in up-regulated genes (p-adj <0.05|Log2(FC) ≥1) at 4 hpi (upper panel) and all DEGs at 4 dpi (lower panel) (p-adj <0.05). Graph shows the fold enrichment, red color: lowest enrichment false discovery rate (FDR) and blue color: highest enrichment FDR.
-
Figure 7—source data 1
List of all the differentially expressed genes upon Salmonella infection and analysis.
This excel file contains analyzed data from sequencing experiments shown in Figure 7: (1) List of all the differentially expressed genes upon Salmonella infection at 4 hpi (p-adj <0.05). (2) List of all the differentially expressed genes upon Salmonella infection at 4 dpi (p-adj <0.05). (3) Lists of either unique and intersecting up-regulated (Up) or down-regulated (Down) genes upon Salmonella infection at 4 hpi and 4 dpi (p-adj <0.05|(Log2(FC) ≥1 or ≤1)). (4) List of enriched KEGG pathways upon up-regulated genes at 4 hpi (p-adj <0.05|(Log2(FC) ≥1)). (5) List of enriched KEGG pathways upon all differentially expressed genes at 4 dpi (p-adj <0.05). (6) List of enriched GOterms upon up-regulated genes at 4 hpi (p-adj <0.05|(Log2(FC) ≥1)). (7) List of enriched GOterms upon up-regulated genes at 4 dpi (p-adj <0.05|(Log2(FC) ≥0.1)).
- https://cdn.elifesciences.org/articles/89828/elife-89828-fig7-data1-v2.xlsx
-
Figure 7—source data 2
List of selected differentially expressed genes upon Salmonella infection.
This excel file contains a list of selected differentially expressed genes upon Salmonella infection shown in Figure 7 (p-adj <0.05) with gene name, gene description, gene ID, Log2(FC) at 4 hpi, Log2(FC) at 4 dpi, the main function and relevant reference.
- https://cdn.elifesciences.org/articles/89828/elife-89828-fig7-data2-v2.xlsx
Figure 7—figure supplement 1

mfap4 mRNA expression in mCherry-F+ or mCherry-F− sorted cells.
RT-qPCR analysis of mfap4 mRNA expression. RNA samples were extracted from mCherry-F+ or mCherry-F− FACS-sorted cells from whole Tg(mfap4:mCherry-F) larvae at 3 dpf. Data are presented as relative mfap4/ef1a expression in mCherry-F− or mCherry-F+ cells. Individual values, five replicates per condition. Per replicate, 300 larvae were used (Mann–Whitney test, two-tailed **p < 0.01).
Figure 7—figure supplement 2
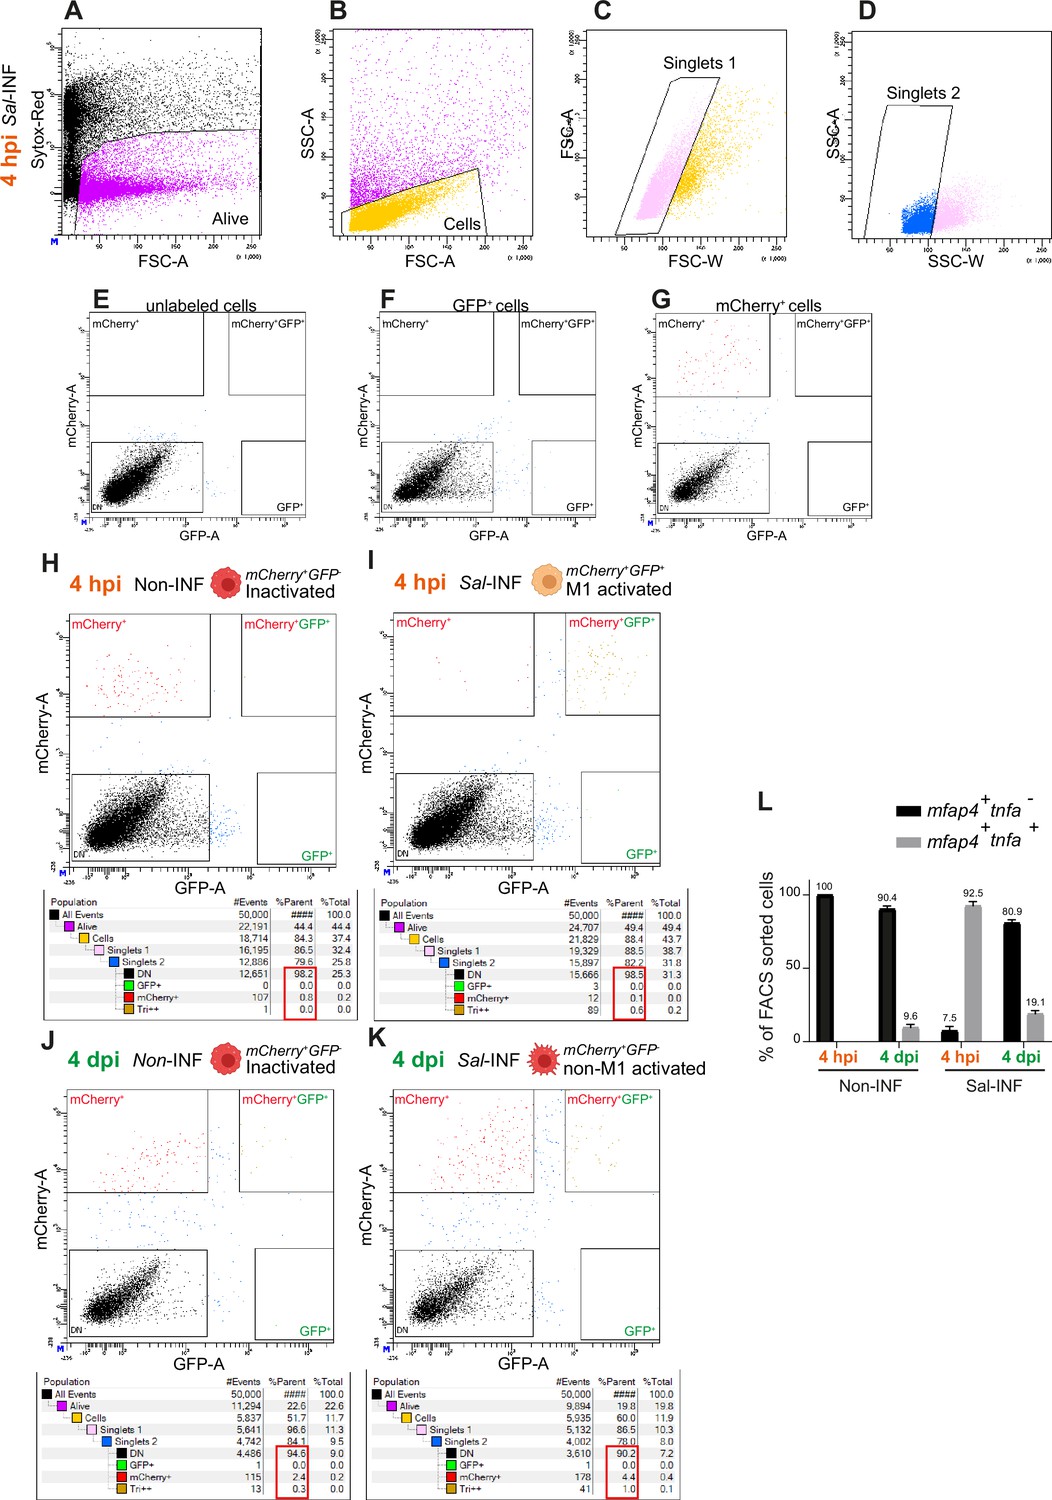
Macrophage populations were sorted by Fluorescence-Activated Cell Sorting (FACS) before transcriptomic analysis.
(A–L) Tg(mfap4:mCherry-F/tnfa:GFP-F) larvae were either infected with Salmonella (Sal-INF) or non-infected (Non-INF). (A–D) Gating strategy to isolate mfap4+-tnfa+ cell (M1-activated) populations at 4 hpi from whole Tg(mfap4:mCherry-F/tnfa:GFP) Sal-infected larvae using light-scattering characteristics. Representative dot plots showing gating strategy for first isolating live cells based on Sytox-Red staining (A, B) and then isolate singlet cells (C, D). Cells from WT (Unlabeled) (E), Tg(tnfa:GFP) GFP+ cells (F), and Tg(mfap4:mCherry-F) (mCherry+) (G) were used for gating. To increase the purity of the sorted populations, the gates have been designed so that they do not overlap. (H–K) Representative dot plots showing gating strategy to isolate mfap4+-tnfa− (Inactivated or Non-M1-activated) macrophage populations at 4 hpi (H) and at 4 dpi (J–K) and to isolate mfap4+-tnfa+ (M1-activated) macrophage populations at 4 hpi (I). Gating strategy tables with numbers of cells per gate (#Events), the percentage of cells in the parental gate (%Parent) and in relation to the total percentage of cells (%Total). (L) FACS sorting was used to isolate mfap4+-tnfa− cells (inactivated or non-M1 activated) and mfap4+-tnfa+ cells (M1 activated) at 4 hpi and 4 dpi. Percentage of macrophage populations sorted by FACS. Data of four replicates per condition pooled (except for the Non-INF condition at 4 dpi where only three replicates were used (mean % of cells± SEM)). Forward SCatter-Area (FSC-A); Side SCatter-Area (SSC-A); Forward SCatter-Width (FSC-W).
Figure 7—figure supplement 3
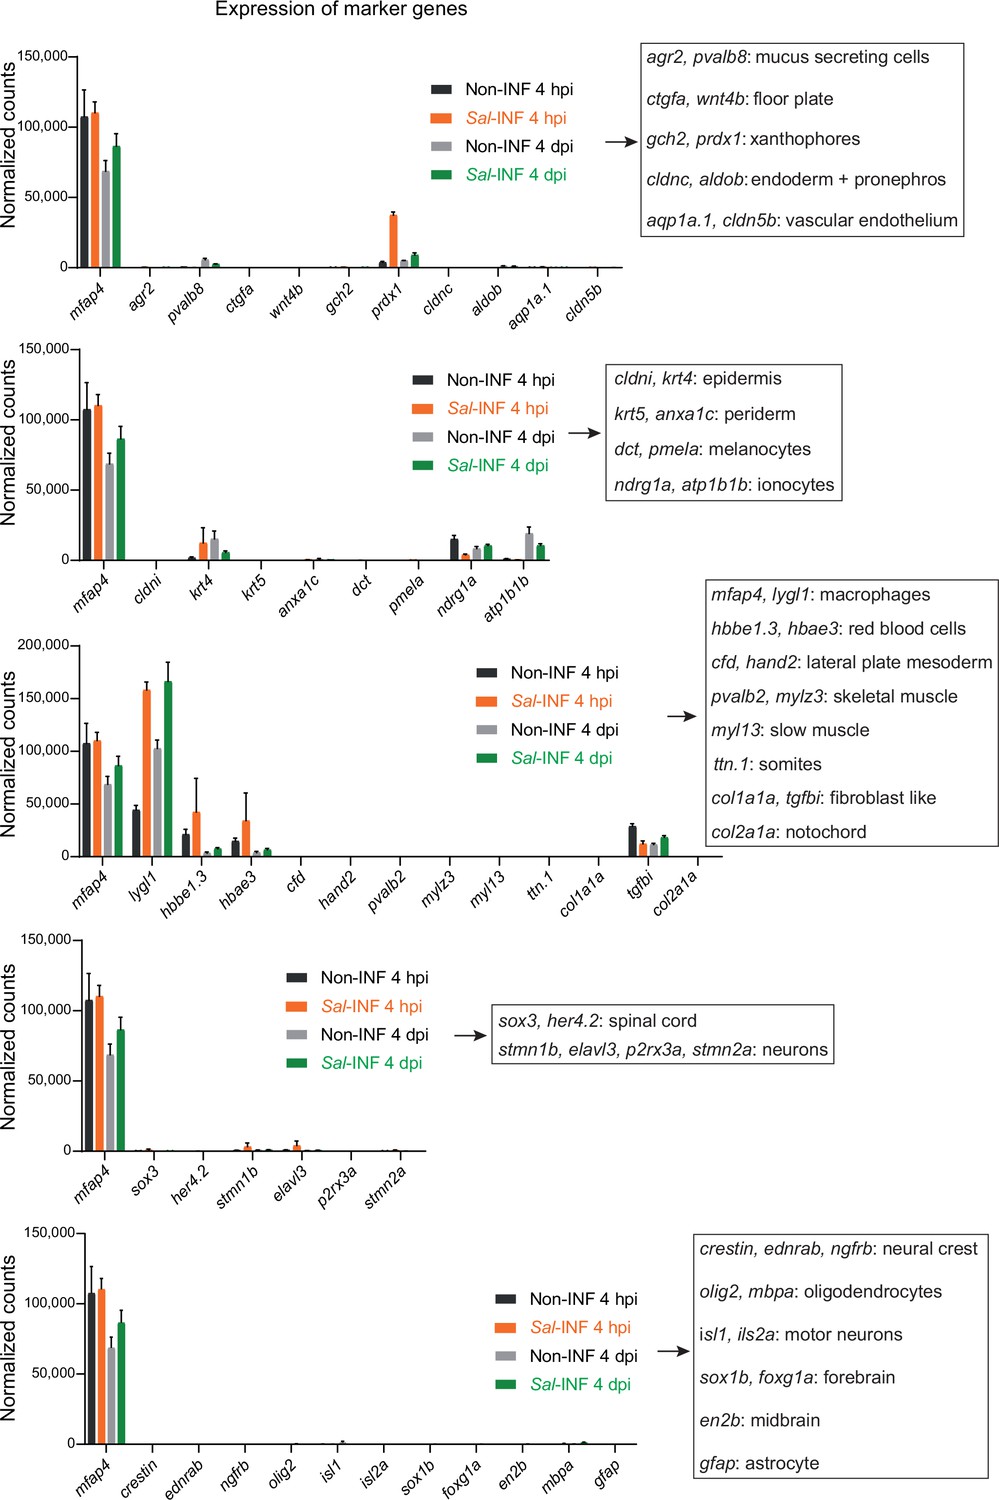
Normalized expression of marker genes confirms the purity of sorted macrophage populations.
Tg(mfap4:mCherry-F/tnfa:GFP-F) larvae were either infected with Salmonella (Sal-INF) or non-infected (Non-INF) before doing RNA sequencing and Fluorescence-Activated Cell Sorting (FACS) was used to isolate different macrophage populations at 4 hpi and 4 dpi, as described in Figure 6A. Normalized expression of marker genes of various cell types in the different sorted macrophage populations (mean counts ± SEM).
Figure 7—figure supplement 4

RNAseq analysis shows dynamic transcriptional profiles of macrophages upon Salmonella infection.
Tg(mfap4:mCherry-F/tnfa:GFP-F) larvae were either infected with Salmonella (Sal-INF) or non-infected (Non-INF) before doing RNA sequencing, as described in Figure 7A. (A) Venn diagram showing intersecting up- or down-regulated genes (indicated as Up and Down, respectively) upon infection from macrophage transcriptomes at 4 hpi and 4 dpi. The numbers of up- and down-regulated genes are indicated in bold in each unique and overlapping sector of the Venn diagram. The most noteworthy genes of each overlapping sector of the Venn diagram are indicated (p-adj <0.05|(log2(FC) ≥ or ≤1)). (B) Chart representation of enriched GO terms in up-regulated genes upon infection at 4 hpi (p-adj <0.05|log2(FC) ≥1). (C) Chart representation of enriched GO terms in up-regulated genes upon infection at 4 dpi (p-adj <0.05|(log2(FC) ≥0.1)). Graph shows the fold enrichment, red color: lowest enrichment false discovery rate (FDR) and blue color: highest enrichment FDR.
Figure 8
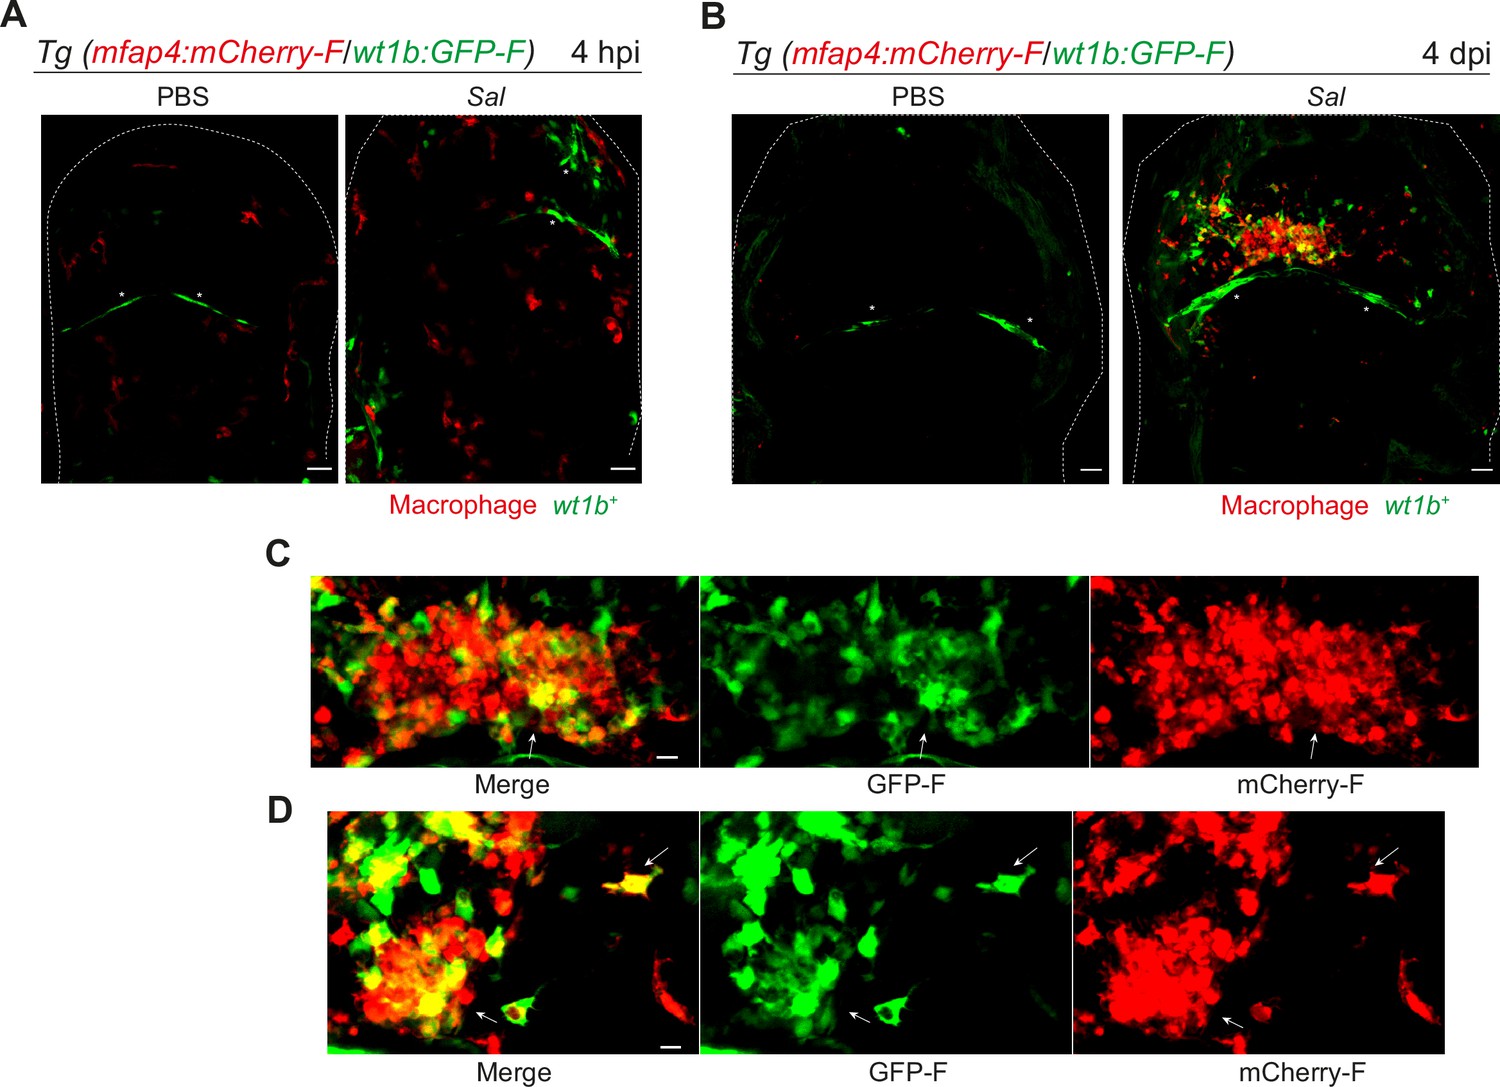
Salmonella persistence induces large clusters of pro-regenerative wt1b-expressing macrophages.
(A–D) Tg(mfap4:mCherry-F/wt1b:GFP-F) larvae were injected with PBS or Sal-E2Crimson in the HBV. (A) Representative maximum projections of fluorescent confocal images showing macrophages (mfap4+ cells, red) and wt1b-expressing cells (wt1b+ cells, green) after Salmonella infection at (A) 4 hpi and at (B) 4 dpi. Asterisk: auto-fluorescence. Scale bar: 30 μm. Big clusters of wt1b-expressing macrophages (mfap4+-wt1b+ cells, yellow) were observed at 4 dpi. (C, D) Zoom of two representative fluorescent confocal images showing large clusters of wt1b-expressing macrophages (mfap4+-wt1b+ cells, yellow) at 4 dpi. Scale bar: 10 μm, arrow: mfap4+-wt1b+ macrophage.
Figure 9 with 1 supplement
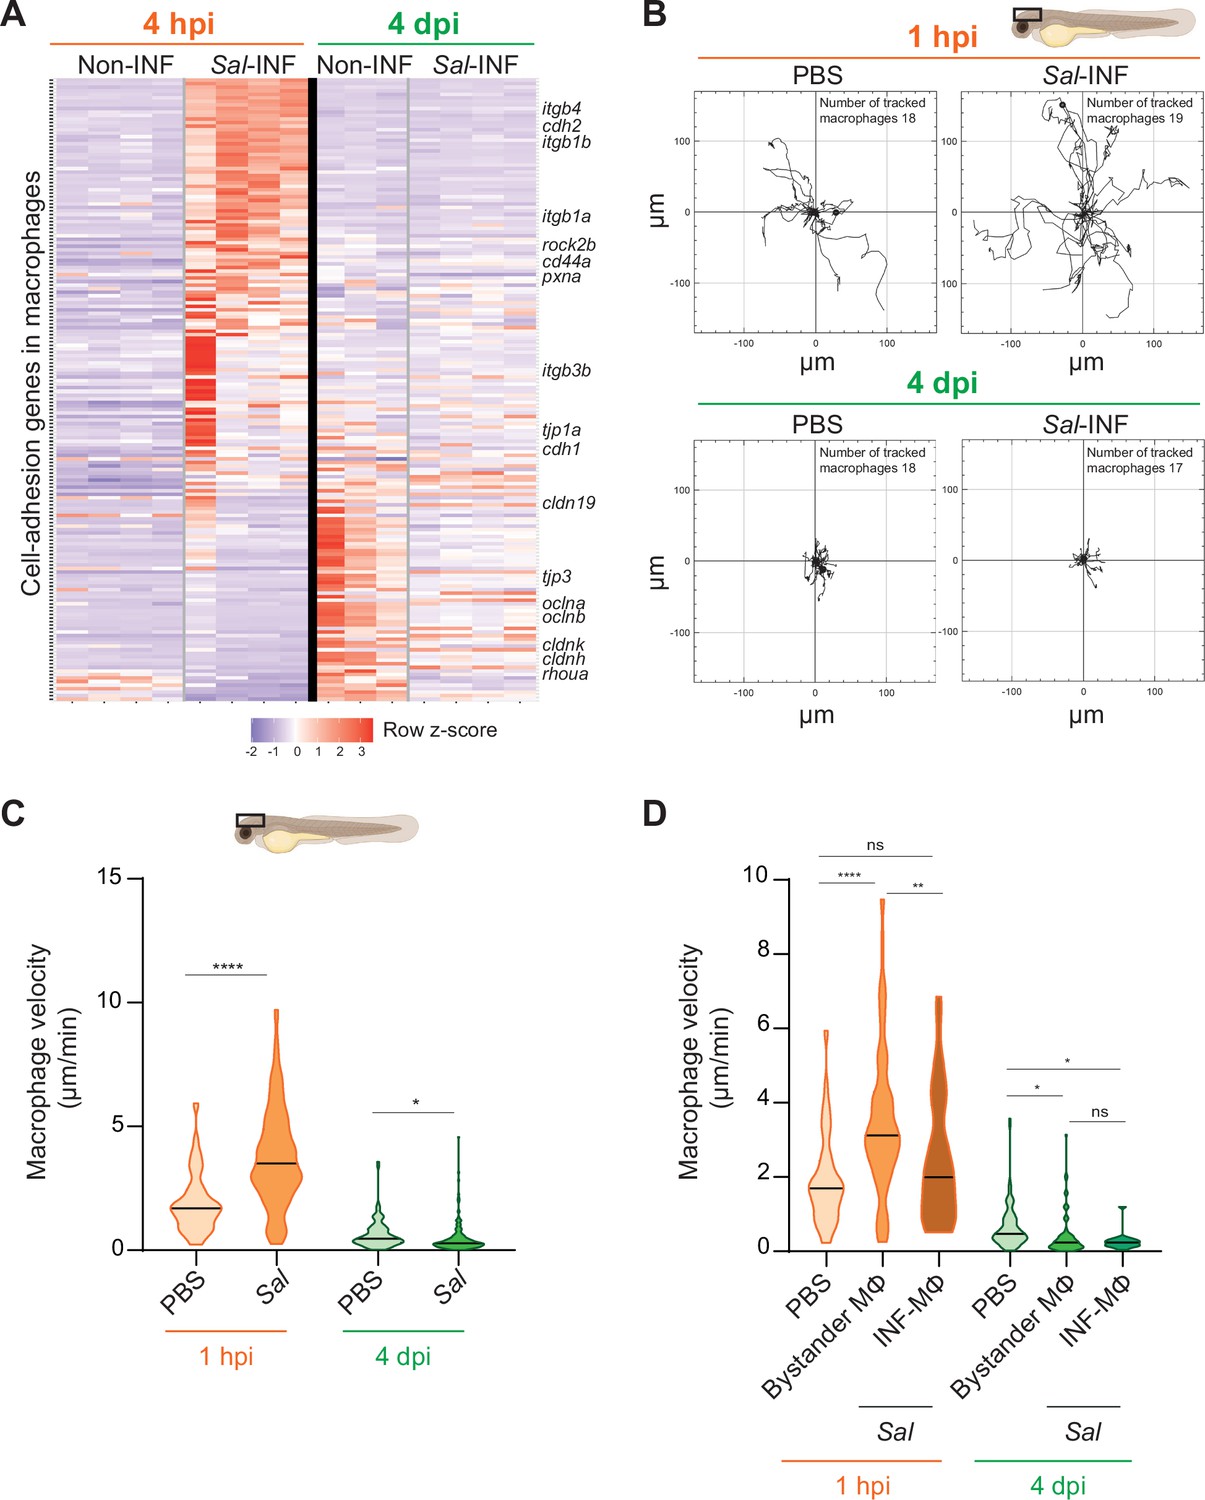
Salmonella persistence induces drastic changes in cell adhesion-related gene expression and motility in macrophages.
(A) Heatmap of differentially expressed genes (DEGs) involved in cell adhesion, between macrophage populations across infection (p-adj <0.05). Selected DEGs from each population are indicated. Color coding, decreased expression: blue, no expression: white, high expression: red. (B–D) Tg(mfap4:mCherry-F) larvae were injected with PBS or Sal-E2Crimson in HBV and time-lapse videos of labeled macrophages were acquired during 2 hr at 1 hpi or 4 dpi. (B) Migration of macrophages in response to PBS or Sal-E2Crimson at 1 hpi or 4 dpi. Representative trajectory plots of individual macrophage movement tracks are shown, with the initial position in the center of the graph. Number of macrophage tracks are indicated. (C) Quantification of the individual macrophage velocity from PBS-injected or Sal-infected larvae at 1 hpi and 4 dpi. Data of four replicates per time point pooled (mean velocity/macrophage ± SEM, at 1 hpi: nPBS = 76, nSal = 195; at 4 dpi: nPBS = 93, nSal = 162; t-test, two-tailed, significance of Sal versus PBS conditions, ****p < 0.0001, *p < 0.05). (D) Quantification of the individual bystander macrophage or infected macrophage velocity from PBS-injected or Sal-infected larvae at 1 hpi and 4 dpi. Data of two replicates per time point pooled (mean velocity/macrophage ± SEM, at 1 hpi: nPBS = 76, nbystander-MΦ = 92; ninfected-MΦ = 33; at 4 dpi: nPBS = 93, nbystander-MΦ = 67; ninfected-MΦ = 17; analysis of variance (ANOVA) Kuskal–Wallis’ test with Dunns’ post-test, ****p < 0.0001, **p < 0.01, *p < 0.05, ns: not significant).
Figure 9—figure supplement 1

Neutrophils remain motile during the establishment of Salmonella persistent infection.
(A, B) Tg(mpx:GFP) larvae were injected with PBS or Salmonella (Sal)-DsRed in HBV and time-lapse videos of labeled neutrophils were acquired during 1.5 hr every 1 min 30 s at 1 hpi or 4 dpi. (A) Quantification of the individual neutrophil velocity from PBS-injected or Sal-infected larvae at 1 hpi and 4 dpi. One replicate used for 1 hpi and data of two replicates pooled for 4 dpi (mean velocity/neutrophil ± SEM, at 1 hpi: nPBS = 22, nSal = 44; at 4 dpi: nPBS = 26, nSal = 63; Mann–Whitney test, two-tailed, significance of Sal versus PBS conditions, ****p < 0.0001, ns: not significant). (B) Migration of neutrophils in response to PBS or Sal-DsRed at 1 hpi or 4 dpi. Representative trajectory plots of individual neutrophil movement tracks are shown, with the initial position in the center of the graph. Number of neutrophil tracks are indicated.
Figure 10
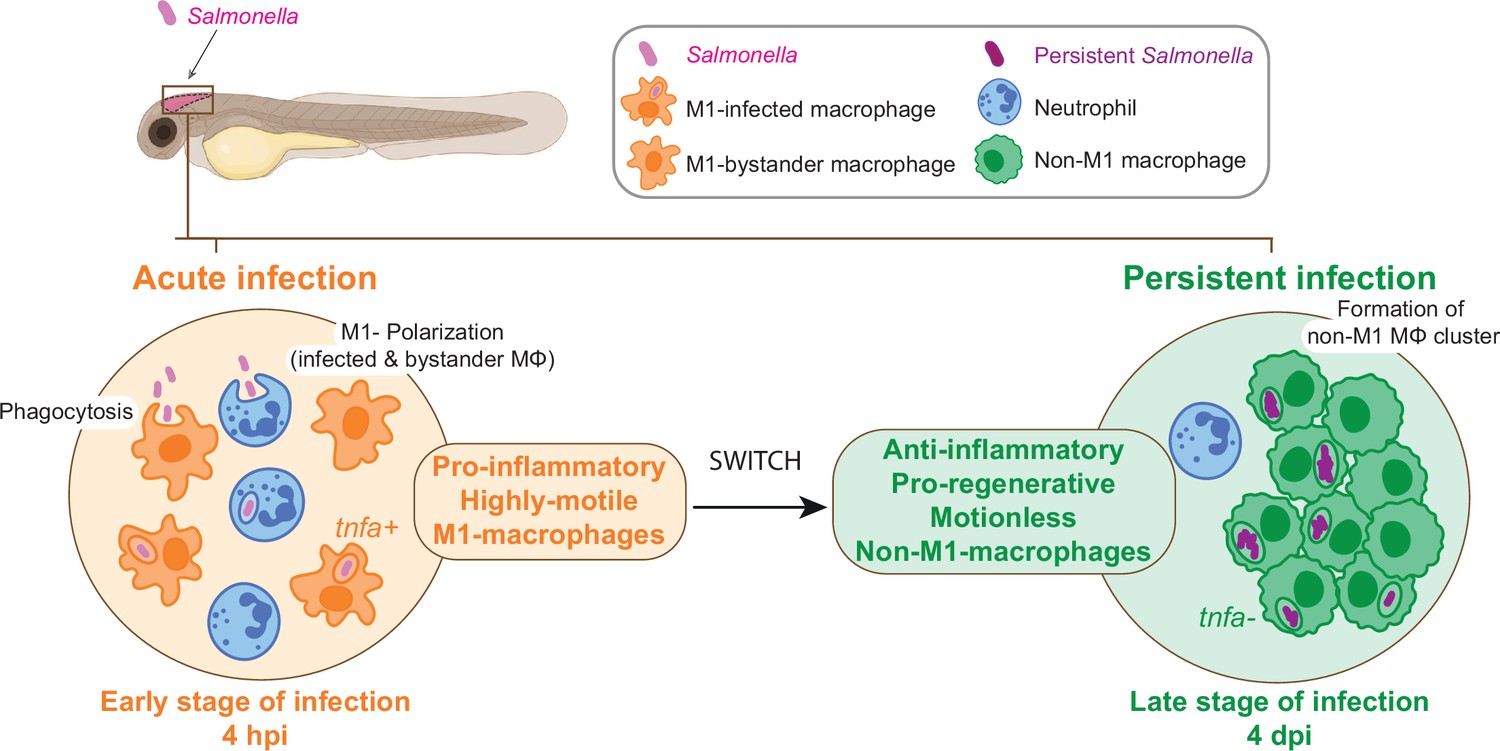
From acute to persistent Salmonella infection, macrophages switch their polarization states and motility.
Schematic representation of the two main phases of Salmonella hindbrain ventricle infection in zebrafish. The early phase corresponds to an acute infection characterized by the recruitment of leukocyte populations, phagocytosis of Salmonella and M1 polarization of highly motile macrophages (MΦ), while during the late-phase Salmonella persists inside motionless macrophages (MΦ) that display an anti-inflammatory and pro-regenerative status and form clusters.
Videos
Video 1
Salmonella early-infection induces a strong macrophage response.
Tg(mfap4:mCherry-F) larvae were infected with Sal-GFP in hindbrain ventricle. Time-lapse videos of labeled macrophages were acquired using light sheet microscopy at 35 min post-infection during 2 hr and image series were collected every 1 min. One representative movie (maximum projections) is presented, showing the recruitment of macrophages (mfap4+ cells, red) to the infection site (Salmonella, green). Time is indicated in the top left corner. Scale bar: 30 μm.
Video 2
Macrophages are able to phagocytose Salmonella during early stages of infection.
Tg(mfap4:mCherry-F) larvae were infected with Sal-GFP-int in hindbrain ventricle and imaged by confocal microscopy at 3 hpi. This movie is a 3D reconstruction animation created from representative fluorescent confocal images using Imaris software and shows a single macrophage (red) that have phagocytosed Salmonella (green) at 3 hpi. Scale bar: 5 μm.
Video 3
Salmonella early infection induces a strong neutrophil response.
Tg(mpx:GFP) larvae were injected with PBS or Sal-DsRed in hindbrain ventricle. Time-lapse videos of labeled neutrophils were acquired by confocal microscopy at 2 hpi during 13 hr and image series were collected every 3 min. Two representative movies (maximum projections) of PBS-injected larva (left panel) and Salmonella-infected larva (right panel) are presented, showing the recruitment of neutrophils (mpx+ cells, green) to the infection site (Salmonella, red). Time is indicated in the top left corner of each panel. Scale bar: 30 μm.
Video 4
Both macrophages and neutrophils are recruited early upon Salmonella infection.
Tg(mfap4:mCherry-F/mpx:GFP) larvae were injected with either PBS or Sal-E2Crimson in hindbrain ventricle. Time-lapse videos of labeled cells were acquired by confocal microscopy at 3 hpi during 12 hr and image series were collected every 1 hr. Two representative movies (maximum projections) of PBS-injected larva (left panel) and Salmonella-infected larva (right panel) are presented, showing recruitment of both neutrophils (green) and macrophages (red) to the infection site (Salmonella, magenta). Time is indicated in the top left corner of each panel. Scale bar: 30 μm.
Video 5
Salmonella late infection induces hyper-accumulation of macrophages harboring persistent bacteria.
Tg(mfap4:mCherry-F/mpx:GFP) larvae were injected with either PBS or Sal-E2Crimson in hindbrain ventricle and imaged by confocal microscopy at 4 dpi. This movie is a 3D reconstruction animation created from representative fluorescent confocal images using Imaris software and shows neutrophils (mpx+ cells, green) and a cluster of macrophages (mfap4+ cells, red) containing persistent Salmonella (white) at 4 dpi. Scale bar: 100 μm.
Video 6
Salmonella early infection induces a strong activation of tumor necrosis factor a (tnfa) -expressing cells.
Tg(tnfa:GFP-F) larvae were injected with PBS or Sal-DsRed in the HBV. Time-lapse videos of labeled cells were acquired using light sheet microscopy at 3 hpi during 8 hr and image series were collected every 5 min. Two representative movies (maximum projections) of PBS-injected larva (left panel) and Salmonella-infected larva (right panel) are presented, showing recruitment of tnfa+ cells (green) to the infection site (Salmonella, red). Time is indicated in the top left corner of each panel. Scale bar: 30 μm.
Video 7
Macrophages polarize toward a pro-inflammatory M1-like phenotype upon Salmonella early infection.
Tg(mfap4:mCherry-F/tnfa:GFP-F) larvae were injected with PBS or Sal-E2Crimson in the HBV. Time-lapse videos of labeled macrophages were acquired using confocal microscopy at 3 hpi during 12 hr and image series were collected every 1 hr. Two representative movies (maximum projections) of PBS-injected larva (left panel) and Salmonella-infected larva (right panel) are presented, showing recruitment of macrophages (mfap4+ cells, red) and M1-like activation (mfap4+-tnfa+ cells, yellow) to Salmonella (magenta). Time is indicated in the top left corner of each panel. Scale bar: 30 μm.
Video 8
Highly motile macrophages are recruited during Salmonella early infection.
Tg(mfap4:mCherry-F) larvae were injected with PBS or Sal-E2Crimson in HBV. Time-lapse videos of labeled macrophages were acquired by confocal microscopy during 2 hr at 1 hpi and image series were collected every 2 min. Two representative movies (maximum projections) of PBS-injected larva (left panel) and Salmonella-infected larva (right panel) are presented, showing in different colors individual macrophage trajectory tracks (mfap4+ cells, red). Time is indicated in the top left corner of each panel. Scale bar: 30 μm.
Video 9
The motility of macrophages is decreased Salmonella-injected larvae compared to PBS-injected larvae during persistent infection.
Tg(mfap4:mCherry-F) larvae were injected with PBS or Sal-E2Crimson in HBV. Time-lapse videos of labeled macrophages were acquired confocal microscopy during 2 hr at 4 dpi and image series were collected every 2 min. Two representative movies (maximum projections) of PBS-injected larva (left panel) and Salmonella-infected larva (right panel) are shown, showing in different colors individual macrophage trajectory tracks (mfap4+ cells, red). Time is indicated in the top left corner of each panel. Scale bar: 30 μm.
Additional files
Download links
A two-part list of links to download the article, or parts of the article, in various formats.
Downloads (link to download the article as PDF)
Open citations (links to open the citations from this article in various online reference manager services)
Cite this article (links to download the citations from this article in formats compatible with various reference manager tools)
Dynamics of macrophage polarization support Salmonella persistence in a whole living organism
eLife 13:e89828.
https://doi.org/10.7554/eLife.89828


