Identification of fallopian tube microbiota and its association with ovarian cancer
- Department of Obstetrics and Gynecology, United States
- Stanford Maternal & Child Health Research Institute, Stanford University School of Medicine, United States
- Vaccine and Infectious Disease Division, Fred Hutchinson Cancer Center, United States
- Department of Obstetrics and Gynecology, University of Washington, United States
Figures
Figure 1
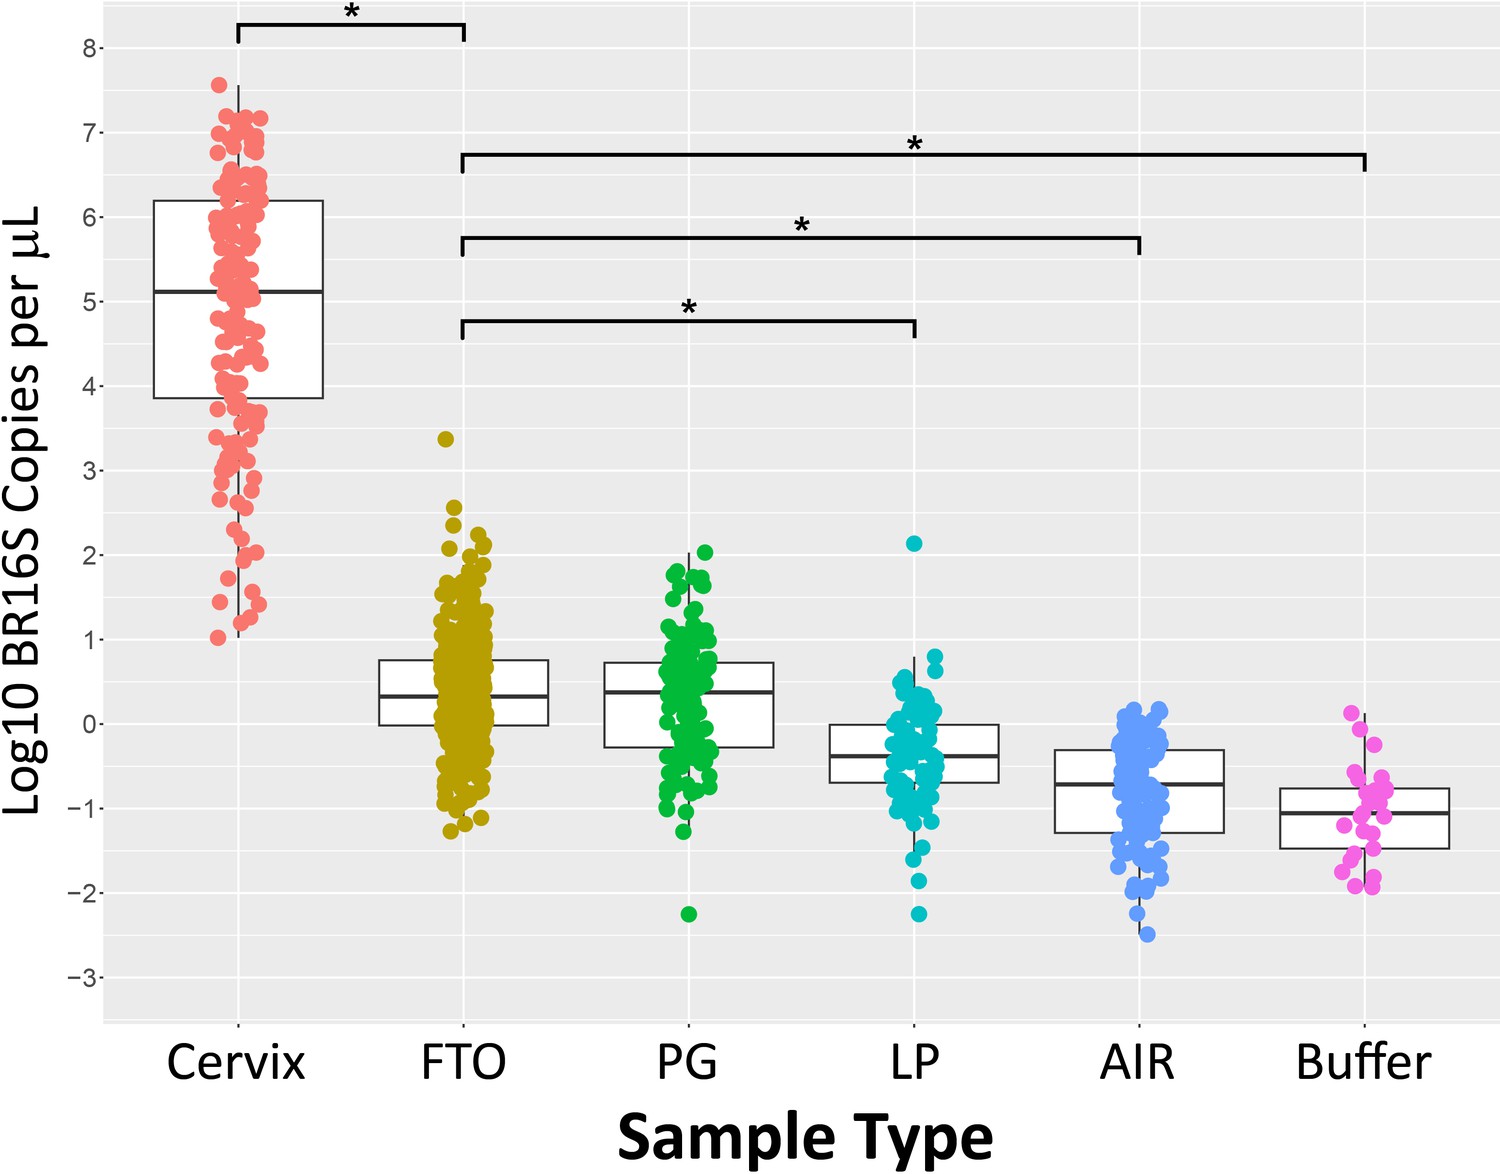
Bacterial concentration of each swab sample and DNA extraction controls as measured by broad-range 16S rRNA gene PCR.
*p-value <0.001, paired t-test, comparing each sample type with fallopian tube/ovarian surface (FTO) samples. PG = paracolic gutter; LP = laparoscopic port.
Figure 2
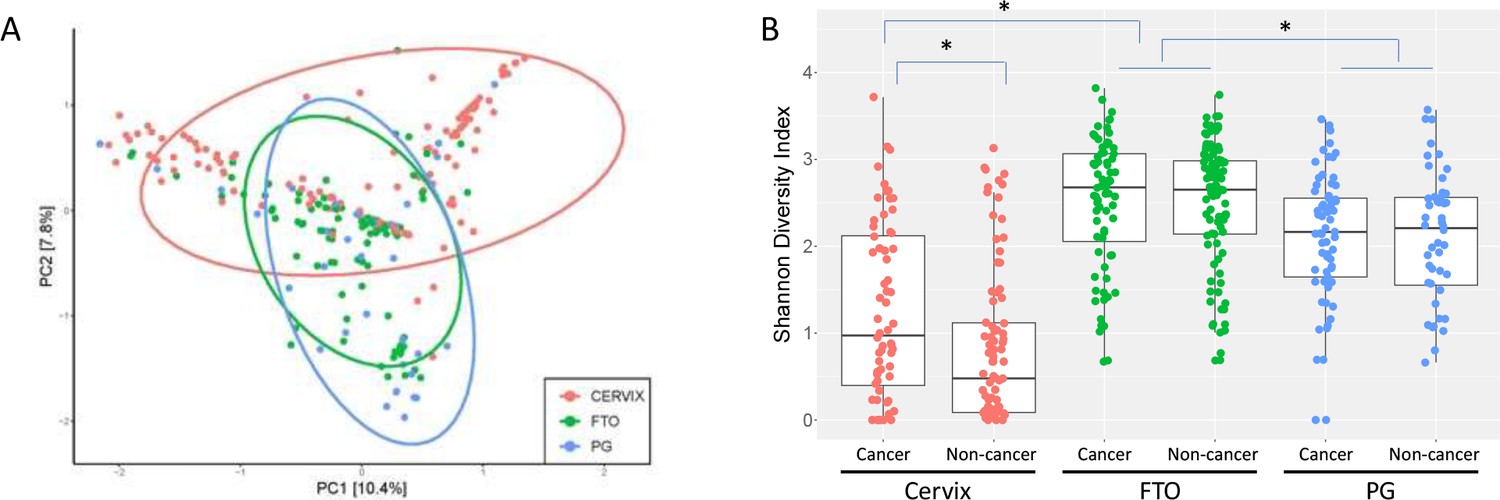
Diversity of identified bacterial species.
(A) PCA plot of candidate fallopian tube (FT) microbiota (84 bacterial species). FT (green) samples have more similarities with paracolic gutter (blue) than with cervical (red) samples. (B) Shannon diversity plot of 726 bacterial species identified after filtering step #5 in Supplementary file 3. *p-value <0.001, paired t-test, comparing between sample types and between cancer versus non-cancer samples within the same sample type. FTO = fallopian tube/ovarian surface; PG = paracolic gutter.
Figure 3
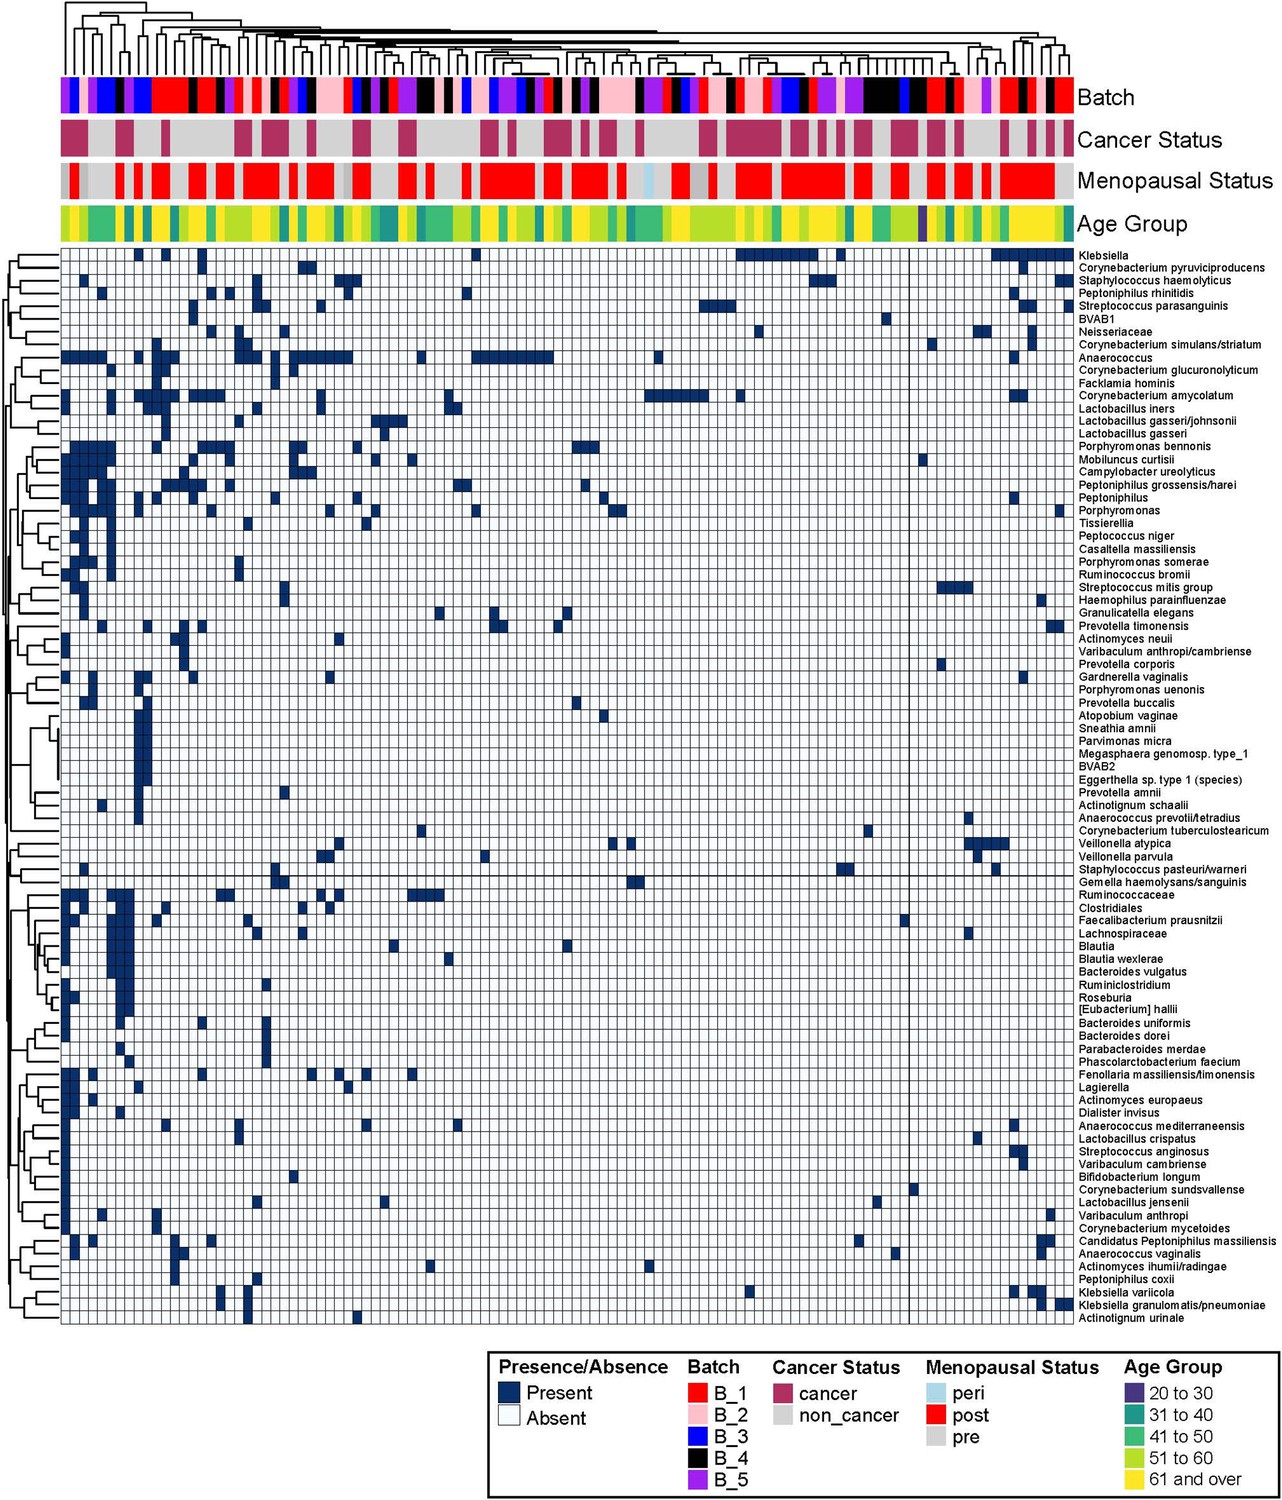
Overview of all participants with processing batch, cancer status, menopausal status, and age in relation to fallopian tube (FT) microbiome taxa.
Each column is a patient, and each row is a bacterial species. The top rows indicate the metadata of each sample as denoted by the color coding of batch, cancer status, menopausal status, and age group.
Figure 4
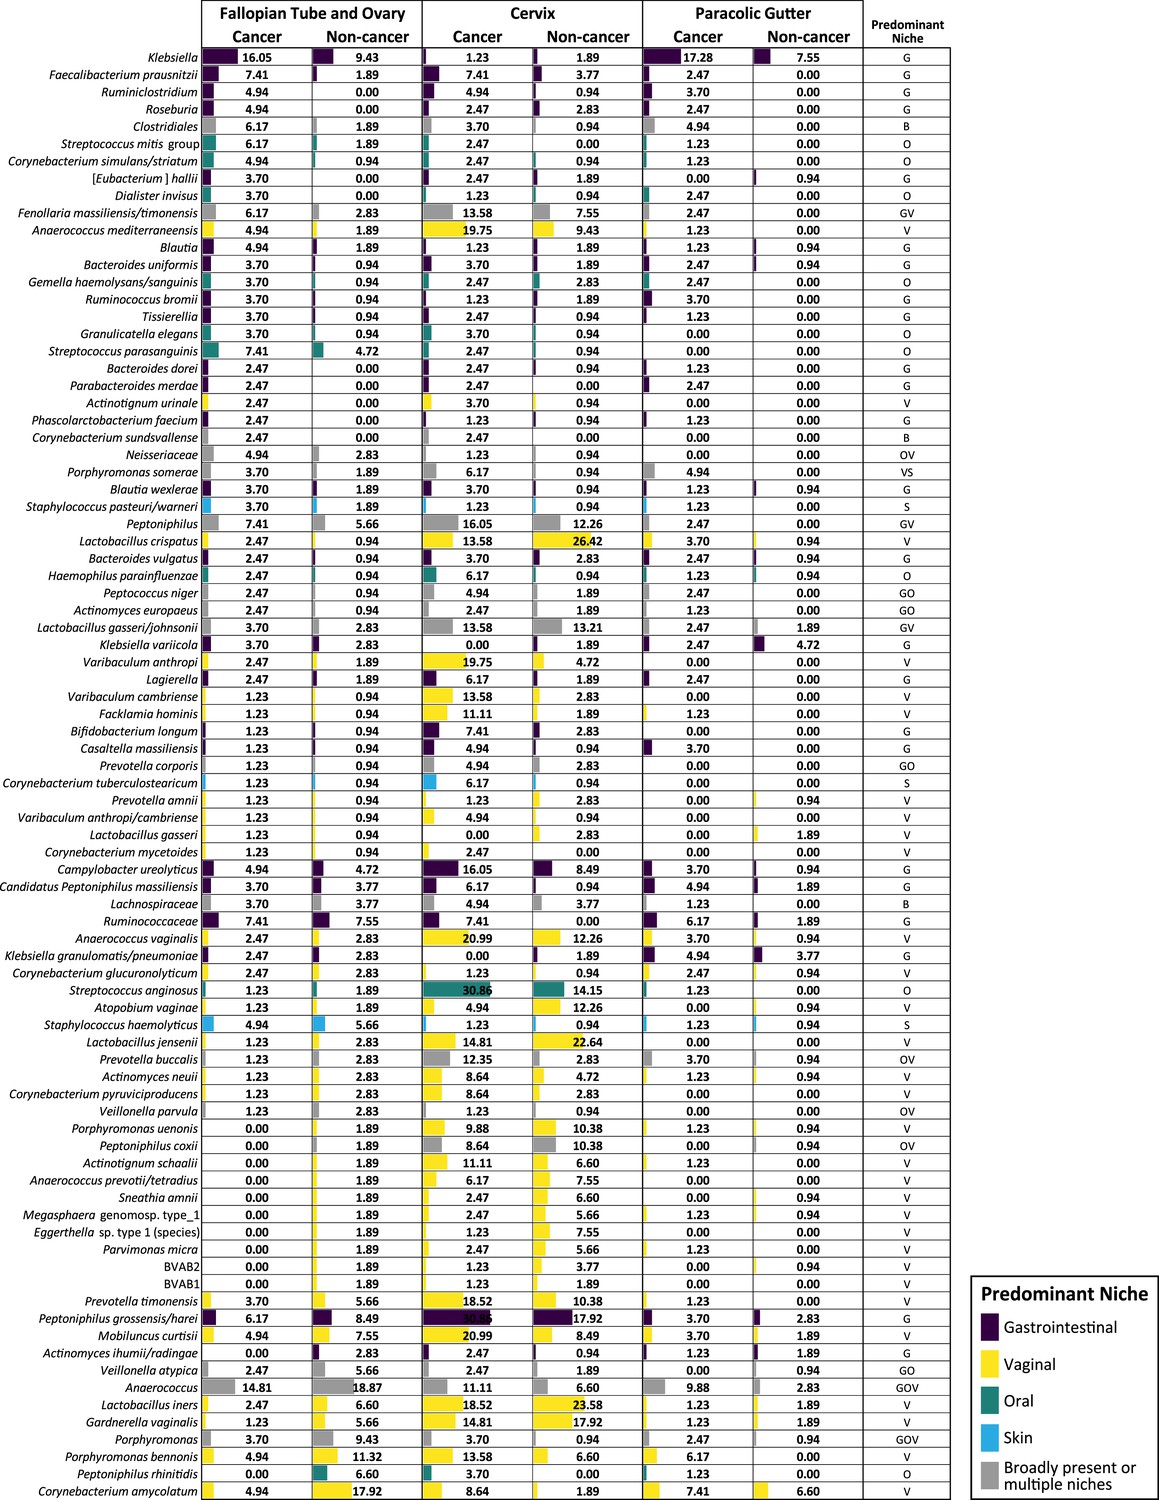
Prevalence of the 84 bacterial species in ovarian cancer versus non-cancer cases.
Each number is the percentage of individuals in each category with the presence of each bacterial species. G = gastrointestinal; O = oral; V = vaginal; S = skin; B = broadly present.
-
Figure 4—source data 1
Prevalence of the 84 bacterial species in ovarian cancer versus non-cancer cases.
- https://cdn.elifesciences.org/articles/89830/elife-89830-fig4-data1-v1.xlsx
Figure 5
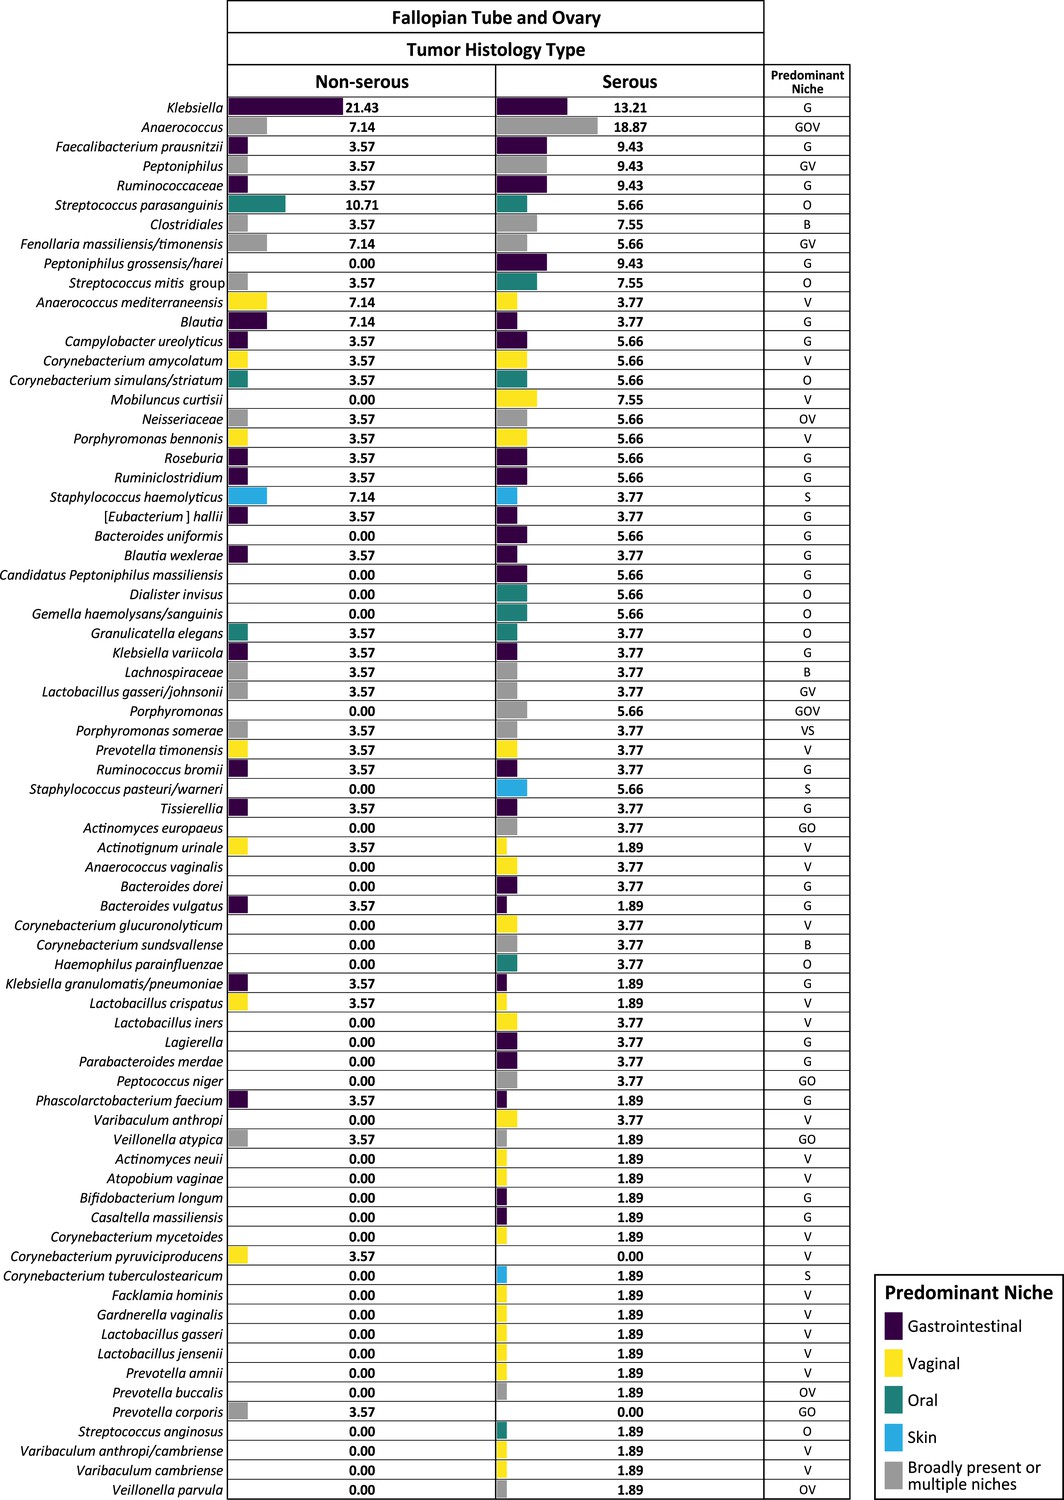
The bacterial prevalence in fallopian tube (FT) samples from ovarian cancer patients by histology subtypes (non-serous versus serous carcinoma).
Each number is the percentage of individuals in each category with the presence of each bacterial species.
-
Figure 5—source data 1
Prevalence in ovarian cancer patients by histology subtypes.
- https://cdn.elifesciences.org/articles/89830/elife-89830-fig5-data1-v1.xlsx
Tables
Table 1
Demographic characteristics of participants.
| Ovarian cancer patients (n = 81) | Non-cancer patients (n = 106) | p-value | |
|---|---|---|---|
| Average age at diagnosis | 59.7 | 55.3 | 0.052 |
| Average age at surgery | 59.6 | 51.6 | <0.001 |
| Post-menopausal | 62 (76.5%) | 48 (45.3%) | <0.001 |
| Race | 0.492 | ||
| - Asian | 7 (8.6%) | 4 (3.8%) | |
| - Black | 1 (1.2%) | 3 (2.8%) | |
| - Other | 6 (7.4%) | 5 (4.7%) | |
| - White | 64 (79.0%) | 92 (86.80%) | |
| - Undisclosed | 3 (3.7%) | 2 (1.9%) | |
| Ethnicity | 0.218 | ||
| - Hispanic | 3 (3.7%) | 1 (0.9%) | |
| - Non-Hispanic | 73 (90.1%) | 102 (96.2%) | |
| - Undisclosed | 5 (6.2%) | 3 (2.8%) | |
| Cancer stage at surgery | N/A | ||
| 1 | 19 (23.5%) | - | |
| 2 | 6 (7.45%) | - | |
| 3 | 39 (48.2%) | - | |
| 4 | 16 (19.8%) | - | |
| NA | 1 (1.2%) | - | |
| Cancer grade | N/A | ||
| 1 | 6 (7.4%) | - | |
| 2 | 3 (3.7%) | - | |
| 3 | 64 (79.0%) | - | |
| 4 | 1 (1.2%) | - | |
| Tumor histology type | N/A | ||
| - Adenocarcinoma | 3 | - | |
| - Carcinosarcoma | 1 | - | |
| - Clear cell | 8 | - | |
| - Endometrioid | 10 | - | |
| - Granulosa cell | 1 | - | |
| - Mucinous | 2 | - | |
| - Serous | 53 | - | |
| - Transitional cell | 1 | - | |
| - Borderline serous* | - | 8 | |
| - Other | - | 98 | |
| Surgical type | <0.001 | ||
| - Laparotomy | 75 (92.6%) | 28 (26.4%) | |
| - Laparoscopy | 3 (3.7%) | 42 (39.6%) | |
| - Robotic assisted | 3 (3.7%) | 36 (34.0%) | |
| Pelvic washing | <0.001 | ||
| - Positive | 43 (53.1%) | 3 (2.8%) | |
| - Negative | 22 (27.2%) | 99 (93.4%) | |
| - NA | 16 (19.8%) | 4 (3.8%) |
-
*
Borderline serous tumors are considered in the non-cancer category in this study due to the non-invasiveness of these tumors.
Additional files
-
Supplementary file 1
Summary of samples sequenced.
- https://cdn.elifesciences.org/articles/89830/elife-89830-supp1-v1.docx
-
Supplementary file 2
Bacterial concentration (log10[16S rRNA genes/μl of DNA]) of each sample type and the p-value of each comparison.
- https://cdn.elifesciences.org/articles/89830/elife-89830-supp2-v1.docx
-
Supplementary file 3
Processing steps and result summary after each step.
- https://cdn.elifesciences.org/articles/89830/elife-89830-supp3-v1.docx
-
Supplementary file 4
Comparison of overall and laparotomy cases in the bacterial prevalence in fallopian tube (FT) samples from ovarian cancer versus non-cancer patients.
Each number is the percentage of individuals in each category with the presence of each bacterial species.
- https://cdn.elifesciences.org/articles/89830/elife-89830-supp4-v1.docx
-
Supplementary file 5
The bacterial prevalence in fallopian tube (FT) samples from non-cancer patients: comparison of laparoscopic/robotic and laparotomy cases.
Each number is the percentage of individuals in each category with the presence of each bacterial species.
- https://cdn.elifesciences.org/articles/89830/elife-89830-supp5-v1.docx
-
MDAR checklist
- https://cdn.elifesciences.org/articles/89830/elife-89830-mdarchecklist1-v1.pdf
Download links
A two-part list of links to download the article, or parts of the article, in various formats.
Downloads (link to download the article as PDF)
Open citations (links to open the citations from this article in various online reference manager services)
Cite this article (links to download the citations from this article in formats compatible with various reference manager tools)
Identification of fallopian tube microbiota and its association with ovarian cancer
eLife 12:RP89830.
https://doi.org/10.7554/eLife.89830.3


