Essential function of transmembrane transcription factor MYRF in promoting transcription of miRNA lin-4 during C. elegans development
- School of Life Science and Technology, ShanghaiTech University, China
Figures
Figure 1
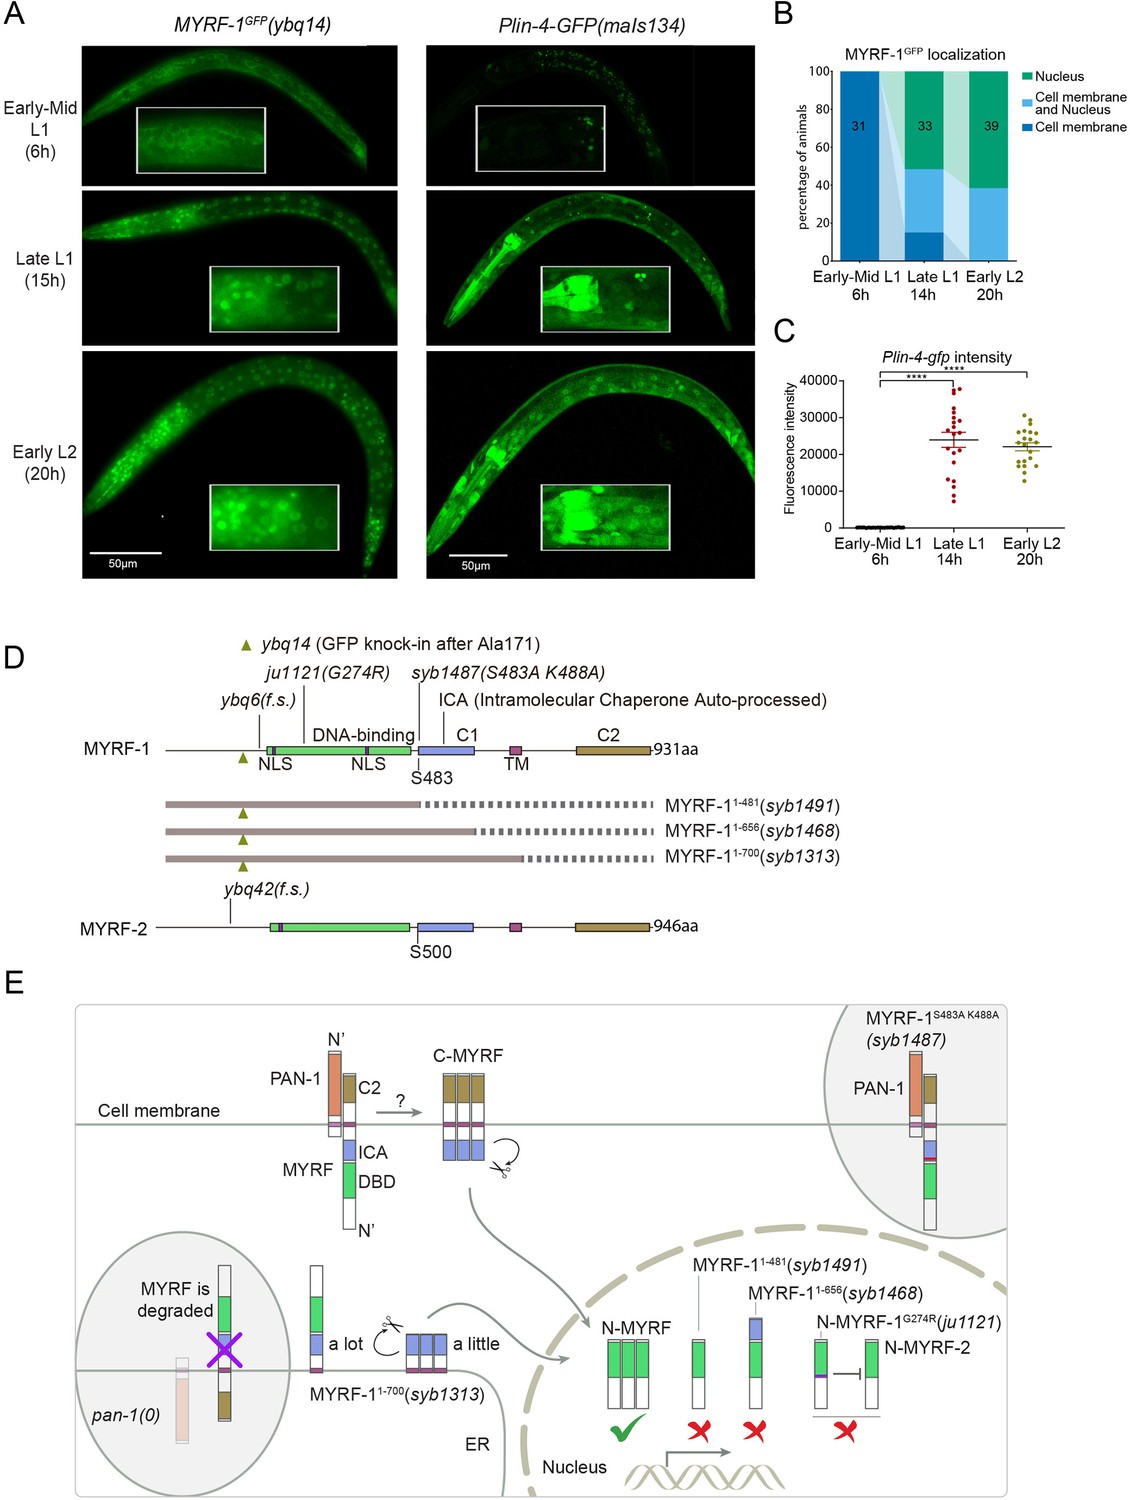
The nuclear accumulation of N-MYRF-1 coincides with the induction of lin-4 in developmental timing.
(A) Nuclear localization of GFP::MYRF-1 is increased in late L1, coinciding with the expression of Plin-4-GFP. GFP, endogenously inserted at MYRF-1 Ala171, labels both full-length MYRF-1 and post-cleaved N-MYRF-1. Plin-4-GFP(maIs134) is a transcriptional reporter of lin-4, carrying a 2.4 kb sequence upstream of the lin-4 gene that drives GFP. While GFP::MYRF-1 is initially localized at the cell membrane in early-mid L1 (6 post-hatch hours), it becomes enriched in the nucleus towards late L1 (15 post-hatch hours). Plin-4-GFP is barely detected in early L1 but is upregulated in late L1. The insert shows a zoomed-in view of the framed area, covering part of the pharynx. (B) Quantification of animals showing a particular pattern of GFP::MYRF-1 (as shown in (A)) at various stages. The number of animals analyzed is indicated on each bar. (Figure 1—source data 1). (C) The fluorescence intensity of the lin-4 transcriptional reporter (as shown in (A)) was quantified and presented as mean ± SEM (t-test, ****p<0.0001). (Figure 1—source data 2). (D) This illustration presents the gene structures of myrf-1 and myrf-2, along with the mutations we investigated. The self-cleavage sites are S483 in myrf-1 and S500 in myrf-2. The myrf-1(ybq14) variant involves GFP insertion at Ala171. Both myrf-1(ybq6) and myrf-2(ybq42) have indel mutations that lead to frameshifts, rendering them functionally null. The myrf-1(ju1121, G274R) variant contains a missense mutation and results in a phenotype similar to the myrf-1; myrf-2 double mutants. The myrf-1(syb1487, S483A K488A) variant carries modifications at two catalytic residues that are important for self-cleavage. The variants myrf-1(syb1491, 1–482), myrf-1(syb1468, 1–656), and myrf-1(syb1313, 1–700) represent in-frame deletions, each tagged with GFP at Ala171.E. This model outlines the trafficking pathways, subcellular locations, processing activities, and regulatory roles of MYRF, as well as the impact of dysfunctional MYRF mutants in C. elegans. Initially, the full-length MYRF protein is situated in the endoplasmic reticulum (ER), where it binds with PAN-1, a protein with a leucine-rich repeat (LRR) domain. This interaction is critical for MYRF’s movement to the cell membrane. Without PAN-1, MYRF is degraded within the ER. The process of MYRF trimerization and its subsequent cleavage at the cell membrane is tightly timed, though the exact mechanisms behind this are yet to be fully understood. Once cleaved, the N-terminal part of MYRF (N-MYRF) moves to the nucleus, playing a key role in specific developmental processes. The diagram also illustrates the functional effects of MYRF variants resulting from genetic modifications. Mutating MYRF-1’s conserved catalytic dyad residues to S483A K488A results in the mutant protein’s persistent retention on cell membranes, causing an arrest phenotype at the end of the first larval stage, similar to null myrf-1 mutants. Mutants expressing only the N-terminal segment (MYRF-1 (1–481)) or including the ICA domain (MYRF-1 (1–656)) are constantly present in the nucleus. These variants, however, show developmental issues akin to null myrf-1 mutants. The MYRF-1(G274R) mutation disrupts DNA binding and also inhibits MYRF-2 function through direct interaction, resulting in a phenotype resembling myrf-1; myrf-2 double mutants. Removing the vesicular luminal regions in MYRF-1 primarily causes the MYRF-1 (1–700) variant to stay in the ER without appropriate processing, although a small portion does undergo cleavage. Animals with the myrf-1 (1–700) mutation typically experience developmental arrest during the L1 and L2 stages, showing a combination of both premature and delayed cellular development.
-
Figure 1—source data 1
The quantification of animals exhibiting a specific pattern of GFP::MYRF-1 at various stages, as illustrated in Figure 1B.
- https://cdn.elifesciences.org/articles/89903/elife-89903-fig1-data1-v1.xlsx
-
Figure 1—source data 2
The detailed statistical analysis of the fluorescence intensity for the lin-4 transcriptional reporter, as illustrated in Figure 1C.
- https://cdn.elifesciences.org/articles/89903/elife-89903-fig1-data2-v1.xlsx
Figure 2 with 4 supplements
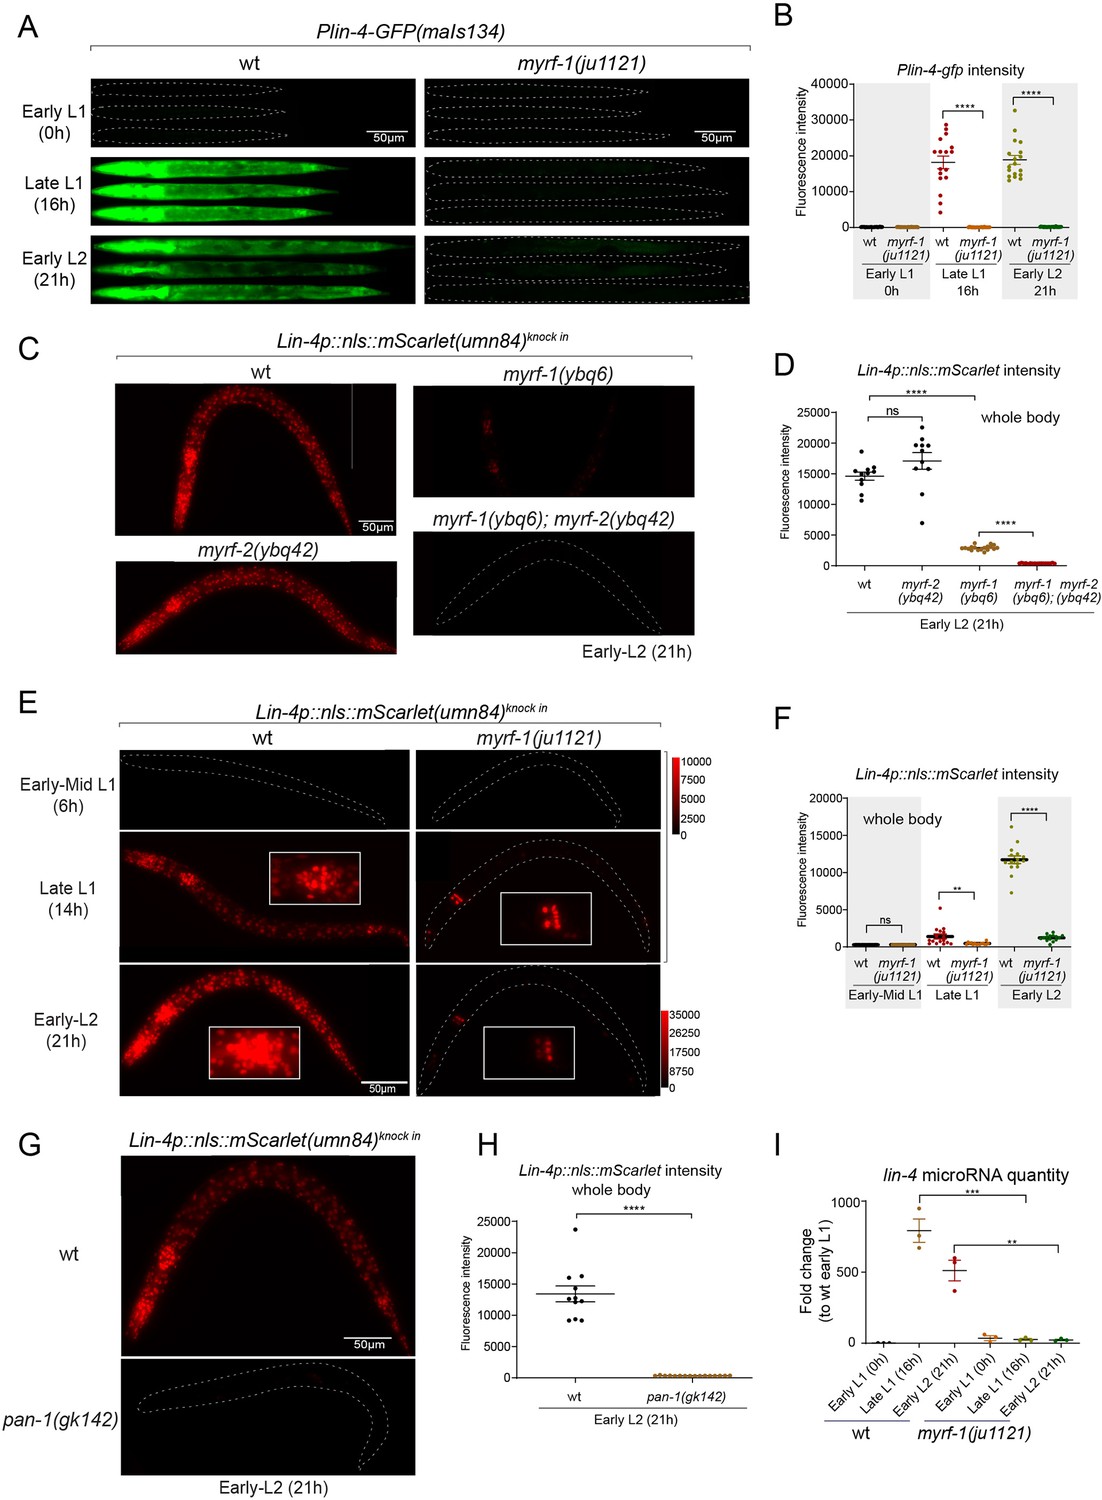
MYRF is required for lin-4 expression during late L1.
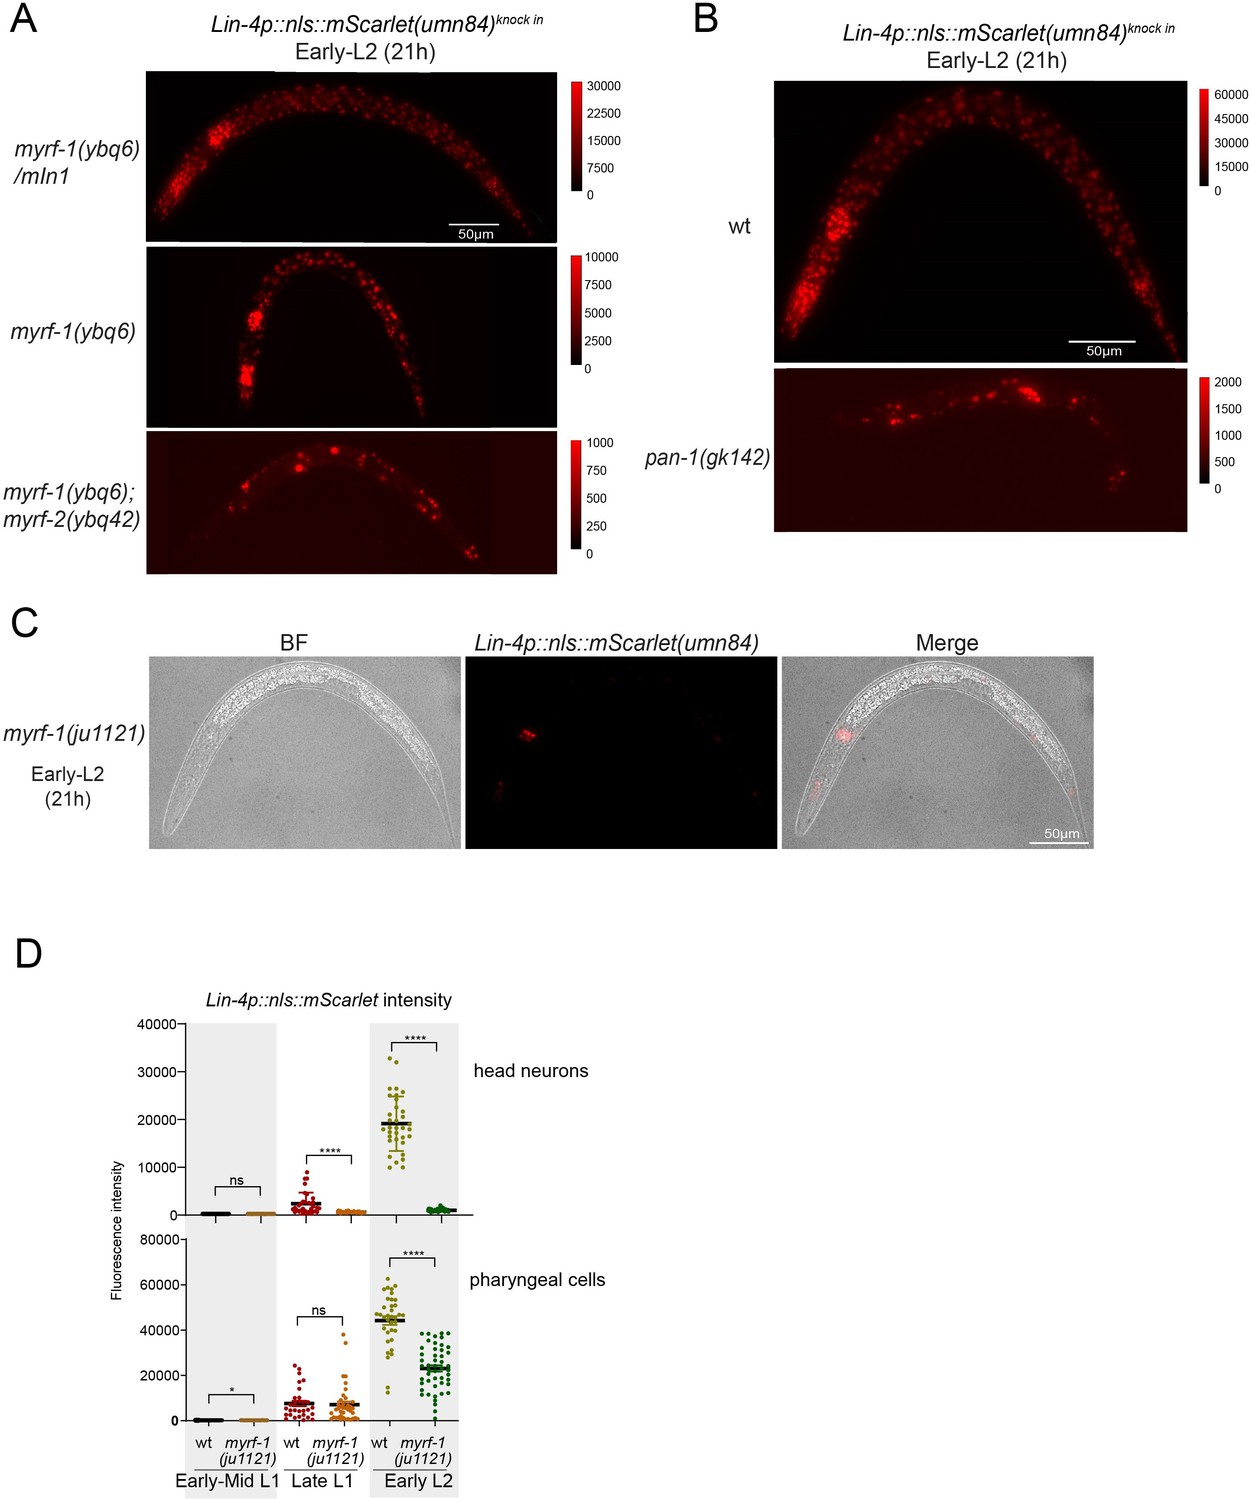
(A) Plin-4-GFP(maIs134) is not expressed in myrf-1(ju1121). The expression of the lin-4 transcriptional reporter in wild-type and myrf-1(ju1121) animals was examined at the early L1 (0 hr), late L1 (16 h), and early L2 stages (21 hr). (B) The fluorescence intensity of the lin-4 transcriptional reporter (as shown in (A)) was quantified and presented as mean ± SEM (t-test, ****p<0.0001). (Figure 2—source data 1). (C) The expression of the endogenous lin-4 transcriptional reporter, lin-4p::nls::mScarlet(umn84), is substantially reduced in myrf-1(ybq6) mutants. In contrast, there is no significant change in its expression in myrf-2(ybq42) mutants. Importantly, this reporter is not activated in the myrf-1; myrf-2 double mutants. The weak expression of the reporter can be visualized by decreasing the maximum display range. Such representation is available in (Figure 2—figure supplement 3). (D) The fluorescence intensity of the lin-4 reporter, as illustrated in (C), was quantified and is presented as mean ± SEM. Statistical significance was determined using a t-test (****p<0.0001; ns, not significant). The term 'whole body' refers to the region of interest (ROI) encompassing the entire body of the animal. This definition is consistently applied throughout this figure(E) The lin-4 reporter (umn84) is not activated in myrf-1(ju1121) mutants, with the exception of a few pharyngeal nuclei. The expression of this reporter in both wild-type and myrf-1(ju1121) animals was examined at various developmental stages: early to mid L1 (6 hr), late L1 (14 hr), and early L2 (21 hr). Due to the strong expression of the reporter in the wild-type, the maximum display range has been increased to prevent signal saturation. The adjusted display range is indicated in the intensity scale adjacent to the images. (F) The fluorescence intensity of the lin-4 reporter, as depicted in (E), was quantified and is presented as mean ± SEM. Statistical significance was assessed using a t-test (****p<0.0001). (Figure 2—source data 3). For quantification of the lin-4 reporter in head neurons and pharyngeal cells, refer to (Figure 2—figure supplement 3). (G) The lin-4 reporter (umn84) is completely inactive in pan-1(gk142) mutants. These mutants and their wild-type controls were examined at the early L2 stage (21 hr). Images with a decreased maximum display range are available in (Figure 2—figure supplement 3). (H) The fluorescence intensity of the lin-4 reporter, as shown in (G), was quantified and is presented as mean ± SEM. Statistical significance was determined using a t-test (****P<0.0001). (Figure 2—source data 4). (I) The abundance of mature lin-4 miRNAs in wild-type and myrf-1(ju1121) animals was examined at the early L1 (0 hr), late L1 (16 hr), and early L2 stages (21 h) using qPCR analysis with probes specifically detecting lin-4 microRNA. Each data point represents relative fold change of each sample comparied to the wild-type Early L1 sample within one set of experiment. The data represent three biological replicates. Statistics used t-test. *p<0.05, ***p<0.001. (Figure 2—source data 5).
-
Figure 2—source data 1
The statistical analysis of the fluorescence intensity of the lin-4 transcriptional reporter (maIs134) in wild-type and myrf-1(ju1121) mutants, as illustrated in Figure 2B.
- https://cdn.elifesciences.org/articles/89903/elife-89903-fig2-data1-v1.xlsx
-
Figure 2—source data 2
The statistical analysis of the fluorescence intensity of lin-4p::nls::mScarlet in wild-type, myrf-1(ybq6), myrf-2(ybq42), and myrf-1(ybq6); myrf-2(ybq42) double mutants, as illustrated in Figure 2D.
- https://cdn.elifesciences.org/articles/89903/elife-89903-fig2-data2-v1.xlsx
-
Figure 2—source data 3
The statistical analysis of the fluorescence intensity of lin-4p::nls::mScarlet in wild-type and myrf-1(ju1121) mutants at the mid L1 (6 hr), late L1 (16 hr), and early L2 (21 hr) stages, as illustrated in Figure 2F.
- https://cdn.elifesciences.org/articles/89903/elife-89903-fig2-data3-v1.xlsx
-
Figure 2—source data 4
The statistical analysis of the fluorescence intensity of lin-4p::nls::mScarlet in wild type and pan-1(gk142) mutant , as illustrated in Figure 2H.
- https://cdn.elifesciences.org/articles/89903/elife-89903-fig2-data4-v1.xlsx
-
Figure 2—source data 5
The abundance of mature lin-4 miRNAs in wild-type and myrf-1(ju1121) animals at the early L1 (0 hr), late L1 (16 hr), and early L2 (21 hr) stages using qPCR analysis, as illustrated in Figure 2I.
- https://cdn.elifesciences.org/articles/89903/elife-89903-fig2-data5-v1.xlsx
Figure 2—figure supplement 1
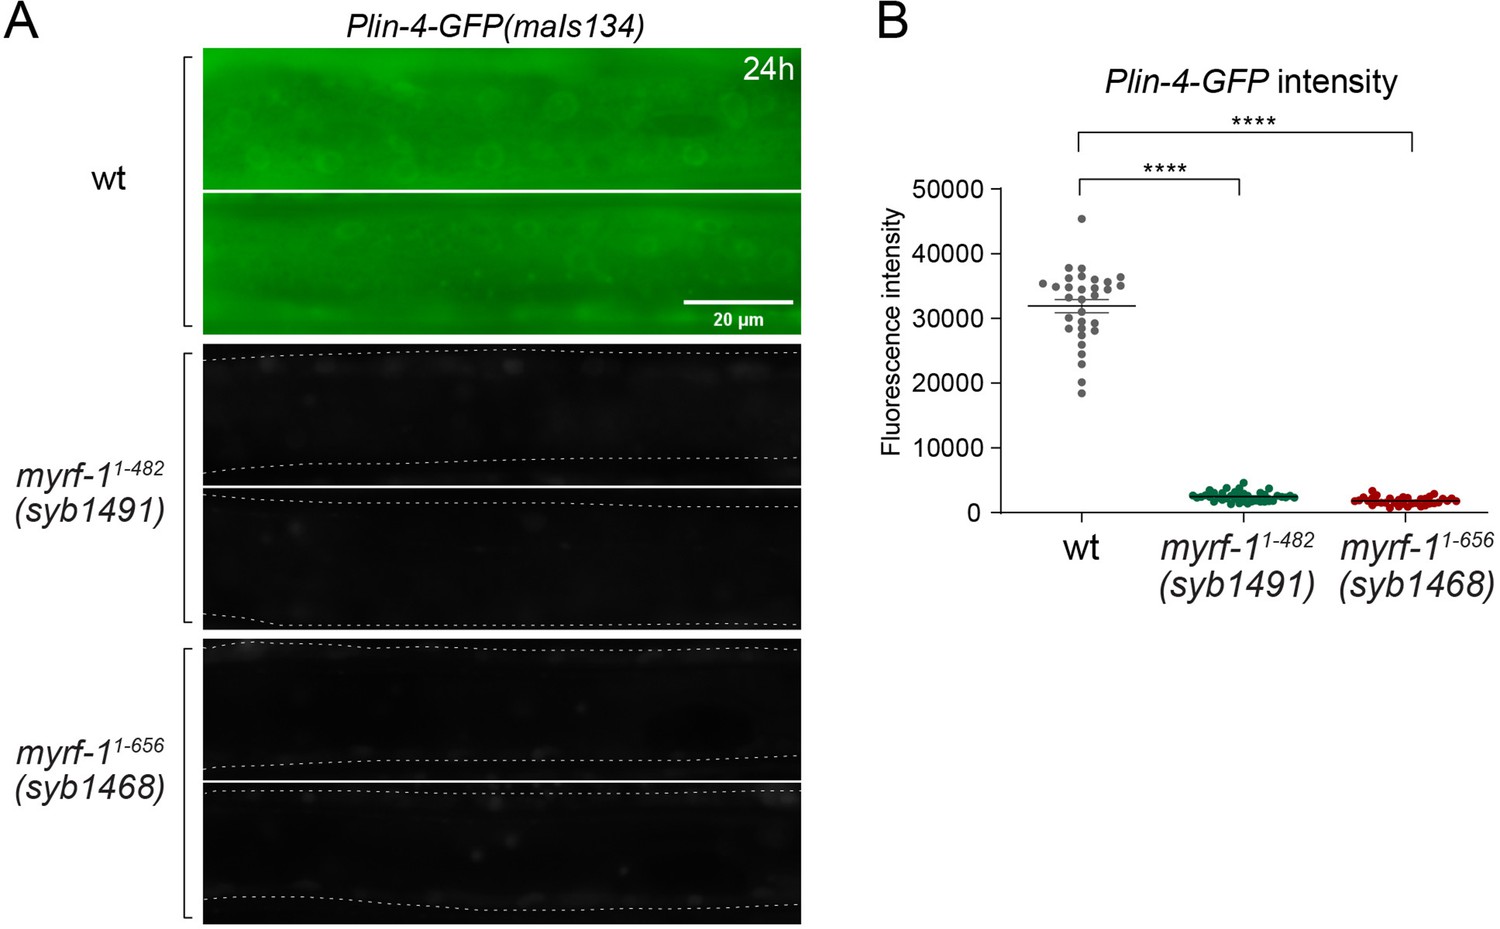
Plin-4-GFP expression in myrf-1 loss of function mutants.
(A) Plin-4-GFP(maIs134) expression was examined in wild-type, myrf-1(syb1491), and myrf-1(syb1468) animals at the L2 stage (24 hr). We previously reported that these two myrf-1 mutants exhibit phenotypes similar to those of myrf-1 null mutants. Plin-4-GFP was not detected in myrf-1 mutants. (B) The fluorescence intensity of Plin-4-GFP was quantified and presented as mean ± SEM (t-test; ****p<0.0001). (Figure 2—figure supplement 1—source data 1).
-
Figure 2—figure supplement 1—source data 1
The statistical analysis of the fluorescence intensity of the lin-4 transcriptional reporter (maIs134) in wild-type, myrf-1(syb1491), and myrf-1(syb1468) animals at the L2 stage (24 hr), as illustrated in Figure 2—figure supplement 1B.
- https://cdn.elifesciences.org/articles/89903/elife-89903-fig2-figsupp1-data1-v1.xlsx
Figure 2—figure supplement 2
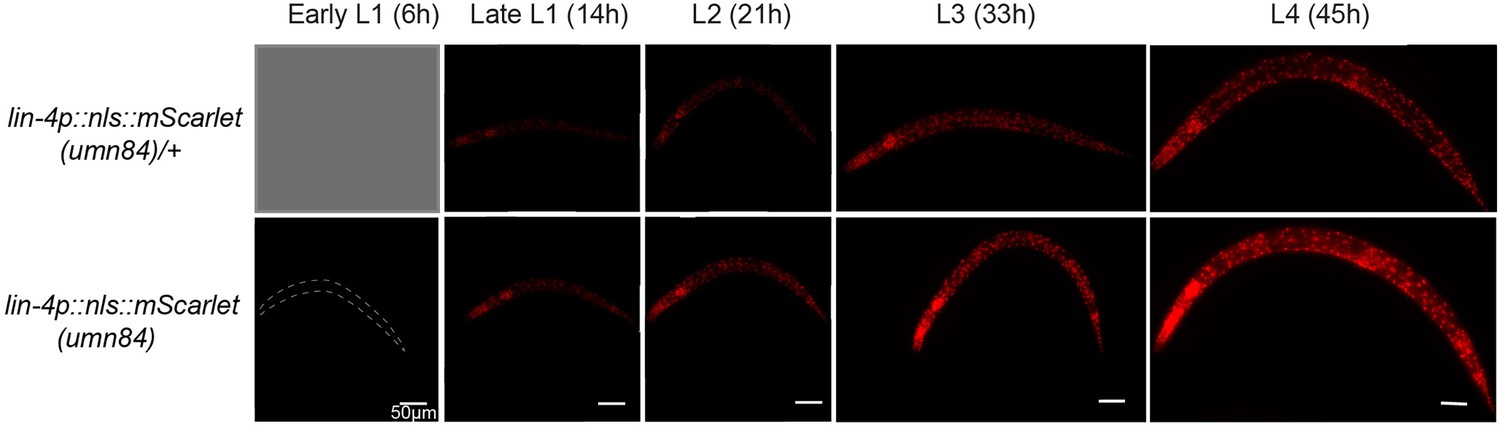
The expression of lin-4 endogenous reporter throughout larval stages.
The analysis used an endogenously tagged lin-4 expression reporter. In this design, the lin-4 coding sequence was replaced with a nuclear-localized mScarlet ORF, rendering homozygous reporter animals as lin-4 loss-of-function mutants. Heterozygous reporter (umn84/mIn1) serve as a proxy for wild-type background expression, albeit with reduced intensity due to a single copy of the reporter. lin-4 mutants are known to be able to develop into adults at a normal pace. However, they exhibit elongated bodies, lack a vulva, and ultimately perish, forming a ‘bag’ of interiorly hatched larvae. Initially, mScarlet expression is not detectable during the early to mid-L1 stage (6 hr post-hatch). At this time, it is not possible to distinguish umn84/mIn1 animals from mIn1 homozygotes due to the absence of mScarlet expression. mScarlet signals are first observed approximately 10 hr post-hatch in a subset of the population, with expression levels increasing subsequently.
Figure 2—figure supplement 3
MYRF-1 is required for lin-4 expression.
(A) These images correspond to Figure 2C, but are displayed with a decreased maximum display range to more effectively visualize the weak lin-4 reporter (umn84) signals in myrf-1(ybq6) and the myrf-1(ybq6); myrf-2(ybq42) double mutants. The display range is indicated in the intensity scale to the right of the image.(B) The images correspond to Figure 2G, but are displayed with a decreased maximum display range for a better visualization of the lin-4 reporter (umn84) signals in pan-1(gk142). The display range is depicted in the intensity scale to the right of the image. (C) The images correspond to Figure 2E, displaying an individual myrf-1(ju1121) mutant. They show both the DIC image and the lin-4p::nls::mScarlet(umn84) fluorescence. The mScarlet is expressed in 8–9 pharyngeal nuclei. (D) Quantification of lin-4 reporter (umn84) in myrf-1(ju1121), as shown in Figure 2E. The region of interest (ROI) of ‘head neurons’ comprises multiple head neuron nuclei found in each animal. For ‘pharyngeal cells,’ the ROI includes the 8–9 pharyngeal nuclei that exhibit bright mScarlet signals. (Figure 2—figure supplement 3—source data 1).
-
Figure 2—figure supplement 3—source data 1
The statistical analysis of the fluorescence intensity of lin-4p::nls::mScarlet in head neurons and pharyngeal cells in wild-type and myrf-1(ju1121) mutants, as illustrated in Figure 2—figure supplement 3D.
- https://cdn.elifesciences.org/articles/89903/elife-89903-fig2-figsupp3-data1-v1.xlsx
Figure 2—figure supplement 4
MYRF-1 is required for lin-4 expression throughout the larval stages.
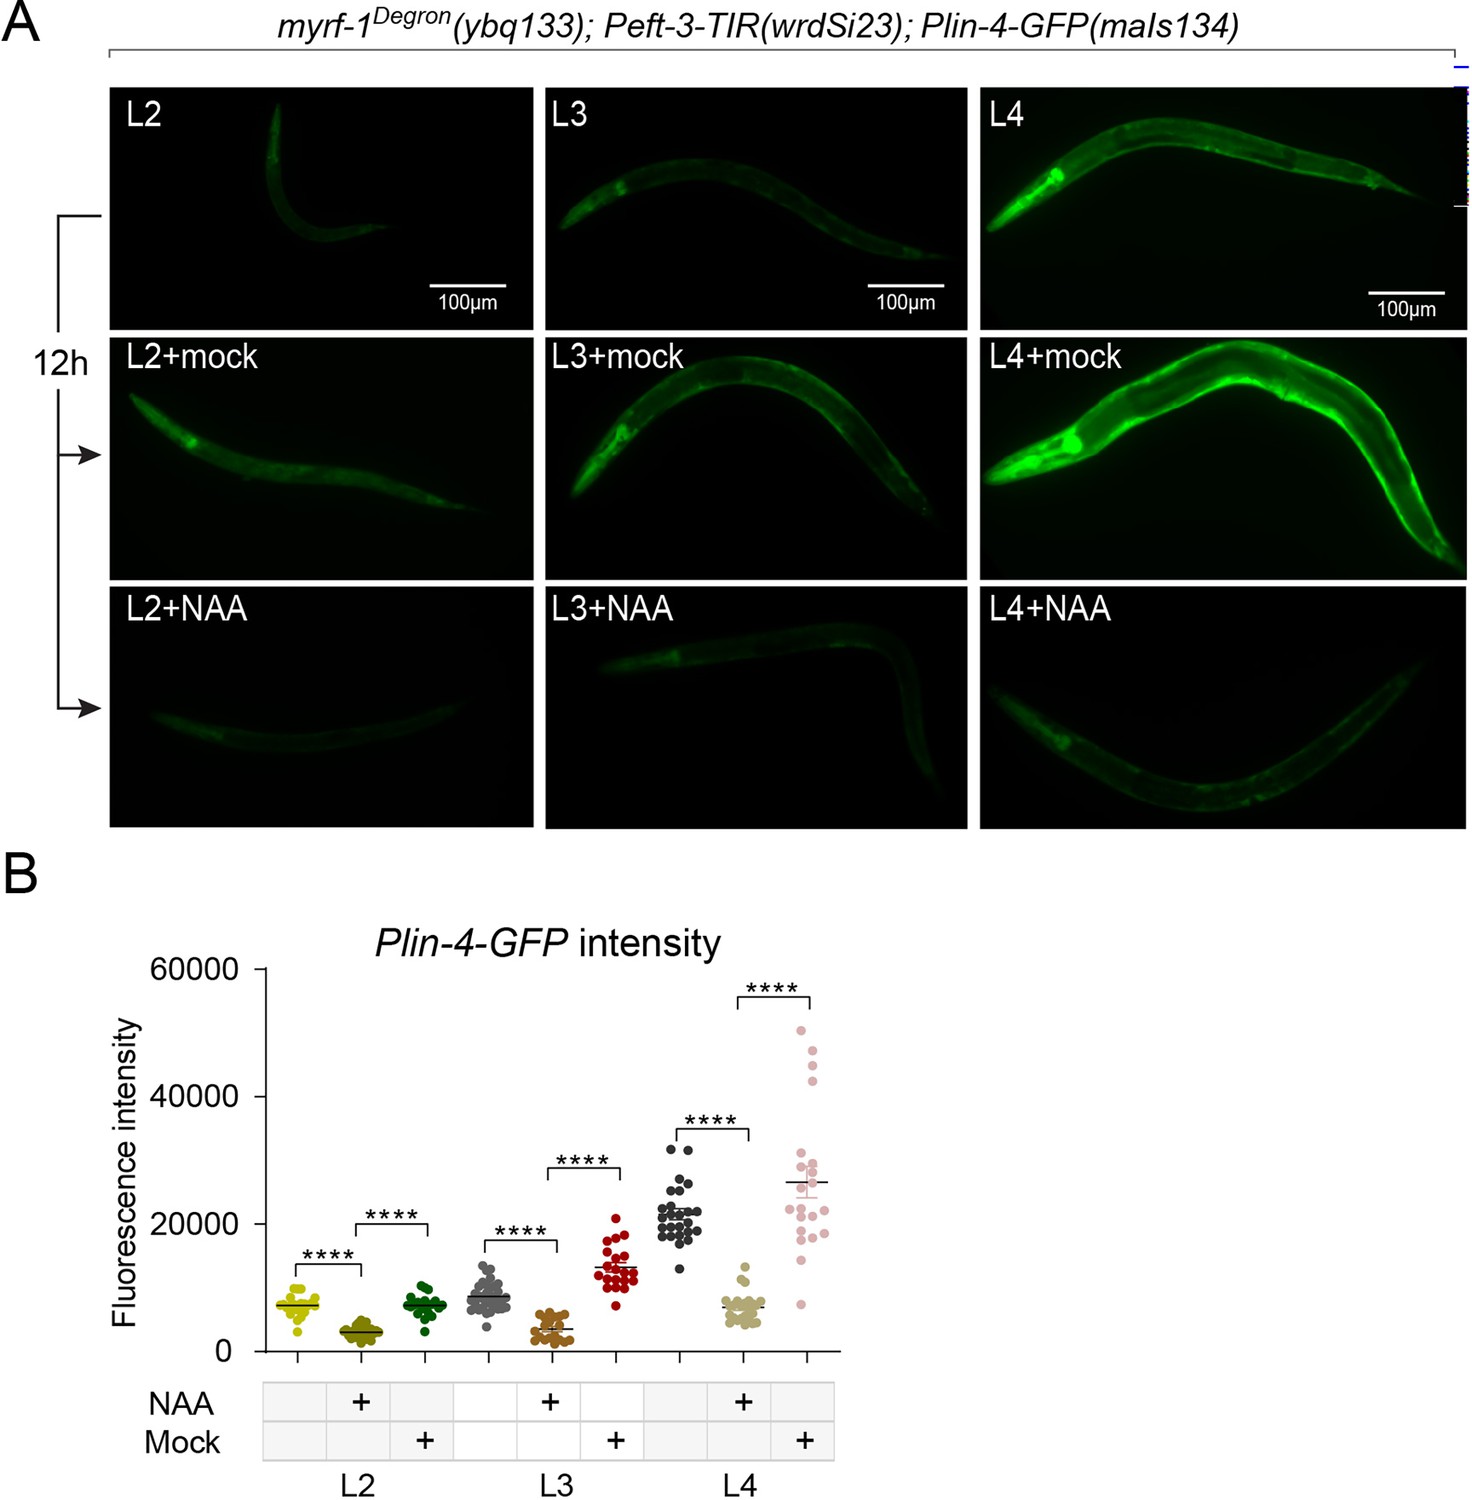
(A) Larval stages L2, L3, and L4 animals were treated with or without 4 mM K-NAA for 12 hr. The lin-4 transcription reporter was down-regulated in the drug-treated animals compared to the pre-treated and mock-treated animals. (B) The fluorescence intensity of lin-4 transcription reporter was quantified and presented as mean ± SEM (t-test; ****p<0.0001). (Figure 2—figure supplement 4—source data 1).
-
Figure 2—figure supplement 4—source data 1
The detailed statistical analysis of the fluorescence intensity of the lin-4 transcriptional reporter (maIs134) in larval stages L2, L3, and L4 animals treated with or without 4 mM K-NAA for 12 hours, as illustrated in Figure 2—figure supplement 4B.
- https://cdn.elifesciences.org/articles/89903/elife-89903-fig2-figsupp4-data1-v1.xlsx
Figure 3
There is a sustained high level of LIN-14 protein in myrf-1 mutants.
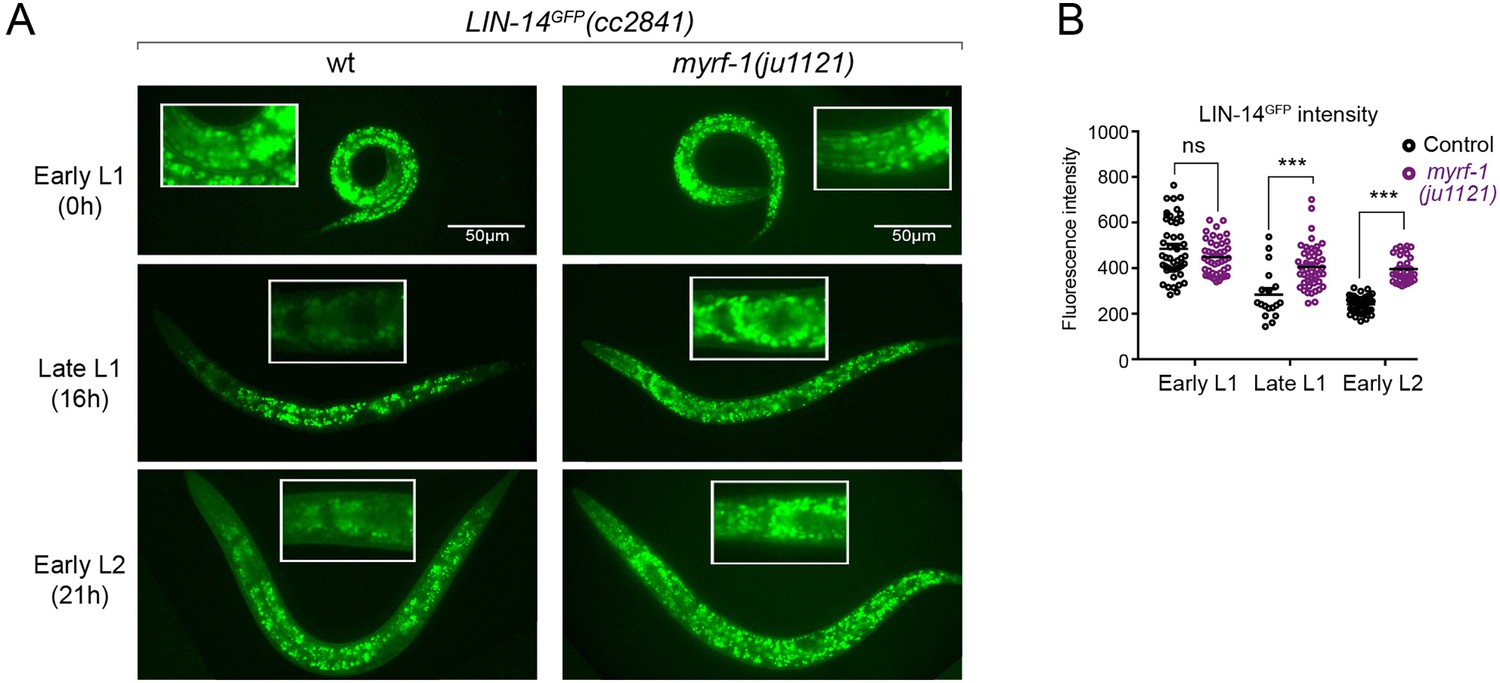
(A). Expression of LIN-14::GFP(cc2841) in wild-type and myrf-1(ju1121) at the early L1 (0 hr), late L1 (16 hr), and early L2 (21 hr) stages. GFP was endogenously tagged at the LIN-14 C-terminus. LIN-14::GFP is bright in early L1 and downregulated in late L1. LIN-14::GFP is not affected by myrf-1(ju1121) at early L1 but is significantly brighter than wild-type control at late L1 and L2. (B). The fluorescence intensity for LIN-14::GFP (as shown in A) was measured and presented as mean ± SEM (t-test, ns: not significant, p>0.05; ***p<0.001). Each data point represents the mean intensity of the head region in an individual animal. The head region was selected due to its low autofluorescence background. (Figure 3—source data 1).
-
Figure 3—source data 1
The detailed statistical analysis of the fluorescence intensity for LIN-14::GFP in wild type and myrf-1(ju1121) mutant, as illustrated in Figure 3B.
- https://cdn.elifesciences.org/articles/89903/elife-89903-fig3-data1-v1.xlsx
Figure 4
MYRF-1 is sufficient to drive lin-4 expression in a cell-autonomous manner.
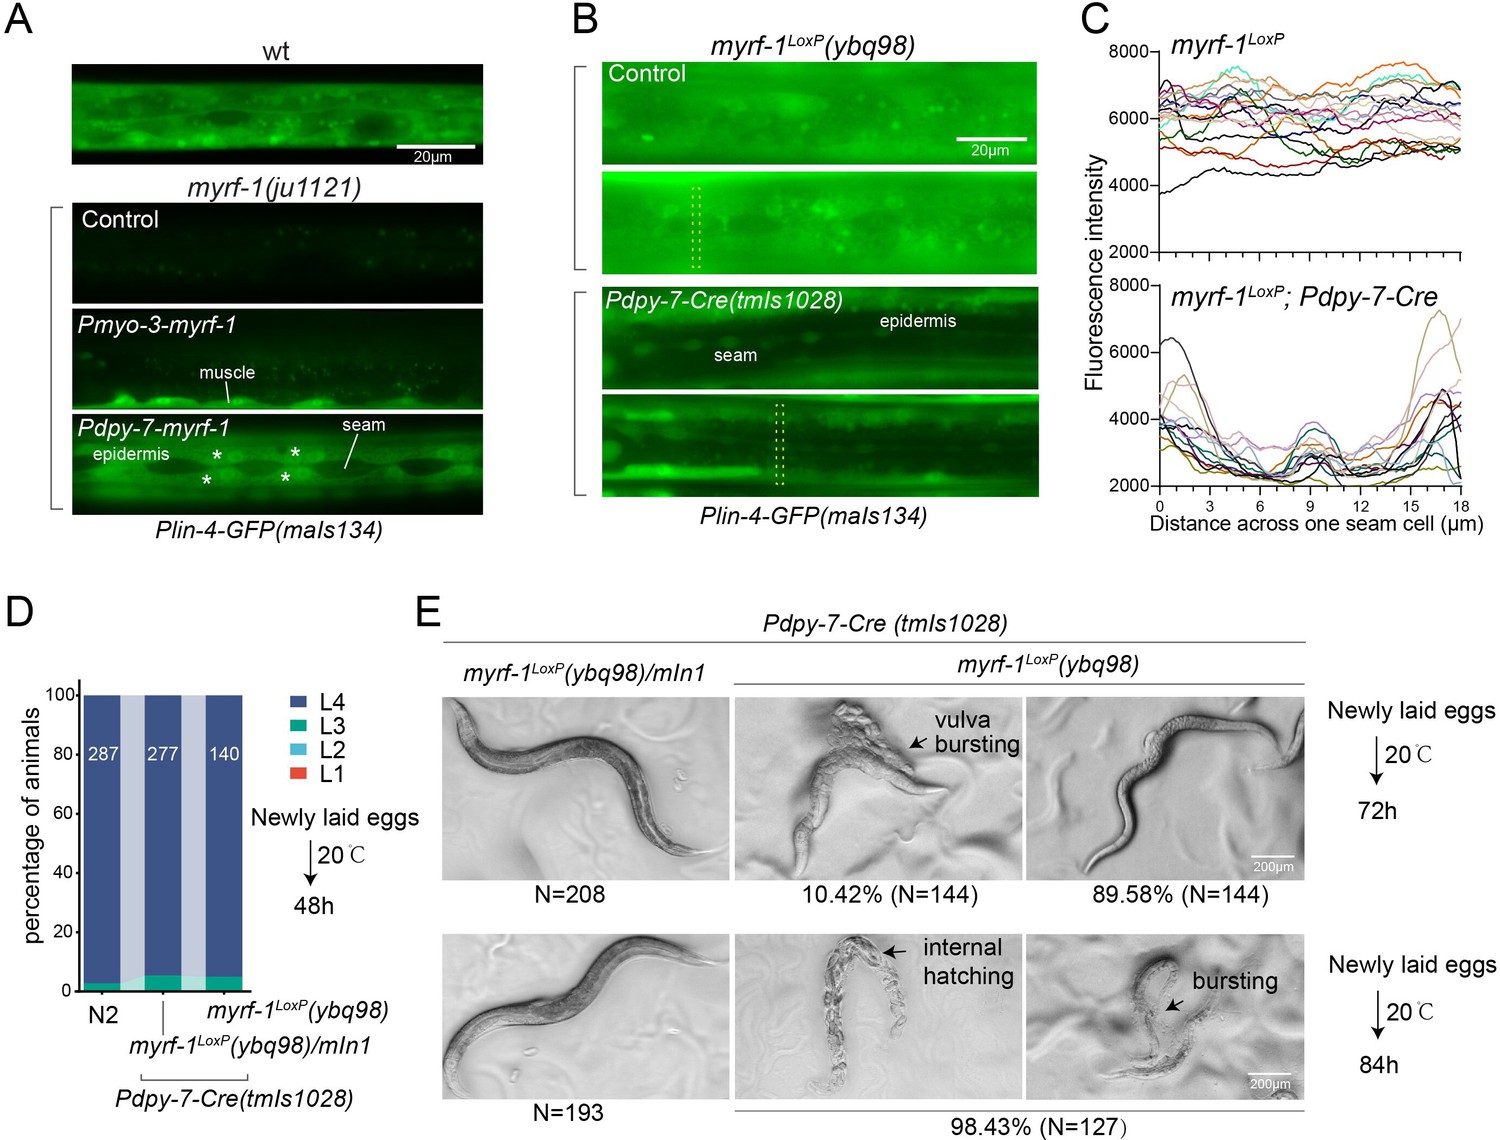
(A). Genetic rescue of MYRF-1 in myrf-1(ju1121) using tissue-specific promoters. Plin-4-GFP(maIs134) signals are observed specifically in body wall muscles and epidermis (asterisk) of myrf-1(ju1121) carrying transgene Pmyo-3-myrf-1 and Pdpy-7-myrf-1, respectively, while no detectable Plin-4-GFP is observed in L2 of myrf-1(ju1121). (B). Tissue-specific ablation of myrf-1 in the epidermis. myrf-1LoxP(ybq98) combined with Pdpy-7-NLS::Cre(tmIs1028) caused loss or drastic decrease of Plin-4-GFP(maIs134) in the epidermis, while signals were detected in other tissues. Representative images of L2 (24 h) animals are shown. (C). Fluorescence intensity data, illustrated in (B), are presented for a transversely oriented ROI (Region of Interest) bar centered on a single seam cell. Each line in the data corresponds to the signal from an individual animal. (Figure 4—source data 1).(D). Effects of ablating myrf-1 in epidermis using Cre-LoxP. Assessments of larval growth in myrf-1LoxP(ybq98); Pdpy-7-Cre(tmIs1028) compared to control animals show that larval stage development does not exhibit obvious defects. (Figure 4—source data 2). (E) By day 1, adult myrf-1LoxP(ybq98); Pdpy-7-Cre(tmIs1028) animals exhibit internal organ spillage through vulva bursting in about 10% of day-1 adults, while others’ bodies exhibit elongation (similar to lin-4 mutants). By day 2, nearly all myrf-1 ablated animals are dead, either due to bursting or internal hatching.
-
Figure 4—source data 1
The detailed statistical analysis of the fluorescence intensity of the lin-4 transcriptional reporter(maIs134) in wild-type and myrf-1(ybq98); Pdpy-7-Cre(tmIs1028) animals, as illustrated in Figure 4C.
- https://cdn.elifesciences.org/articles/89903/elife-89903-fig4-data1-v1.xlsx
-
Figure 4—source data 2
Assessments of developmental stages for wild-type, myrf-1(ybq98); Pdpy-7-Cre(tmIs1028) and myrf-1(ybq98)/mIn1; Pdpy-7-Cre(tmIs1028) animals cultured at 20 °C for 48 hours, starting from freshly laid eggs, as illustrated in Figure 4D.
- https://cdn.elifesciences.org/articles/89903/elife-89903-fig4-data2-v1.xlsx
Figure 5
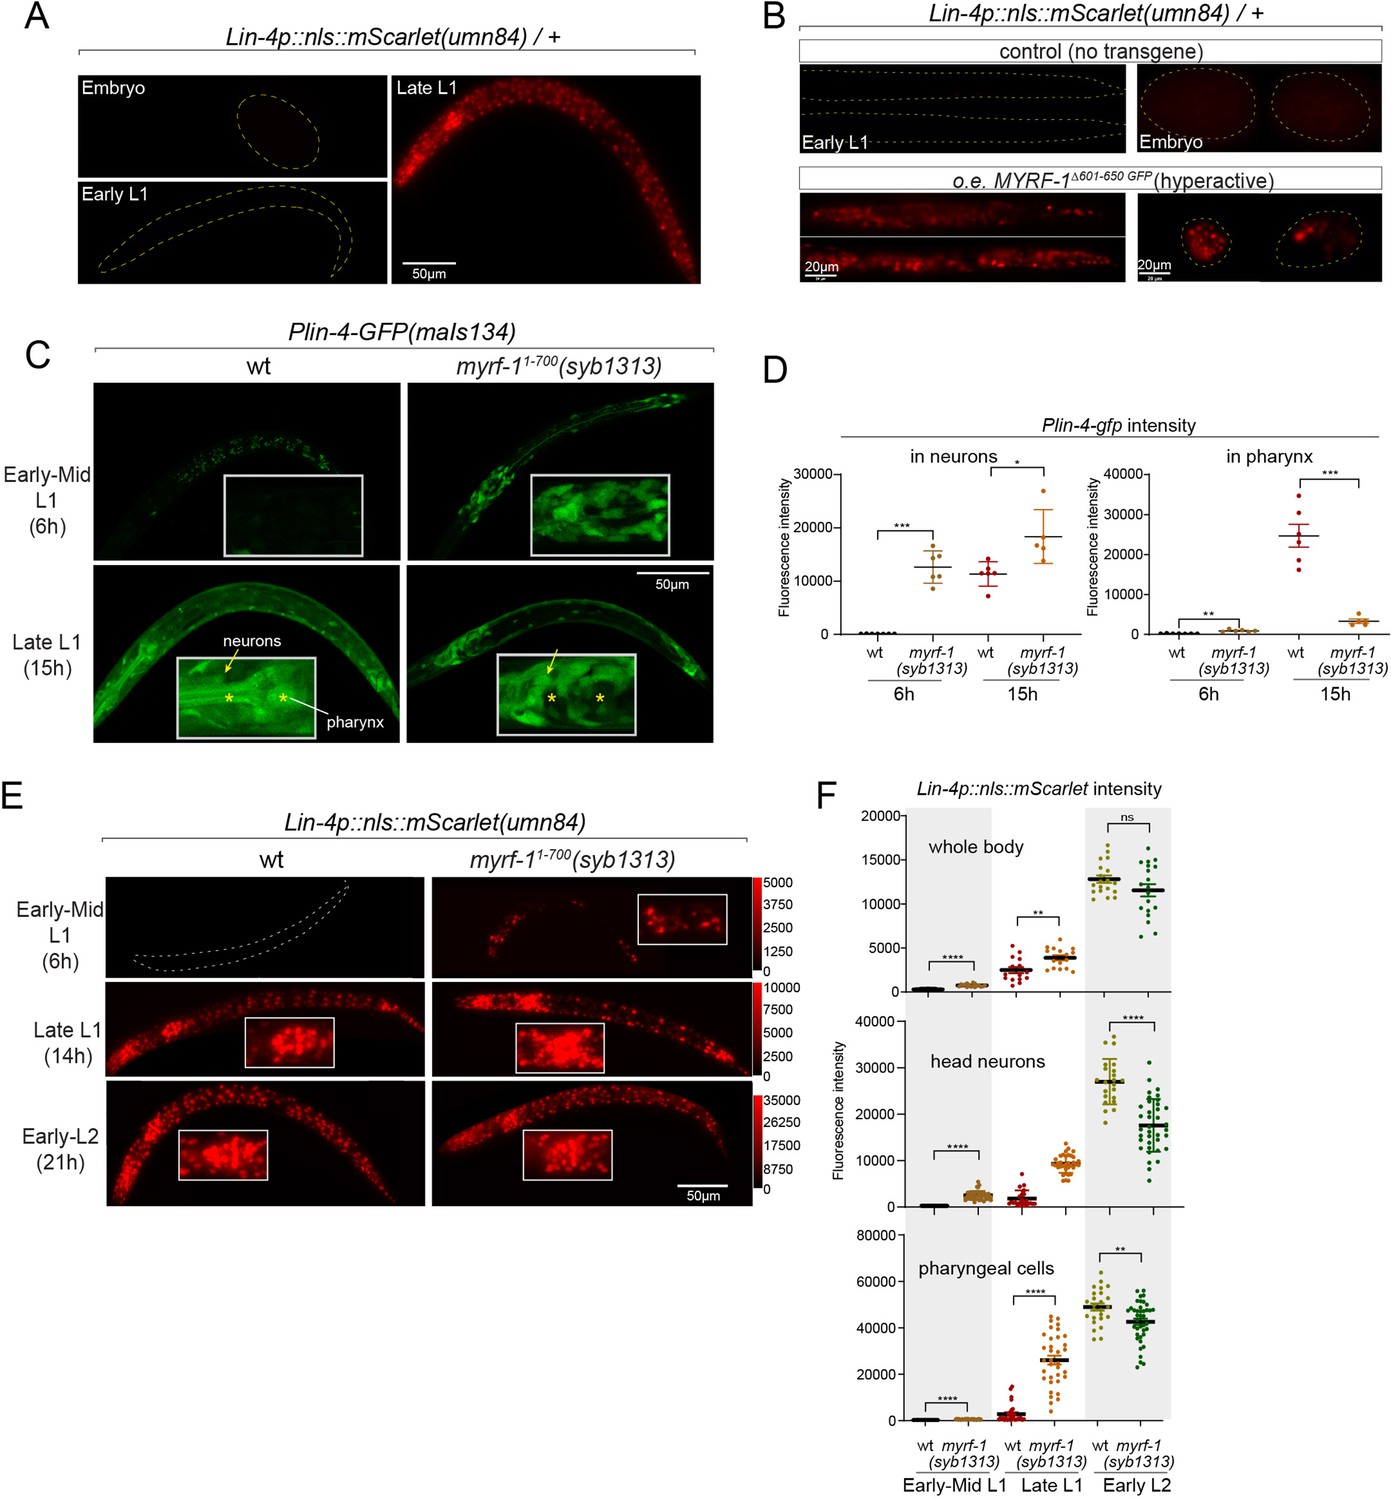
Hyperactive MYRF-1 drives premature expression of lin-4.
(A). The reporter of lin-4 transcription, labeled by endogenously inserted nls::mScarlet (umn84), which also produces a loss-of-function allele of lin-4. The fluorescence was not observed in embryos or early L1, but in late L1, confirming the previous reports.(B). Overexpression of a hyperactive MYRF-1 mutant, GFP::MYRF-1(delete 601–650) caused premature lin-4 transcription in embryos and early L1, labeled by lin-4p::nls::mScarlet.(C). The expression of Plin-4-GFP(maIs134) in wild-type and myrf-1(syb1313) mutants. At 6 hr, Plin-4-GFP expression is elevated in the neurons of myrf-1(syb1313) mutants but undetectable in wild-type. By late L1 (15 hr), Plin-4-GFP is upregulated in multiple tissues in wild-type. Although GFP expression is sustained in neurons (arrow) of the mutants, it is significantly weak or absent in the pharynx (asterisk) of the mutants.(D). The fluorescence intensity of the lin-4 transcriptional reporter (as displayed in (C)) was measured and presented as mean ± SEM (t-test, *p<0.05, **p<0.01, ***p<0.001). Each data point represents the mean intensity of the head neurons or pharynx region in individual animal, which were imaged using confocal microscopy. (Figure 5—source data 1).(E). The expression of lin-4p::nls::mScarlet(umn84) in wild-type and myrf-1(syb1313) mutants. At 6 hr, mScarlet expression is elevated in certain neurons of myrf-1(syb1313) mutants but undetectable in wild-type. By late L1 (14 hr), mScarlet is upregulated in multiple tissues in both wild-type and myrf-1(syb1313) mutants. The mutants exhibit stronger mScarlet signals than wild-type.(F). The fluorescence intensity of lin-4p::nls::mScarlet (as displayed in (E)) was measured and presented as mean ± SEM (t-test, *p<0.05, **p<0.01, ***p<0.001). The ROI for ‘whole body’ encompasses the entire body of the animal. The ROI of ‘in head neurons’ comprises multiple head neuron nuclei in each animal. The region of interest (ROI) for ‘in pharyngeal cells’ includes the 8–9 pharyngeal nuclei that exhibit strong mScarlet signals. Each data point represents the mean intensity of the ROI in individual animal. (Figure 5—source data 2).
-
Figure 5—source data 1
The detailed statistical analysis of the fluorescence intensity of the lin-4 transcriptional reporter(maIs134) in wild type and myrf-1(syb1313) mutant, as illustrated in Figure 5D.
- https://cdn.elifesciences.org/articles/89903/elife-89903-fig5-data1-v1.xlsx
-
Figure 5—source data 2
The detailed statistical analysis of the fluorescence intensity of lin-4p::nls::mScarlet in wild-type and myrf-1(syb1313) mutants, as illustrated in Figure 5F.
- https://cdn.elifesciences.org/articles/89903/elife-89903-fig5-data2-v1.xlsx
Figure 6 with 2 supplements
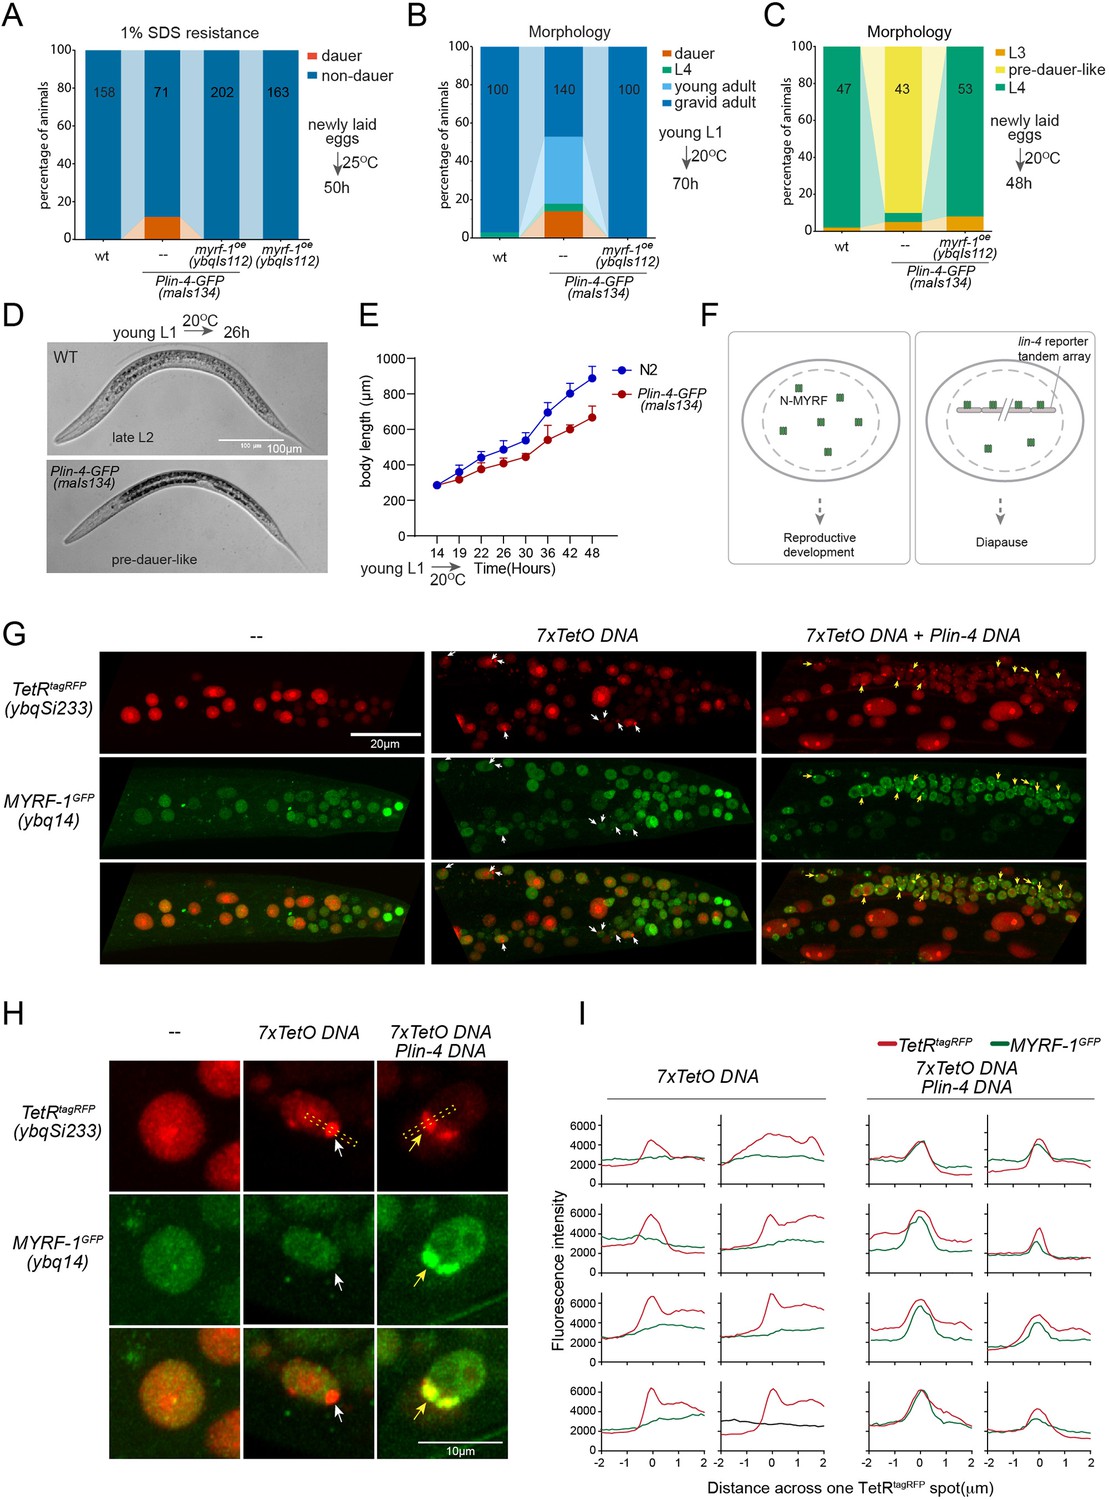
lin-4 promoter DNA recruits MYRF-1 protein in vivo.
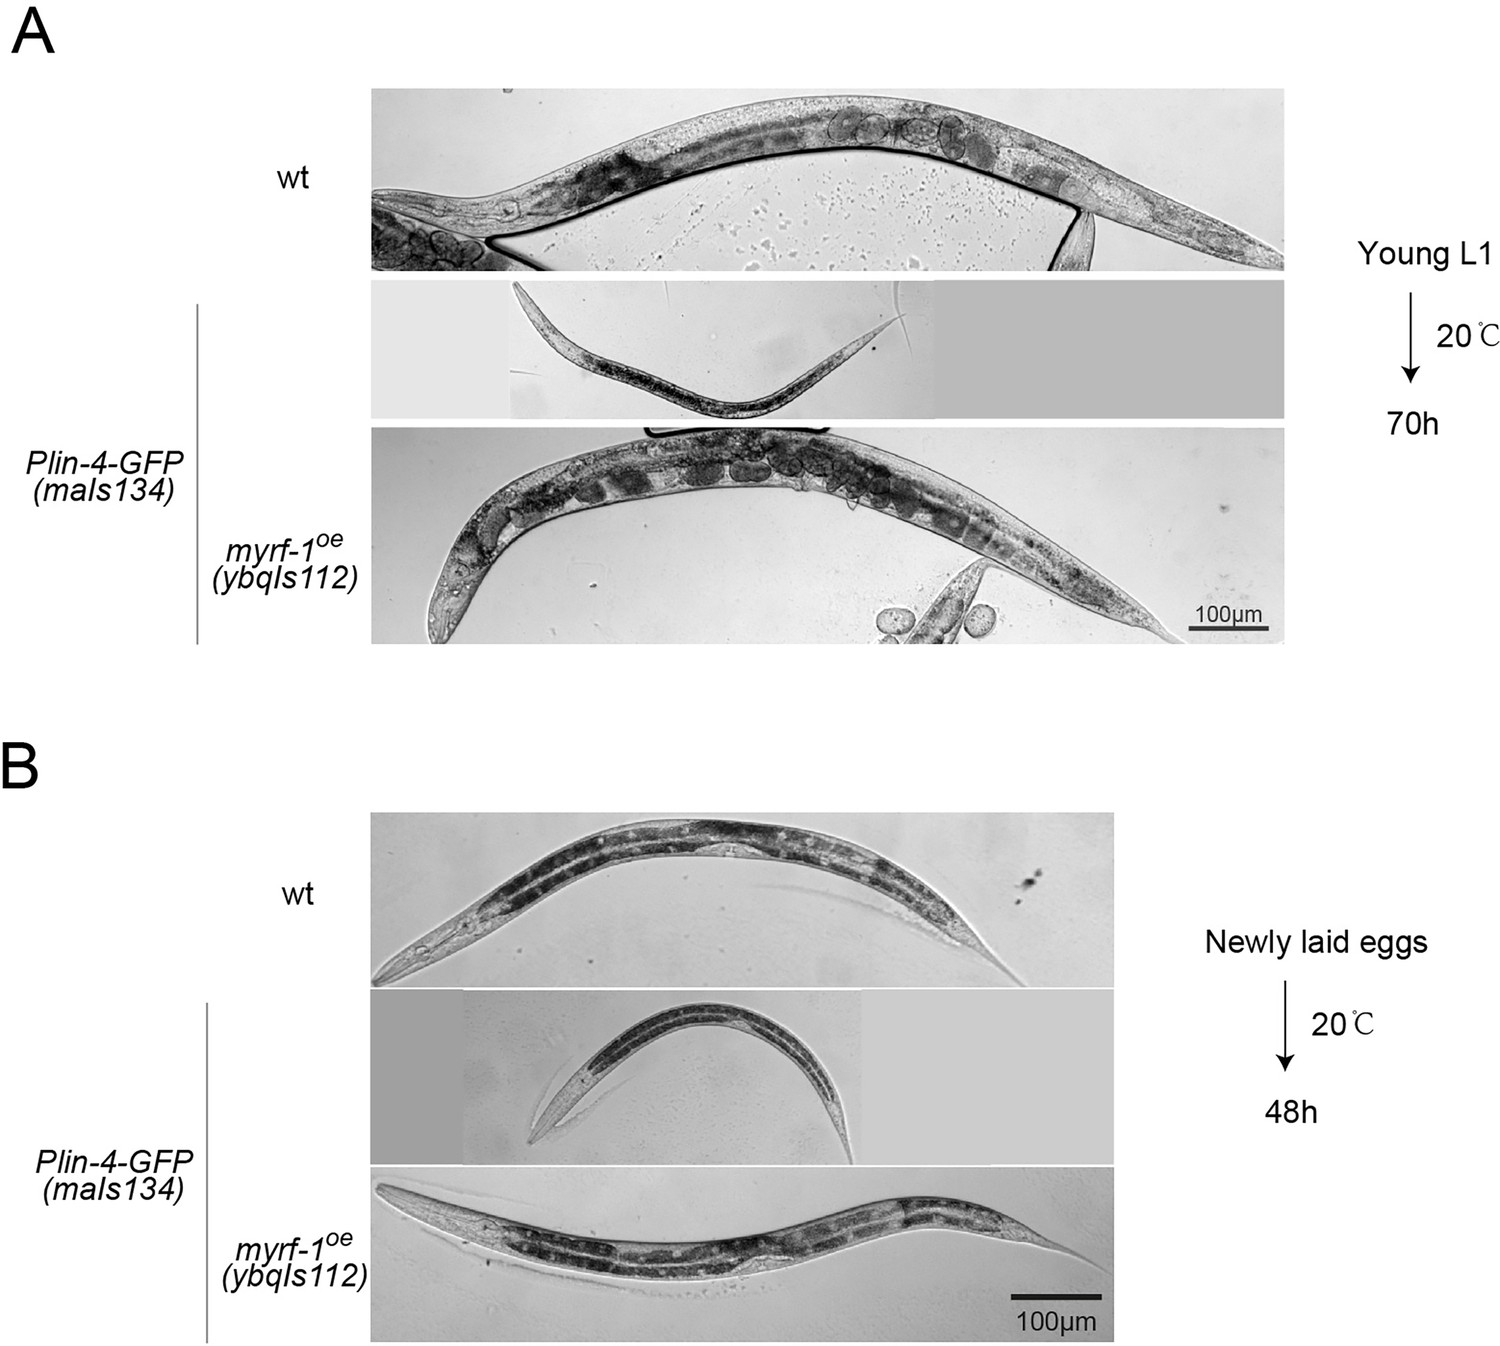
(A) A subset of animals carrying the maIs134 transgene constitutive dauer formation when food is still available on culture plates. Dauer formation was assessed by treating the animals with 1% SDS for 20 min. MYRF-1 overexpression (ybqIs112) suppresses the constitutive dauer formation in maIs134. Animals were cultured at 25 °C for 50 hr starting from freshly laid eggs. The number of animals analyzed is indicated on each bar. (Figure 6—source data 1). (B) Morphological assessment shows that a subpopulation of animals carrying the maIs134 transgene becomes dauer larvae, which exhibit a lean body and darkened intestine (Figure 3). MYRF-1 overexpression (ybqIs112) suppresses the constitutive dauer formation in maIs134. Animals were cultured at 20 °C for 70 hr starting from young L1. The number of animals analyzed is indicated on each bar. (Figure 6—source data 2). (C) The development of maIs134 is delayed compared to wild-type animals. with the majority of maIs134 animals exhibiting pre-dauer-like characteristics while most of the wild-type animals become L4. Animals were cultured at 20 °C for 48 hr starting from freshly laid eggs. (Figure 6—source data 3). (D) Representative images of animals from experiments in C. At 26 hr maIs134 animals are thinner than wild-type and have dark intestinal granules, which are characteristic of pre-dauer (L2d). (E) Measurements of body length of wild-type and maIs134 animals show a growth delay in maIs134 starting from L2. The mean body length of analyzed animals at a series of time points is shown on the graph, with the mean ± SD indicated. (Figure 6—source data 4). (F) A hypothetical model suggests that the tandem DNA array of the lin-4 promoter sequesters the MYRF protein, resulting in a decreased availability of MYRF to regulate its normal transcription targets. (G) A tandem DNA array containing lin-4 promoter (2.4 kb) DNA causes puncta of GFP::MYRF-1(ybq14) in the nucleus. As a control, a 7xTetO sequence-containing DNA array causes the puncta formation of TetR::tagRFP(ybqSi233) (white arrows), while it does not cause the aggregation of GFP::MYRF-1. Only the addition of lin-4 promoter DNA causes the formation of GFP::MYRF-1 puncta (yellow arrows). (H) Representative images of animal cells carrying transgenes described in G, but in a high magnification view. (I) Line plots of signal intensity measurements along the bar ROI drawn across one red punctum in images, examples of which were shown in H. The bar region of interest (ROI) is centered at the fluorescent spot and examples of bar ROI were shown in H. Each individual panel represents signals from one cell. (Figure 6—source data 5).
-
Figure 6—source data 1
Measurements of the percentage of 1% SDS-resistant dauers for wild-type, maIs134, myrf-1(ybqIs112), and maIs134;myrf-1(ybqIs112) animals cultured at 25 °C for 50 hours, starting from freshly laid eggs, as illustrated in Figure 6A.
- https://cdn.elifesciences.org/articles/89903/elife-89903-fig6-data1-v1.xlsx
-
Figure 6—source data 2
Assessments of developmental stages for wild-type, maIs134, and maIs134;myrf-1(ybqIs112) animals at 70 hours post-hatching at 20 °C, as illustrated in Figure 6B.
- https://cdn.elifesciences.org/articles/89903/elife-89903-fig6-data2-v1.xlsx
-
Figure 6—source data 3
Assessments of developmental stages for wild-type, maIs134, and maIs134;myrf-1(ybqIs112) animals cultured at 20 °C for 48 hours, starting from freshly laid eggs, as illustrated in Figure 6C.
- https://cdn.elifesciences.org/articles/89903/elife-89903-fig6-data3-v1.xlsx
-
Figure 6—source data 4
Measurements of body length for wild-type and maIs134 animals at various stages, as illustrated in Figure 6E.
- https://cdn.elifesciences.org/articles/89903/elife-89903-fig6-data4-v1.xlsx
-
Figure 6—source data 5
The detailed statistical analysis of the fluorescence intensity for the GFP::MYRF-1 and tetR::RFP fluorescent spots, as illustrated in Figure 6I.
- https://cdn.elifesciences.org/articles/89903/elife-89903-fig6-data5-v1.xlsx
Figure 6—figure supplement 1
Constitutive dauer phenotype observed in a subpopulation of Plin-4-GFP(maIs134) animals.
(A) Representative images of animals from the experiments in Figure 6B, which were cultured at 20 °C for 70 hr, starting from synchronized young L1 larvae. About 10% of the animals carrying the maIs134 transgene exhibited a constitutive dauer phenotype even when food was not depleted on the culture plate. (B) Representative images from the experiments shown in Figure 6C–E, featuring animals cultured at 20 °C for 48 hr from the time they were newly laid eggs. Over 90% of the animals bearing the maIs134 transgene displayed slow growth and pre-dauer-like morphology, characterized by a longer and darker body than a typical L2.
Figure 6—figure supplement 2
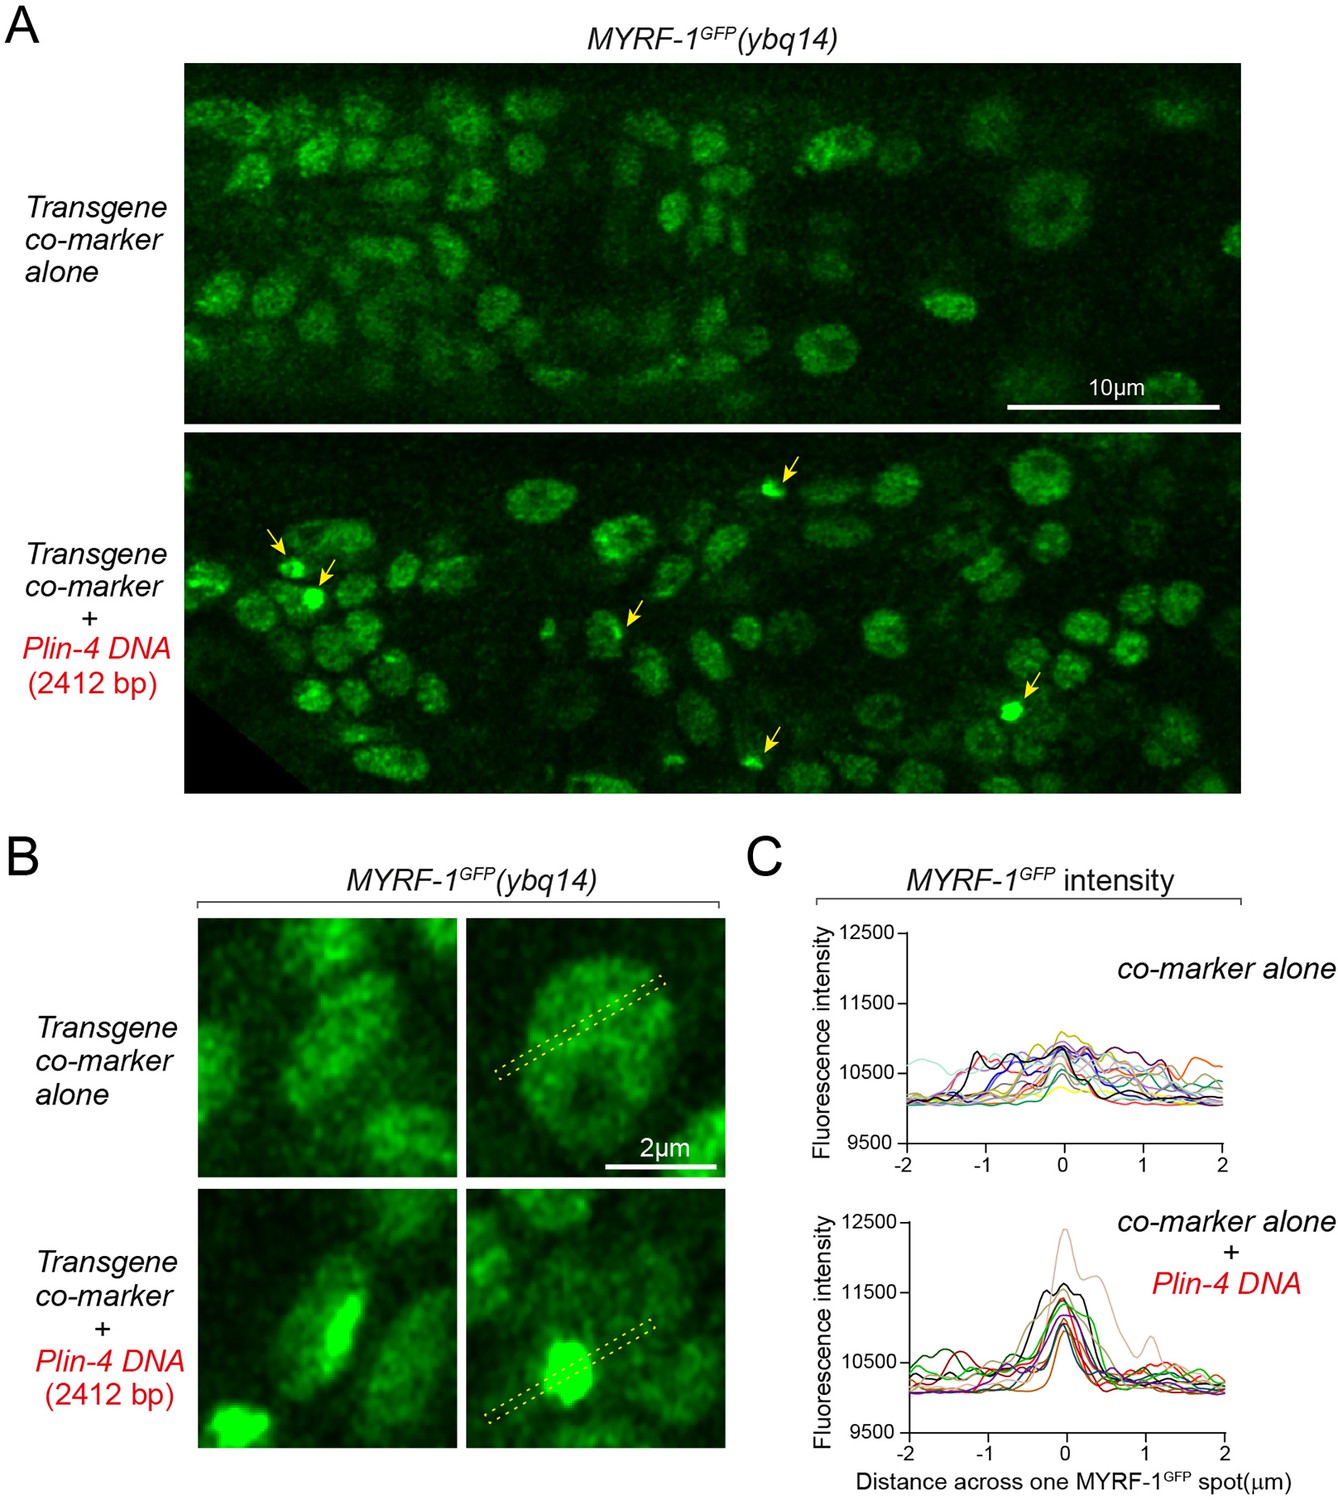
lin-4 promoter DNA causes aggregation of GFP::MYRF-1(ybq14) in the nucleus.
(A) Tandem DNA arrays containing lin-4 promoter (2.4 kb) DNA caused aggregation of GFP::MYRF-1(ybq14) in the nucleus (arrow), while a control co-marker (Pmyo-2-mCherry) containing DNA array did not cause the aggregation of GFP::MYRF-1. (B) Representative images of animal cells carrying transgenes described in A, but in a high magnification view. (C). Line plots of signal intensity measurement along the bar region of interest (ROI) drawn across the GFP spots as illustrated in representative images in B. The bar ROI is centered at one fluorescent punctum. Each individual line represents signals from one representative cell. Examples of bar ROI were drawn on the images in B. (Figure 6—figure supplement 2—source data 1).
-
Figure 6—figure supplement 2—source data 1
The detailed statistical analysis of the fluorescence intensity for the bar ROI drawn across the GFP::MYRF-1 spots, as illustrated in Figure 6—figure supplement 2C.
- https://cdn.elifesciences.org/articles/89903/elife-89903-fig6-figsupp2-data1-v1.xlsx
Figure 7
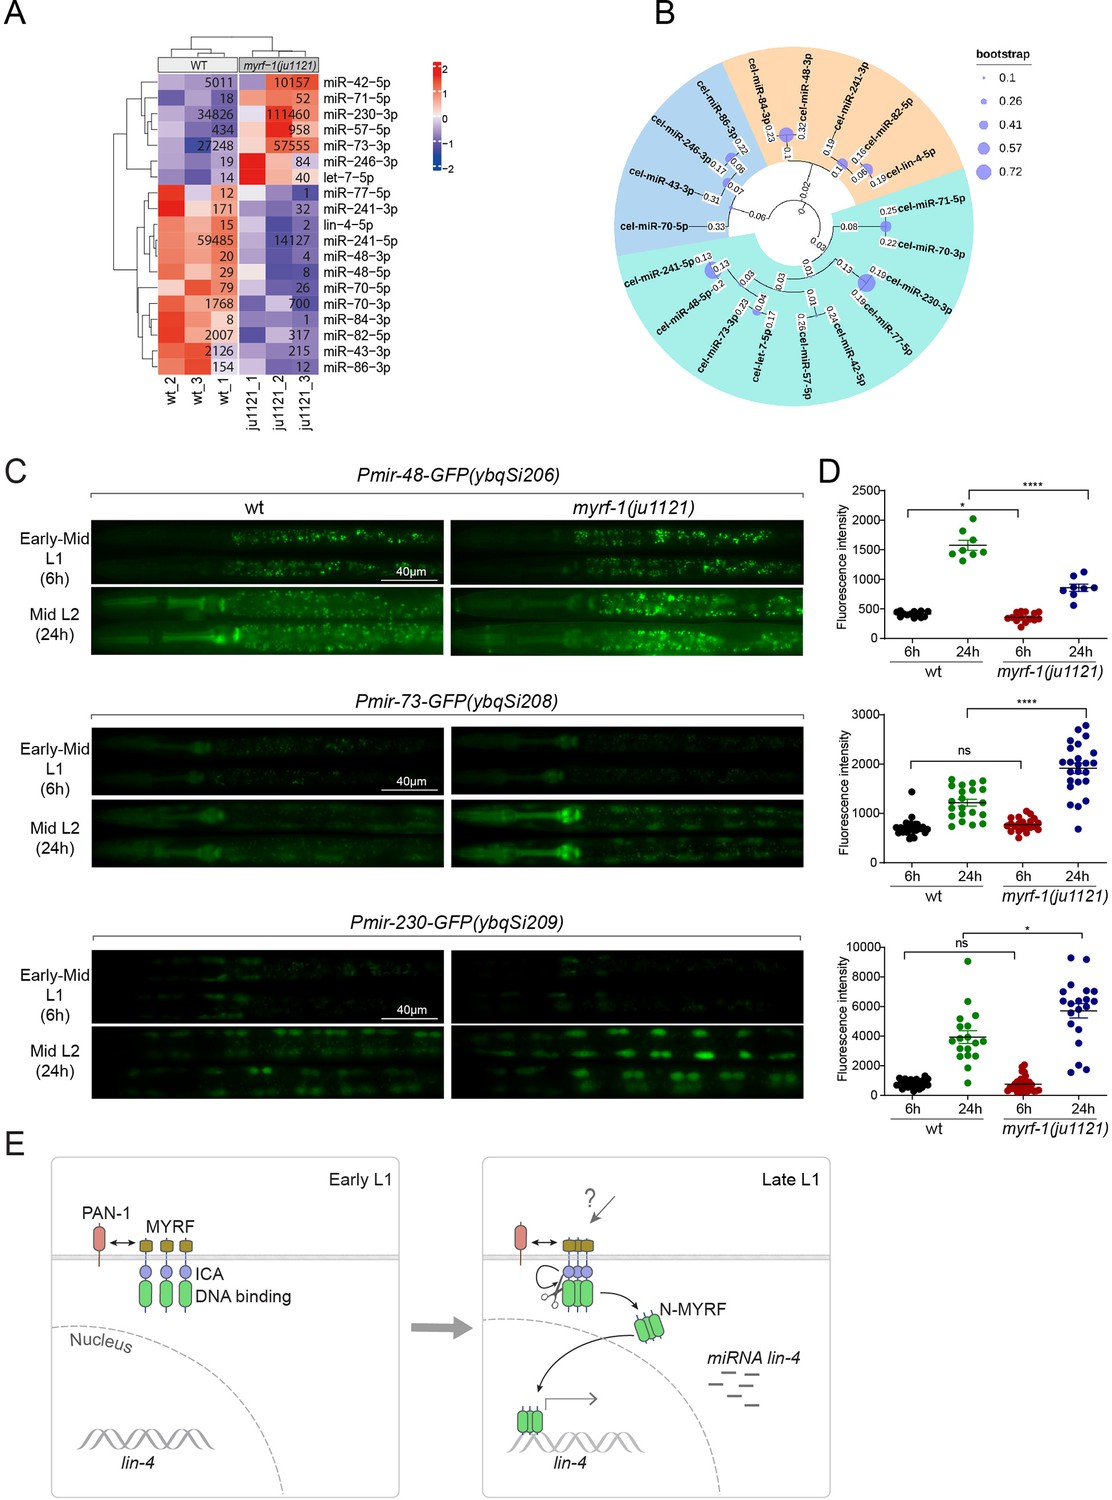
MYRF-1 regulates a selective subset of microRNAs during L1-L2 transition.
(A) The heatmap displays hierarchically clustered differentially expressed miRNAs between wild-type and myrf-1(ju1121) animals (p<0.05) at the late L1 stage. It is generated from rlog-transformed TPM (Transcripts Per Million) values of miRNA-seq data, followed by scaling using z-scores per gene (row). In the heatmap, red indicates increased expression, while blue denotes decreased expression. The displayed numbers are the average TPM values for each specific miRNA, calculated from three replicates. (Figure 7—source data 1). (B) The phylogenetic analysis shows the relationship between differentially expressed miRNA genes in myrf-1(ju1121). The three branches are color-coded.(C) The expression of transcriptional reporters, Pmir-48-gfp(ybqSi206), Pmir-73-gfp(ybqSi208), and Pmir-230-gfp(ybqSi209) in wild-type and myrf-1(ju1121) animals at early-mid L1 (6 hr) and middle L2 (24 hr) is shown. (D) The fluorescence intensity of transcriptional reporters shown in (C) is quantified and presented as mean ± SEM (t-test: ns, not significant, *p<0.05, ****p<0.0001). (Figure 7—source data 2). (E) An illustration of how MYRF is processed and promotes lin-4 expression during development. At early L1, MYRF is mainly localized to the cell membrane in a PAN-1-dependent manner. However, during late L1, N-MYRF is released from the membrane through the catalytic activity of the ICE (Intramolecular Chaperone of Endosialidase) domain following its trimerization. Subsequently, N-MYRF translocates to the nucleus to enhance the transcription of lin-4.
-
Figure 7—source data 1
The source data for microRNA read counts, as illustrated in Figure 7A.
- https://cdn.elifesciences.org/articles/89903/elife-89903-fig7-data1-v1.xlsx
-
Figure 7—source data 2
The detailed statistical analysis of the fluorescence intensity for the mir-48, mir-73, and mir-230 transcriptional reporters is illustrated in Figure 7D.
- https://cdn.elifesciences.org/articles/89903/elife-89903-fig7-data2-v1.xlsx
Tables
Key resources table
| Reagent type (species) or resource | Designation | Source or reference | Identifiers | Additional information |
|---|---|---|---|---|
| Gene (Caenorhabditis elegans) | myrf-1 | WormBase Gene ID | WBGene00004134 | other name: pqn-47 |
| Gene (Caenorhabditis elegans) | myrf-2 | WormBase Gene ID | WBGene00008999 | |
| Gene (Caenorhabditis elegans) | pan-1 | WormBase Gene ID | WBGene00003915 | |
| Gene (Caenorhabditis elegans) | lin-4 | WormBase Gene ID | WBGene00002993 | |
| Gene (Caenorhabditis elegans) | mir-48 | WormBase Gene ID | WBGene00003039 | |
| Gene (Caenorhabditis elegans) | mir-73 | WormBase Gene ID | WBGene00003301 | |
| Gene (Caenorhabditis elegans) | mir-230 | WormBase Gene ID | WBGene00003323 | |
| Chemical compound, drug | G418 | BBI LIFE SCIENCES | A600958-0001 | 25 mg/mL |
| Commercial assay or kit | ClonExpress II One Step Cloning | Vazyme Biotech Co., Ltd | C112-01 | |
| Commercial assay or kit | FastPure Plasmid Mini Kit | Vazyme Biotech Co., Ltd | DC201-01 | |
| Commercial assay or kit | Taqman microRNA RT kit | ThermoFisher | 4366596 | |
| Commercial assay or kit | TAKARA RNA reverse transcription kit | TAKARA | 6110 A | |
| Strain, strain background (Caenorhabditis elegans) | lin-4(umn84[lin-4p::SL1::EGL-13NLS::lox2272::mScarlet-I::cMycNLS::Lox511I::let-858 3'UTR::lox2722])/mIn1[dpy-10(e128) umnIs33] II. | Caenorhabditis Genetics Center | CGC177 | Figure 2C–H, Figure 2—figure supplement 2, Figure 2—figure supplement 3A–D, Figure 5A, B, E and F |
| Strain, strain background (Caenorhabditis elegans) | unc-119(ed3) III; lin-4p::GFP +unc-119(+)(maIs134). | Caenorhabditis Genetics Center | VT1072 | Figure 2A–B, Figure 4A, Figure 5C–D, Figure 6A–D, Figure 2—figure supplement 1, Figure 6—figure supplement 1 |
| Strain, strain background (Caenorhabditis elegans) | lin-14::GFP(cc2841) X. | Caenorhabditis Genetics Center | PD1301 | Figure 3A–B |
| Strain, strain background (Caenorhabditis elegans) | GFP::pqn-47::3xFlag(ybq14) II; glo-1(zu391). | This paper; The Yingchuan B. Qi Laboratory | BLW1827 | Figure 1A–B, Figure 6—figure supplement 2A–C |
| Strain, strain background (Caenorhabditis elegans) | myrf-1(ju1121) / mIn1 II; lin-4p::GFP +unc-119(+)(maIs134). | This paper; The Yingchuan B. Qi Laboratory | BLW1424 | Figure 2A–B, Figure 4A |
| Strain, strain background (Caenorhabditis elegans) | myrf-1(ju1121) II / [mIs14 dpy-10(e128)](mIn1) II; lin-14::GFP(cc2841) X. | This paper; The Yingchuan B. Qi Laboratory | BLW1410 | Figure 3A–B |
| Strain, strain background (Caenorhabditis elegans) | lin-4(umn84[lin-4p::SL1::EGL-13NLS::lox2272::mScarlet-I::cMycNLS::Lox511I::let-858 3'UTR::lox2722]) II myrf-1(ybq6) II /mIn1[dpy-10(e128) umnIs33] II. | This paper; The Yingchuan B. Qi Laboratory | BLW2284 | Figure 2C–D, Figure 2—figure supplement 3A |
| Strain, strain background (Caenorhabditis elegans) | lin-4(umn84[lin-4p::SL1::EGL-13NLS::lox2272::mScarlet-I::cMycNLS::Lox511I::let-858 3'UTR::lox2722]) II myrf-1(ybq6) II /mIn1[dpy-10(e128) umnIs33] II; myrf-2(ybq42) X. | This paper; The Yingchuan B. Qi Laboratory | BW2285 | Figure 2C–D, Figure 2—figure supplement 3A |
| Strain, strain background (Caenorhabditis elegans) | lin-4 umn84[lin-4p::SL1::EGL-13NLS::lox2272::mScarlet-I::cMycNLS::Lox511I::let-858 3'UTR::lox2722 / dpy-10(e128)(mT1) II, III; pan-1(gk142) III / dpy-10(e128), Pmyo-2-mCherry_chr_2(mT1-mCherry#2) III. | This paper; The Yingchuan B. Qi Laboratory | BLW2300 | Figure 2G–H, Figure 2—figure supplement 3B |
| Strain, strain background (Caenorhabditis elegans) | lin-4(umn84[lin-4p::SL1::EGL-13NLS::lox2272::mScarlet-I::cMycNLS::Lox511I::let-858 3'UTR::lox2722]) II /mIn1[dpy-10(e128) umnIs33] II; myrf-2(ybq42) X. | This paper; The Yingchuan B. Qi Laboratory | BLW2385 | Figure 2C–D, Figure 2—figure supplement 3A |
| Strain, strain background (Caenorhabditis elegans) | lin-4(umn84[lin-4p::SL1::EGL-13NLS::lox2272::mScarlet-I::cMycNLS::Lox511I::let-858 3'UTR::lox2722]) II myrf-1(ju1121) II /mIn1[dpy-10(e128) umnIs33] II. | This paper; The Yingchuan B. Qi Laboratory | BLW2236 | Figure 2E–F, Figure 2—figure supplement 3C–D |
| Strain, strain background (Caenorhabditis elegans) | lin-4(umn84[lin-4p::SL1::EGL-13NLS::lox2272::mScarlet-I::cMycNLS::Lox511I::let-858 3'UTR::lox2722]) II myrf-1(ybq1313) II /mIn1[dpy-10(e128) umnIs33] II. | This paper; The Yingchuan B. Qi Laboratory | BLW2237 | Figure 5E–F |
| Strain, strain background (Caenorhabditis elegans) | myrf-1(ju1121) II / [mIs14 dpy-10(e128)](mIn1) II; lin-4p::GFP +unc-119(+)(maIs134); Pmyo-3-MYRF-1(ybqEx746). | This paper; The Yingchuan B. Qi Laboratory | BLW1579 | Figure 4A |
| Strain, strain background (Caenorhabditis elegans) | myrf-1(ju1121) II / [mIs14 dpy-10(e128)](mIn1) II; lin-4p::GFP +unc-119(+)(maIs134); Pdpy-7-GFP::MYRF-1(ybqEx721). | This paper; The Yingchuan B. Qi Laboratory | BLW1580 | Figure 4A |
| Strain, strain background (Caenorhabditis elegans) | gfp::myrf-1(LoxP) (ybq98) II. | This paper; The Yingchuan B. Qi Laboratory | BLW1934 | Figure 4B–E |
| Strain, strain background (Caenorhabditis elegans) | gfp::myrf-1(LoxP)(ybq98) / [mIs14 dpy-10(e128)](mIn1) II; Pdpy-7-NLS::Cre(tmIs1028); lin-4p::GFP +unc-119(+)(maIs134). | This paper; The Yingchuan B. Qi Laboratory | BLW2020 | Figure 4B–E |
| Strain, strain background (Caenorhabditis elegans) | GFP::MYRF-1 (1–700)::3xFlag(syb1313) II / [mIs14 dpy-10(e128)](mIn1) II; lin-4p::GFP +unc-119(+)(maIs134). | This paper; The Yingchuan B. Qi Laboratory | BLW2037 | Figure 5C–D |
| Strain, strain background (Caenorhabditis elegans) | Ppqn-47-LoxP-NLS::tagRFP::T2A::pqn-47-LoxP(ybqIs112) V. | This paper; The Yingchuan B. Qi Laboratory | BLW1235 | Figure 6A |
| Strain, strain background (Caenorhabditis elegans) | lin-4p::GFP +unc-119(+)(maIs134); Ppqn-47-LoxP-NLS::tagRFP::T2A::pqn-47-LoxP(ybqIs112) V. | This paper; The Yingchuan B. Qi Laboratory | BLW2172 | Figure 6A–C, Figure 6—figure supplement 1A–B |
| Strain, strain background (Caenorhabditis elegans) | GFP::pqn-47::3xFlag(ybq14) II, glo-1(zu391), Prpl-28-tetR-tagRFP (ybqSi233). | This paper; The Yingchuan B. Qi Laboratory | BLW2170 | Figure 6G–I |
| Strain, strain background (Caenorhabditis elegans) | Prpl-28-tetR-tagRFP (ybqSi233). | This paper; The Yingchuan B. Qi Laboratory | BLW2168 | Cross with BLW1827 |
| Strain, strain background (Caenorhabditis elegans) | Pmir-48-GFP(ybqSi206). | This paper; The Yingchuan B. Qi Laboratory | BLW2113 | Figure 7C–D |
| Strain, strain background (Caenorhabditis elegans) | Pmir-73-GFP(ybqSi208). | This paper; The Yingchuan B. Qi Laboratory | BLW2115 | Figure 7C–D |
| Strain, strain background (Caenorhabditis elegans) | Pmir-230-GFP(ybqSi209). | This paper; The Yingchuan B. Qi Laboratory | BLW2116 | Figure 7C–D |
| Strain, strain background (Caenorhabditis elegans) | myrf-1(ju1121) II / [mIs14 dpy-10(e128)](mIn1) II, Pmir-48-GFP(ybqSi206). | This paper; The Yingchuan B. Qi Laboratory | BLW2181 | Figure 7C–D |
| Strain, strain background (Caenorhabditis elegans) | myrf-1(ju1121) II / [mIs14 dpy-10(e128)](mIn1) II, Pmir-73-GFP(ybqSi208). | This paper; The Yingchuan B. Qi Laboratory | BLW2182 | Figure 7C–D |
| Strain, strain background (Caenorhabditis elegans) | myrf-1(ju1121) II / [mIs14 dpy-10(e128)](mIn1) II, Pmir-230-GFP(ybqSi209). | This paper; The Yingchuan B. Qi Laboratory | BLW2183 | Figure 7C–D |
| Strain, strain background (Caenorhabditis elegans) | gfp::myrf-1 (1–656)(syb1468) II / [mIs14 dpy-10(e128)](mIn1) II; lin-4p::GFP +unc-119(+)(maIs134) | This paper; The Yingchuan B. Qi Laboratory | BLW2184 | Figure 2—figure supplement 1A–B |
| Strain, strain background (Caenorhabditis elegans) | gfp::myrf-1 (1–482)(syb1491) II / [mIs14 dpy-10(e128)](mIn1) II; lin-4p::GFP +unc-119(+)(maIs134) | This paper; The Yingchuan B. Qi Laboratory | BLW2035 | Figure 2—figure supplement 1A–B |
| Strain, strain background (Caenorhabditis elegans) | gfp::degron::myrf-1::3xflag(ybq133) II; eft-3p::TIR::F2A:mTagBFP2::AID*::NLS::tbb-2 3'UTR(wrdSi23) I; lin-4p::GFP +unc-119(+)(maIs134) | This paper; The Yingchuan B. Qi Laboratory | BLW2157 | Figure 2—figure supplement 4A–B |
| Recombinant DNA reagent | Pmyo-3-MYRF-1 | This paper; The Yingchuan B. Qi Laboratory | pQA1094 | Figure 4A |
| Recombinant DNA reagent | Pdpy-7-MYRF | This paper; The Yingchuan B. Qi Laboratory | pQA1511 | Figure 4A |
| Recombinant DNA reagent | Peft-3-Cas9 U6-myrf-1 sgRNA (for cut MYRF-1 211 K) | This paper; The Yingchuan B. Qi Laboratory | pQA1685 | sgRNA plasmid for constructing BLW1934 [gfp::myrf-1(LoxP) (ybq98)] |
| Recombinant DNA reagent | Peft-3-Cas9 U6-myrf-1 sgRNA (for cut MYRF-1 201 V) | This paper; The Yingchuan B. Qi Laboratory | pQA1686 | sgRNA plasmid for constructing BLW1934 [gfp::myrf-1(LoxP) (ybq98)] |
| Recombinant DNA reagent | myrf-1 LoxP knock-in repair template in pCR8 | This paper; The Yingchuan B. Qi Laboratory | pQA1688 | repair template plasmid for constructing BLW1934 [gfp::myrf-1(LoxP) (ybq98)] |
| Recombinant DNA reagent | Prpl-28-GFP-myrf-1 (1–931 delete 601–650 Ce) | This paper; The Yingchuan B. Qi Laboratory | pQA1922 | Figure 5B |
| Recombinant DNA reagent | Prpl-28-tetR-tagRFP in_miniMos | This paper; The Yingchuan B. Qi Laboratory | pQA1896 | plasmid for constructing BLW2168 [Prpl-28-tetR-tagRFP (ybqSi233)] |
| Recombinant DNA reagent | 7x-TetO | This paper; The Yingchuan B. Qi Laboratory | pQA1961 | Figure 6G–I |
| Recombinant DNA reagent | Plin-4(2412 bp) -unc-54–3'UTR-7x-TetO | This paper; The Yingchuan B. Qi Laboratory | pQA1960 | Figure 6G–I |
| Recombinant DNA reagent | Plin-4(2412 bp) -unc-54–3'UTR | This paper; The Yingchuan B. Qi Laboratory | pQA1881 | Figure 6—figure supplement 2A–C |
| Recombinant DNA reagent | Pmir-48(2000 bp)-GFP in_miniMos | This paper; The Yingchuan B. Qi Laboratory | pQA1861 | plasmid for constructing BLW2114 |
| Recombinant DNA reagent | Pmir-73(2000 bp)-GFP in_miniMos | This paper; The Yingchuan B. Qi Laboratory | pQA1863 | plasmid for constructing BLW2115 |
| Recombinant DNA reagent | Pmir-230(1919 bp)-GFP in_miniMos | This paper; The Yingchuan B. Qi Laboratory | pQA1864 | plasmid for constructing BLW2116 |
| Recombinant DNA reagent | pGH8 Prab-3::mCherry | The Erik Jorgensen Laboratory | pGH8 | Co-marker plasmid for constructing single-copy integrated strain |
| Recombinant DNA reagent | pCFJ90 Pmyo-2::mCherry | The Erik Jorgensen Laboratory | pCFJ90 | Co-marker plasmid, Figure 6—figure supplement 2A–C |
| Recombinant DNA reagent | pCFJ601 Peft-3 Mos1 transposase | The Erik Jorgensen Laboratory | pCFJ601 | Co-marker plasmid for constructing single-copy integrated strain |
| Recombinant DNA reagent | PDD162 Peft-3-Cas9 & Empty sgRNA | The Bob Goldstein Laboratory | PDD162 | sgRNA plasmid template |
Additional files
Download links
A two-part list of links to download the article, or parts of the article, in various formats.
Downloads (link to download the article as PDF)
Open citations (links to open the citations from this article in various online reference manager services)
Cite this article (links to download the citations from this article in formats compatible with various reference manager tools)
Essential function of transmembrane transcription factor MYRF in promoting transcription of miRNA lin-4 during C. elegans development
eLife 12:RP89903.
https://doi.org/10.7554/eLife.89903.4


