Structural characterization of ligand binding and pH-specific enzymatic activity of mouse Acidic Mammalian Chitinase
- Department of Bioengineering and Therapeutic Sciences, University of California, San Francisco, United States
- Tetrad Graduate Program, University of California, San Francisco, United States
- Department of Pharmaceutical Chemistry, University of California, San Francisco, United States
- Cardiovascular Research Institute, University of California, San Francisco, United States
- Department of Biochemistry and Biophysics, University of California, San Francisco, United States
- Biophysics Graduate Program, University of California, San Francisco, United States
- Chemistry and Chemical Biology Graduate Program, University of California, San Francisco, United States
- Department of Chemistry and Chemical Biology, University of California, Merced, United States
- Department of Pathology and Immunology, Washington University School of Medicine in St Louis, United States
- Department of Medicine, University of California, San Francisco, United States
- Department of Microbiology and Immunology, University of California, San Francisco, United States
- University of California, Howard Hughes Medical Institute, San Francisco, United States
Figures
Figure 1 with 2 supplements
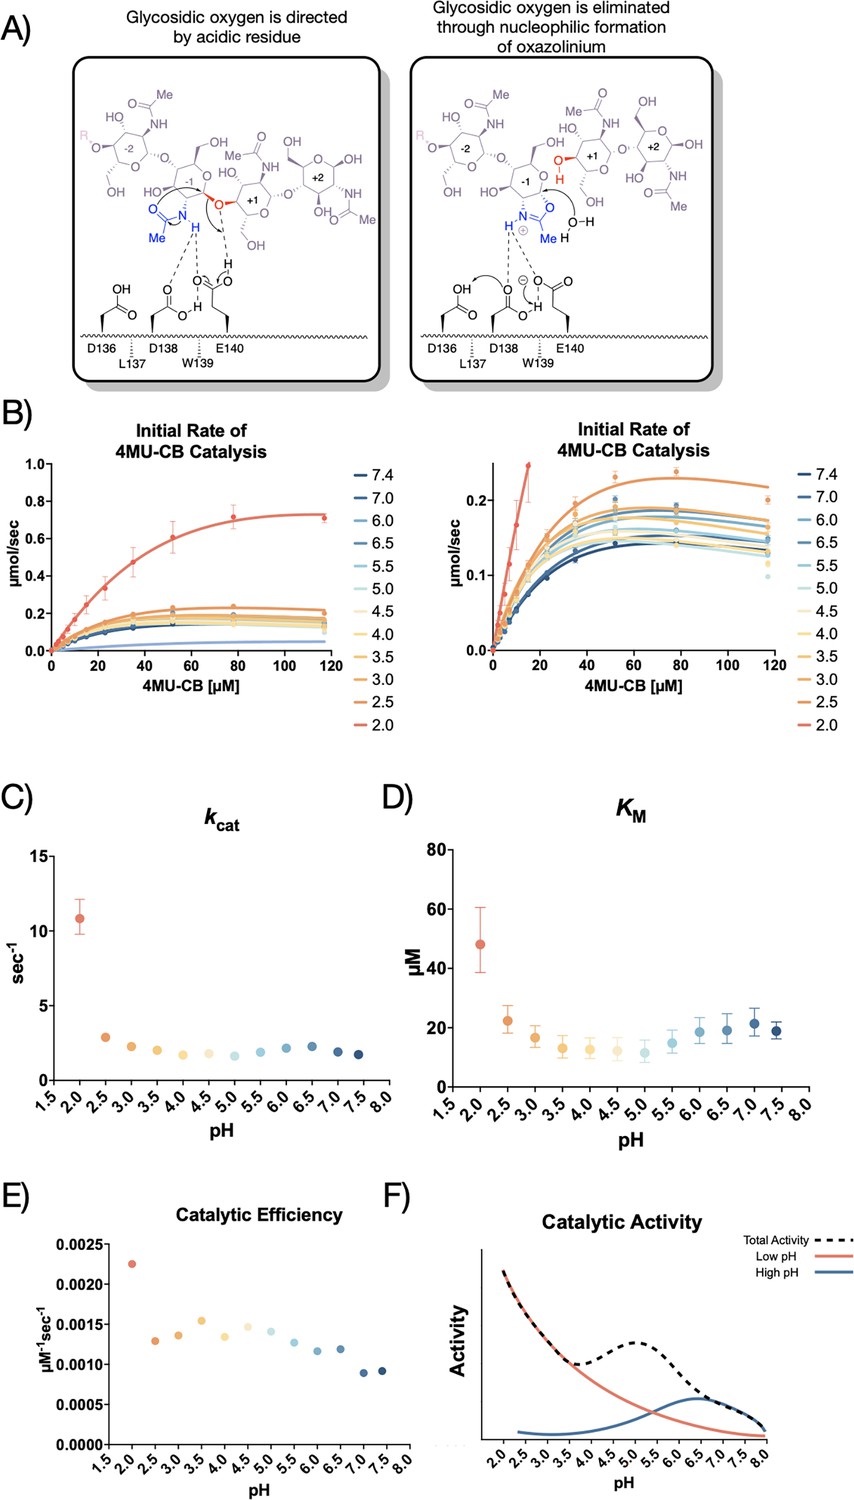
Kinetic properties of mAMCase catalytic domain at various pH.
(A) Chemical depiction of the conserved two-step mechanism where the glycosidic oxygen is protonated by an acidic residue and a nucleophile adds into the anomeric carbon leading to elimination of the hydrolyzed product. (B) The rate of 4MU-chitobioside catalysis (1 /s) by mAMCase catalytic domain is plotted as a function of 4MU-chitobioside concentration (µM). Each data point represents n=4 with error bars representing the standard deviation. Michaelis-Menten equation without substrate inhibition was used to estimate the kcat and KM from the initial rate of reaction at various substrate concentrations. (C) The rate of substrate turnover (1 /s) by mAMCase catalytic domain is plotted as a function of pH. Error bars represent the 95% confidence interval. (D) The Michaelis-Menten constant of mAMCase catalytic domain is plotted as a function of pH. Error bars represent the 95% confidence interval. (E) The catalytic efficiency (kcat/KM) of mAMCase catalytic domain is plotted as a function of pH. (F) Hypothetical catalytic activity modeled explained by a low pH mechanism (red), and high pH mechanism (blue) and their corresponding total activity (dashed line).
Figure 1—figure supplement 1
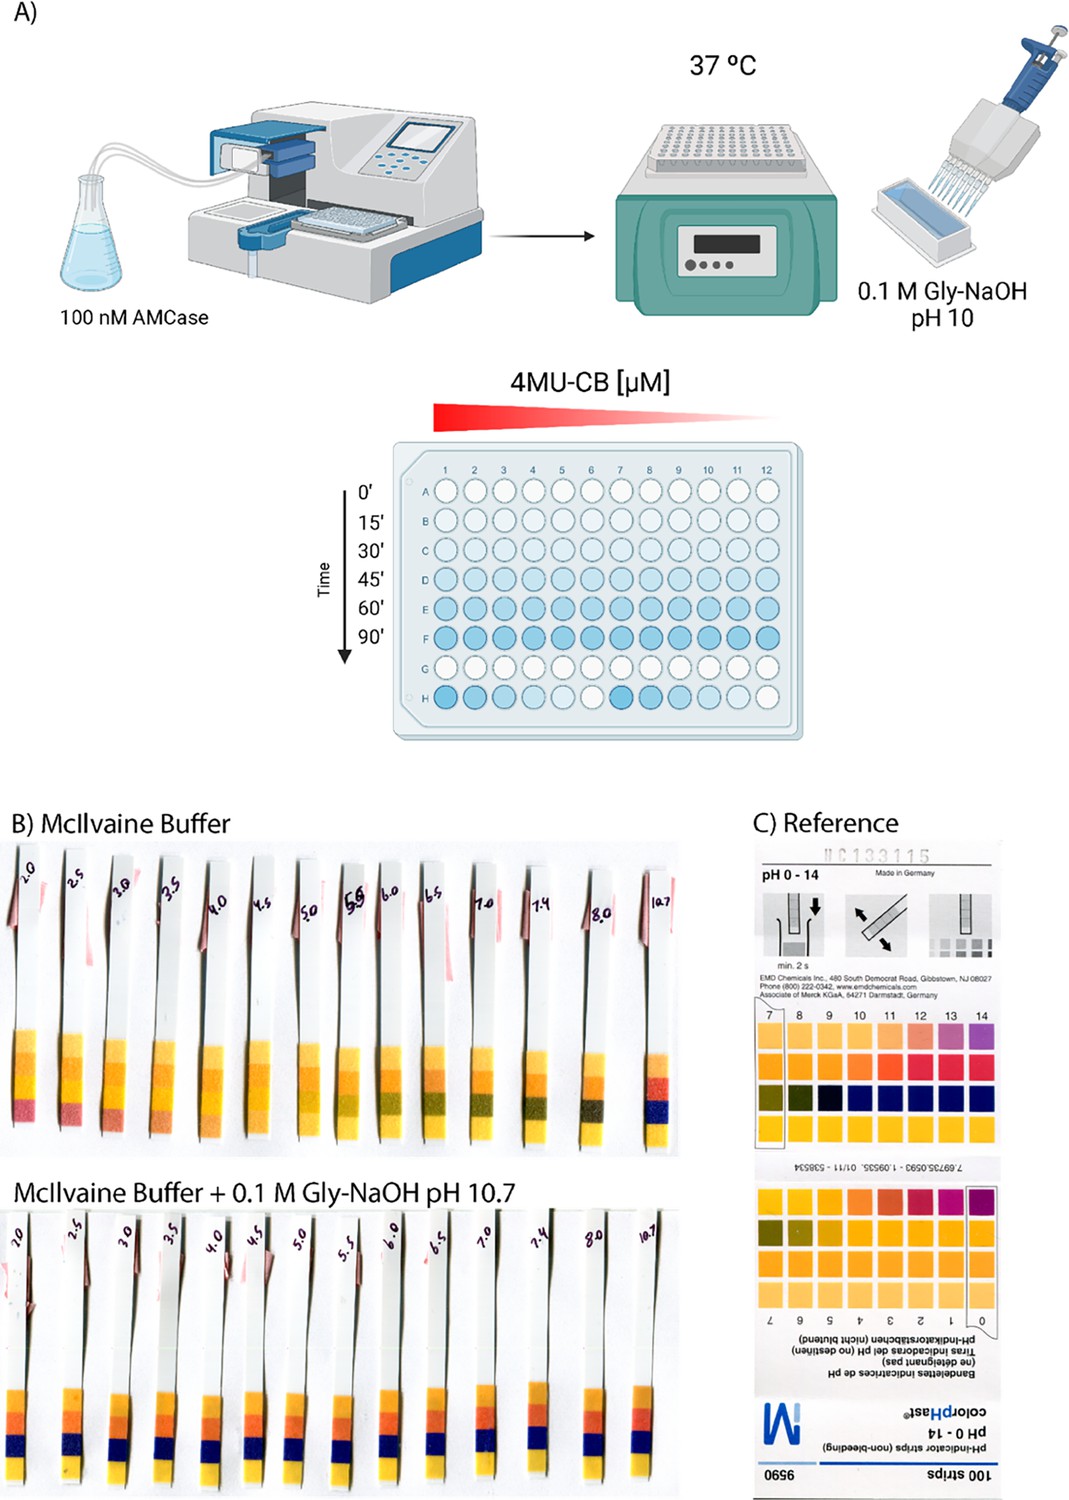
pH of reaction solution before and after quenching with 0.1 M Gly-NaOH pH 10.7.
(A) Schematic of modified endpoint 4MU-chitobioside assay. (B) Reaction pH before and after quenching with 0.1 M Gly-NaOH pH 10.7, and (C) a pH strip reference sheet.
Figure 1—figure supplement 2
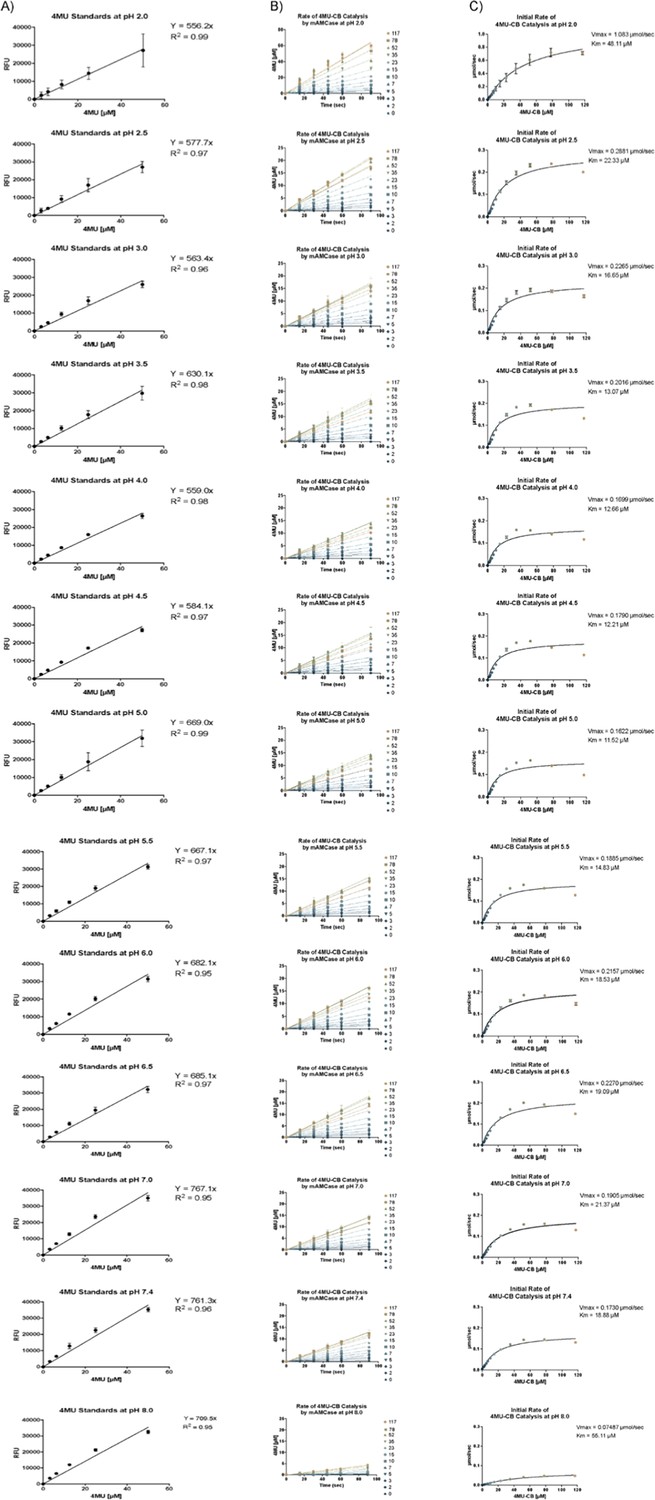
Kinetics of 4MU-chitobioside catalysis by mAMCase catalytic domain at various pH.
(A) A linear fit forced through Y=0 is used to generate the standard curve for converting RFU to 4MU [µM]. Each data point represents n=8 with error bars representing the standard deviation. (B) 4MU fluorescence (RFU) is plotted as a function of time (s). Each data point represents n=4 with error bars representing the standard deviation. A linear fit is applied to each concentration of 4MU-chitobioside to calculate an initial rate. RFU is converted to µM using a 4MU standard curve. (C) The rate of 4MU-chitobioside catalysis (1 /s) by mAMCase catalytic domain is plotted as a function of 4MU-chitobioside concentration (µM). Each data point represents n=4 with error bars representing the standard deviation. Michaelis-Menten equation without substrate inhibition was used to estimate the kcat and KM from the initial rate of reaction at various substrate concentrations.
Figure 2 with 5 supplements
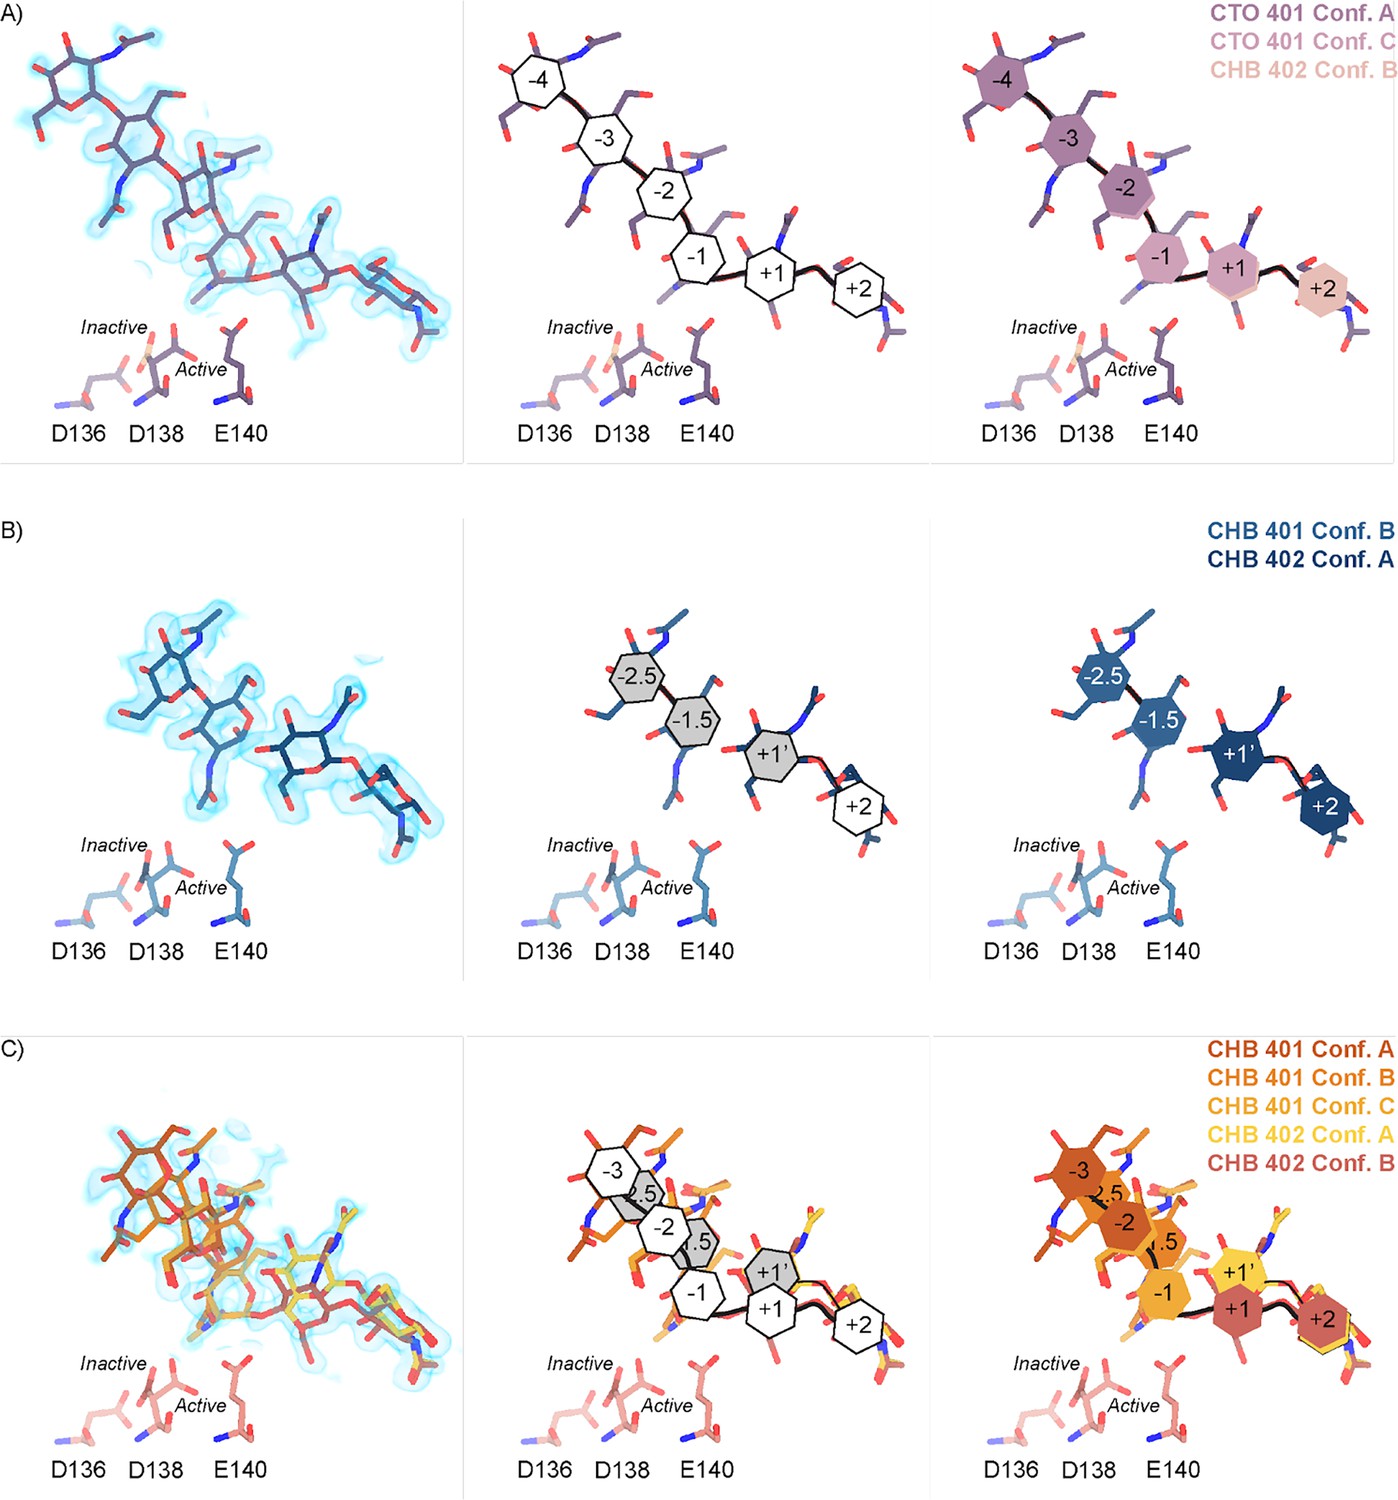
Schematic representation of sugar-binding subsites in mAMCase.
(A) PDB ID: 8GCA, chain A. Stick representation of all GlcNAc2 sugar-binding events observed in n sugar-binding subsites with 2mFo-DFc map shown as a 1.2 Å contour (blue), the subsite nomenclature, and a schematic of alternative conformation ligand modeling. (B) PDB ID: 8FRA, chain D. Stick representation of all GlcNAcn binding events observed in n+0.5 sugar-binding subsites with 2mFo-DFc map shown as a 1.2 Å contour (blue), the subsite nomenclature, and a schematic of alternative conformation ligand modeling. (C) PDB ID: 8FR9, chain B. Stick representation of all GlcNAcn binding events observed in n and n+0.5 sugar-binding subsites with 2mFo-DFc map shown as a 1.2 Å contour (blue), the subsite nomenclature, and a schematic of alternative conformation ligand modeling.
Figure 2—figure supplement 1
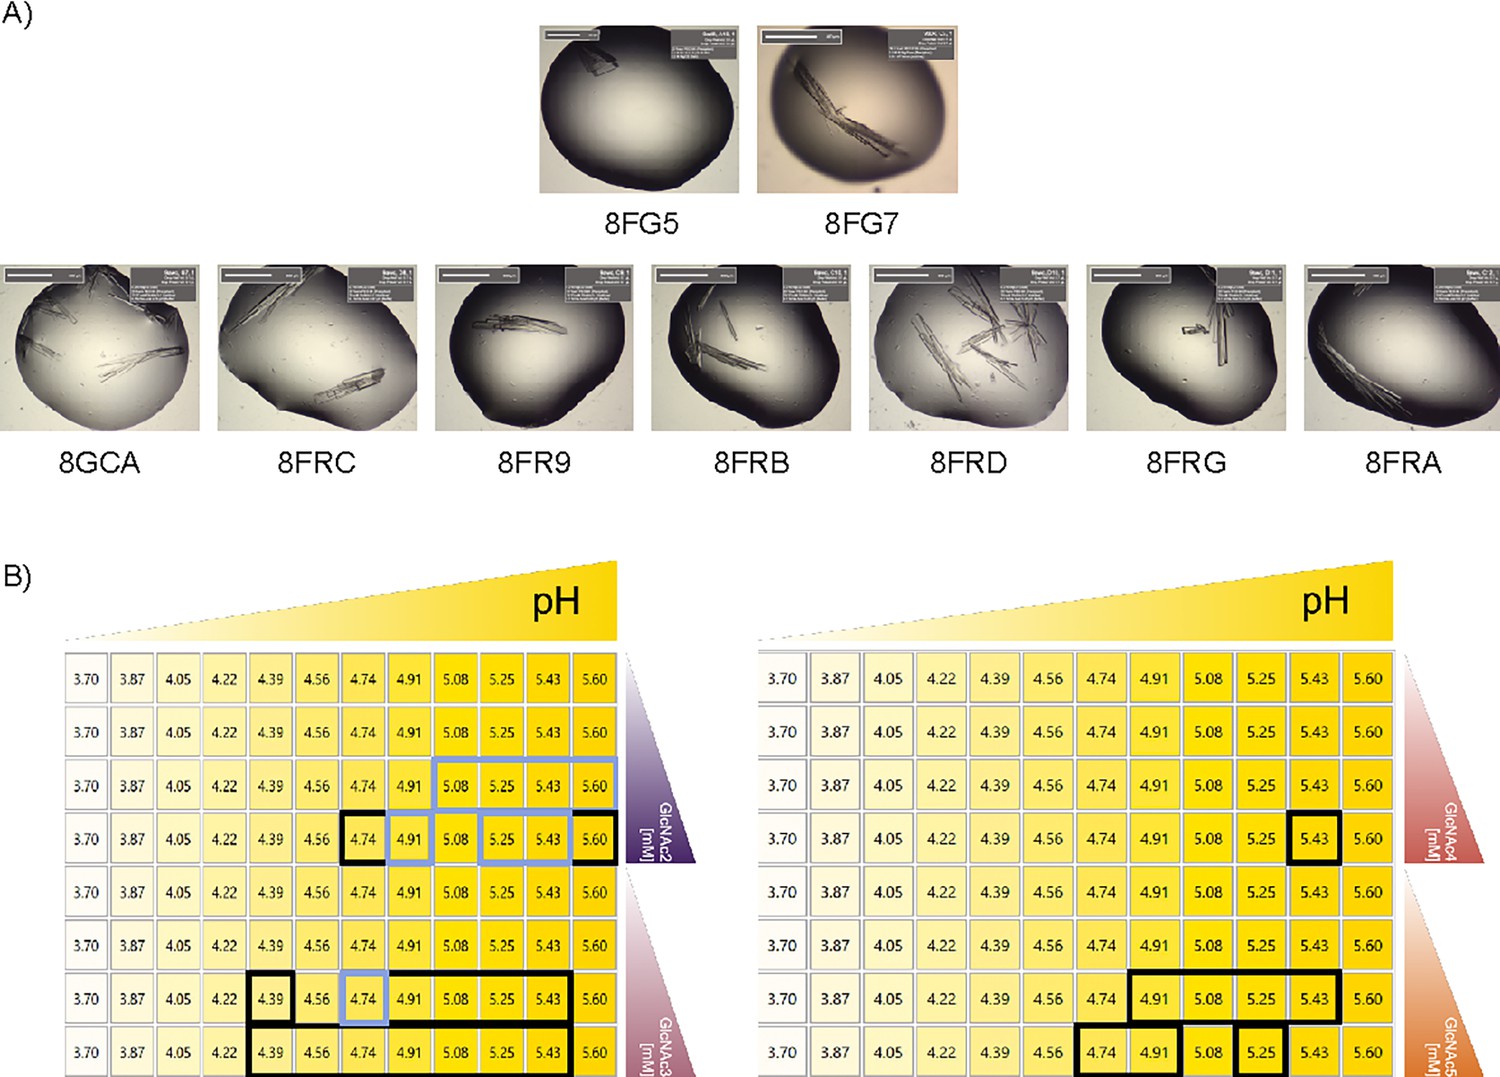
96-well plate layout of crystallization conditions.
(A) Brightfield view of crystals used to determine the structures reported in this paper. (B) Hanging drop crystallization trays were set up as a 2-condition gradient to identify optimal crystallization conditions for AMCase +GlcNAcn. pH increased along the X-axis from pH 3.70–5.60. Ligand concentration increased along the Y-axis from 0 mM to 29 mM [GlcNAc2], 19 mM [GlcNAc3], 10 mM [GlcNAc4], or 8 mM [GlcNAc5]. Black boxes indicate conditions where crystals grew. Lilac boxes indicate conditions for structures reported in this paper.
Figure 2—figure supplement 2
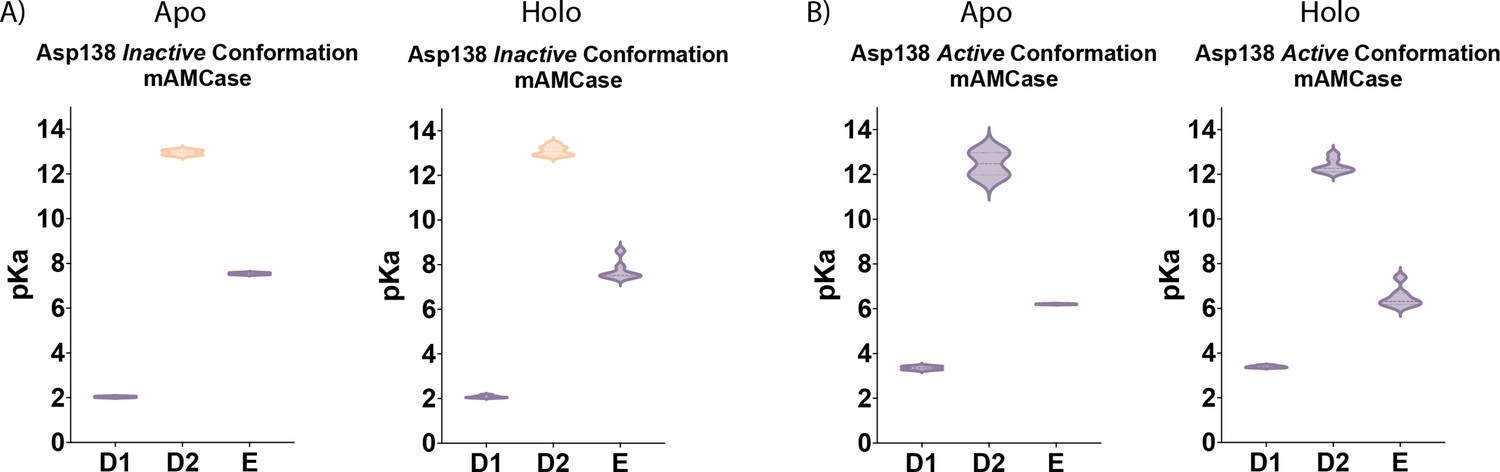
pKa of apo and holo mAMCase in the D2 inactive and active conformation.
PDB ID: 8FG5, 8FG7 (apo); 8GCA, 8FRC, 8FR9, 8FRB, 8FRD, 8FRG, 8FRA (holo). Violin plots showing the distribution of pKa across Asp136, Asp138, Glu140 between (A) apo and (B) holo mAMCase structures in the inactive or active conformation.
Figure 2—figure supplement 3
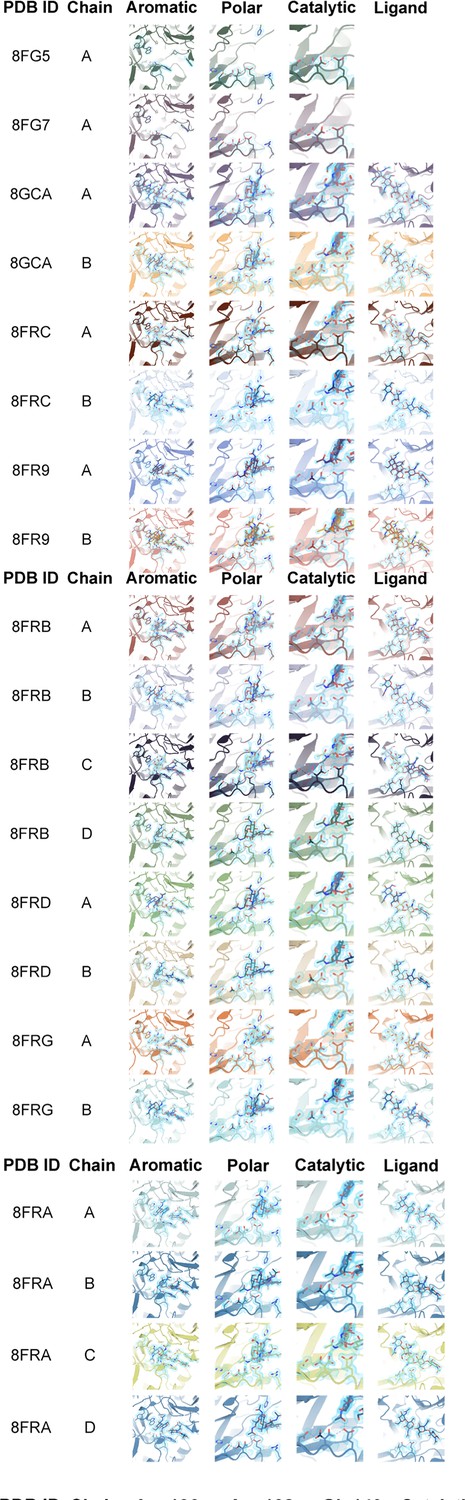
Overview of key residues for mAMCase activity.
(A) Stick representation of ligand and aromatic residues Trp31, Tyr34, Trp99, and Trp218 in the active site with 2mFo-DFc map shown as a 1.2 Å contour (blue). (B) Stick representation of ligand and polar residues Arg145, His208, Asp213, and His269 in the active site with 2mFo-DFc map shown as a 1.2 Å contour (blue). (C, D) Stick representation of ligand and catalytic residues Asp136, Asp138, and Glu140 in the active site with 2mFo-DFc map shown as a 1.2 Å contour (blue).
Figure 2—figure supplement 4
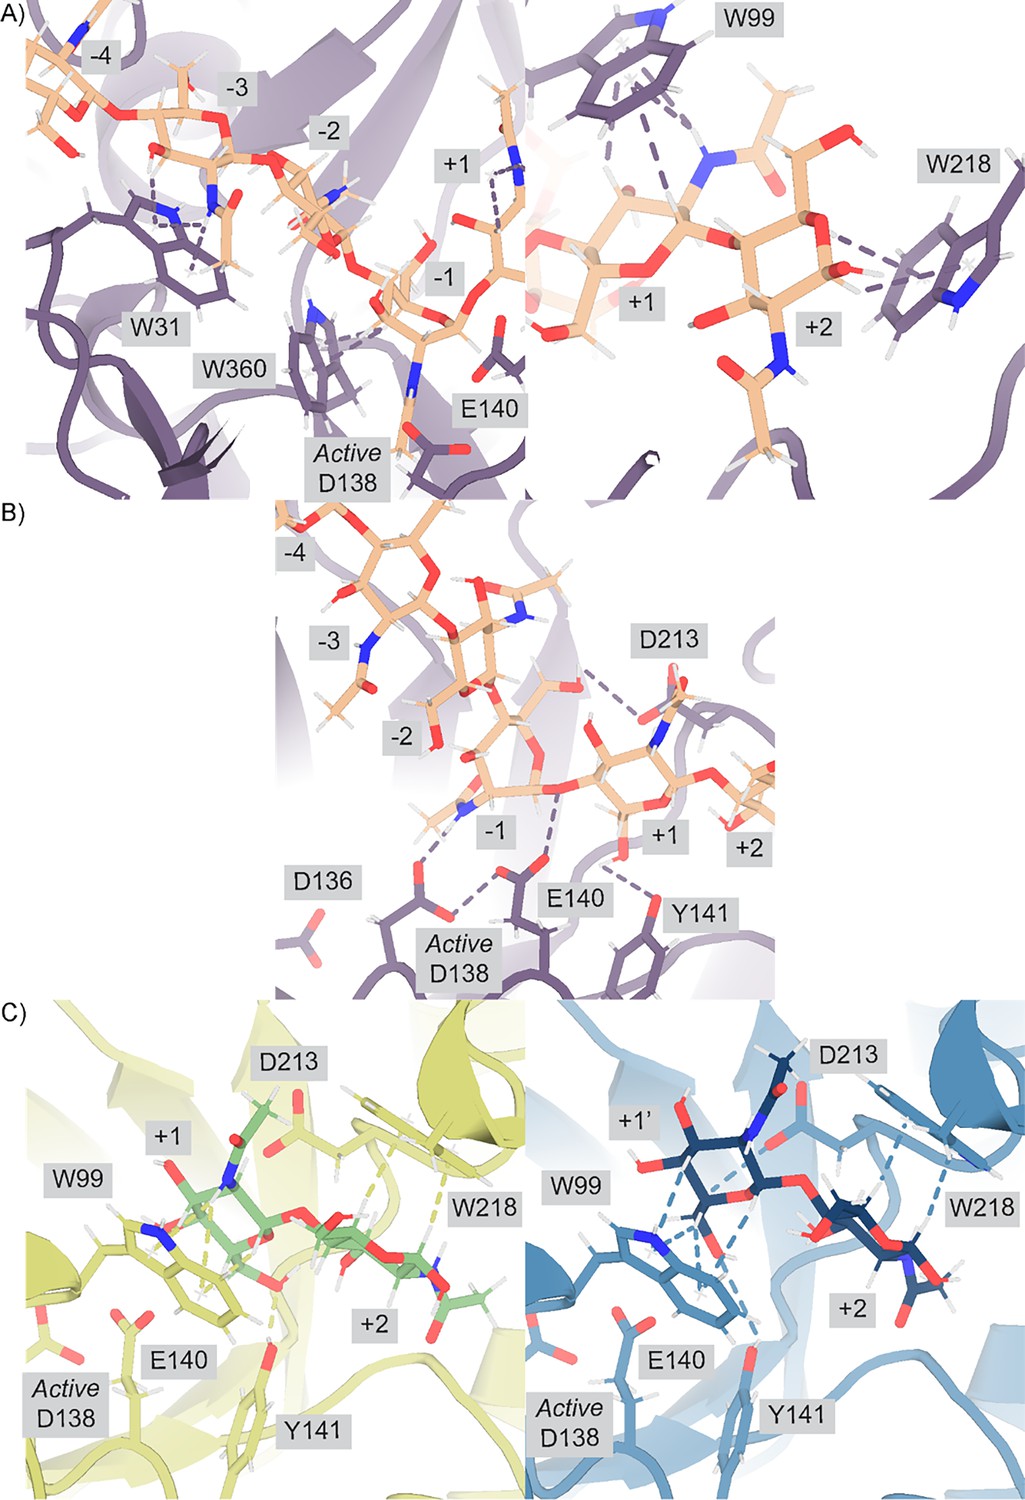
Protein-ligand interactions between mAMCase and chitin.
(A) PDB ID: 8GCA, chain A with GlcNAc6 modeled for viewing simplicity. Stick representation highlighting the stabilizing H-π interactions between Trp31, Trp360, and Trp218 and the −3,–1,+1, and +2 sugars, respectively. (B) PDB ID: 8GCA, chain A with GlcNAc6 modeled for viewing simplicity. Stick representation highlighting the stabilizing hydrogen bond interactions between the –1 sugar and Asp138 (2.6 Å) and Asp213 (3.4 Å), and between the +1 sugar and Tyr141 (3.0 Å). Glu140 is 2.8 Å from the glycosidic oxygen bridging the –1 and +1 sugars. (C) PDB ID: 8FRA, chains C (left) and D (right). Stick representation highlighting the stabilizing hydrogen bond interactions that we argue stabilize the +1 sugar (left; chain A) and the +1’ sugar-binding subsite (right; chain B).
Figure 2—figure supplement 5
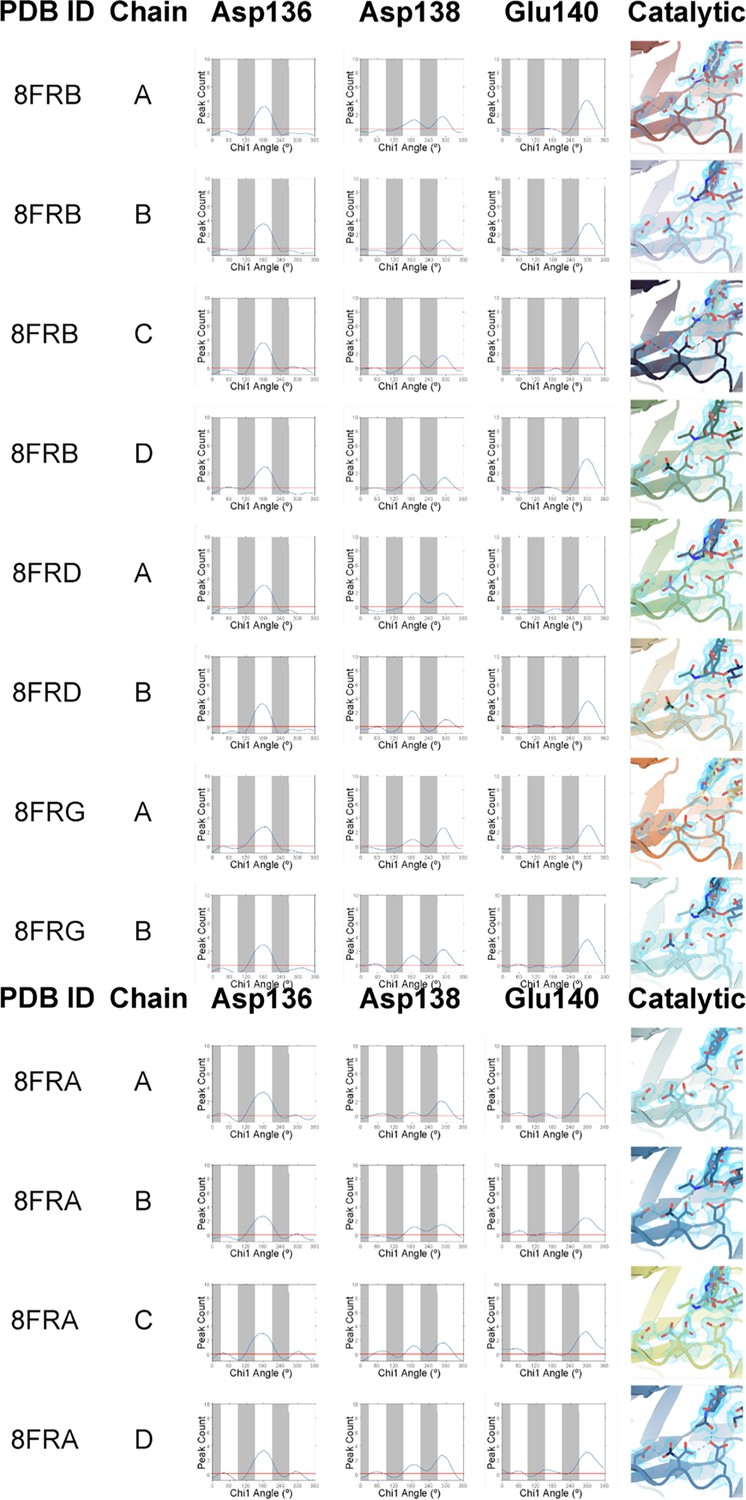
Ringer analysis of catalytic triad confirms alternative Asp138 conformations.
(A) Ringer analysis to detect alternative conformations in electron density maps. Ringer detected one peak for Asp136 at χ1=180° and Glu140 at χ1=300°, indicating only one conformation, whereas two peaks were detected for Asp138 at χ1=180° and χ1=300°, indicating two alternative conformations. (B) Stick representation of Asp136, Asp138, and Glu140 with 2mFo-DFc map volume shown as a 1.2 Å contour (blue).
Figure 3
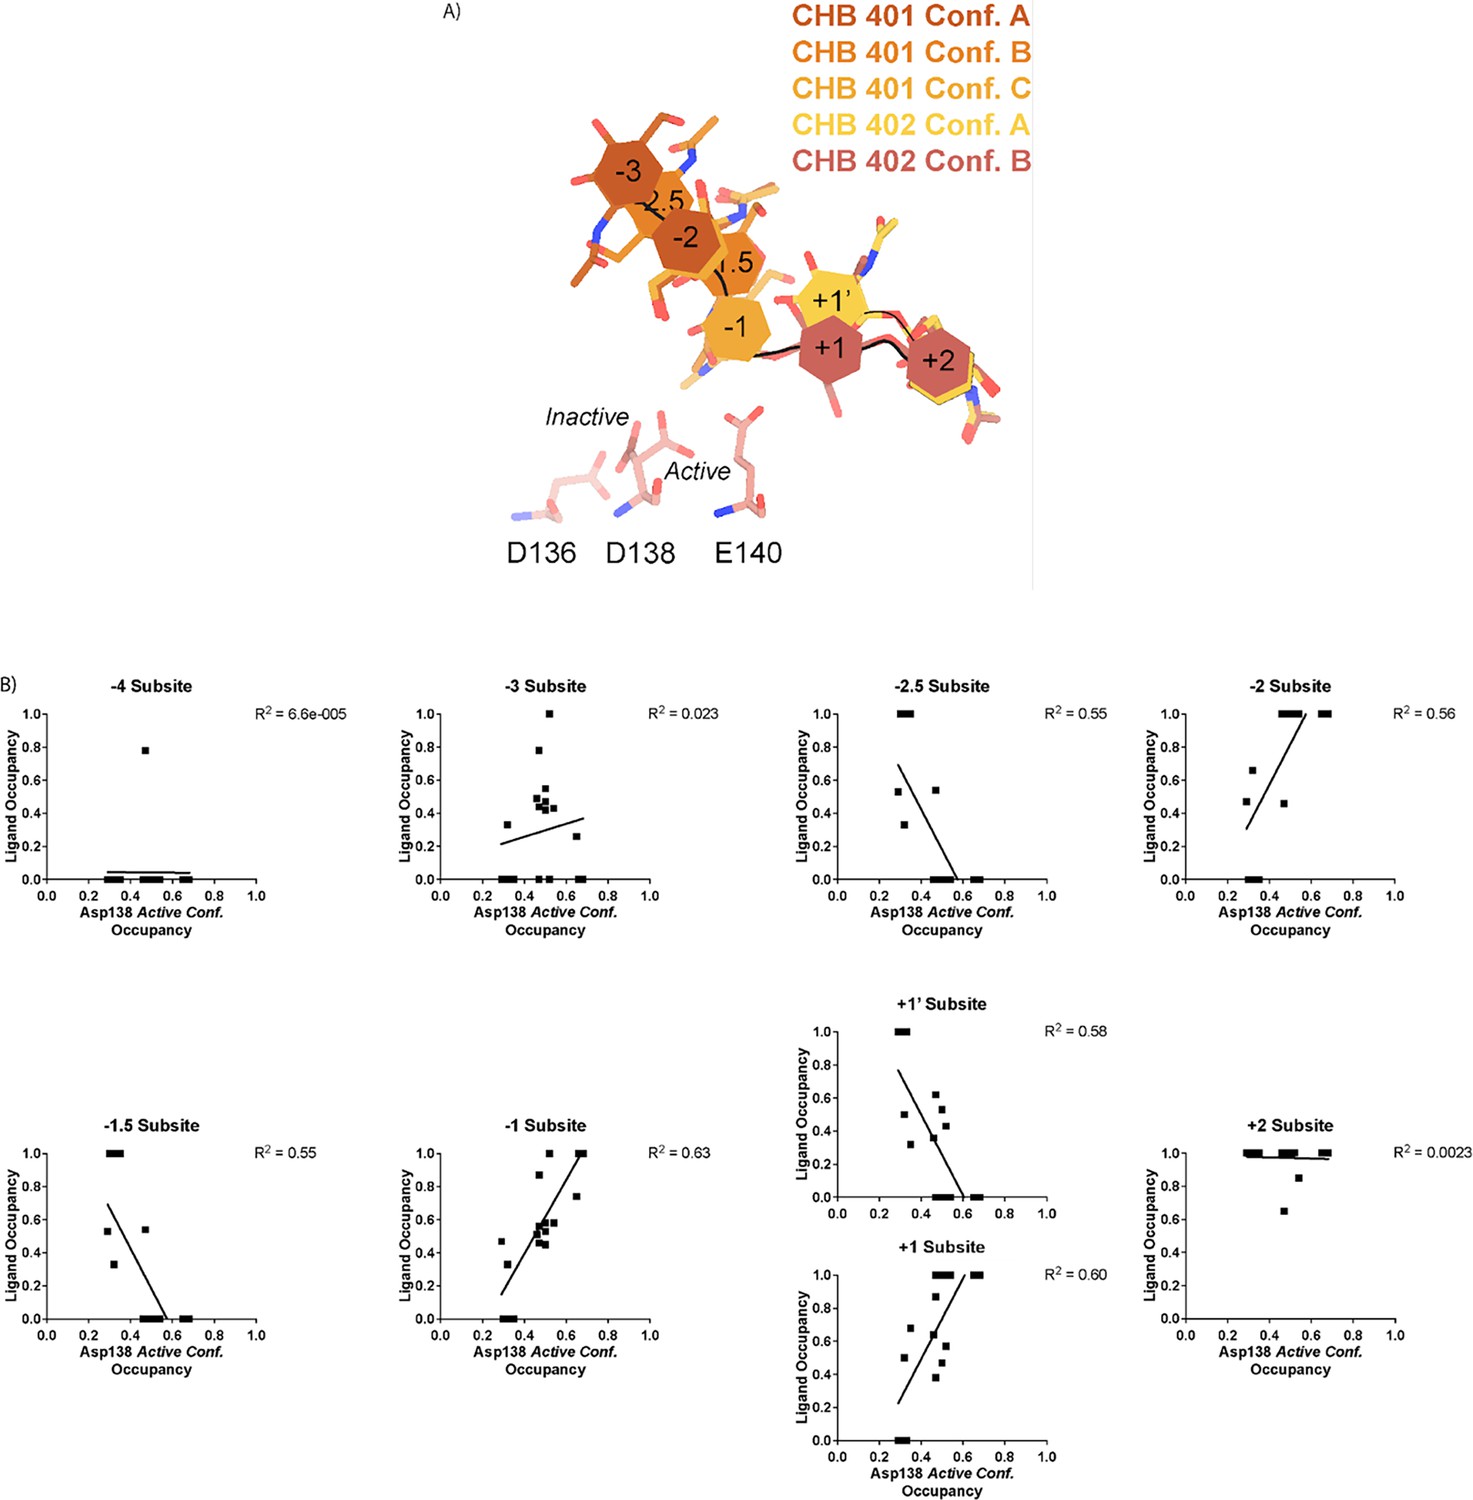
Asp138 orientation correlates with ligand subsite occupancy.
(A) PDB ID: 8FR9, chain B. Schematic of the alternative conformation ligand modeling. (B) Linear correlation between sugar-binding subsite occupancy and Asp138 active conformation occupancy.
Figure 4
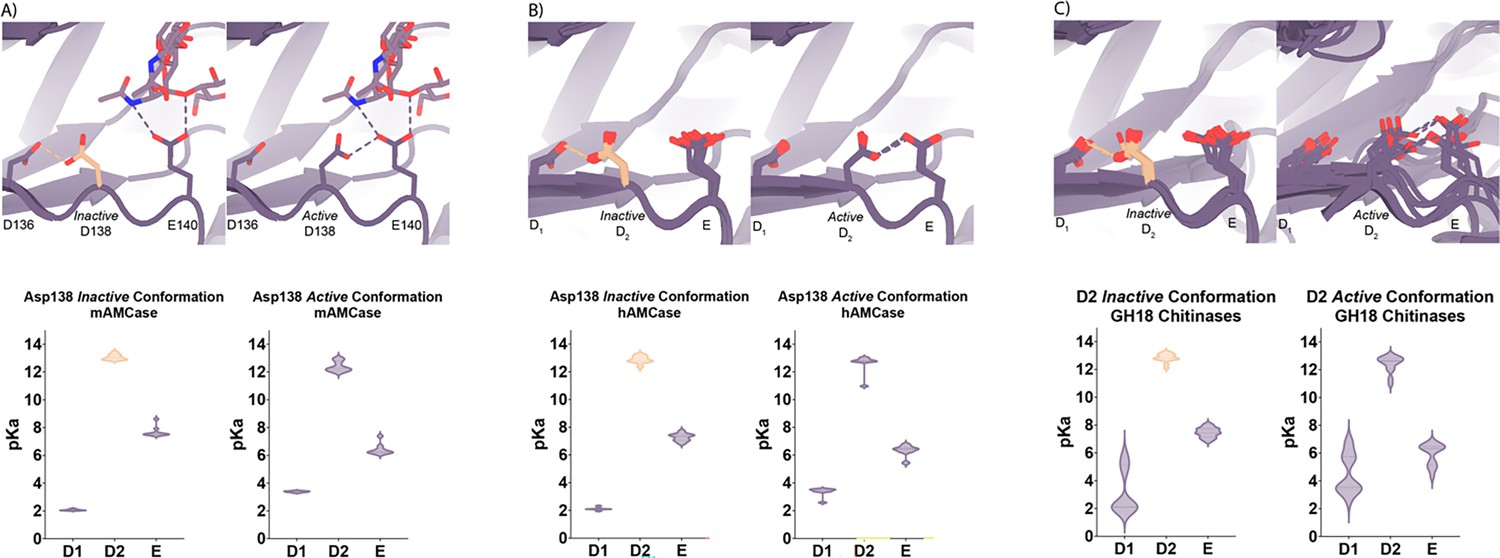
pKa of GH18 chitinases in the D2 inactive and active conformation.
(A) PDB ID: 8GCA, chain A. Distribution of pKa across Asp136, Asp138, Glu140 of mAMCase structures in either Asp138 inactive or Asp138 active conformation. (B) PDB ID: 3FXY, 3RM4, 3RM8, 3RME (inactive conformation); 2YBU, 3FY1 (active conformation). Distribution of pKa across Asp136, Asp138, Glu140 of hAMCase structures in either Asp138 inactive or Asp138 active conformation. (C) PDB ID: 3ALF, 3AQU, 3FXY, 3RM4, 3RM8, 3RME (inactive conformation); 2UY2, 2UY3, 2YBU, 4HME, 4MNJ, 4R5E, 4TXE (active conformation). Distribution of pKa across the catalytic triad D1xD2xE of GH18 chitinases in either D2 inactive or active conformation.
Figure 5
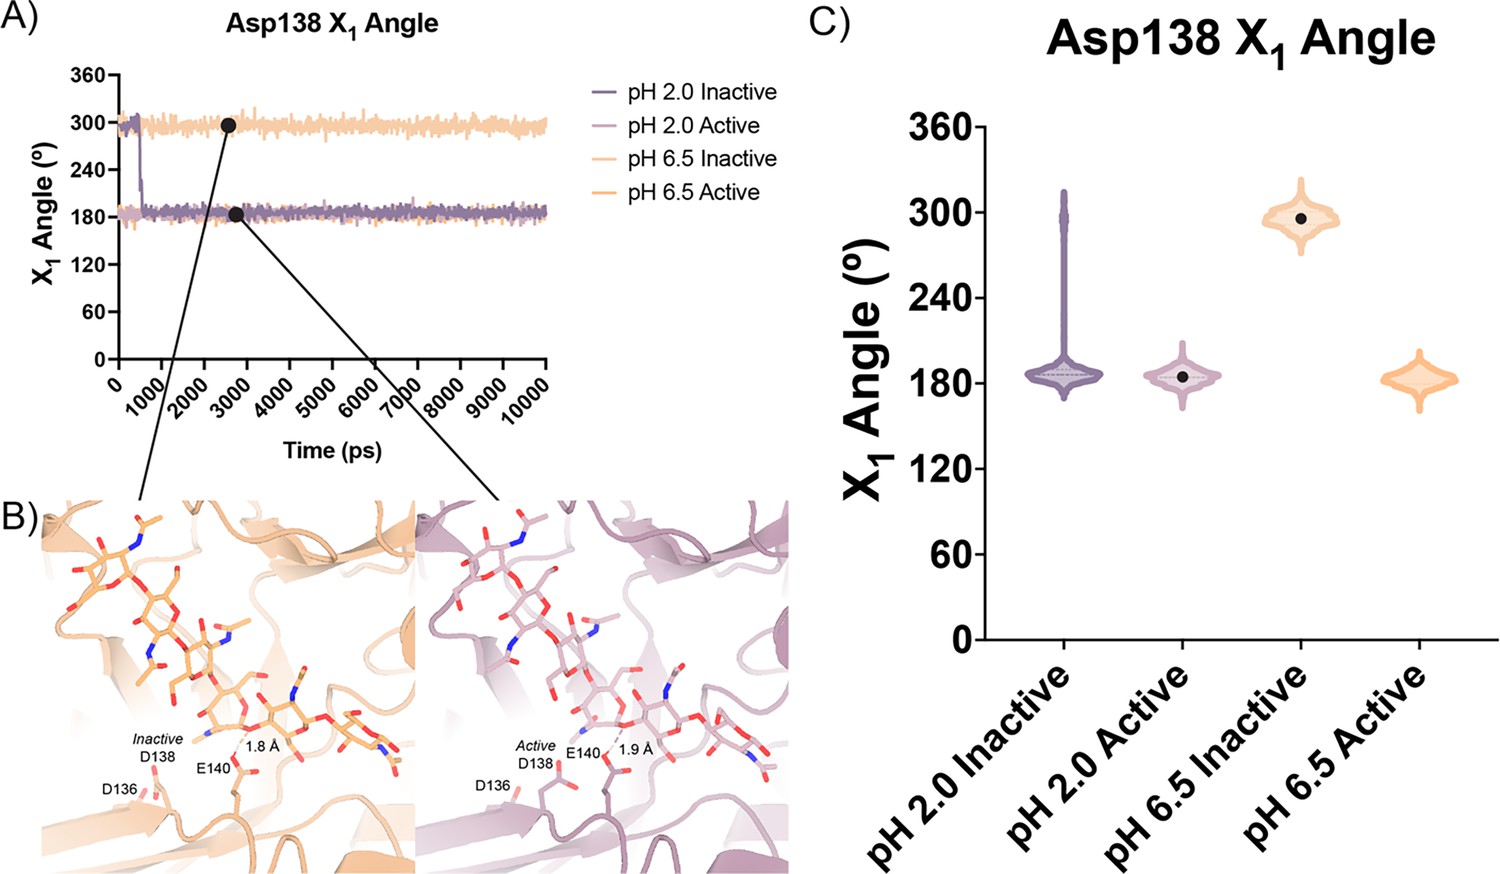
Distribution of distances observed every 10 ps of each simulation and their respective time courses.
(A) Asp138 χ1 angles over a 10 ns simulation. (B) Representative minimum distance snapshots of structure during pH 6.5 inactive simulation (left), and pH 2.0 active simulation (right). (C) Distribution of Asp138 χ1 angles over a 10 ns simulation.
Figure 6
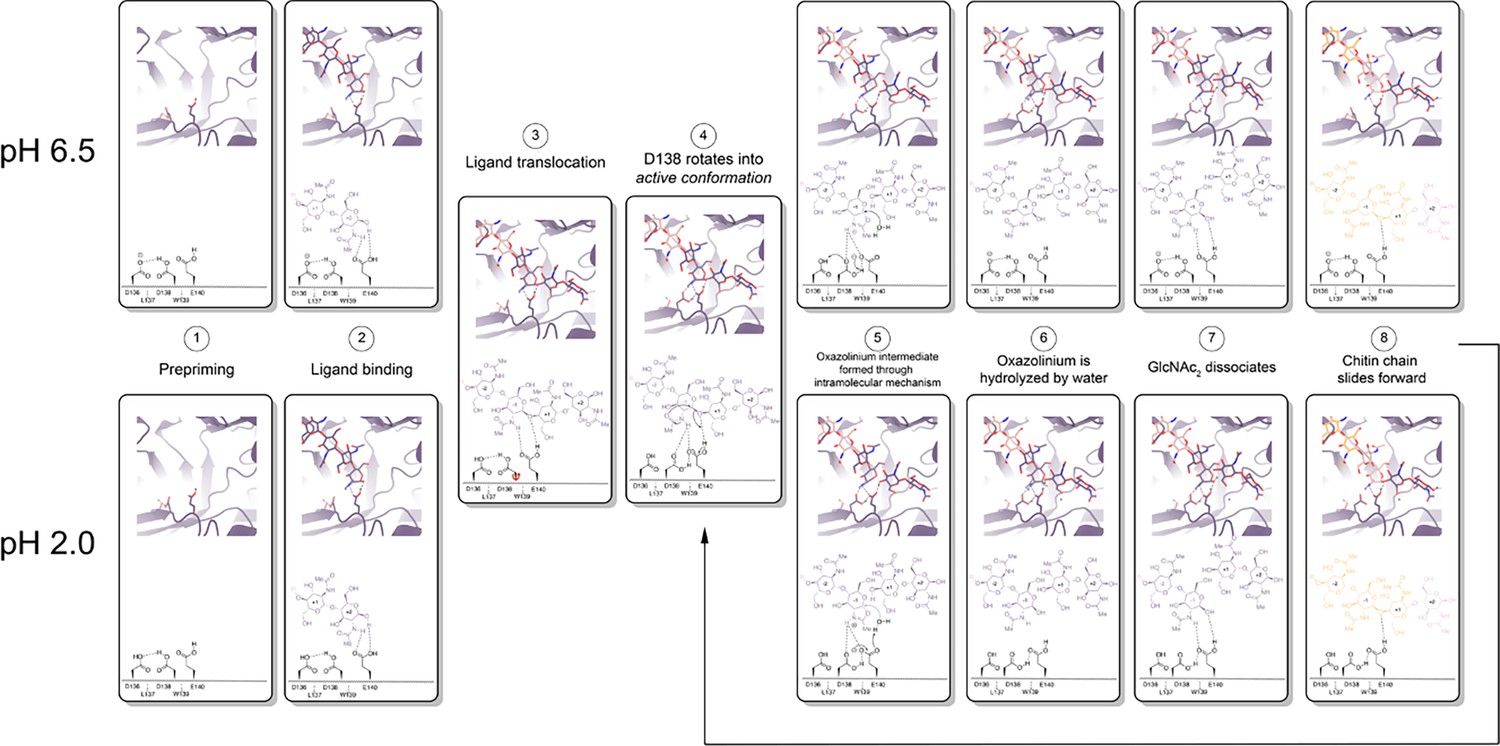
Proposed model for ligand translocation towards the active site and ligand release post-catalysis.
(A) PDB ID: 8GCA, chain A with no ligand (step 1); with GlcNAc4 generated by phenix.elbow using PubChem ID: 10985690 (step 2); with GlcNAc6 generated by phenix.elbow using PubChem ID: 6918014 (step 3–4, 8); with oxazolinium intermediate generated by phenix.elbow using PubChem ID: 25260046 (steps 5.1–5.2); with GlcNAc2 and GlcNAc4 generated by phenix.elbow using PubChem ID: 439544 and 10985690, respectively (steps 6–7). Chemical representation of GH18 catalytic cycle with corresponding molecular models of each step. Catalytic residues Asp136, Asp138, Glu140, and ligands are shown as sticks. Protons are shown as gray spheres.
Videos
Animation 1
Animated movie of the mAMcase catalytic cycle at pH 6.5.
Catalytic residues Asp136, Asp138, Glu140, and ligands are shown as sticks. Protons are shown as gray spheres.
Animation 2
Animated movie of the mAMcase catalytic cycle at pH 2.0.
Catalytic residues Asp136, Asp138, Glu140, and ligands are shown as sticks. Protons are shown as gray spheres.
Tables
Table 1
Data collection and refinement statistics.
Statistics for the highest resolution shell are shown in parentheses.
| Dataset | Apo at 100 K | Apo at 277 K | Holo with GlcNAc3 at pH 4.74 | Holo with GlcNAc2 at pH 4.91 | Holo with GlcNAc2 at pH 5.08 | Holo with GlcNAc2 at pH 5.25 | Holo with GlcNAc2 at pH 5.25 | Holo with GlcNAc2 at pH 5.43 | Holo with GlcNAc2 at pH 5.60 |
|---|---|---|---|---|---|---|---|---|---|
| PDB ID | 8FG5 | 8FG7 | 8GCA | 8FRC | 8FR9 | 8FRB | 8FRD | 8FRG | 8FRA |
| Diffraction Data DOI | 10.18430/M38FG5 | 10.18430/M38FG7 | 10.18430/M38GCA | 10.18430/M38FRC | 10.18430/M38FR9 | 10.18430/M38FRB | 10.18430/M38FRD | 10.18430/M38FRG | 10.18430/M38FRA |
| pH | 5.00 | 8.00 | 4.74 | 4.91 | 5.08 | 5.25 | 5.25 | 5.43 | 5.60 |
| Ligand | N/A | N/A | GlcNAc3 | GlcNAc2 | GlcNAc2 | GlcNAc2 | GlcNAc2 | GlcNAc2 | GlcNAc2 |
| [Ligand] mM | N/A | N/A | 12.67 | 29.00 | 19.33 | 19.33 | 29.00 | 29.00 | 19.33 |
| Wavelength | 1.117 | 1.116 | 1.116 | 1.116 | 1.116 | 1.116 | 1.116 | 1.116 | 1.116 |
| Resolution range | 46.8–1.3 (1.346–1.3) | 50.88–1.64 (1.699–1.64) | 61.83–1.7 (1.761–1.7) | 69.52–1.92 (1.989–1.92) | 69.59–1.5 (1.554–1.5) | 57.29–1.7 (1.761–1.7) | 58.67–1.68 (1.74–1.68) | 69.59–1.741 (1.803–1.741) | 86.27–1.95 (2.02–1.95) |
| Space group | P 1 21 1 | P 21 21 21 | P 21 21 2 | P 2 21 21 | P 2 21 21 | P 21 21 21 | P 2 21 21 | P 21 21 2 | P 21 21 21 |
| Unit cell (length) | 60.04 42.25 67.41 | 63.6466 71.8436 84.6724 | 76.0664 91.7195 106.132 | 70.9333 92.6896 105.123 | 71.1131 92.6412 105.423 | 91.9263 106.963 146.492 | 70.755 92.451 104.99 | 92.8934 105.041 70.8116 | 92.0659 106.705 146.57 |
| Unit cell (angles) | 90 95.18 90 | 90 90 90 | 90 90 90 | 90 90 90 | 90 90 90 | 90 90 90 | 90 90 90 | 90 90 90 | 90 90 90 |
| Total reflections | 2099252 (194837) | 620486 (61796) | 516529 (48842) | 339863 (33874) | 702566 (63651) | 1010525 (98078) | 499250 (48902) | 420425 (37138) | 691049 (67775) |
| Unique reflections | 83050 (8251) | 47999 (4678) | 82111 (8079) | 53587 (5242) | 109106 (10560) | 158679 (15679) | 78153 (7593) | 71329 (6974) | 105512 (10401) |
| Multiplicity | 25.3 (23.6) | 12.9 (13.2) | 6.3 (6.0) | 6.3 (6.5) | 6.4 (6.0) | 6.4 (6.3) | 6.4 (6.4) | 5.9 (5.3) | 6.5 (6.6) |
| Completeness (%) | 99.99 (99.98) | 99.37 (98.65) | 99.72 (99.42) | 99.88 (99.79) | 97.48 (95.47) | 99.87 (99.88) | 98.71 (97.03) | 99.56 (99.03) | 99.74 (99.62) |
| Mean I/sigma(I) | 13.31 (1.88) | 7.00 (1.19) | 8.83 (3.12) | 7.72 (3.21) | 16.77 (5.46) | 9.09 (3.10) | 9.68 (3.09) | 6.18 (2.56) | 5.65 (1.26) |
| Wilson B-factor | 15.81 | 16.38 | 12.17 | 13.44 | 9.16 | 12.47 | 11.55 | 15.76 | 12.64 |
| R-merge | 0.1342 (2.107) | 0.2489 (2.119) | 0.1811 (1.138) | 0.1531 (0.5265) | 0.06539 (0.2976) | 0.1111 (0.5593) | 0.1155 (0.569) | 0.1321 (0.4674) | 0.1619 (0.6276) |
| R-meas | 0.137 (2.153) | 0.2591 (2.203) | 0.1972 (1.242) | 0.1669 (0.5728) | 0.07122 (0.3259) | 0.121 (0.61) | 0.126 (0.6197) | 0.1448 (0.5188) | 0.176 (0.6822) |
| R-pim | 0.02718 (0.4382) | 0.07097 (0.5968) | 0.07709 (0.4917) | 0.06573 (0.2233) | 0.02784 (0.1311) | 0.04745 (0.2411) | 0.04965 (0.2425) | 0.05834 (0.2207) | 0.06836 (0.2647) |
| CC1/2 | 0.999 (0.858) | 0.996 (0.502) | 0.997 (0.805) | 0.994 (0.884) | 0.999 (0.943) | 0.997 (0.888) | 0.993 (0.68) | 0.994 (0.845) | 0.997 (0.845) |
| CC* | 1 (0.961) | 0.999 (0.818) | 0.999 (0.944) | 0.998 (0.969) | 1 (0.985) | 0.999 (0.97) | 0.998 (0.9) | 0.998 (0.957) | 0.999 (0.957) |
| Reflections used in refinement | 83046 (8251) | 47968 (4677) | 82030 (8059) | 53543 (5242) | 109065 (10557) | 158531 (15678) | 78103 (7592) | 71295 (6967) | 105380 (10401) |
| Reflections used for R-free | 4099 (422) | 2328 (234) | 4142 (427) | 2738 (273) | 5449 (559) | 7978 (802) | 3878 (334) | 3561 (348) | 5174 (542) |
| R-work | 0.1317 (0.2361) | 0.1469 (0.2707) | 0.1598 (0.2428) | 0.1472 (0.1616) | 0.1376 (0.1615) | 0.1423 (0.1850) | 0.1396 (0.1724) | 0.1657 (0.2194) | 0.1695 (0.2074) |
| R-free | 0.1519 (0.2613) | 0.1717 (0.3244) | 0.1978 (0.2952) | 0.1898 (0.2065) | 0.1644 (0.1932) | 0.1778 (0.2315) | 0.1689 (0.2113) | 0.2083 (0.2737) | 0.2056 (0.2463) |
| CC(work) | 0.970 (0.583) | 0.978 (0.789) | 0.969 (0.819) | 0.953 (0.846) | 0.971 (0.922) | 0.970 (0.878) | 0.963 (0.903) | 0.959 (0.749) | 0.961 (0.869) |
| CC(free) | 0.969 (0.558) | 0.975 (0.729) | 0.953 (0.775) | 0.951 (0.793) | 0.966 (0.910) | 0.958 (0.791) | 0.954 (0.882) | 0.951 (0.757) | 0.970 (0.846) |
| Number of non-hydrogen atoms | 3583 | 3427 | 7330 | 6953 | 7507 | 13986 | 6951 | 7343 | 14428 |
| macromolecules | 3107 | 3097 | 6094 | 6016 | 6186 | 11938 | 6019 | 6286 | 11900 |
| ligands | 1 | 1 | 394 | 342 | 516 | 746 | 344 | 401 | 571 |
| solvent | 475 | 329 | 1034 | 763 | 1057 | 1666 | 756 | 852 | 2237 |
| Protein residues | 376 | 376 | 752 | 738 | 750 | 1478 | 738 | 738 | 1478 |
| Nucleic acid bases | |||||||||
| RMS(bonds) | 0.006 | 0.008 | 0.008 | 0.007 | 0.01 | 0.006 | 0.007 | 0.008 | 0.003 |
| RMS(angles) | 0.88 | 0.96 | 1.05 | 0.91 | 1.1 | 0.92 | 0.91 | 1.12 | 0.66 |
| Ramachandran favored (%) | 98.4 | 98.66 | 98.8 | 98.23 | 98.26 | 98.84 | 98.64 | 98.35 | 98.1 |
| Ramachandran allowed (%) | 1.6 | 1.34 | 1.2 | 1.77 | 1.74 | 1.16 | 1.36 | 1.65 | 1.9 |
| Ramachandran outliers (%) | 0 | 0 | 0 | 0 | 0 | 0 | 0 | 0 | 0 |
| Rotamer outliers (%) | 1.22 | 0.92 | 0.62 | 0.79 | 0.92 | 0.87 | 0.63 | 0.6 | 0.88 |
| Clashscore | 1.66 | 0.83 | 1.25 | 1.85 | 1.3 | 1.31 | 1.6 | 1.44 | 1.66 |
| Average B-factor | 21.71 | 19.1 | 16.09 | 14.55 | 12.73 | 15.72 | 14.2 | 17.9 | 15.9 |
| macromolecules | 19.83 | 17.9 | 13.9 | 13.24 | 10.3 | 13.76 | 12.5 | 16.36 | 13.88 |
| ligands | 98.88 | 46.35 | 23.57 | 18.87 | 15.73 | 17.53 | 15.9 | 23.5 | 19.18 |
| solvent | 33.82 | 30.3 | 27.53 | 23.9 | 26.25 | 29.3 | 27.32 | 27.98 | 26.24 |
| Number of TLS groups |
Additional files
-
Supplementary file 1
Occupancy of each ligand subsite and Asp138 in the active conformation (separate file).
- https://cdn.elifesciences.org/articles/89918/elife-89918-supp1-v1.xlsx
-
Supplementary file 2
pKa across Asp136, Asp138, Glu140 of mAMCase structures in either Asp138 inactive or Asp138 active conformation (separate file).
- https://cdn.elifesciences.org/articles/89918/elife-89918-supp2-v1.xlsx
-
MDAR checklist
- https://cdn.elifesciences.org/articles/89918/elife-89918-mdarchecklist1-v1.pdf
Download links
A two-part list of links to download the article, or parts of the article, in various formats.
Downloads (link to download the article as PDF)
Open citations (links to open the citations from this article in various online reference manager services)
Cite this article (links to download the citations from this article in formats compatible with various reference manager tools)
Structural characterization of ligand binding and pH-specific enzymatic activity of mouse Acidic Mammalian Chitinase
eLife 12:RP89918.
https://doi.org/10.7554/eLife.89918.3


