Semaphorin7A patterns neural circuitry in the lateral line of the zebrafish
- Howard Hughes Medical Institute and Laboratory of Sensory Neuroscience, The Rockefeller University, United States
- Tri-Institutional PhD Program in Computational Biology and Medicine, United States
- Chan Zuckerberg Biohub San Francisco, United States
Figures
Figure 1 with 4 supplements
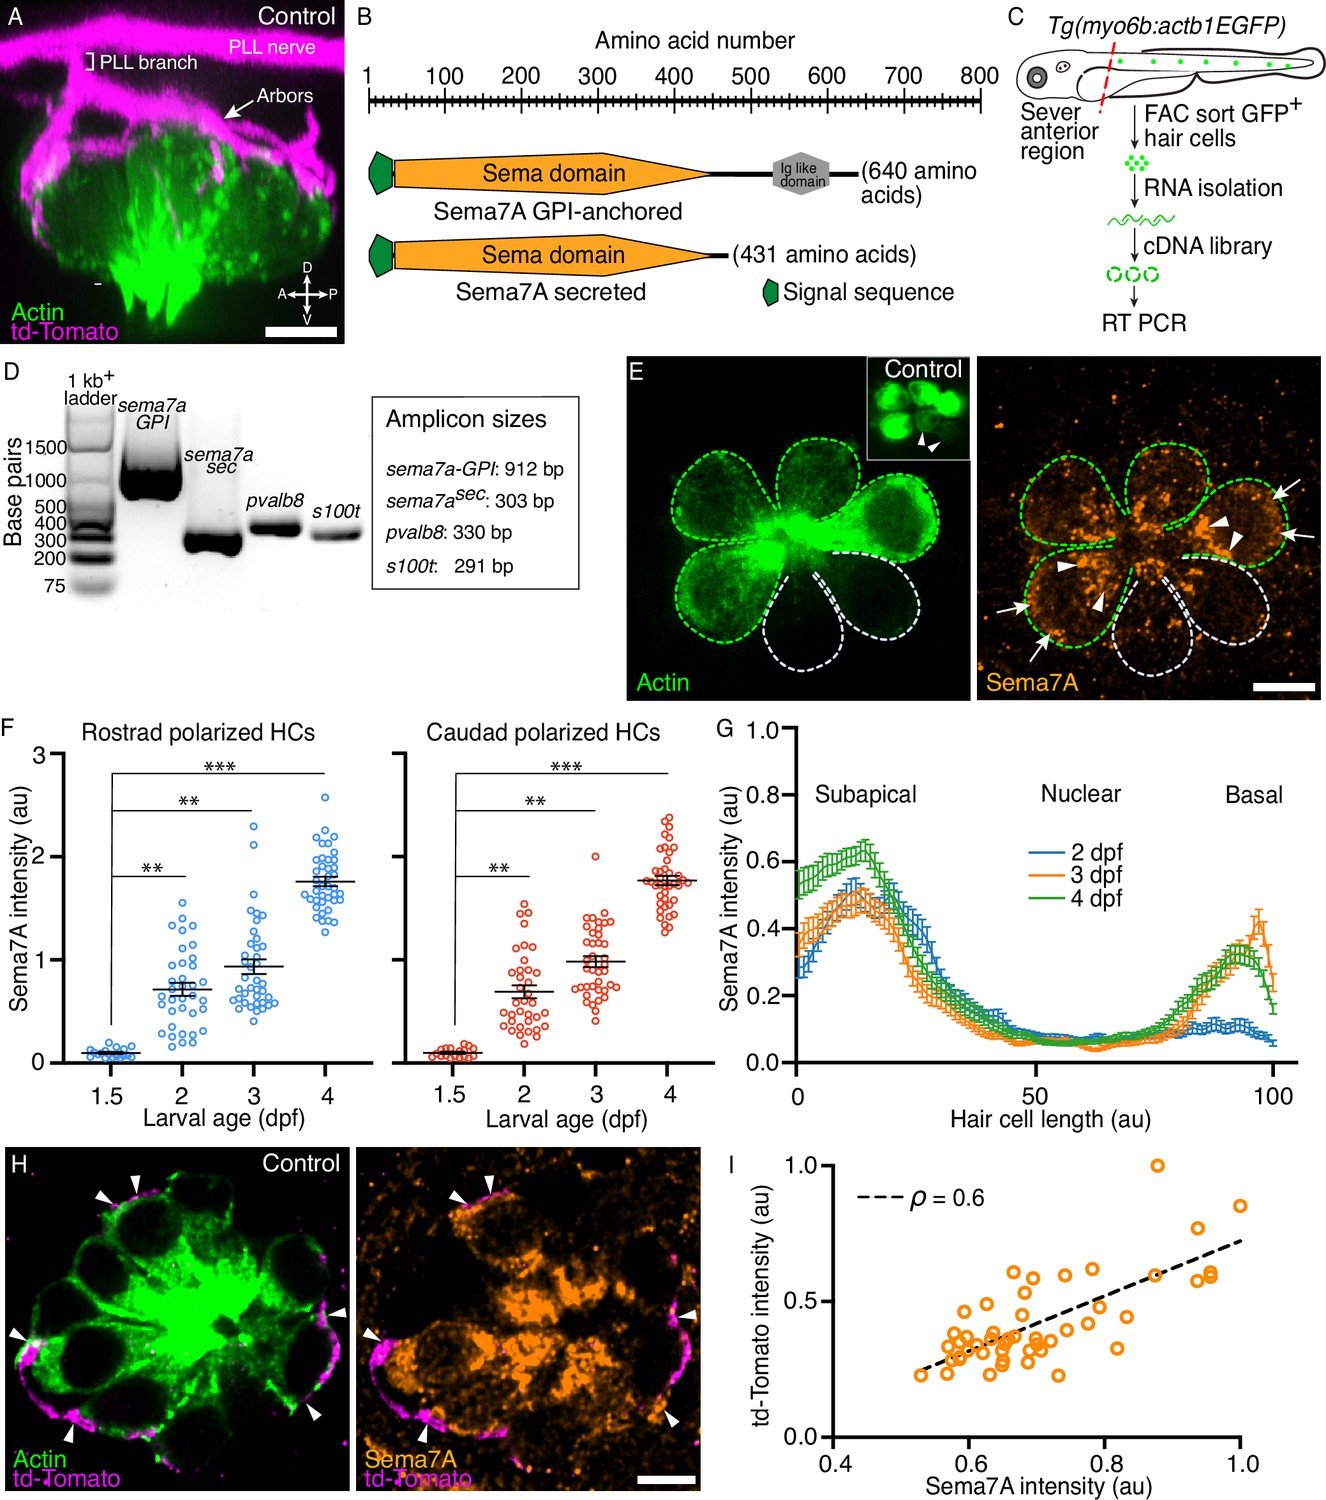
Expression of Semaphorin7A in the zebrafish’s lateral line.
(A) A volumetric rendering of a PLL neuromast depicts the sensory axons (magenta) that branch from the lateral line nerve to arborize around the basolateral surface of the hair cell cluster (green). Additional cell types in the neuromast are not labeled. Larval age, 3 dpf. A=anterior, P=posterior, D=dorsal, V=ventral. (B) A schematic drawing of the two variants of the Sema7A protein molecule depicts the full-length GPI-anchored form and the smaller, potentially secreted form. Both the molecules include a signal sequence (green) and a conserved sema domain (orange). (C) Tg(myo6b:actb1-EGFP) larvae at 4 dpf were terminally anesthetized and their heads were removed with fine blades. The tails were then dissociated into the component cells, which were sorted by flow cytometry. Green cells represent GFP+ hair cells. A cDNA library was prepared from the isolated RNA. (D) Gel-based RT-PCR analysis indicates the presence of both the sema7a transcript variants and the expression of hair cell-specific genes, parvalbumin 8 (pvalb8) and S100 calcium binding protein T (s100t). (E) A surface micrograph of a neuromast at 3 dpf depicts two pairs of mature hair cells (green dashed lines) and a pair of immature hair cells (grey dashed lines). Inset: among the three pairs of hair cell apices, the immature pair is indicated by arrowheads. Immunolabeling reveals that the Sema7A protein (orange) occurs consistently at the subapical region (arrowheads) and at the basolateral surface (arrows) of a hair cell. In this and in each of the subsequent neuromast images, anterior is to the left and dorsal to the top. (F) A plot quantifies developmental changes in the average Sema7A intensity in both rostrally and caudally polarized hair cells of neuromasts from 1.5 dpf to 4 dpf. The data stem from 18, 36, 39, and 40 hair cells in neuromasts of respectively 1.5 dpf, 2 dpf, 3 dpf, and 4 dpf larvae. (G) A plot quantifies the distribution of average Sema7A intensity along the hair cell’s apicobasal axis. The results stem from 52, 57, and 54 hair cells of neuromasts from 2 dpf, 3 dpf, and 4 dpf larvae. (H) An immunofluorescence image at the nuclear level of a 4 dpf neuromast shows the contact of the sensory arbors (magenta) with the basolateral surface of the hair cells (green). Immunolabeling for Sema7A (orange) reveals enrichment of the protein at the hair cell bases and sensory-axon interfaces (arrowheads). (I) At the base of the hair cell, association of the td-Tomato+ sensory arbors positively correlated with the Sema7A intensity. The results stemmed from 48 hair cells of 13 neuromasts from 3 dpf larvae. HC, hair cell; scale bars, 5 µm; au, arbitrary unit; means ± SEMs; ρ, Spearman’s correlation coefficient; *** implies p<0.001 and ** implies p<0.01.
-
Figure 1—source data 1
The source data contains raw uncropped gel image of the RT PCR experiment.
- https://cdn.elifesciences.org/articles/89926/elife-89926-fig1-data1-v1.zip
-
Figure 1—source data 2
Sema7A intensity distribution at diverse stages of hair cell development.
- https://cdn.elifesciences.org/articles/89926/elife-89926-fig1-data2-v1.xlsx
Figure 1—figure supplement 1
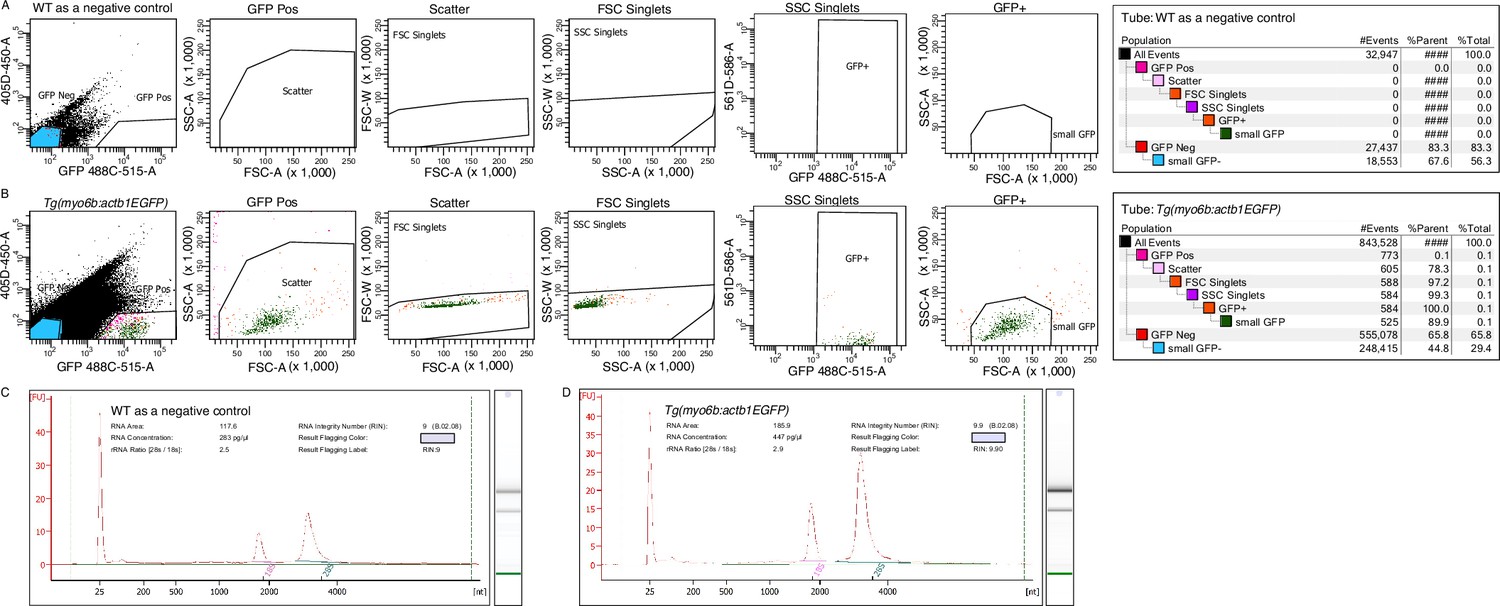
Isolation of GFP-expressing hair cells.
(A, B) Representative results from florescence-activated cell sorting demonstrate the efficient discrimination of GFP+ (green) hair cells from Tg(myo6b:actb1-EGFP) larval tails. Around 400 tails were utilized to isolate hair cells. Wild-type (WT) controls confirm the selectivity of the gates. (C, D) Plots represent the RNA integrity numbers (RINs) of the isolated total RNA from WT and transgenic larvae. High RIN values suggest minimal degradation of isolated RNAs from both samples.
Figure 1—figure supplement 2
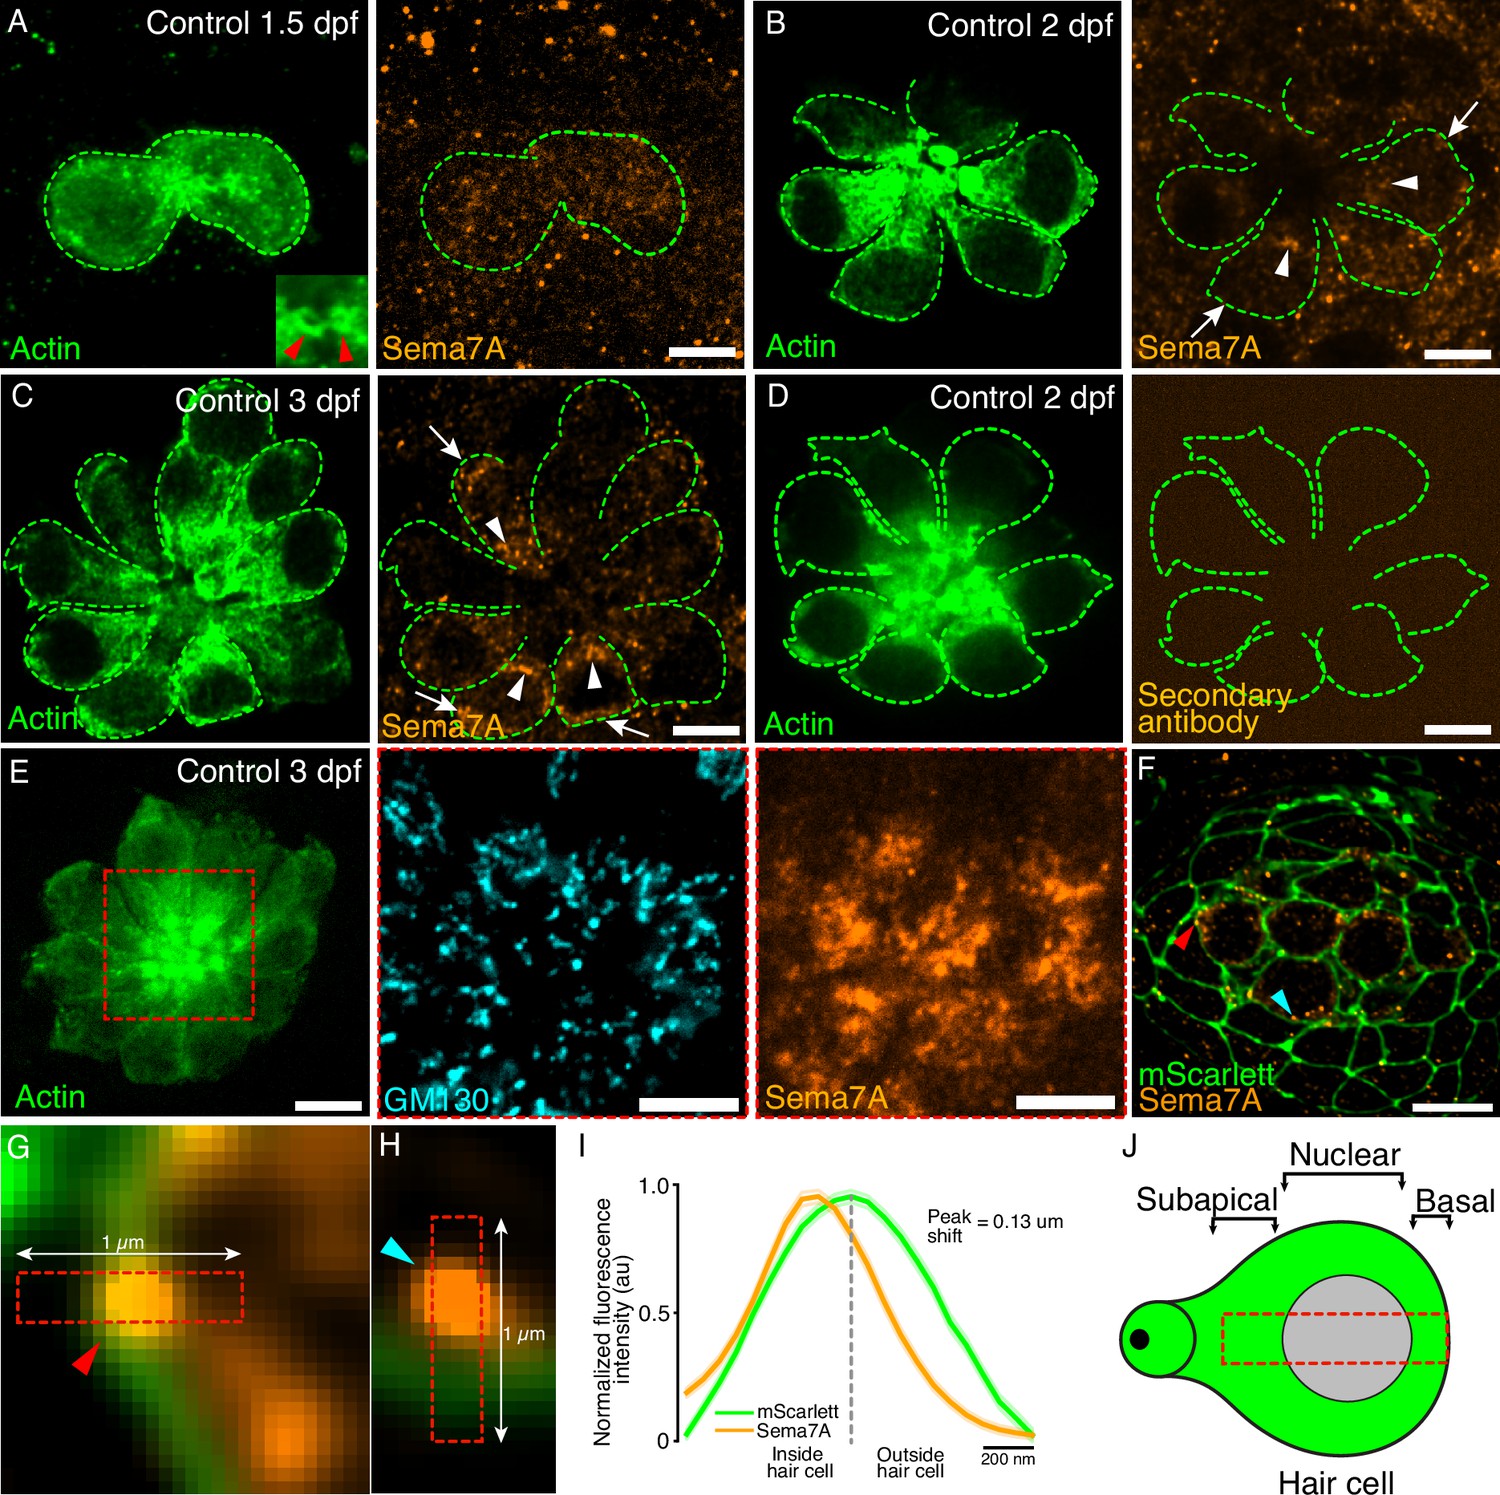
Expression of Semaphorin7A in the lateral line neuromast.
(A–C) Surface micrographs show hair cells marked with actin-GFP (green dashed lines) and the localization of Sema7A protein (orange) in the subapical (arrowheads) and basal regions (arrows) of the corresponding hair cells from neuromasts of developing control larvae. The inset in panel A (red arrowheads) depicts the apices of the immature hair cell pair. (D) Immunolabeling with only the secondary antibody fails to detect any Sema7A signal. (E) A surface micrograph depicts hair cells (green, left) whose subapical region (red dashed line) harbors the Golgi network−labeled by the Golgi resident protein GM130 (cyan, middle)−where the Sema7A protein is enriched (orange, right). (F) A micrograph at a nuclear plane of a 4 dpf neuromast depicts membrane-tethered Scarlet (green) in all cells of the neuromast and the Sema7A protein (orange, arrowheads) in centrally clustered hair cells. (G) The Sema7A protein is located at the basal membrane (red arrowhead). (H) The Sema7A protein is also observed adjacent to the basal membrane, potentially in a vesicle (cyan arrowhead). (I) A plot quantifies the distribution of average Sema7A intensity across the hair cell’s basal membrane. The results stem from 100 hair-cell membranes of 10 neuromasts from 4 dpf larvae. (J) A schematic diagram of a single hair cell depicts the three distinct regions along the apicobasal axis of the cell. Sema7A intensity was measured along this apicobasal axis (red dashed line). Scale bars, 5 µm; au, arbitrary unit; means ± SEMs.
Figure 1—figure supplement 3
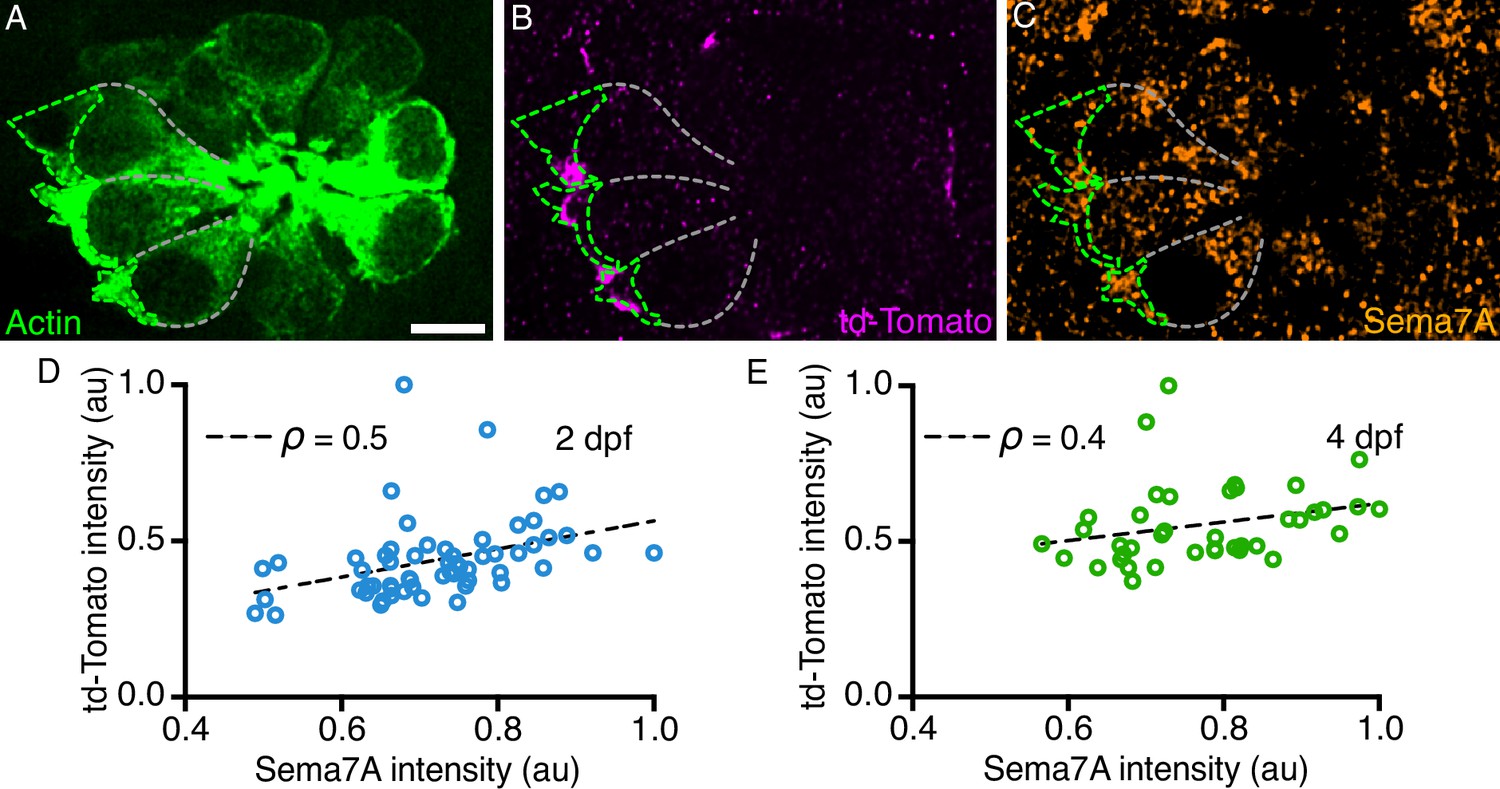
Sema7A progressively enriches at the hair cell base with the sensory axons.
(A) A micrograph at a nuclear plane of a 3 dpf neuromast depicts several actin-GFP (green) labeled hair cells. The lateral (white dashed line) and the basal (green dashed line) surfaces of three hair cells are outlined. (B) The td-Tomato-positive sensory arbors contact the basal regions (green dashed line) of three hair cells. (C) The Sema7A is enriched in the basal regions (green dashed line) of the hair cells that are in contact with the sensory arbors. (D, E) At the base of the hair cell, intensities of the td-Tomato-positive sensory arbors positively correlate with the Sema7A intensities. The results stem from 66 hair cells of 15 neuromasts from 2 dpf larvae and 40 hair cells of 11 neuromasts from 4 dpf larvae. Scale bars, 5 µm; au, arbitrary unit; ρ, Spearman’s correlation coefficient.
Figure 1—figure supplement 4
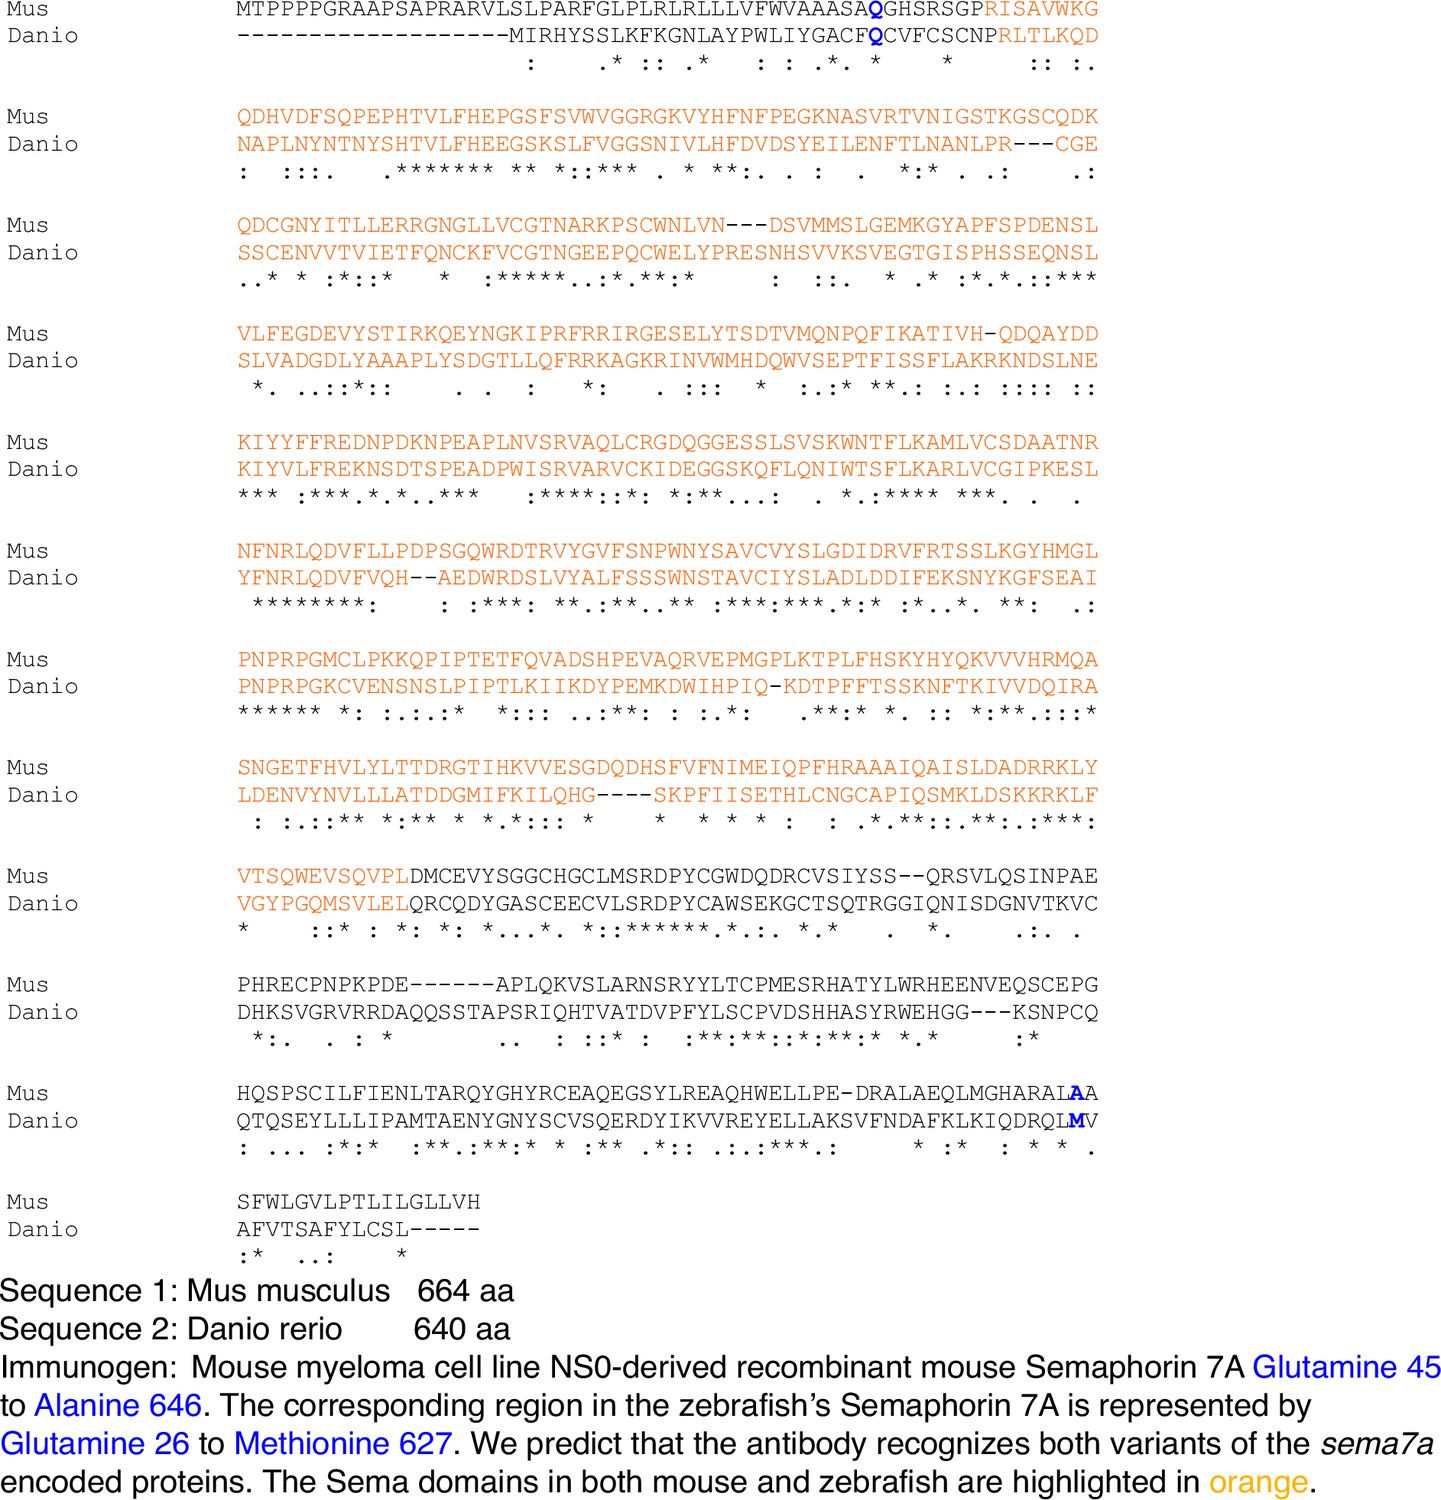
Alignment of the mouse and the zebrafish Sema7A protein sequences generated by Clustal Omega.
(A) Multiple sequence alignment depicts the conserved Sema domain (orange) and the immunogenic region for the Sema7A antibody in mouse, and its equivalent region in zebrafish.
Figure 2 with 2 supplements
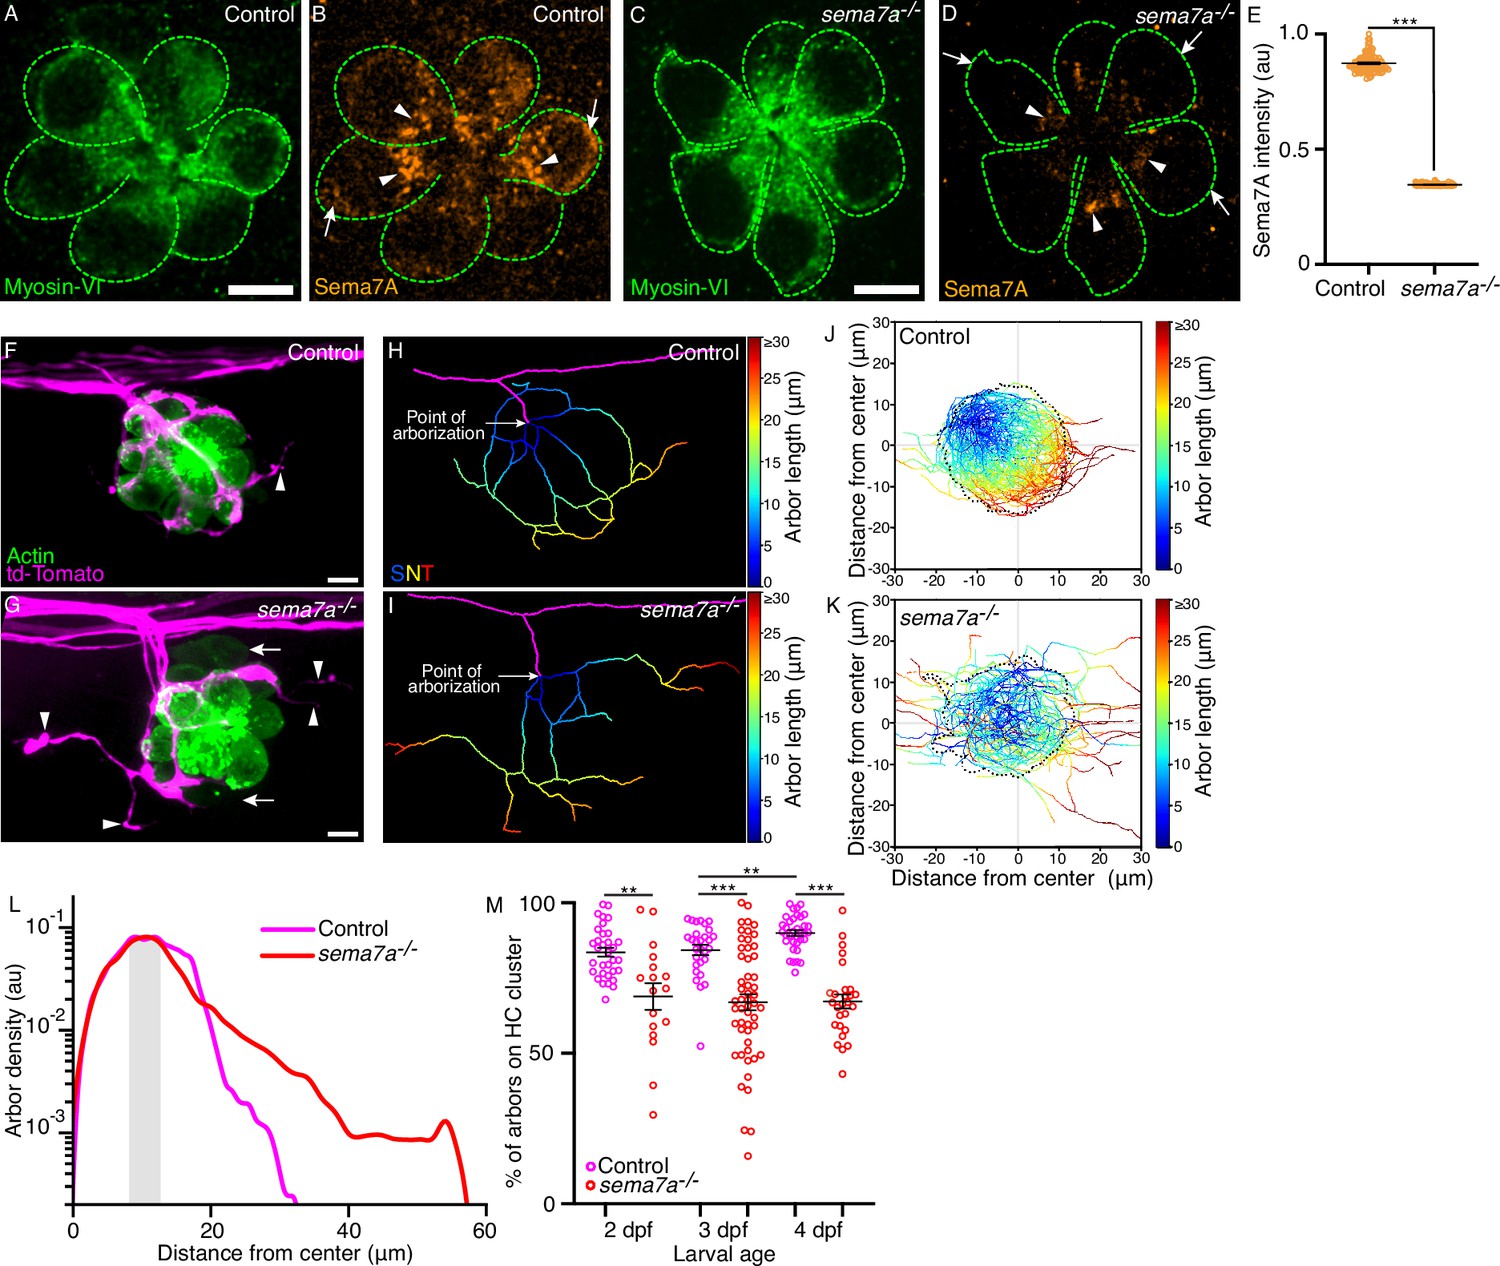
sema7a-/- mutants display aberrant sensory axon arborizations.
(A–D) In micrographs of 3 dpf control and sema7a-/- neuromasts, Myosin VI (green) marks the hair cells (green dashed lines). The level of Sema7A (orange) is highly reduced in the sema7a-/- mutant compared to the control, with sporadic localization in the subapical region (arrowheads) and none in the basolateral (arrow) region. (E) A plot of normalized Sema7A intensity from 99 control and 100 sema7a-/- hair cells quantitates the effect. (F, G) Surface views of a control and a sema7a-/- neuromast at 4 dpf depict the interaction of the sensory arbors (magenta) with hair cell clusters (green). In the control, the arbors intimately contact the hair cells, with a few exceptions (arrowhead). In the sema7a-/- mutant, the arbors direct many aberrant projections (arrowheads) away from the hair cell cluster. The two immature hair cell pairs in the sema7a-/- neuromast are indicated by arrows. (H,I) Skeletonized networks portray the three-dimensional topology of the sensory arbors from the control and the sema7a-/- neuromasts depicted in panels F and G, respectively. The pseudocolored trajectories depict the increase in arbor contour length from each point of arborization, defined as the point at which the lateral line branch (magenta) contacts hair cell cluster. (J, K) Micrographs depict the skeletonized networks of the combined 4 dpf hair cell clusters, whose centers are located at (0,0). The X- and Y-coordinates represent the anteroposterior (AP) and the dorsoventral (DV) axes of the larva, respectively. Positive values of the X- and Y-coordinates represent the posterior and ventral directions, respectively. Combined skeletonized network traces from 27 control and 27 sema7a-/- mutant neuromasts are represented. (L) The plot denotes the densities of the sensory arbors around the center of the combined hair cell clusters for 35 control (magenta) and 27 sema7a-/- (red) neuromasts at 4 dpf. The shaded area marks the region proximal to the boundary of the combined hair cell cluster. (M) The plot quantifies the degree of contact of the sensory arbors to their hair cell clusters in individual neuromasts from both control (magenta) and sema7a-/- mutants (red), each point represents a single neuromast. Thirty-three, 29, and 35 neuromasts were analyzed from 2 dpf, 3 dpf, and 4 dpf control larvae, respectively. Seventeen, 53, and 27 neuromasts were analyzed from 2 dpf, 3 dpf, and 4 dpf sema7a-/- mutant larvae, respectively. HC, hair cell; Scale bars, 5 µm; au, arbitrary unit; means ± SEMs; *** signifies p<0.001; ** signifies p<0.01.
-
Figure 2—source data 1
The source data contains comparisn of hair cell numbers, Sema7A intensity, and FM4-64 intensities between the control and the mutant larvae.
- https://cdn.elifesciences.org/articles/89926/elife-89926-fig2-data1-v1.xlsx
Figure 2—figure supplement 1
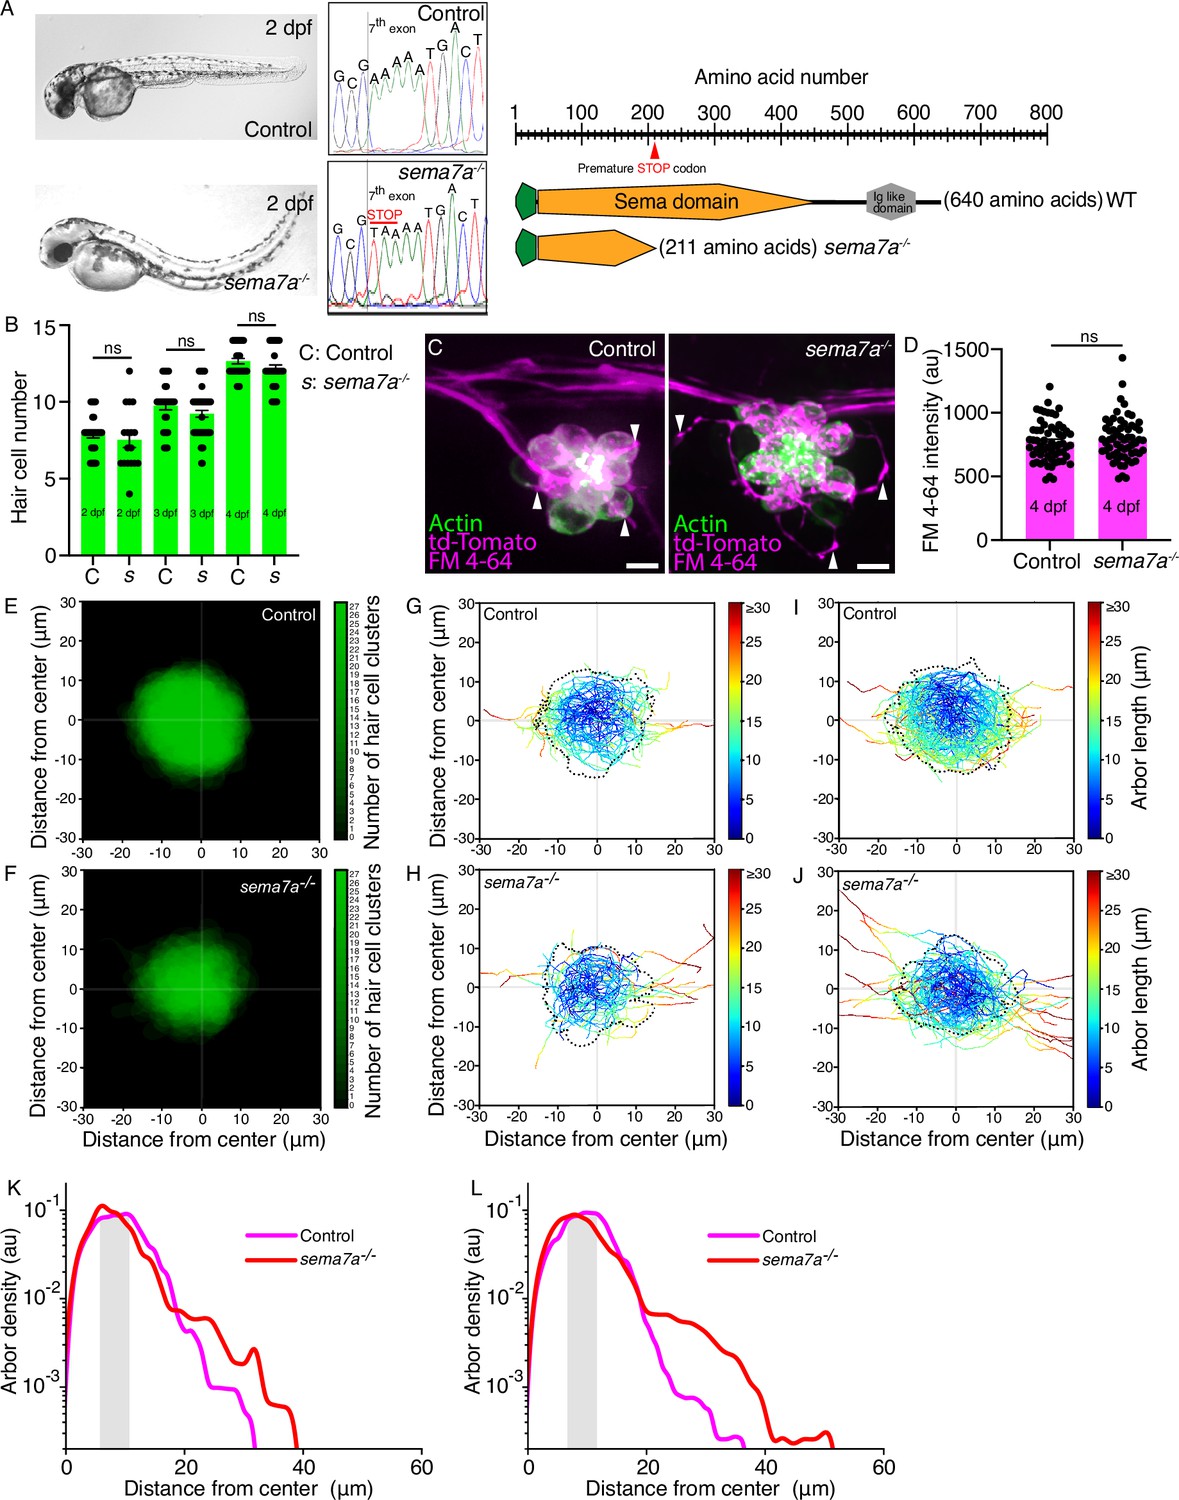
sema7a-/- mutants exhibit aberrant sensory-axon arborization throughout development.
(A) Micrographs depict the overall morphologies and sema7a genomic profiles of 2 dpf control (top) and sema7a-/- larvae (bottom). The schematic diagram on the right depicts the mutation site and the resulting early truncation of the encoded protein. (B) The plot quantitates the number of hair cells from 33, 29, and 35 neuromasts from 2 dpf, 3 dpf, and 4 dpf control larvae, respectively and 17, 53, and 27 neuromasts from 2 dpf, 3 dpf, and 4 dpf sema7a-/- mutant larvae, respectively. No significant change in hair cell number was observed between the control and the sema7a-/- neuromasts across developmental stages. (C) Micrographs depict maximum intensity projections of 4 dpf neuromasts from control and sema7a-/- larvae where the hair cells (green) are stained with FM 4–64 (magenta). The sensory arbors (arrowheads, magenta) tightly enwrap the clustered hair cells in the control neuromast but show aberrant arborization in the sema7a-/- larvae. (D) The plot quantitates the average FM 4–64 intensities from the hair cells of the control and the sema7a-/- neuromasts. (E, F) Micrographs depict combined 4 dpf hair cell clusters, each of whose centers arise located at (0,0). The X- and Y-coordinates represent the anteroposterior (AP) and dorsoventral (DV) axes of the larva, respectively. Positive values of the X- and Y-coordinates represent posterior and ventral directions, respectively. Combined hair cell clusters from 27 control and 27 sema7a-/- mutant neuromasts are represented. (G, H) Micrographs depict the skeletonized networks of the combined 2 dpf hair cell clusters from 17 control and 17 sema7a-/- mutant neuromasts. (I, J) Micrographs depict the skeletonized networks of the combined 3 dpf hair cell clusters from 29 control and 29 sema7a-/- mutant neuromasts. (K) A plot quantitates the densities of the sensory arbors around the center of the combined hair cell clusters for 33 control (magenta) and 17 sema7a-/- (red) neuromasts at 2 dpf. The shaded area marks the region proximal to the boundary of the combined hair cell cluster. (L) A plot quantitates the densities of the sensory arbors around the center of the combined hair cell clusters for 29 control (magenta) and 53 sema7a-/- (red) neuromasts at 3 dpf. The shaded area marks the region proximal to the boundary of the combined hair cell cluster. Scale bars, 5 µm; au, arbitrary units; ns, not significant.
Figure 2—figure supplement 2

Quantification of sensory arbor distributions and contacts with hair cell clusters.
(A) A schematic drawing of the combined hair cell cluster and surrounding region depicts concentric sections of equal area in distinct colors (cyan, green, yellow, and red). The arbor density is plotted as a histogram against the distance (black arrow) from the center (black circle) of the combined hair cell cluster. The histogram is represented as a density trace graph (magenta). (B) A schematic drawing of a posterior lateral-line neuromast depicts the posterior lateral-line (PLL) nerve (black), posterior lateral-line branch (black), the point or arborization, the sensory arbors (magenta) that contact the hair cell cluster (green), and the sensory arbors that project away (blue) from the hair cell cluster.
Figure 3 with 2 supplements
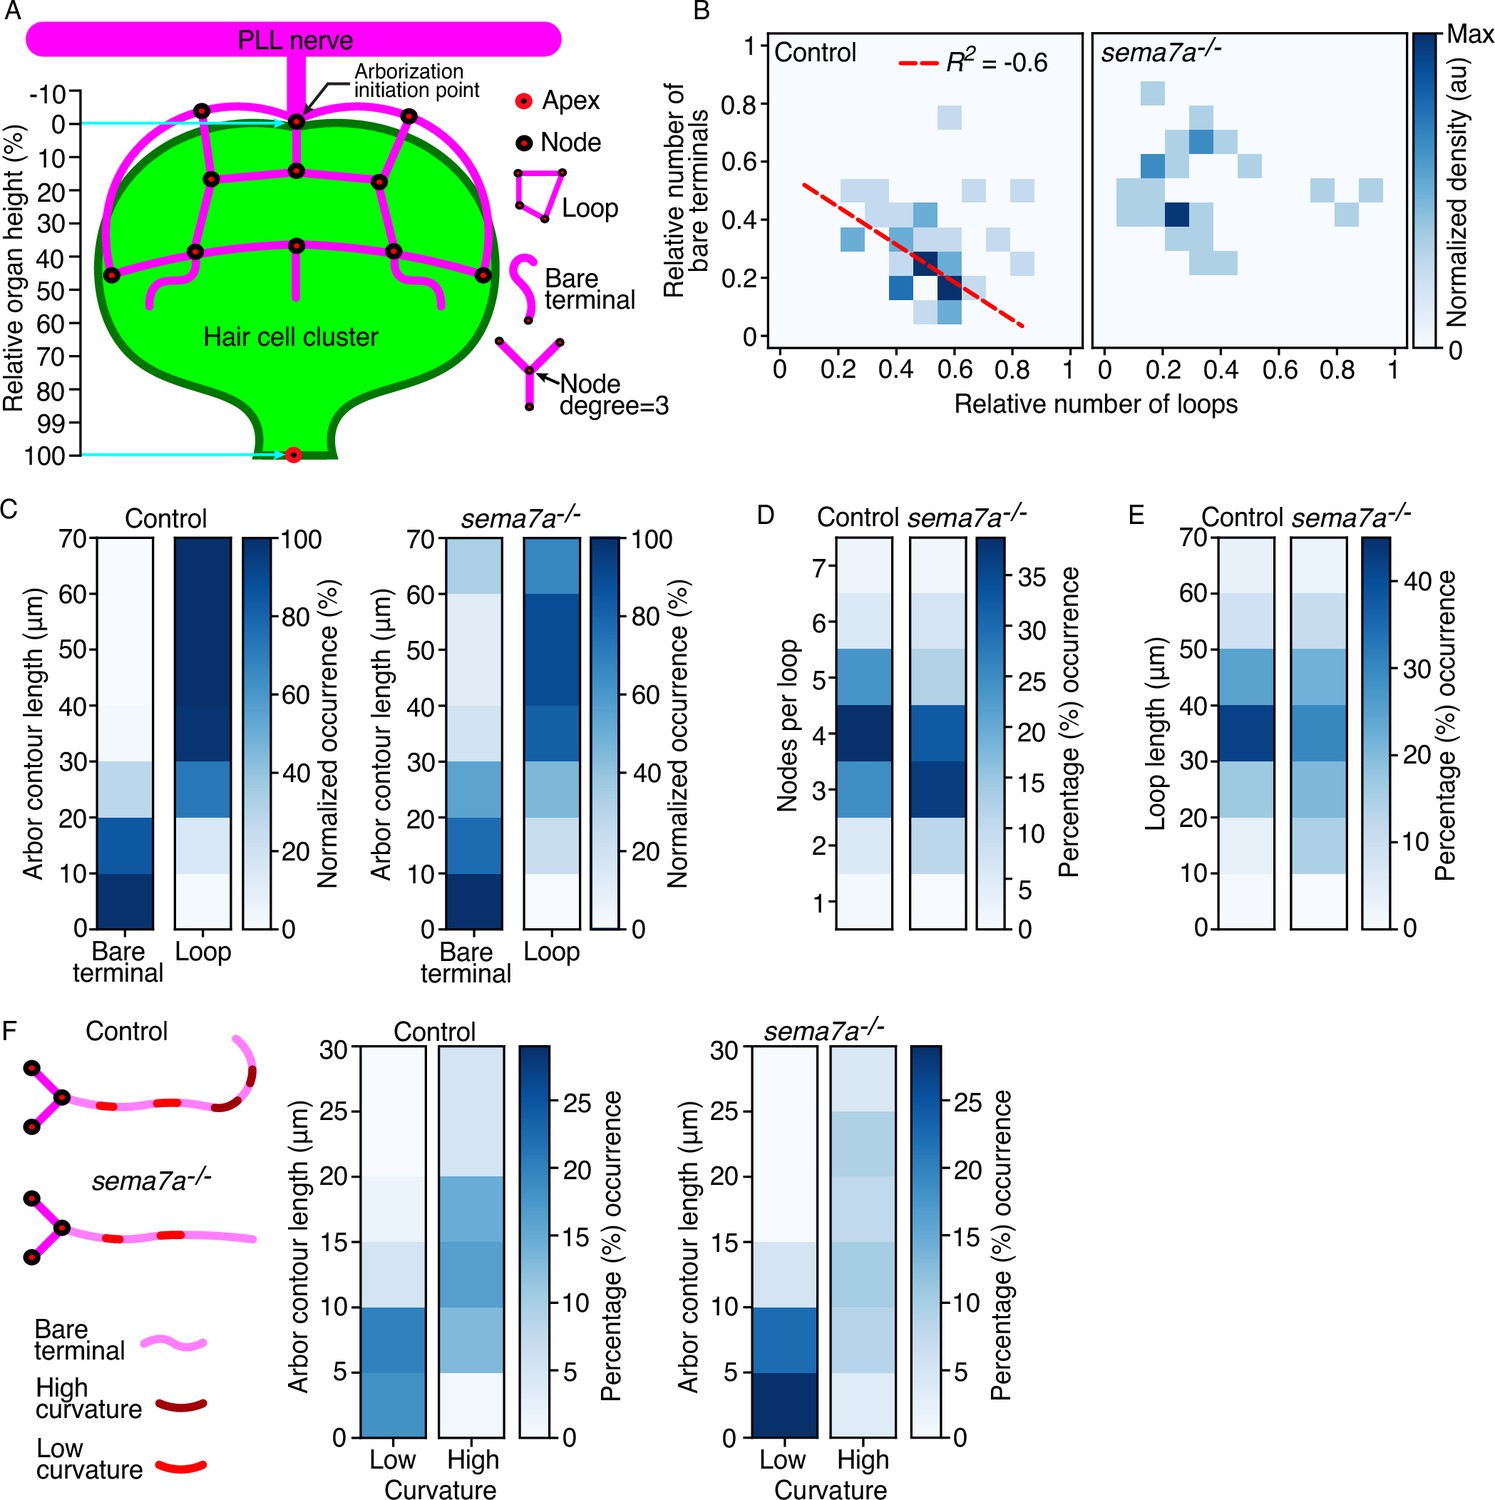
Sema7A patterns the topology of the sensory arbor network.
(A) A schematic drawing of the combined hair cell cluster (green) and associated sensory axons (magenta) shows diverse topological features of the arborization network, including nodes, loops, bare terminals, node degree, and bare-terminal curvature. The apex is defined as the center of the hair bundle cluster and the base is denoted by the node from which the arborizations extends. The relative organ height describes the position along the axis formed between the arborization initiation point and the apex of the hair cell cluster. (B) The correlation between the relative number of bare terminals and loops from 35 control neuromasts and 27 sema7a-/- neuromasts at 4 dpf shows a negative correlation in the control but a scattered distribution in the mutants. The same neuromasts were analyzed in the subsequent panels. R2, correlation coefficient. Dashed red line depicts the regression slope. (C) The relationship of contour lengths to bare terminals and loops reveals reduced looping in the mutants. (D) Quantification of the number of nodes per loop demonstrates a decrease in mutants. (E) Mutant larvae manifest a broader distribution of loop lengths compared to controls. (F) A schematic diagram of the extending bare terminals depicts regions of high and low curvature along the length of the arbor. The distributions of bare terminals between low- and high-curvature groups show an enrichment of long, highly curved arbors in the control and short, linear arbors in the mutants. Statistical analyses are displayed in Table 1.
Figure 3—figure supplement 1
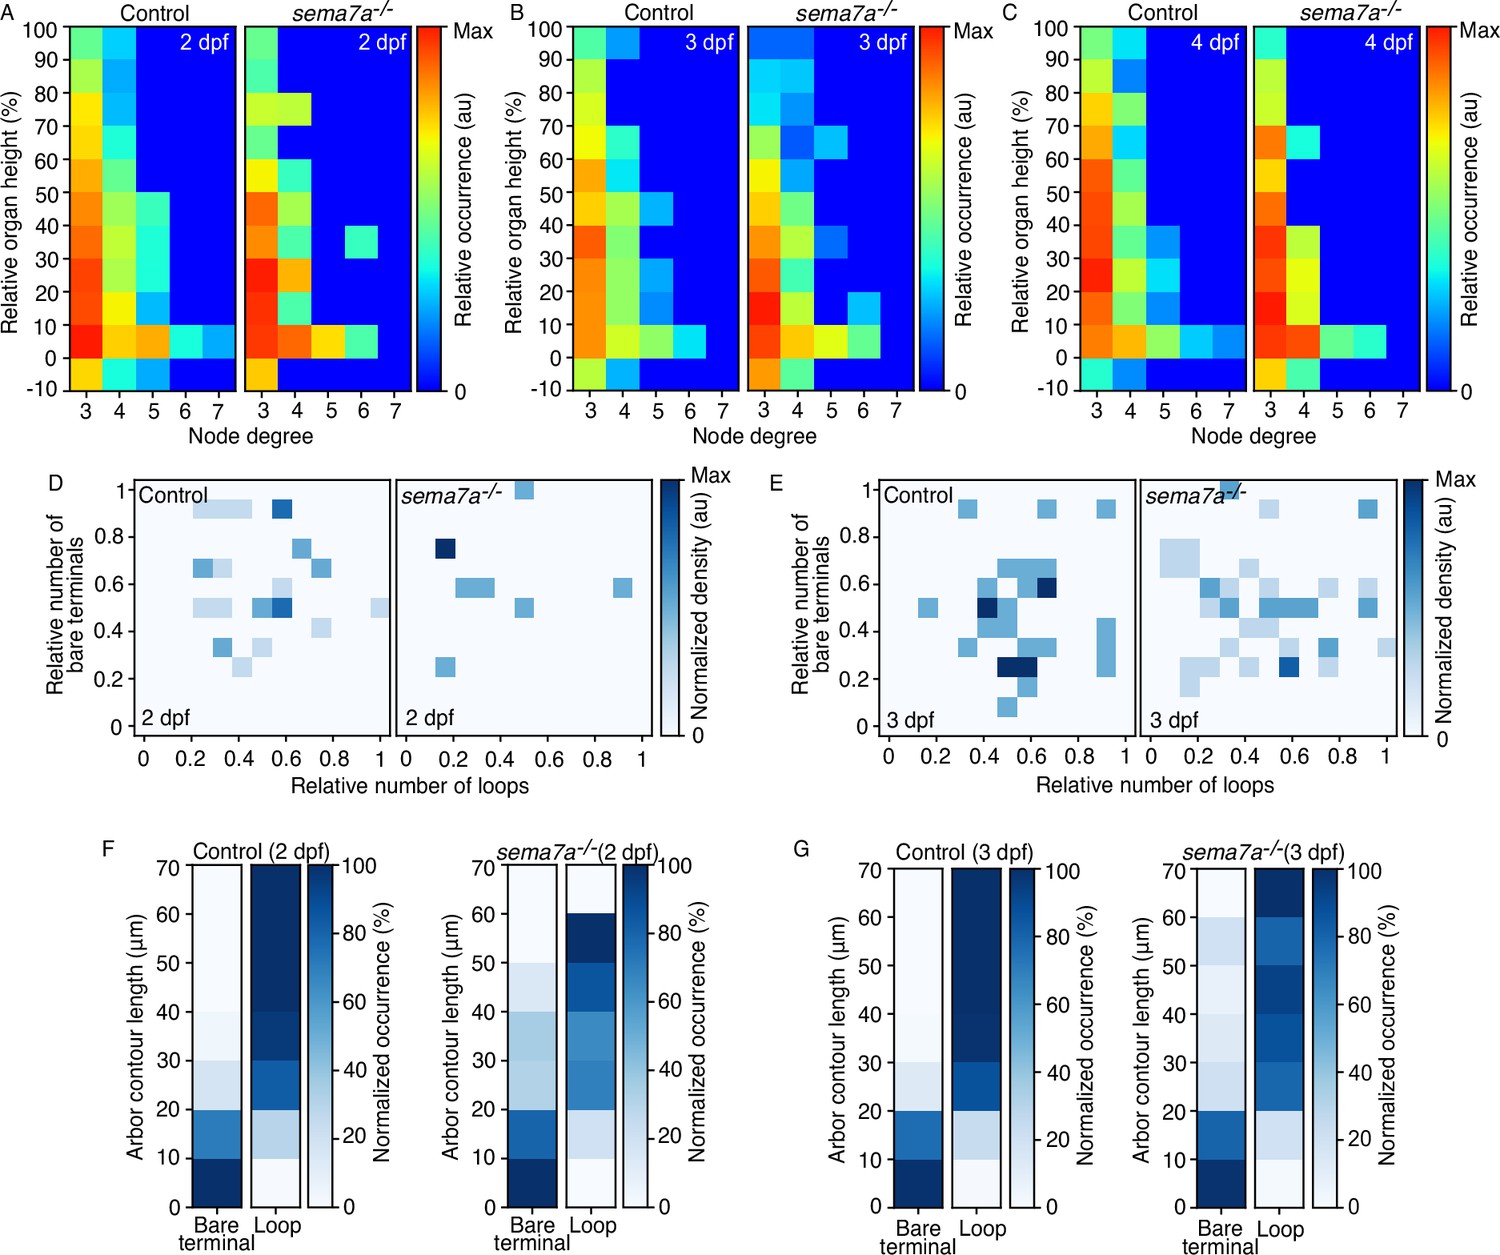
Quantification of topological features across developmental stages and genotypes.
(A–C) The distribution of node degrees as a function of the height in hair cell clusters shows the difference in the network’s hierarchical organization between control and sema7a-/- larvae. Nodes of low degree are commonly observed between genotypes across developmental stages (A, B), but their distribution along the cluster height became significantly different at 4 dpf (C), with nodes in control larvae localizing higher along the axis than in the mutants. In this and the following two panels, 33, 29, and 35 neuromasts were analyzed from 2 dpf, 3 dpf, and 4 dpf control larvae, respectively and 17, 53, and 27 neuromasts were analyzed from 2 dpf, 3 dpf, and 4 dpf sema7a-/- mutant larvae, respectively (D, E) The correlations between the relative number of bare terminals and loops from control and sema7a-/- neuromasts reveal dispersive distributions at both 2 dpf (D) and 3 dpf (E) stages, suggesting that the networks are undergoing reorganization and yet to adopt an ordered topology. (F, G) In the distribution of arbors between bare terminals and loops with respect to their contour lengths, mutants’ arbors display significantly higher propensity to remain as bare terminals compared to the controls at both 2 dpf (F) and 3 dpf (G). The samples were identical to those in the previous panel. Statistical analyses are displayed in Table 1.
Figure 3—figure supplement 2
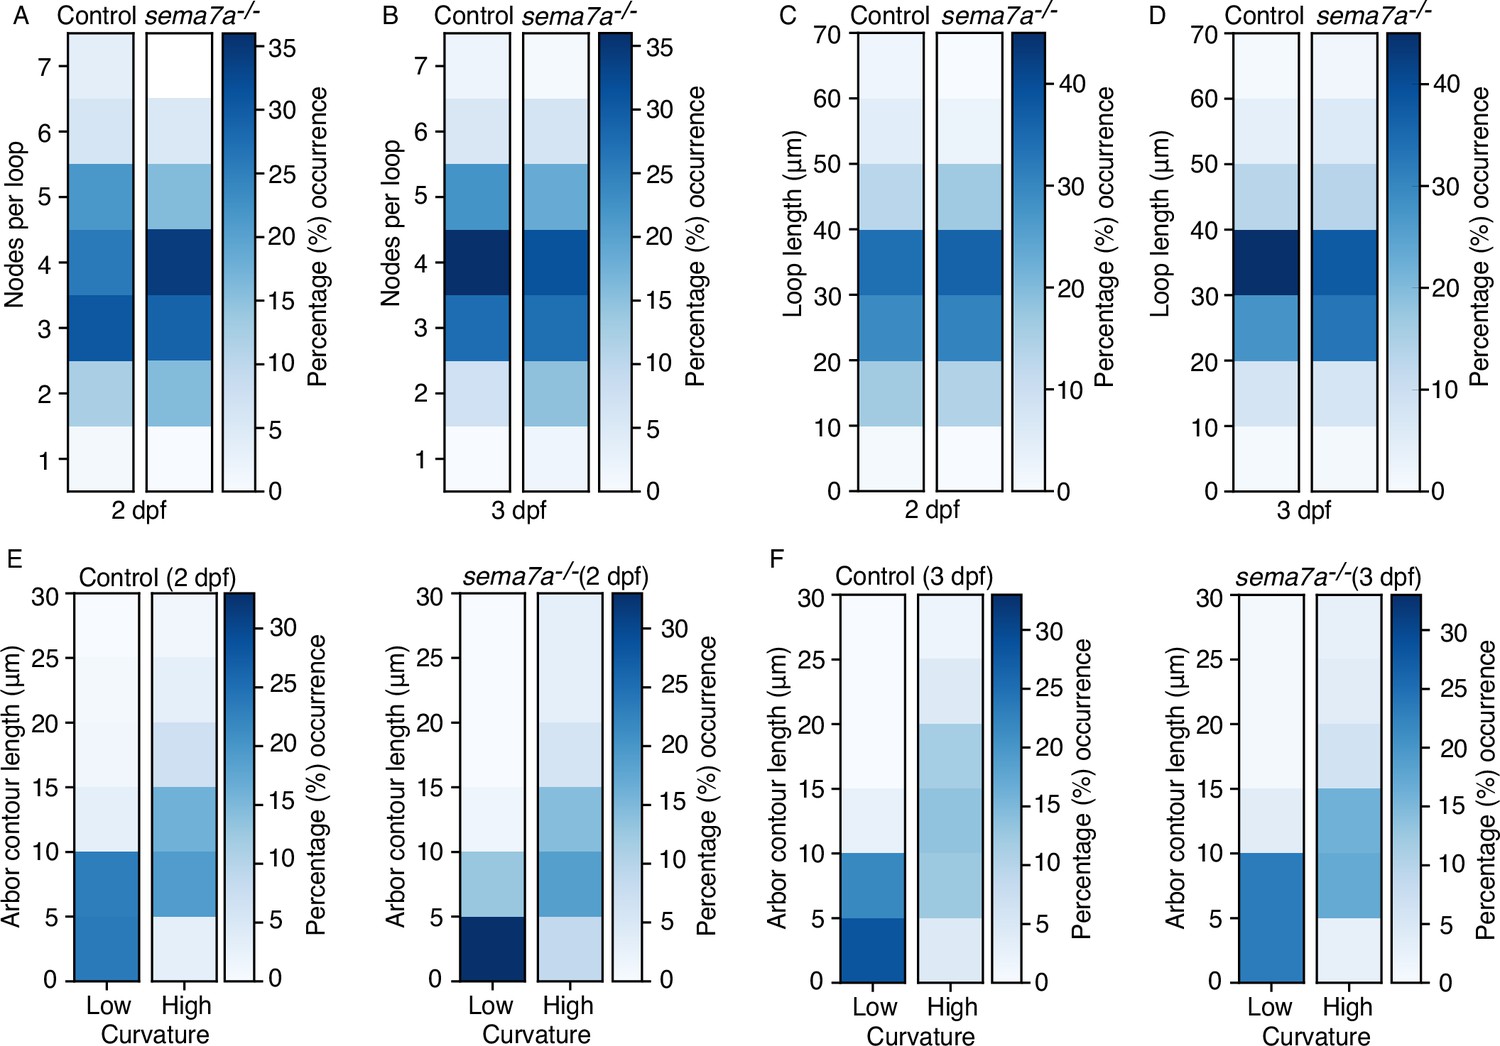
Quantification of topological features between control and sema7a-/- larvae across developmental stages.
(A, B) Quantifications of the number of nodes per loop demonstrate a broader, but not significantly different, distribution in the mutants than the controls at both 2 dpf (A) and 3 dpf (B). In this and the following panels, 33 and 29 neuromasts were analyzed from 2 dpf and 3 dpf control larvae, respectively and 17 and 53 neuromasts were analyzed from 2 dpf and 3 dpf sema7a-/- mutant larvae, respectively. (C, D) Quantifications of loop lengths from the same larvae indicate a wider, but not significantly different, distribution in the mutants than the controls at both 2 dpf (C) and 3 dpf (D). (E, F) The distributions of bare terminals between low- and high-curvature groups from the same larvae show higher occurrences of long, curved arbors in the control and short, linear arbors in the mutants at both 2 dpf (E) and 3 dpf (F) stages. Statistical analyses are displayed in Table 1.
Figure 4 with 2 supplements
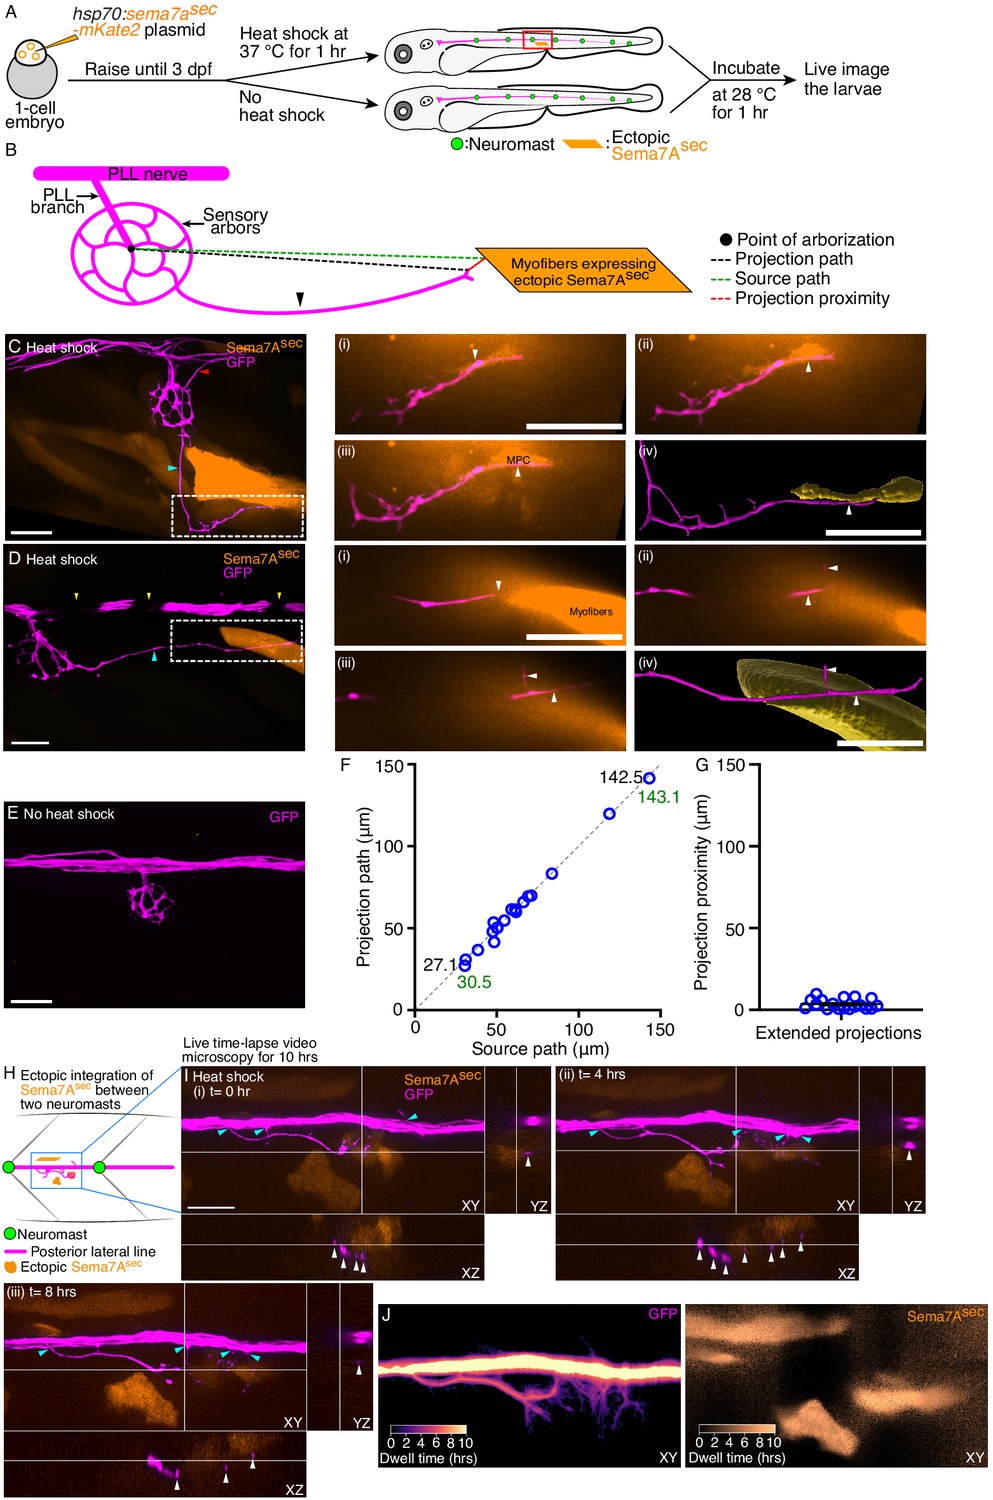
Ectopic Sema7Asec diffusive cue provides neural guidance in vivo.
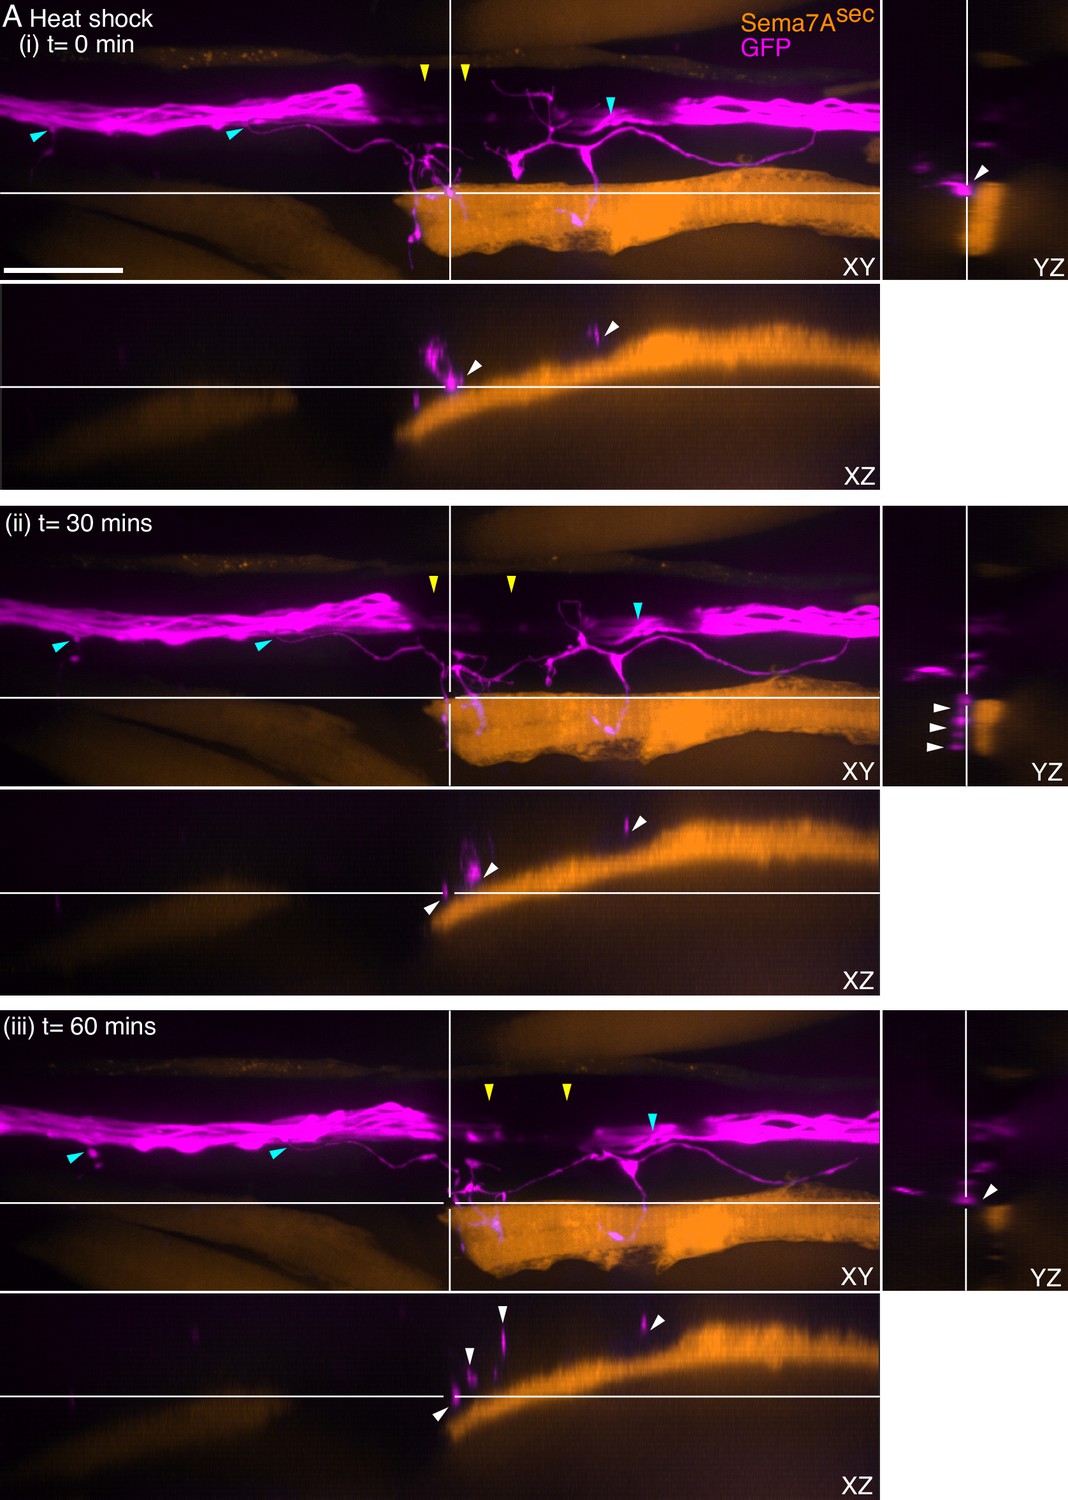
(A) A diagrammatic overview depicts the generation of a transgenic animal that expresses the Sema7Asec protein ectopically under the control of a thermally inducible promoter. Larvae with ectopic myotomal-integration near the network of sensory arbors (red rectangle) were imaged to analyze arbor morphology. (B) A schematic drawing of a sensory arbor from a heat-shocked larva depicts an extended axonal projection (arrowhead) that reaches toward the myofibers expressing the ectopic Sema7Asec protein. Parameters that quantitate the accuracy of the extended axonal projections toward the ectopic Sema7Asec sources are denoted. (C) In a micrograph of an ectopically expressing Sema7Asec (orange) larva, the sensory arbor (magenta) extends two aberrant axonal projections. One elongates (cyan arrowhead) along the somite boundary to reach and contact an ectopically integrated muscle progenitor cell (white dashed line) and the other (red arrowhead) reenters the posterior lateral-line nerve while following a second ectopic source. The through-focus scans (i–iii) from the epidermis to the dermomyotome and the three-dimensional (3D) surface reconstruction (iv) reveal the intimate contact between the aberrant sensory arbor (arrowheads) and the muscle progenitor cell. (D) In a micrograph of an ectopically expressing Sema7Asec (orange) larva, the sensory arbor (magenta) extends a single aberrant axonal process (cyan arrowhead) to reach ectopically integrated myofibers (white dashed line). The through-focus scans (i–iii) from the epidermis to the dermomyotome and the 3D surface reconstruction (iv) reveal the proximal association of the aberrant sensory arbor (arrowheads) to the myofibers. Melanocytes (yellow arrowhead) along the horizontal myoseptum intermittently block the visibility of the lateral-line nerve. (E) An injected, but not heat-shocked, control larva does not express ectopic Sema7Asec and does not show aberrant projection from the sensory arbor. (F) A plot demonstrates the accuracy of 18 extended axonal arbors in finding ectopic Sema7Asec sources. Each circle represents a single ectopic integration event. The two pairs of numbers represent the minimal and maximal lengths of the projection path (black) and its corresponding source path (green). (G) A plot quantitates the distribution of projection-proximity length from 18 ectopic integration events. (H) A schematic drawing of a section of the lateral-line nerve between two neuromasts from a heat-shocked larva depicts a few extended neurites (magenta) reaching toward the cells expressing the ectopic Sema7Asec protein (orange). The Sema7Asec integration site (blue rectangle) with the sensory axonal projections was imaged for ten hours to visualize axonal dynamics. (I) Micrographs (i-iii) at three distinct times in the time-lapse video microscopy show directed branching (cyan arrowheads) of the sensory neurites from the lateral-line nerve toward the ectopic Sema7Asec sources. Each panel depicts the ectopic integration site and the associated sensory neurites from three different planes, XY, XZ, and YZ. White arrowheads in XZ and YZ planes highlight the close association of the sensory axons with the ectopic Sema7Asec sources. The t=0 hr denotes the onset of imaging, which is two hours post the beginning of heat shock. (J) The micrographs depict in pseudocolored trajectories the dwell times of the sensory neurites (left) at the Sema7Asec sources (right) for ten hours. MPC, muscle progenitor cell; scale bars, 20 µm; means ± SEMs.
-
Figure 4—source data 1
The source data depicts the accuracy of the 18 extended axonal arbors in finding ectopic Sema7Asec sources.
- https://cdn.elifesciences.org/articles/89926/elife-89926-fig4-data1-v1.xlsx
Figure 4—figure supplement 1
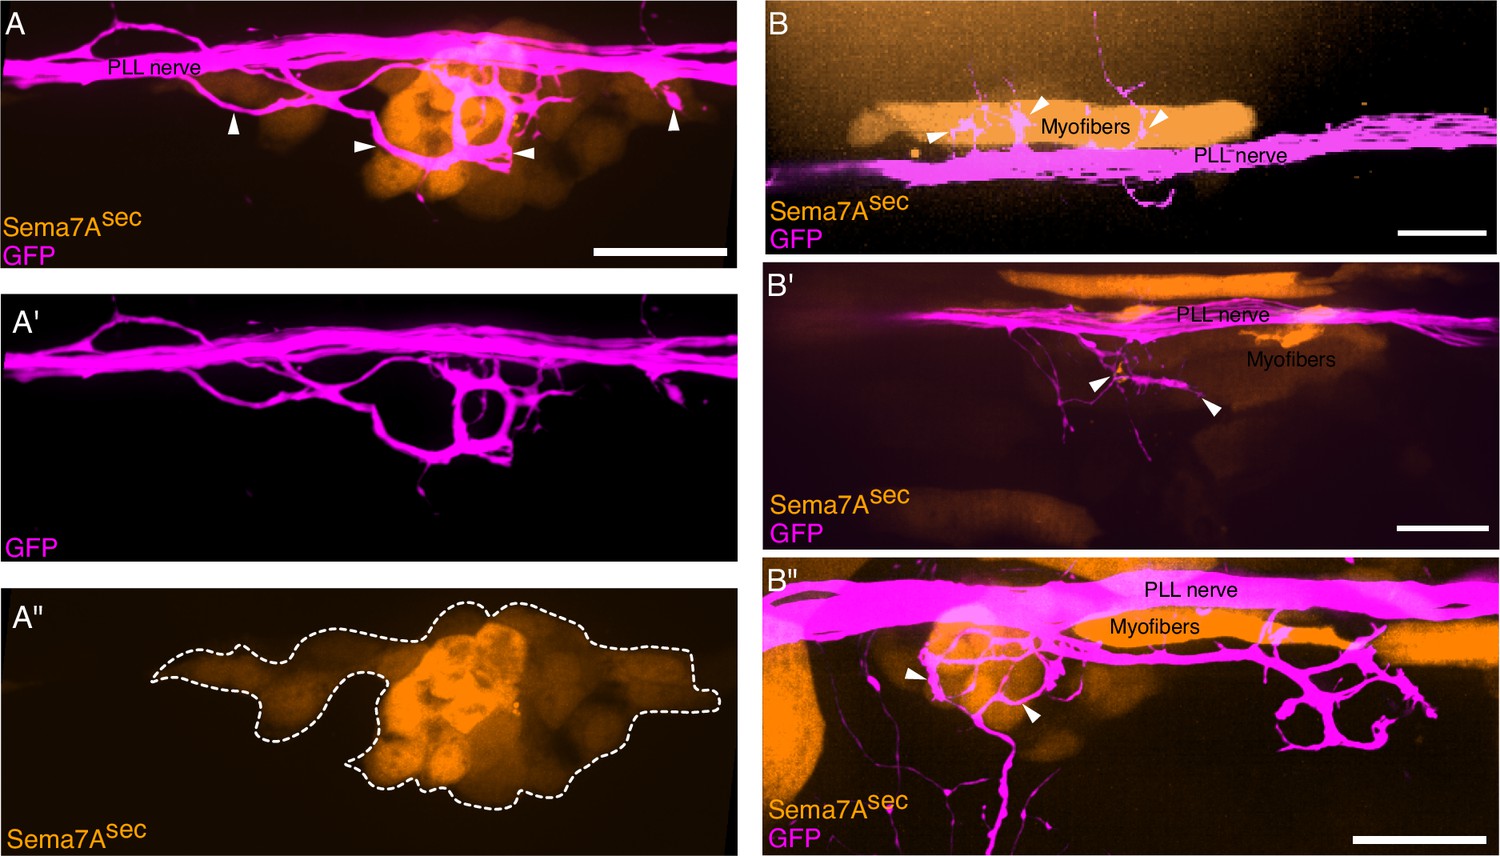
Ectopic Sema7Asec diffusive cues induce aberrant sensory neurite extension.
(A-A") In a micrograph of an ectopically expressing Sema7Asec (orange) larva, the sensory arbors (magenta) extend multiple axonal projections (arrowheads) that reenter the lateral-line nerve while following an ectopic Sema7A source. Maximal-intensity projections of the sensory arbors and the ectopically expressing Sema7A cells (white dashed line) are shown in A' and A", respectively. (B-B") Micrographs depict three individual incidents of ectopic sema7asec (orange) integrations that occurred distant from neuromasts. In each case, a set of myofibers expresses the ectopic Sema7Asec protein that induces neurite extensions (arrowheads) from the lateral-line nerve (magenta) toward itself. Scale bars, 20 µm.
Figure 4—figure supplement 2
Ectopic integration of Sema7Asec distant from the neuromast induces sensory neurite extension.
(A) Micrographs of a section of the lateral-line nerve between two neuromasts from a 3-dpf heat-shocked larva depicts a few extended neurites (magenta) reaching toward the cells expressing the ectopic Sema7Asec (orange). The Sema7Asec integration site with the sensory axonal projections was imaged for one hour to visualize axonal dynamics. Micrographs (i-iii) at three distinct time-points from the time-lapse video microscopy show directed branching (cyan arrowheads) of the sensory neurites from the lateral-line nerve toward the ectopic Sema7Asec sources. Each panel depicts the ectopic integration site and the associated sensory neurites from three different planes, XY, XZ, and YZ. White arrowheads in XZ and YZ planes highlight the close association of the sensory axons with the ectopic Sema7Asec sources. Melanocytes (yellow arrowheads) along the horizontal myoseptum intermittently block the visibility of the lateral-line nerve. Scale bar, 20 µm.
Figure 5
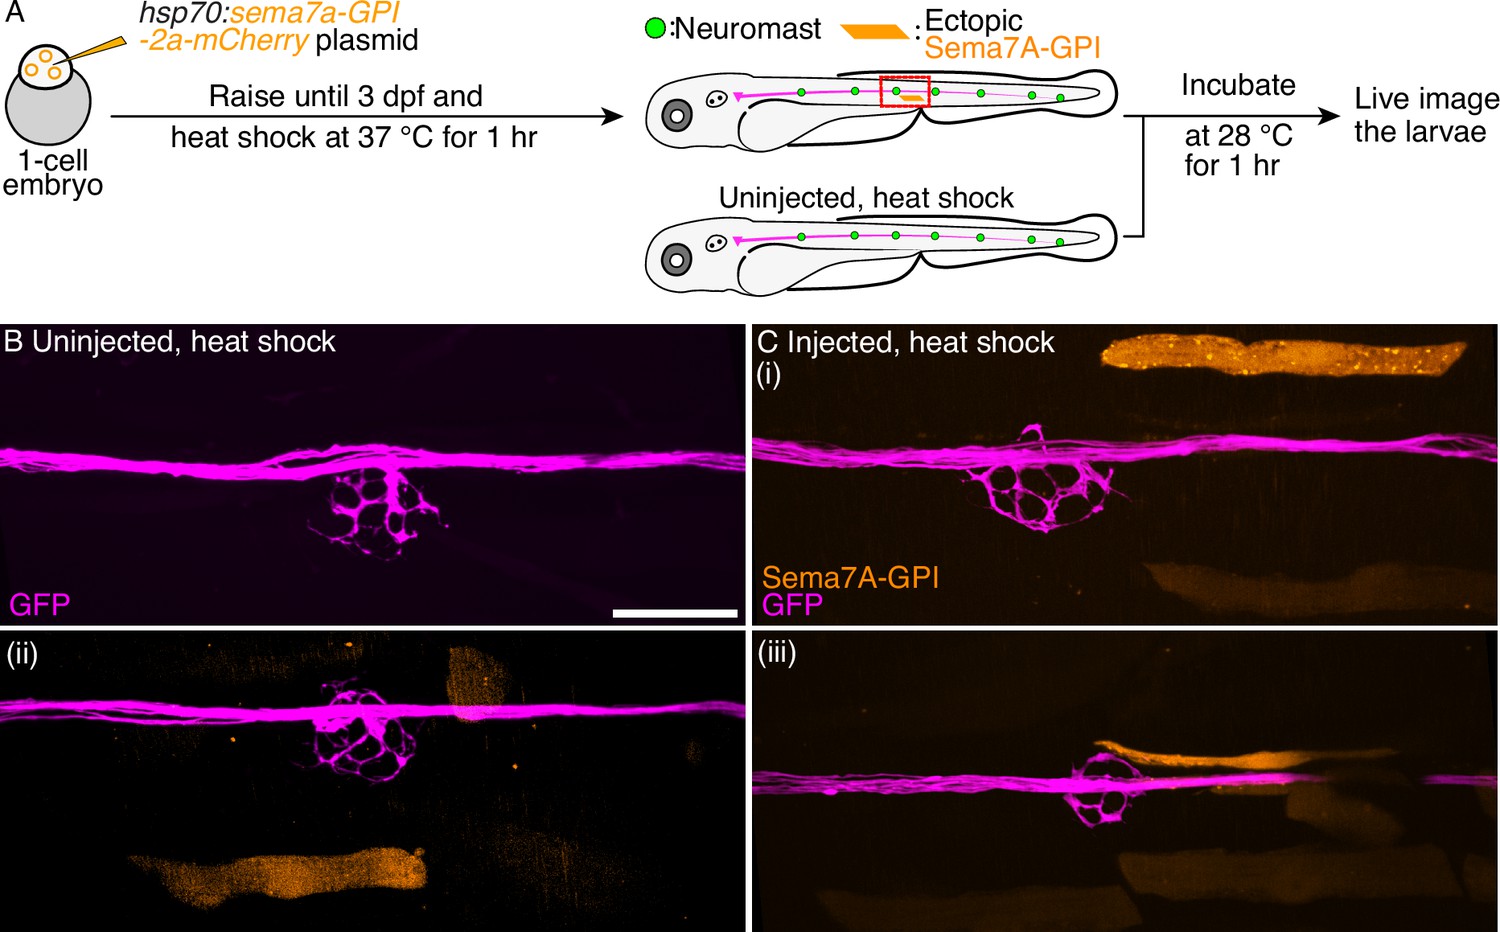
Ectopic Sema7A-GPI fails to guide sensory arbors from a distance.
(A) A diagrammatic overview depicts the generation of a transgenic animal that expresses the Sema7A-GPI protein ectopically under the control of a thermally inducible promoter. Larvae with ectopic myotomal-integration near the network of sensory arbors (red rectangle) were imaged to analyze arbor morphology. Uninjected, heat-shocked larvae were used as controls. (B) Uninjected and heat-shocked larva depicts normal arborization pattern of the sensory axons (magenta). (C) Injected and heat-shocked larvae robustly express the Sema7A-GPI in the myofibers (orange). Panels (i-iii) depict the ectopically expressing Sema7A-GPI myofibers that fail to attract sensory arbors toward itself. Scale bar, 20 µm.
Figure 6 with 2 supplements
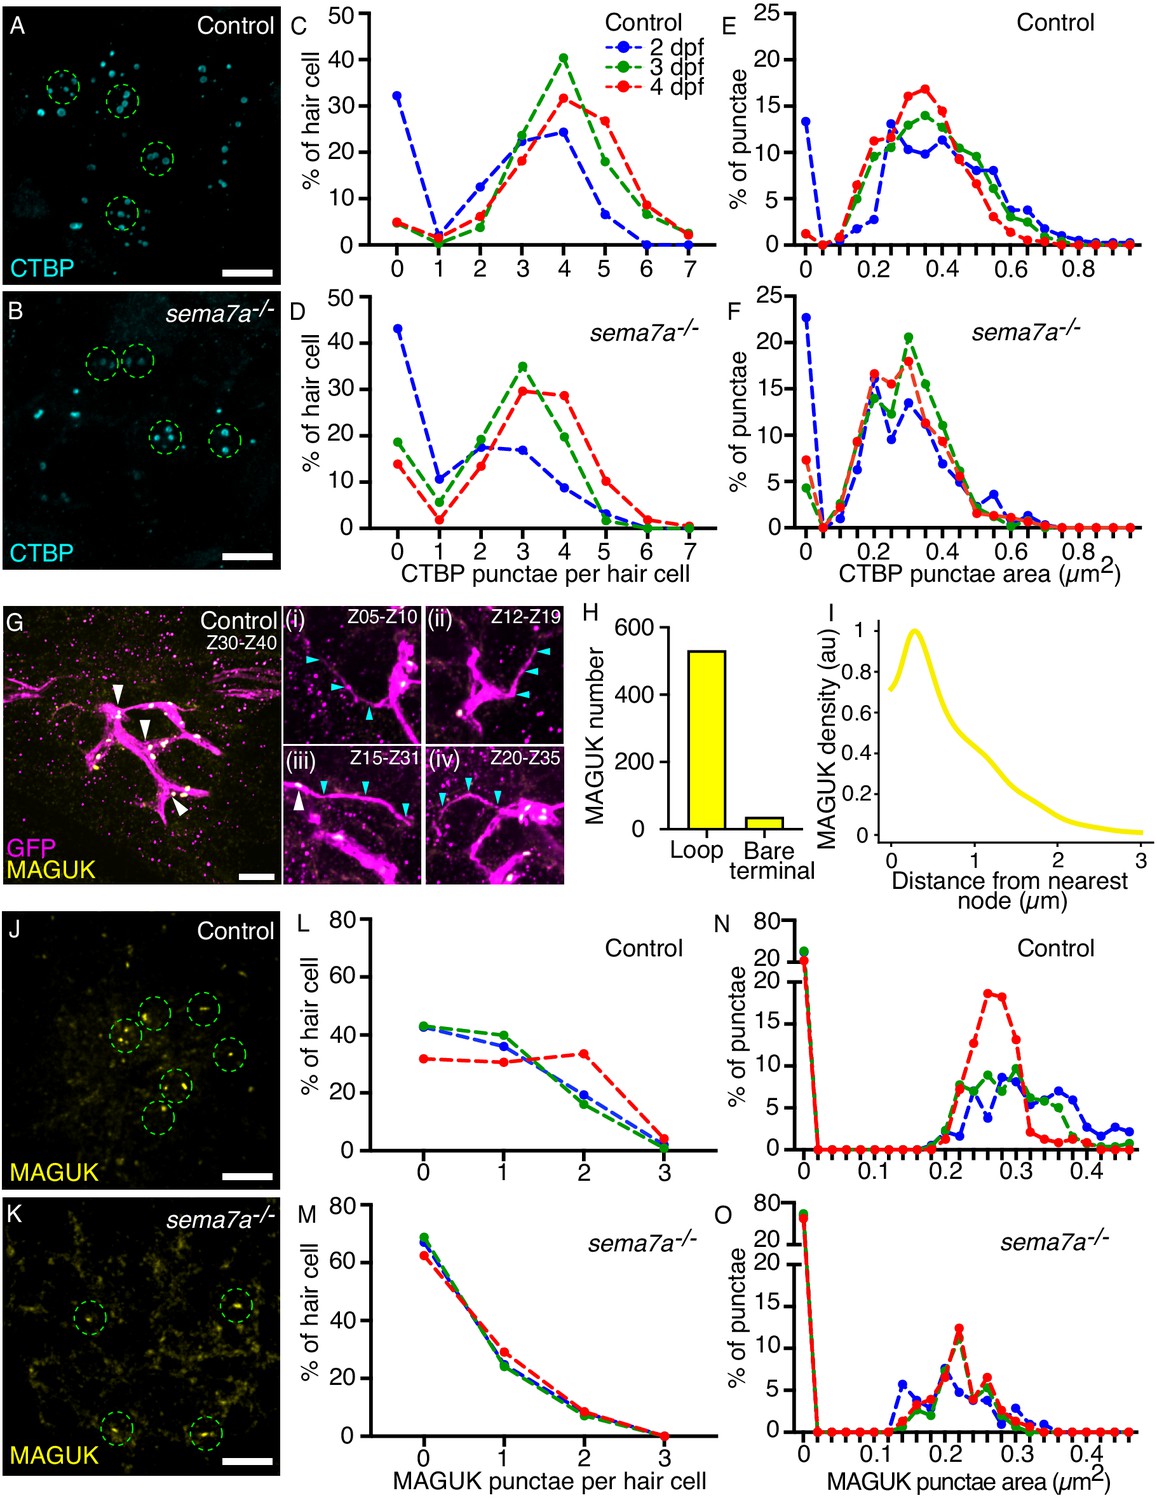
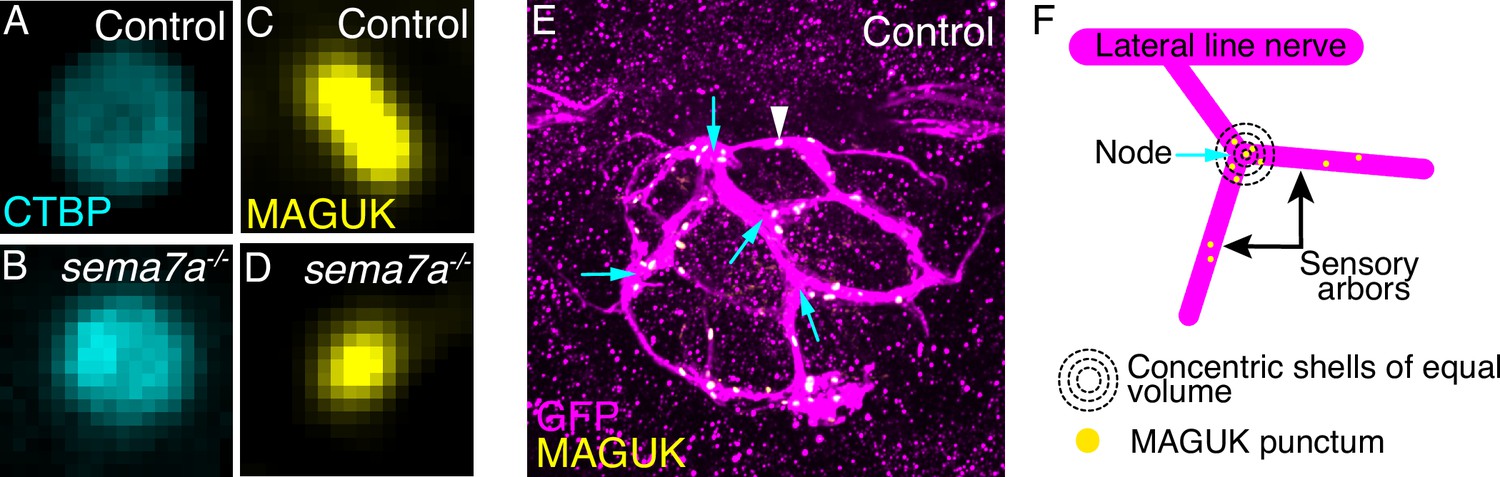
Sema7A deficiency impairs synaptic assembly.
(A, B) Maximal-intensity projections of micrographs from a control and a sema7a-/- neuromast depict the presynaptic aggregates marked by CTBP (cyan). The approximate hair cell basal region is outlined by dashed green circles. (C–F) Plots quantitate the numbers of presynaptic aggregates (C, D) and their areas (E, F), in each hair cell across developmental stages. One hundred and fifty-two, 317, and 325 hair cells were analyzed from 2 dpf, 3 dpf, and 4 dpf control larvae, respectively. One hundred and sixty, 216, and 177 hair cells were analyzed from 2 dpf, 3 dpf, and 4 dpf sema7a-/- mutant larvae, respectively. (G) A micrograph generated from maximal-intensity projection of ten consecutive through-focus scans across Z-planes of a control 4 dpf neuromast depict the sensory arbors (magenta) and the postsynaptic aggregates marked by MAGUK (yellow, white arrowheads). The MAGUK punctae primarily occur on the loop and aggregate near the nodes. Panels (i–iv) depict maximal-intensity projection of consecutive through-focus scans of distinct Z-planes to show bare terminals. In each panel, the bare terminal (magenta, cyan arrowheads) rarely harbors postsynaptic aggregates (yellow, white arrowhead). (H) Quantification of the distribution of the MAGUK-punctae between the two topological features of the network depicts enrichment of postsynaptic densities on the loops over the bare terminals. (I) A histogram shows the distribution of MAGUK-punctae density against the distance from the node. The histogram is represented as a density trace graph (yellow). For both H and I, five hundred and sixty-seven MAGUK punctae were analyzed from 16 neuromasts of 4 dpf larvae. (J, K) Maximal-intensity projections from micrographs of a control and a sema7a-/- neuromast depict the postsynaptic aggregates marked by MAGUK (yellow). The approximate hair cell basal region is outlined by dashed green circles. (L–O) Plots quantitate the numbers of postsynaptic aggregates (L, M) and their areas (N, O), in each hair cell across developmental stages. One hundred and fifty, 218, and 167 hair cells were analyzed from 2 dpf, 3 dpf, and 4 dpf control larvae, respectively. Ninety-seven, 141, and 141 hair cells were analyzed from 2 dpf, 3 dpf, and 4 dpf sema7a-/- mutant larvae, respectively. Scale bars, 5 µm.
-
Figure 6—source data 1
The source data represents the number and area of pre and post synaptic aggregates across genotypes.
- https://cdn.elifesciences.org/articles/89926/elife-89926-fig6-data1-v1.xlsx
Figure 6—figure supplement 1
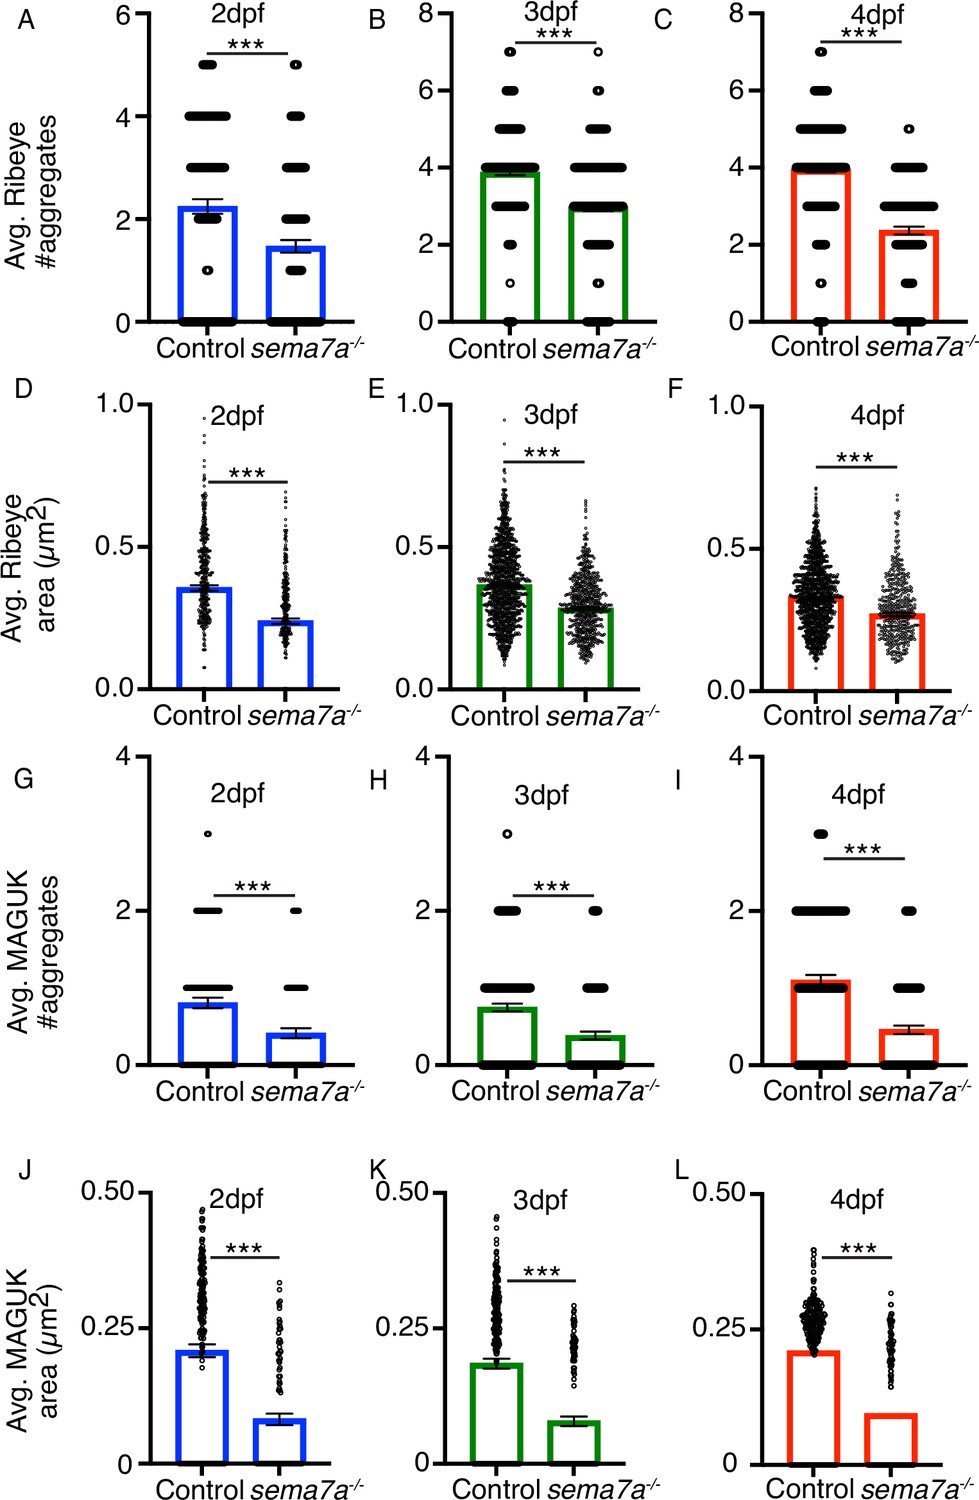
sema7a-/- mutants display impaired synaptic assembly.
(A–F) The plots quantitate the average numbers and areas of presynaptic aggregates from control and sema7a-/- neuromasts. Significant decreases in the numbers and areas of presynaptic aggregates are observed across development. Three hundred and forty-one, 1229, and 1286 presynaptic aggregates were analyzed from 2 dpf, 3 dpf, and 4 dpf control larvae, respectively. Two hundred and thirty-five, 643, and 419 presynaptic aggregates were analyzed from 2 dpf, 3 dpf, and 4 dpf sema7a-/- mutant larvae, respectively. (G–L) The plots quantitate the average numbers and areas of postsynaptic aggregates from control and sema7a-/- neuromasts. Significant decreases in the numbers and areas of postsynaptic aggregates occurred during development. Three hundred and ninety-seven, 1243, and 1300 postsynaptic aggregates were analyzed from 2 dpf, 3 dpf, and 4 dpf control larvae, respectively. Three hundred and four, 651, and 451 postsynaptic aggregates were analyzed from 2 dpf, 3 dpf, and 4 dpf sema7a-/- mutant larvae, respectively. Means ± SEMs; *** implies p<0.001.
Figure 6—figure supplement 2
Morphologies of presynaptic and postsynaptic assemblies and the distribution of postsynaptic aggregates across the sensory arbor network.
(A,B) The micrographs depict single presynaptic aggregate marked by CTBP in control (A) and in sema7a-/- mutant (B) larvae at 4 dpf. (C,D) The micrographs depict single postsynaptic aggregate marked by MAGUK in control (C) and in sema7a-/- mutant (D) larvae at 4 dpf. (E) A maximal-intensity projection micrograph depicts the sensory arbor network (magenta) and the enrichment of the postsynaptic assemblies (yellow, white arrowhead) near the nodes (cyan arrows). (F) A schematic diagram of the sensory arbor network depicts the enrichment of the MAGUK punctae near the node (cyan arrow). The three-dimensional space surrounding each node was divided into concentric shells of equal volume to measure the distribution of MAGUK-punctae density across the network.
Figure 7

Expression of diverse neural guidance cues in developing neuromasts.
Analysis of single cell RNA-sequencing data (Lush et al., 2019) shows the expression of multiple neural guidance genes that are expressed across young hair cells (Y), mature hair cells (M), and support cells (SC). Dot sizes and colors signify the proportion of cells in each cluster that express a gene and the average strength of expression(log[(counts/10,000)+1]), respectively.
Videos
Video 1
Sema7A is enriched at the hair cell base and sensory-axon interface.
A through-focus scan of a 4 dpf control neuromast depicts the hair cells (green) that are innervated by the sensory axons (magenta) at their basolateral surfaces where the Sema7A protein (orange) is highly enriched. Scale bar, 5 µm.
Video 2
FM4-64 labels the hair cells of both control and sema7a-/- mutant neuromasts.
Through-focus scans of 4 dpf control (Video 2) and sema7a-/- mutant (Video 3) neuromasts depict the hair cells (green) that have incorporated FM4-64. The sensory arbors (magenta) are tightly associated with the clustered hair cells in the control neuromast but show aberrant arborization in the sema7a-/- larvae.
Video 3
FM4-64 labels the hair cells of both control and sema7a-/- mutant neuromasts.
Through-focus scans of 4 dpf control (Video 2) and sema7a-/- mutant (Video 3) neuromasts depict the hair cells (green) that have incorporated FM4-64. The sensory arbors (magenta) are tightly associated with the clustered hair cells in the control neuromast but show aberrant arborization in the sema7a-/- larvae.
Video 4
Three-dimensional arborization patterns in control and sema7a-/- neuromasts.
Lateral views depict three-dimensionally rendered combined skeletonized network traces from 27 control and 27 sema7a-/- mutant neuromasts at 4 dpf.
Video 5
Sensory axonal projections contact an embryonic muscle progenitor cell expressing Sema7Asec.
A through-focus scan of a 3 dpf larva depicts a muscle progenitor cell in the dermomyotome that expresses the ectopic Sema7Asec (orange) and the sensory axonal projection (magenta) that makes intimate contact with it. Scale bar, 20 µm.
Video 6
Volumetric surface reconstruction of a sensory arbor and an embryonic muscle progenitor expressing Sema7Asec.
Reconstruction of the muscle progenitor cell (orange) at 3 dpf reveals its intimate association with an attracted sensory arbor (magenta).
Video 7
Volumetric surface reconstruction of a sensory arbor and the mature myofibers expressing Sema7Asec.
Reconstruction of mature myofibers expressing ectopic Sema7Asec (orange) at 3 dpf shows their close association with the attracted sensory arbors (magenta).
Video 8
Sensory axonal projections remain in proximity to myofibers expressing Sema7Asec.
A through-focus scan of a 3 dpf larva depicts mature myofibers expressing exogenous Sema7Asec deep in the myotome (orange) and the sensory axonal projection (magenta) that remains nearby.
Video 9
Aberrant axonal projections reenter the lateral-line nerve while following an ectopic Sema7Asec source.
A through-focus scan of a 3 dpf larva depicts cells expressing exogenous Sema7Asec (orange) that guides the aberrant sensory axonal projection (magenta) back into the lateral-line nerve. Scale bar, 20 µm.
Video 10
Ectopic Sema7Asec expression induces aberrant neurite projections from the lateral-line nerve.
Through-focus scans of 3 dpf larvae depict three individual incidents of ectopic sema7asec (orange) integrations that occurred distant from the neuromasts. In each case, myofibers express ectopic Sema7Asec protein (orange) that attracts neurite extensions from the lateral-line nerve (magenta). Scale bars, 20 µm.
Video 11
Ectopic Sema7Asec expression induces aberrant neurite projections from the lateral-line nerve.
Through-focus scans of 3 dpf larvae depict three individual incidents of ectopic sema7asec (orange) integrations that occurred distant from the neuromasts. In each case, myofibers express ectopic Sema7Asec protein (orange) that attracts neurite extensions from the lateral-line nerve (magenta). Scale bars, 20 µm.
Video 12
Ectopic Sema7Asec expression induces aberrant neurite projections from the lateral-line nerve.
Through-focus scans of 3 dpf larvae depict three individual incidents of ectopic sema7asec (orange) integrations that occurred distant from the neuromasts. In each case, myofibers express ectopic Sema7Asec protein (orange) that attracts neurite extensions from the lateral-line nerve (magenta). Scale bars, 20 µm.
Video 13
Volumetric reconstructions depict close contacts between the sensory neurites and the ectopic Sema7asec expressing cells.
Volumetric reconstructions of 3 dpf larvae depict two individual incidents of ectopic sema7asec (orange) integrations that occurred distant from the neuromasts. In each case, myofibers or random mosaic of cells in the dermomyotome express ectopic Sema7Asec protein (orange) that attracts neurite extensions from the lateral-line nerve (magenta).
Video 14
Volumetric reconstructions depict close contacts between the sensory neurites and the ectopic Sema7asec expressing cells.
Volumetric reconstructions of 3 dpf larvae depict two individual incidents of ectopic sema7asec (orange) integrations that occurred distant from the neuromasts. In each case, myofibers or random mosaic of cells in the dermomyotome express ectopic Sema7Asec protein (orange) that attracts neurite extensions from the lateral-line nerve (magenta).
Video 15
Time-lapse video microscopies depict the dynamics between the sensory neurites and the ectopic Sema7asec expressing cells.
Time-lapse images of 3 dpf larvae depict two individual incidents where the ectopic Sema7Asec sources (orange) induce directed branching of the sensory neurites (magenta) from the lateral-line nerve toward itself. Within each time-lapse videos, individual panel depicts the ectopic integration site and the associated sensory neurites from three different planes, XY, XZ, and YZ. Scale bars, 20 µm.
Video 16
Time-lapse video microscopies depict the dynamics between the sensory neurites and the ectopic Sema7asec expressing cells.
Time-lapse images of 3 dpf larvae depict two individual incidents where the ectopic Sema7Asec sources (orange) induce directed branching of the sensory neurites (magenta) from the lateral-line nerve toward itself. Within each time-lapse videos, individual panel depicts the ectopic integration site and the associated sensory neurites from three different planes, XY, XZ, and YZ. Scale bars, 20 µm.
Video 17
Sema7A-GPI is incapable to impart sensory axon guidance from a distance.
Through-focus scans of 3 dpf larvae depict three individual incidents of ectopic sema7a-GPI integrations that occurred near the sensory arbor network. In each case, myofibers robustly express ectopic Sema7A-GPI protein (orange) but the sensory arborization pattern (magenta) remain unperturbed. Scale bars, 20 µm.
Video 18
Sema7A-GPI is incapable to impart sensory axon guidance from a distance.
Through-focus scans of 3 dpf larvae depict three individual incidents of ectopic sema7a-GPI integrations that occurred near the sensory arbor network. In each case, myofibers robustly express ectopic Sema7A-GPI protein (orange) but the sensory arborization pattern (magenta) remain unperturbed. Scale bars, 20 µm.
Video 19
Sema7A-GPI is incapable to impart sensory axon guidance from a distance.
Through-focus scans of 3 dpf larvae depict three individual incidents of ectopic sema7a-GPI integrations that occurred near the sensory arbor network. In each case, myofibers robustly express ectopic Sema7A-GPI protein (orange) but the sensory arborization pattern (magenta) remain unperturbed. Scale bars, 20 µm.
Video 20
Postsynaptic assemblies are enriched in the loops and near the nodes of a sensory arbor network.
Through-focus scans of a 4 dpf neuromast depict the sensory arbor network (magenta) where the postsynaptic assemblies (yellow) are primarily located in the loops of the arbor network and are enriched near the nodes.
Tables
Table 1
Statistical comparison between control and sema7a-/- larvae for topological features.
One-sided Kolmogorov-Smirnov tests were used to assess the difference in node degree heights, nodes per loop, and loop lengths for control versus sema7a-/- neuromasts at 2 dpf, 3 dpf, and 4 dpf. In each of these cases, the difference in the distributions were not significantly different (p-values in red) between the control and the mutants at 2 dpf and 3 dpf but became significantly different (p-values in blue) at 4 dpf. Chi-square tests were used to assess the difference in occurrences of bare terminals versus loops, as well as the occurrences of bare terminals with low versus high curvature. The distribution at 4 dpf shows significant difference between the control and the mutant larvae. The occurrence of significant differences at 4 dpf for diverse topological features suggest that Sema7A function is required to achieve an ordered network topology at a mature stage. Thirty-three, 29, and 35 neuromasts were analyzed from 2 dpf, 3 dpf, and 4 dpf control larvae, respectively, and 17, 53, and 27 neuromasts were analyzed from 2 dpf, 3 dpf, and 4 dpf sema7a-/- mutant larvae, respectively. * Signifies p<0.05, ** signifies p<0.01, and *** signifies p<0.001.
| Node degree | p-values (control vs sema7a-/-) | ||
|---|---|---|---|
| 2 dpf | 3 dpf | 4 dpf | |
| Degree = 3 | 3.50E-01 | 1.05E-08*** | 1.68E-03** |
| Degree = 4 | 3.85E-01 | 7.11E-02 | 1.71E-03** |
| Degree = 5 | 4.60E-01 | 5.23E-01 | 4.40E-01 |
| Bare terminals vs loop | 2 dpf | 3 dpf | 4 dpf |
| 0–10 µm | 3.84E-01 | 7.89E-01 | 2.11E-01 |
| 10–20 µm | 3.50E-02* | 3.92E-01 | 2.94E-02* |
| 20–30 µm | 2.28E-04*** | 2.63E-02* | 3.82E-09*** |
| 30–40 µm | 5.04E-059*** | 3.63E-25*** | 1.28E-33*** |
| 40–70 µm | --- | --- | --- |
| Nodes per loop | 5.06E-01 | 1.96E-01 | 3.50E-02* |
| Loop length | 5.81E-01 | 2.71E-01 | 2.21E-02* |
| Distribution of bare-terminal curvature | 2 dpf | 3 dpf | 4 dpf |
| 4.23E-01 | 8.91E-01 | 1.99E-02* | |
Additional files
Download links
A two-part list of links to download the article, or parts of the article, in various formats.
Downloads (link to download the article as PDF)
Open citations (links to open the citations from this article in various online reference manager services)
Cite this article (links to download the citations from this article in formats compatible with various reference manager tools)
Semaphorin7A patterns neural circuitry in the lateral line of the zebrafish
eLife 12:RP89926.
https://doi.org/10.7554/eLife.89926.4


