A stable microtubule bundle formed through an orchestrated multistep process controls quiescence exit
- Univ. Bordeaux, CNRS, IBGC, UMR 5095, France
- Genetics, Development, and Cell Biology, Iowa State University, United States
- Department of Molecular Genetics, Weizmann Institute of Science, Israel
Figures
Figure 1 with 1 supplement

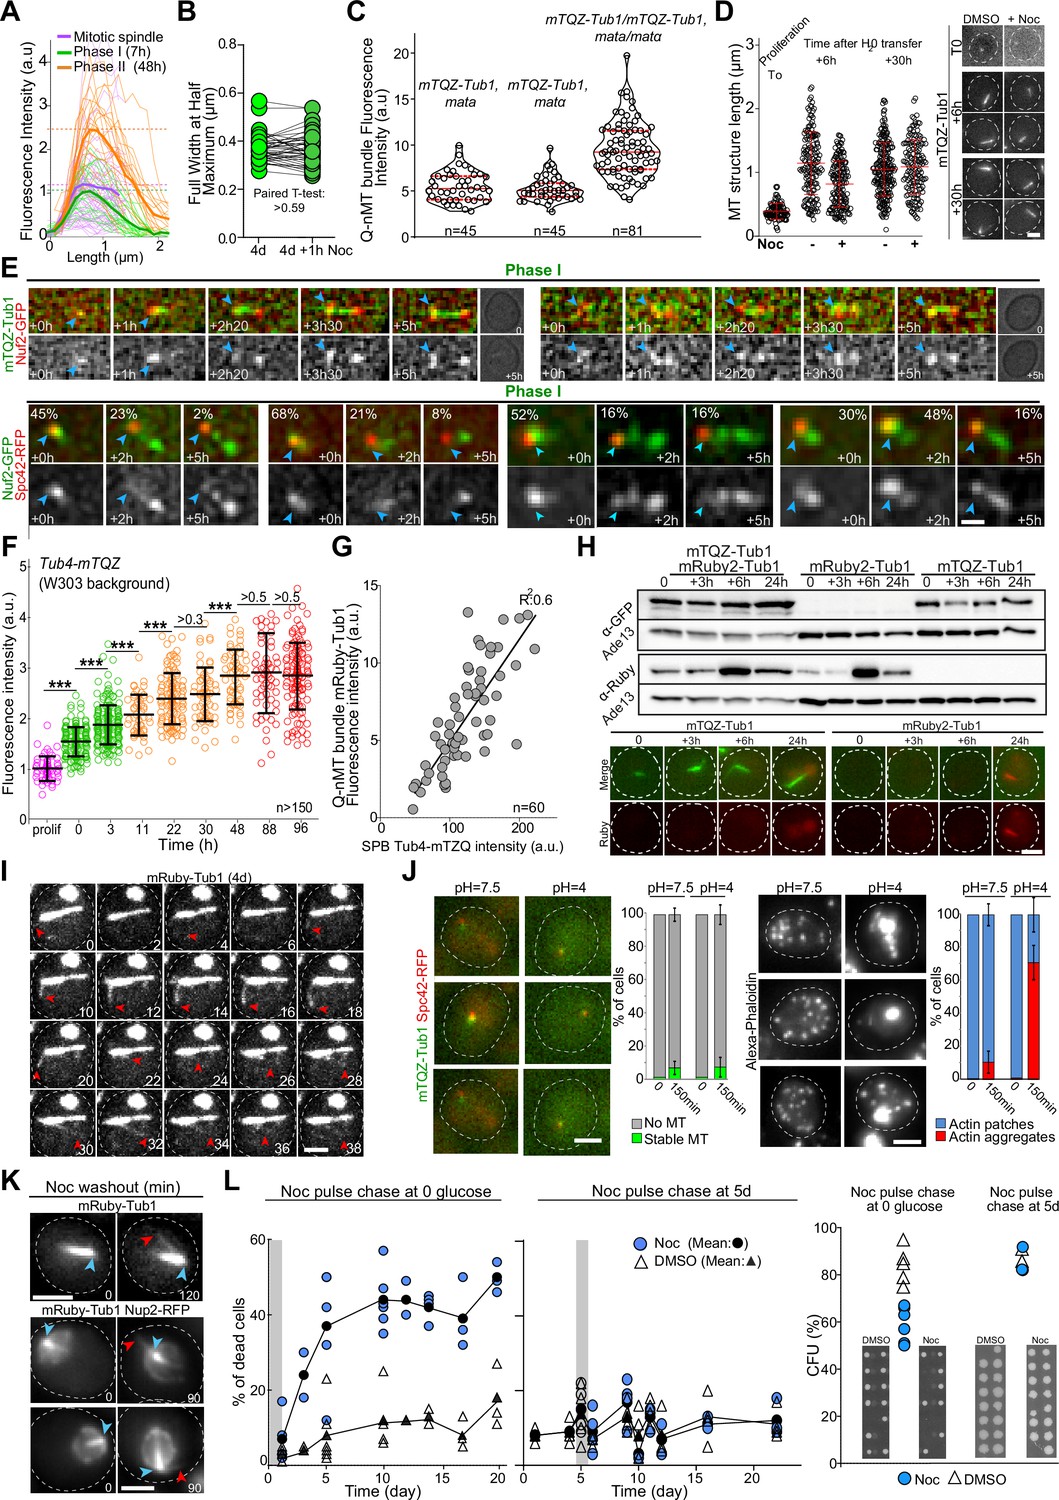
The formation of the quiescent-cell nuclear microtubule (Q-nMT) bundle is a three-step process.
(A) Nuclear MT length in WT cells expressing mTQZ-Tub1, before (-) or after (+) a 15 min Noc treatment (30 µg/ml) upon entry into quiescence. Each circle corresponds to the length of an individual MT structure. Three independent experiments are shown (pale blue, cyan and dark blue, n > 160 for each point in each experiment). The mean and SD are shown. Student’s test or ANOVA (sample >2) were used to compare inter-replicates. #p-value>0.05, $p-value<0.05. A Student’s test (t-test with two independent samples) was used to compare the results obtained with or without Noc, the indicated p-values being the highest measured among experiments. ***p-value<1.10–5. Images of representative cells are shown. Bar is 2 µm. (B) MT fluorescence intensity as a proxy of MT structure width in WT cells expressing mTQZ-Tub1. Mean intensity measurement for half pre-anaphase mitotic spindles (purple), phase I (green), phase II (orange), or phase III (red) Q-nMT bundle. A line scan along the MT structure for individual cells is shown as thin lines, the mean as a bold line (n > 60/phase), all the lines being aligned at 0.5 µm before the fluorescence intensity increase onset on the spindle pole body (SPB) side. The blue lines are results obtained after a 15 min Noc treatment (30 µg/ml). In each graph, horizontal dashed line indicates the mean intensity. Images in pseudo-colors of a representative cell for each phase are shown. Bar is 2 µm. (C) MT bundle length as a function of MT bundle width for individual cells in each phase before and after a 15 min Noc treatment (30 µg/ml) in WT cells expressing mTQZ-Tub1. Each circle represents an individual MT structure. (D) WT cells expressing mTQZ-Tub1 (red) and Nuf2-GFP (green) in phase II (23 hr) or phase III (50 hr) were deposited on an agarose pad containing 30 µg/ml Noc and imaged. Blue arrowheads: SPB; white arrowheads: Nuf2-GFP clusters. Time is in min after deposition on the pad. Bar is 1 µm. (E) Tub4-mTQZ fluorescence intensity measured at the SPB upon entry into quiescence. Each circle represents an individual cell. The mean and SD are shown; t-tests were used to compare independent samples (N = 3, n > 150), *0.05>p-value>1.10–3, ***p-value<1.10–5. Images in pseudo-colors of representative cells are shown. Bar is 2 µm. (F) WT cells expressing mTQZ-Tub1 under the TUB1 promoter and mRuby-Tub1 under the ADH2 promoter. The percentage of cells harboring both mTQZ and mRuby fluorescence along the Q-nMT bundle is shown; each circle being the percentage for an independent experiment, with n > 200 cells counted for each experiment. The mean and SD are shown. Images of representative cells at the indicated time after glucose exhaustion are shown. Bar is 2 µm. (G) Schematic of the Q-nMT bundle formation. During phase I, stable MTs (phase I-MT, green) elongate from the SPB (gray). During phase II, the amount of Tub4 (cyan) increases at the SPB. In the meantime, new MTs (phase II-MT, orange) elongated from the SPB and are stabilized along the phase I-MTs, yet their +ends remain dynamic (dashed lines). After phase III, all MTs are stabilized (red). Nuf2 is schematized as dark blue squares. (H) Upon glucose exhaustion, WT cells expressing mTQZ-Tub1 (green) and Nuf2-GFP (red) were pulsed treated with 30 µg/ml Noc (blue) or DMSO (gray) for 24 hr. Noc or DMSO were then chased using carbon-exhausted medium and cells were imaged. Each circle corresponds to MT structure length in an individual cell. The mean and SD are shown (N = 3, n > 100). Images of representative cells 2 d after the chase and representative cells 5 d after the chase are shown. For the right panels, tubulin (green) was detected by immunofluorescence, actin (red) by phalloidin, and DNA (blue) with DAPI. The mean Q-nMT bundle length (± SD) in the population is indicated.
-
Figure 1—source data 1
Excel file containing MT length measurement upon entry into quiescence, before or after Noc treatment.
- https://cdn.elifesciences.org/articles/89958/elife-89958-fig1-data1-v1.xlsx
-
Figure 1—source data 2
Excel file containing MT intensity measurement upon entry into quiescence, before or after Noc treatment.
- https://cdn.elifesciences.org/articles/89958/elife-89958-fig1-data2-v1.xlsx
-
Figure 1—source data 3
Excel file containing individual MT bundle length as a function of its width.
- https://cdn.elifesciences.org/articles/89958/elife-89958-fig1-data3-v1.xlsx
-
Figure 1—source data 4
Excel file containing fluorescence intensities measurement of Tub4 at the SPB during quiescence entry.
- https://cdn.elifesciences.org/articles/89958/elife-89958-fig1-data4-v1.xlsx
-
Figure 1—source data 5
Excel file containing MT length measurement in individual cells, after DMSO or Noc pulse chase.
- https://cdn.elifesciences.org/articles/89958/elife-89958-fig1-data5-v1.xlsx
Figure 1—figure supplement 1
The three steps of quiescent-cell nuclear microtubule (Q-nMT) bundle formation.
(A) Fluorescence intensity along MT structures in WT cells expressing mTQZ-Tub1. Mean intensity measurement for half pre-anaphase mitotic spindles (violet, n = 60), phase I (green, n = 19), and phase II (orange, n = 22) Q-nMT bundles. A line scan along the MT structure for an individual cell is shown as thin line, the mean as a bold line, all the lines being aligned at 0,5 µm before the fluorescence intensity increase onset on the spindle pole body (SPB) side. (B) Individual Q-nMT bundle full width measured at half-maximum in WT cells (4 d) expressing mTQZ-Tub1 before or after 1 hr after Noc treatment. A paired t-test was used to compare the two conditions (n > 40). (C) Nuclear MT fluorescence intensity in haploid WT (mat a and mat α) or diploid (mat a/mat α) cells expressing mTQZ-TUB1. Each circle represents an individual cell (N = 2, n > 35). Mean and SD are shown in red. (D) Nuclear MT length in WT proliferating cells expressing mTQZ-Tub1 transferred to water for the indicated time and treated (+) or not (-) 15 min with 30 µg/ml Noc. Images of representative cells are shown. Bar is 2 µm. (E) WT cells expressing Spc42-RFP (red) and mTQZ-Tub1 (green, top panel) or Nuf2-GFP (green, bottom panel) upon entry into quiescence. The percentages indicate the relative amount of Nuf2-GFP detected at the SPB (blue arrowhead). Bar is 1 µm. (F) Tub4-mTQZ fluorescence intensity in WT cells of the W303 background. The mean and SD are shown; t-test was used to compare independent samples (N = 3, n > 150), ***p-value<1.10–5. (G) Fluorescence intensities in WT cells (4 d) expressing Tub4-mTQZ and mRuby-Tub1. The Tub4-mTQZ signal at the SPB is plotted as a function of the mRuby signal along the Q-nMT bundle. Each circle represents an individual cell (n = 60). (H) Top panel: western blot using anti-GFP and anti-RFP antibodies on total protein extracts obtained from the indicated cells upon entry into quiescence. Anti-Ade13 antibodies were used as loading control. Bottom panel: images of representative WT cells expressing only pTUB1-mTQZ-Tub1 (green) or only pADH2-mRuby-Tub1 (red) upon entry into quiescence as a control of cross channel fluorescence. Bar is 2 µm. (I) WT cells expressing mRuby-Tub1 (4 d) displaying both dynamic cytoplasmic MTs (cMTs) (red arrowhead) and a Q-nMT bundle (time is in min, bar is 1 µm). (J) An artificial fluid to solid-like phase transition in proliferating cells does not induce MT stabilization. Proliferating WT cells expressing mTQZ-Tub1 (green) and Spc42-RFP (red) with fluid (pH = 7.5) or solid-like (pH = 4) cytoplasm/nucleoplasm (see ‘Materials and methods’) were incubated 15 min with 30 µg/ml Noc (left) or stained with phalloidin to detect actin (right). Indicated phenotypes were quantified (left and right graphs, N = 2, n > 115, mean and SD are indicated). Bar is 2 µm. (K) Cells can assemble dynamic cMTs (red arrowhead) in quiescence. 2-day-old WT cells expressing mRuby-Tub1 were imaged after a 15 min Noc pulse-chase (30 µg/ml, time is in min). Red arrowhead: cytoplasmic MT; blue arrowhead: SPB; bar is 2 µm. (L) Left graphs: WT cell viability after a 24h-pulse (gray rectangle) with Noc (30 µg/ml, circles) or DMSO (triangles), followed by a chase using carbon-exhausted medium, the Noc pulse being done either upon glucose exhaustion or 5 d after glucose exhaustion. Each circle/triangle is the percentage obtained for an independent experiment in which n > 200 cells were scored. Right graph: live cells, as attested by a clear staining after a methylene blue treatment, were micro-separated 8 d after the Noc pulse done either upon glucose exhaustion or 5 d after glucose exhaustion, and allowed to give rise to a colony on a YPDA plate. Each circle/triangle is the percentage obtained for an independent experiment in which n > 100 cells were micro-separated. Images of representative YPDA plates after 3 d of growth at 30°C are shown.
-
Figure 1—figure supplement 1—source data 1
Excel file containing nuclear MT structure intensity measurements in WT haploid or diploid cells.
- https://cdn.elifesciences.org/articles/89958/elife-89958-fig1-figsupp1-data1-v1.xlsx
-
Figure 1—figure supplement 1—source data 2
Excel file containing the fluorescence intensity measurements of Tub4 and Tub1 in individual cells.
- https://cdn.elifesciences.org/articles/89958/elife-89958-fig1-figsupp1-data2-v1.xlsx
-
Figure 1—figure supplement 1—source data 3
Excel file containing WT cell viability after the indicated treatment.
- https://cdn.elifesciences.org/articles/89958/elife-89958-fig1-figsupp1-data3-v1.xlsx
-
Figure 1—figure supplement 1—source data 4
Uncropped western blot for Figure 1—figure supplement 1H.
- https://cdn.elifesciences.org/articles/89958/elife-89958-fig1-figsupp1-data4-v1.zip
-
Figure 1—figure supplement 1—source data 5
Raw western blot for Figure 1—figure supplement 1H – Ade13.
- https://cdn.elifesciences.org/articles/89958/elife-89958-fig1-figsupp1-data5-v1.zip
-
Figure 1—figure supplement 1—source data 6
Raw western blot for Figure 1—figure supplement 1H – GFP.
- https://cdn.elifesciences.org/articles/89958/elife-89958-fig1-figsupp1-data6-v1.zip
-
Figure 1—figure supplement 1—source data 7
Raw western blot for Figure 1—figure supplement 1H – RFP.
- https://cdn.elifesciences.org/articles/89958/elife-89958-fig1-figsupp1-data7-v1.zip
Figure 2 with 1 supplement

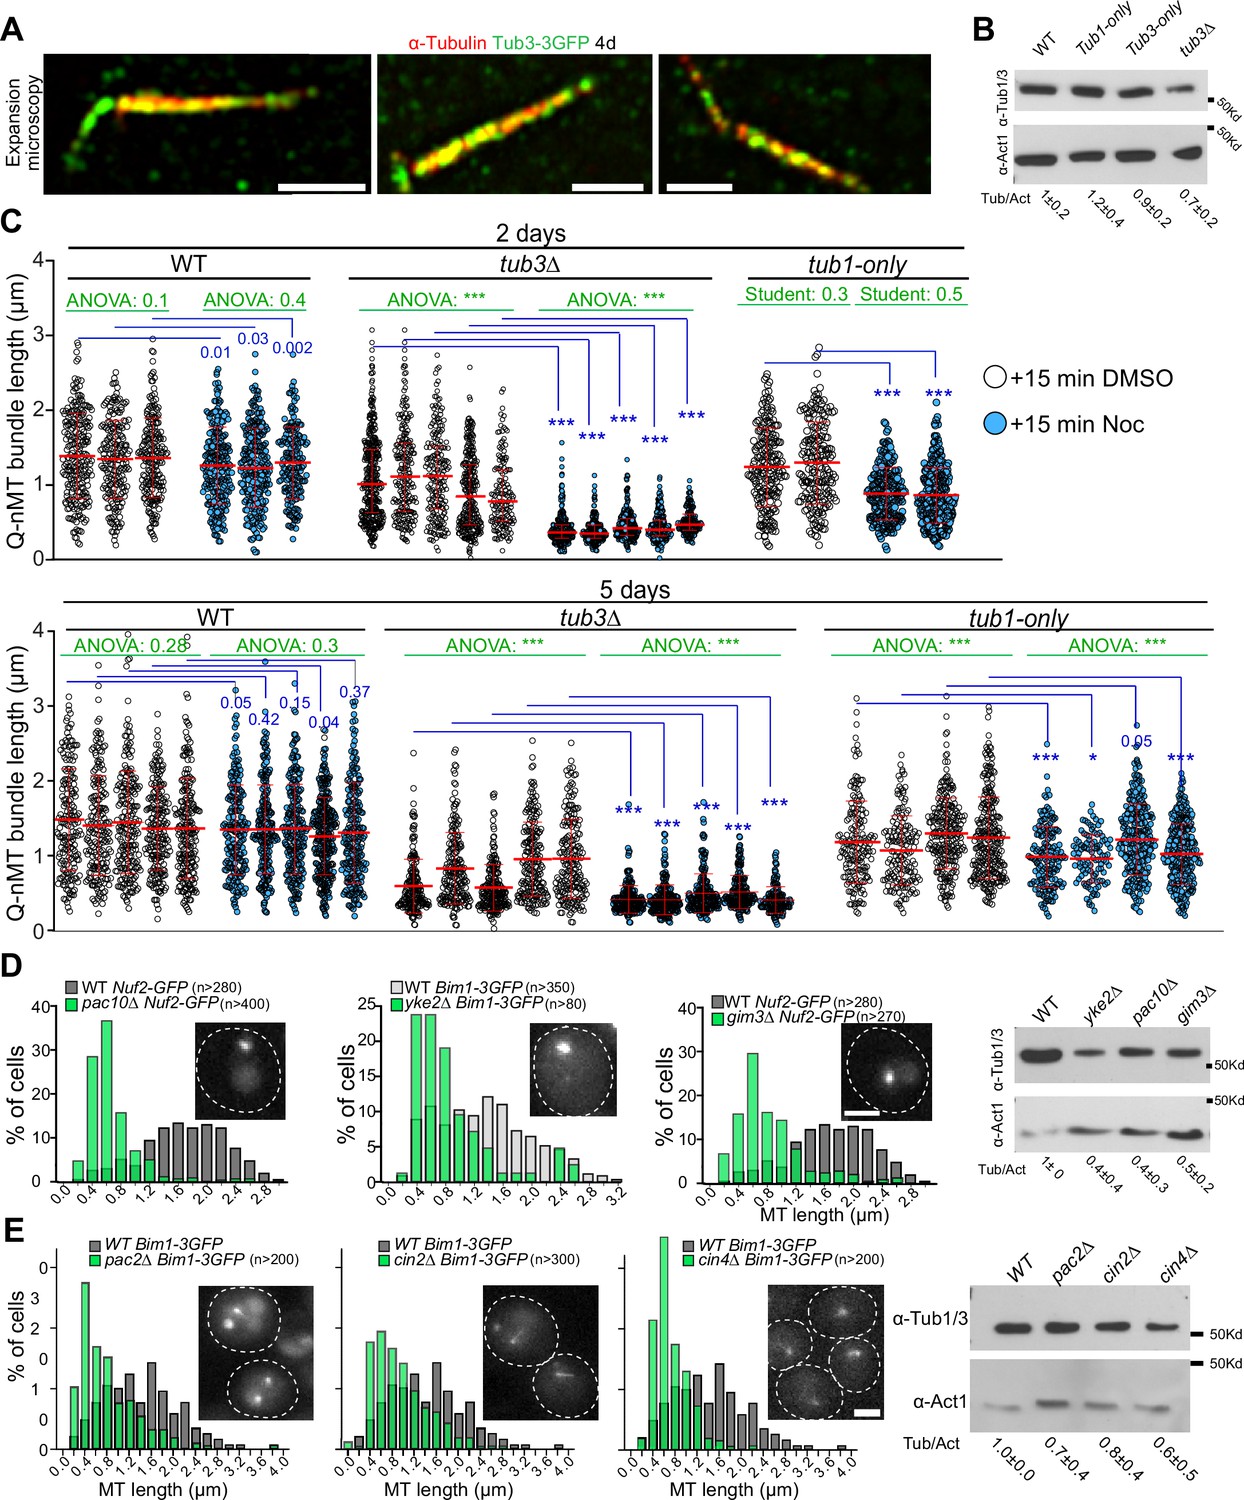
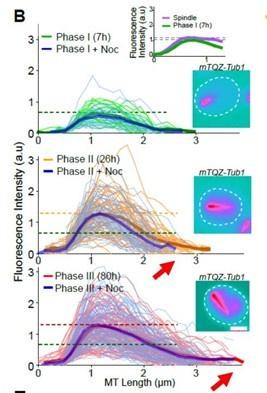
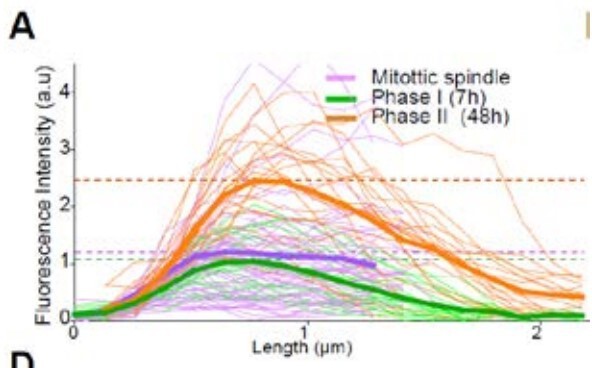
Quiescent-cell nuclear microtubule (Q-nMT) bundle formation is influenced by the α-tubulin amount and isotype.
(A) WT cells (4 d) expressing either Tub3-3GFP (green) and mTQZ-Tub1 (red, top panel) or Tub3-RFP (red) and mWasabi-Tub1 (green, bottom panel). Blue arrowheads point to spindle pole body (SPB). Bar is 2 µm. (B) Nuclear MT length in WT and tub3∆ cells expressing mTQZ-Tub1, 36 hr (phase II, orange) and 90 hr (phase III, red) after glucose exhaustion, treated 15 min (blue) or not (gray) with 30 µg/ml Noc. Each circle corresponds to the length of an individual MT structure, mean and SD are shown. ANOVA was used to compare inter-replicates (n > 200, N = 5); #p-value>0.05, $p-value<0.05. A Student’s test (t-test with two independent samples) was used to compare (+) or (-) Noc data. The indicated p-values are the highest calculated among the five experiments; ***p-value<1.10–5. Images of representative cells are shown. Bar is 2 µm. (C) Nuclear MT length in WT and Tub1-only cells expressing mTQZ-Tub1, 36 hr (phase II, orange) and 90 hr (phase III, red) after glucose exhaustion, treated 15 min or not with 30 µg/ml Noc. Statistical representations are as in (B). Images of representative cells are shown, bar is 2 µm. (D) Fluorescence intensity along the Q-nMT bundle in WT (gray) and Tub1-only (blue) cells expressing mTQZ-Tub1 grown for 10 hr (phase I), 36 hr (phase II), and 90 hr (phase III). Individual fluorescent intensity is shown as thin line, the mean as a bold line, all the lines being aligned at 0,5 µm before the fluorescence intensity increase onset on the SPB side. Dashed lines indicate the maximal mean fluorescence intensity. Images in pseudo-color of representative cells are shown. Bar is 2 µm.
-
Figure 2—source data 1
Excel file containing nuclear MTs length measurements in different strains backgrounds.
- https://cdn.elifesciences.org/articles/89958/elife-89958-fig2-data1-v1.xlsx
-
Figure 2—source data 2
Excel file containing Q-nMT bundles fluorescence intensity measurement in different strain backgrounds.
- https://cdn.elifesciences.org/articles/89958/elife-89958-fig2-data2-v1.xlsx
Figure 2—figure supplement 1
The impact of the α-tubulin level on quiescent-cell nuclear microtubule (Q-nMT) bundle assembly.
(A) Expansion microscopy images of WT cells (4 d) expressing Tub3-3GFP and immuno-stained with GFP (green) and α-tubulin (red) YOL1/2 antibodies. Bar is 1 µm. (B) Western blot using α-tubulin YOL1/2 antibody on total protein extracts from the indicated cells grown for 4 d. Actin was used as a loading reference. Numbers indicate the tubulin/actin ratio (mean for N = 8). (C) Nuclear MT length in WT, tub3∆, and tub1-only cells expressing mTQZ-Tub1, treated or not with 30 µg/ml Noc. The three independent experiments used in Figure 2B and C are shown. p-Values for ANOVA or unpaired t-test are indicated, ***p-value<1.10–5. (D) Nuclear MT length distribution in yke2Δ, pac10Δ, or gim3Δ cells (4 d) and in corresponding WT cells expressing Nuf2-GFP (dark gray bars) or Bim1-3GFP (light gray bars). Right panel: western blot using an anti-α-tubulin antibody on total protein extracts from cells of the indicated genotype (4 d). Actin was used as a loading reference. The tubulin/actin ratio is indicated (mean of N = 4). Bar is 2 µm. (E) Nuclear MT length distribution in pac2Δ, cin2Δ, or cin4Δ cells (4 d) and in corresponding WT cells expressing Bim1-GFP (dark gray bars). Right panel: western blot using an anti-α-tubulin antibody on total protein extracts from cells of the indicated genotype (4 d). Actin was used as a loading reference. The tubulin/actin ratio is indicated (mean for N = 4). Bar is 2 µm.
-
Figure 2—figure supplement 1—source data 1
Uncropped western blot for Figure 2—figure supplement 1B.
- https://cdn.elifesciences.org/articles/89958/elife-89958-fig2-figsupp1-data1-v1.zip
-
Figure 2—figure supplement 1—source data 2
Uncropped western blot for Figure 2—figure supplement 1D.
- https://cdn.elifesciences.org/articles/89958/elife-89958-fig2-figsupp1-data2-v1.zip
-
Figure 2—figure supplement 1—source data 3
Uncropped western blot for Figure 2—figure supplement 1E.
- https://cdn.elifesciences.org/articles/89958/elife-89958-fig2-figsupp1-data3-v1.zip
-
Figure 2—figure supplement 1—source data 4
Raw western blot for Figure 2—figure supplement 1B.
- https://cdn.elifesciences.org/articles/89958/elife-89958-fig2-figsupp1-data4-v1.zip
-
Figure 2—figure supplement 1—source data 5
Raw western blot for Figure 2—figure supplement 1D – loading control.
- https://cdn.elifesciences.org/articles/89958/elife-89958-fig2-figsupp1-data5-v1.zip
-
Figure 2—figure supplement 1—source data 6
Raw western blot for Figure 2—figure supplement 1D.
- https://cdn.elifesciences.org/articles/89958/elife-89958-fig2-figsupp1-data6-v1.zip
-
Figure 2—figure supplement 1—source data 7
Raw western blot for Figure 2—figure supplement 1E – loading control.
- https://cdn.elifesciences.org/articles/89958/elife-89958-fig2-figsupp1-data7-v1.zip
-
Figure 2—figure supplement 1—source data 8
Raw western blot for Figure 2—figure supplement 1E.
- https://cdn.elifesciences.org/articles/89958/elife-89958-fig2-figsupp1-data8-v1.zip
Figure 3 with 1 supplement
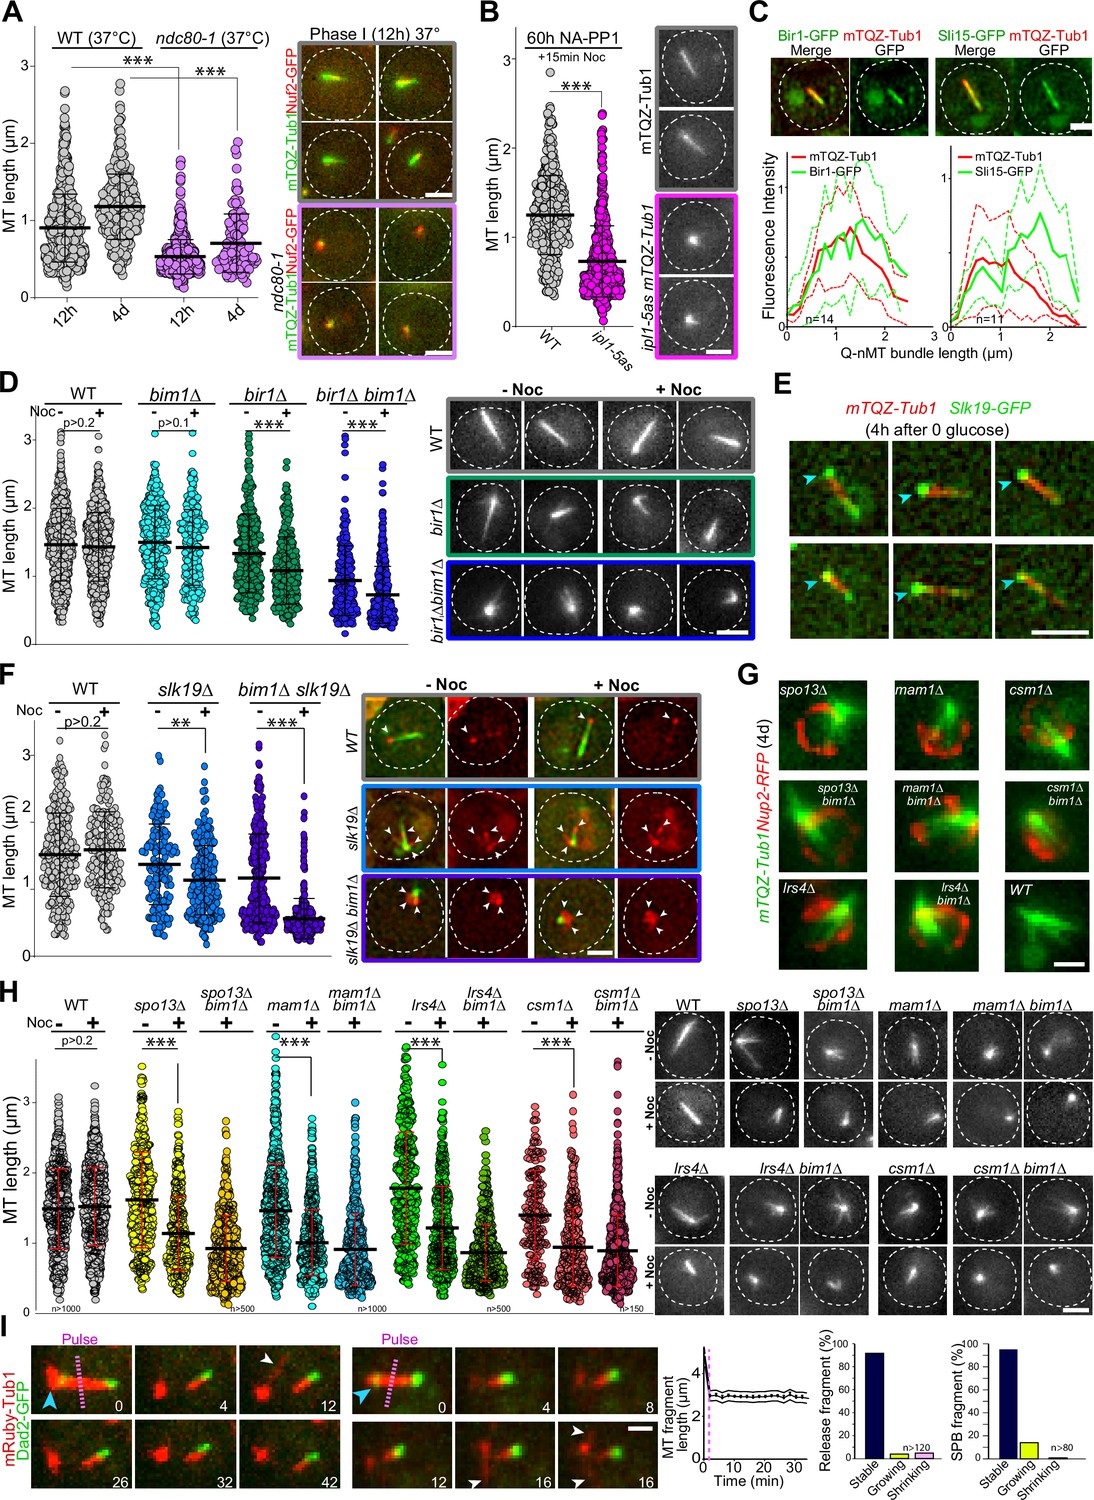
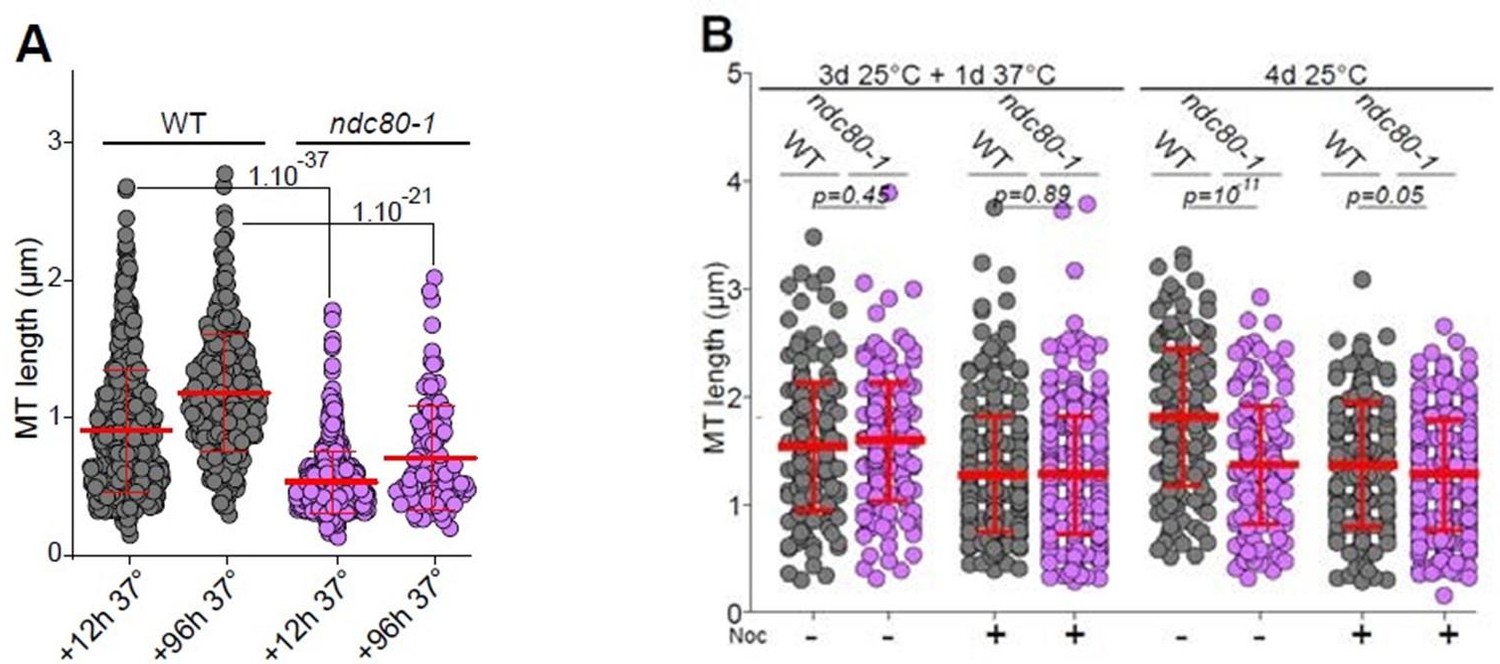
Kinetochore–kinetochore interactions are required for quiescent-cell nuclear microtubule (Q-nMT) bundle formation.
(A) Nuclear MT length distribution in WT (gray) and ndc80-1 (violet) cells expressing mTQZ-Tub1 (green) and Nuf2-GFP (red), transferred to 37°C upon glucose exhaustion and maintained at 37°C for the indicated time. Cells were imaged after a 20 min Noc treatment (30 µg/ml). See Figure 3—figure supplement 1B for the control without Noc. Each circle corresponds to the length of an individual MT structure, mean and SD are shown. A Student’s test (t-test with two independent samples) was used to compare (+) or (-) Noc samples from the same experiment (n > 250, N = 2). The indicated p-values are the highest p-values calculated among the two repeated experiments. ***p-value<1.10–5. Images of representative cells incubated 12 hr at 37°C are shown. Bar is 2 µm. (B) WT (gray) and ipl1-5as (pink) cells expressing mTQZ-Tub1 were treated for 60 hr with 50 µM NA-PP1 after glucose exhaustion, and imaged after a 15 min Noc treatment (30 µg/ml), see Figure 3—figure supplement 1D for control without Noc. Same statistical representation as in (A); N = 2, n > 200. Images of representative cells are shown. Bar is 2 µm. (C) WT cells (2 d) expressing mTQZ-Tub1 (red) and Bir1-GFP or Sli15-GFP (green) were imaged. Graphs show Bir1-GFP or Sli15-GFP fluorescence intensity along normalized Q-nMT bundles (see ‘Materials and methods’ section; plain and dash lines: mean and SD, respectively). Images of representative cells are shown. Bar is 2 µm. (D) Nuclear MT length distribution in cells of the indicated genotype (4 d) expressing mTQZ-Tub1 treated or not with Noc (30 µg/ml). Same statistical representation as in (A); N = 2, n > 200. Images of representative cells are shown. Bar is 2 µm. (E) WT cells expressing mTQZ-Tub1 (red) and Slk19-GFP (green) 4 hr after glucose exhaustion. Blue arrowhead: spindle pole body (SPB). Bar is 2 µm. (F) Nuclear MT length distribution in cells of the indicated genotype (4 d) expressing mTQZ-Tub1 (green) and Nuf2-GFP (red) imaged before or after Noc treatment (30 µg/ml). Same statistical representation as in (A); N = 2, n > 200. Images of representative cells are shown. White arrowheads point to Nuf2-GFP dots. Bar is 2 µm. (G) Cells of the indicated genotype (4 d) expressing mTQZ-Tub1 (green) and Nup2-RFP (red). Bar is 1 µm. (H) Nuclear MT length distribution in cells of the indicated genotype (4 d) expressing mTQZ-Tub1 treated or not with Noc (30 µg/ml). Same statistical representation as in (A); N ≥ 2, n > 200. Images of representative cells are shown. Bar is 2 µm. (I) Length variation of nuclear MT bundle fragments after laser ablation (pink dash line) in cells expressing mRuby-TUB1 (red) and Dad2-GFP (green). Time is in min. Images of representative cells are shown, blue arrowhead: SPB; white arrowhead: cytoplasmic MT (cMT). Graph indicates the variation of length in released fragments (n > 120) and histograms show the percentage of released or SPB attached fragments that are either stable, or that shorten or grow within a 30 min period after the laser-induced breakage. Bar is 1 µm.
-
Figure 3—source data 1
Excel file containing nuclear MT length measurements in indicated strain backgrounds.
- https://cdn.elifesciences.org/articles/89958/elife-89958-fig3-data1-v1.xlsx
-
Figure 3—source data 2
Excel file containing nuclear MT length measurements in WT and ipl1-5as cells.
- https://cdn.elifesciences.org/articles/89958/elife-89958-fig3-data2-v1.xlsx
-
Figure 3—source data 3
Excel file containing measurement of the fluorescence intensity along Q-nMT bundles in Bir1-GFP or Sli15-GFP expressing cells.
- https://cdn.elifesciences.org/articles/89958/elife-89958-fig3-data3-v1.xlsx
-
Figure 3—source data 4
Excel file containing the nuclear MT length distribution in indicated strain background.
- https://cdn.elifesciences.org/articles/89958/elife-89958-fig3-data4-v1.xlsx
-
Figure 3—source data 5
Excel file containing the nuclear MT length distribution in indicated strains background.
- https://cdn.elifesciences.org/articles/89958/elife-89958-fig3-data5-v1.xlsx
-
Figure 3—source data 6
Excel file containing the nuclear MT length distribution in indicated strains background.
- https://cdn.elifesciences.org/articles/89958/elife-89958-fig3-data6-v1.xlsx
Figure 3—figure supplement 1
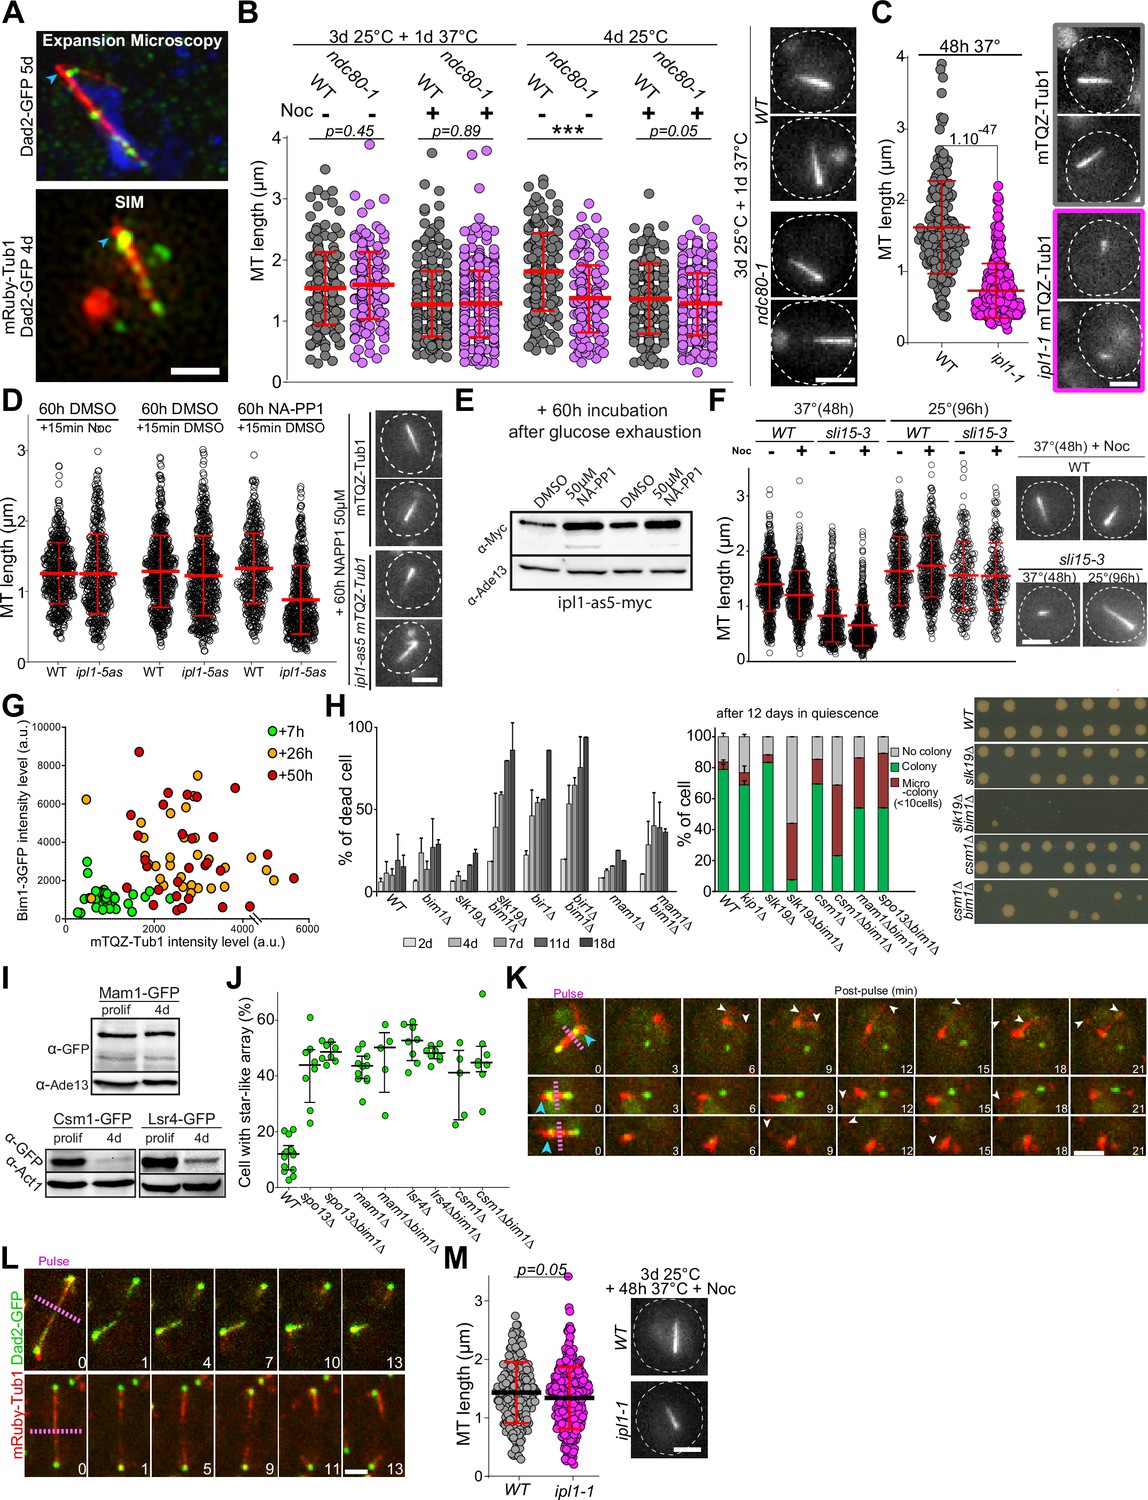
Kinetochore–microtubule (MT) interactions are not required for quiescent-cell nuclear microtubule (Q-nMT) bundle maintenance and mutants affected for kinetochore–kinetochore interactions have reduced viability in quiescence.
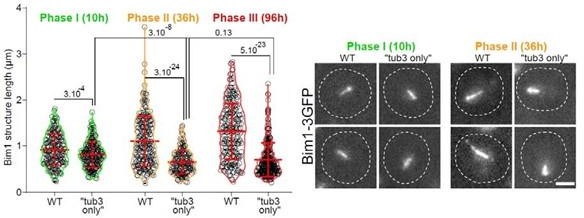
(A) Upper panel: WT cell (4 d) expressing Dad2-GFP and immuno-stained with GFP (green) and α-tubulin (red) YOL1/2 antibodies imaged using expansion microscopy. Blue is DAPI. Lower panel: WT cell (4 d) expressing Dad2-GFP (green) and mRuby-Tub1 (red), imaged using SIM. Bar is 1 μm. (B) Nuclear MT length distribution in cells of the indicated genotypes, grown for 3 d at 25°C, shifted to 37°C or 25°C for 48 hr, and treated 15 min or not with 30 µg/ml Noc. Each circle corresponds to the length of an individual MT structure, mean and SD are shown. ***p-value<1.10–6. Images of representative cells are shown. Bar is 2 µm. (C) WT (gray) and ipl1-1 cells (pink) expressing mTQZ-Tub1 were shifted upon glucose exhaustion to 37°C for 48 hr, and imaged after a 20 min Noc treatment (30 µg/ml) (N = 2, n > 100). Same legend as in (B). Images of representative cells are shown. Bar is 2 µm. (D) Nuclear MT length in cells of the indicated genotypes, grown for 60 hr in DMSO or 50 µM NA-PP1, treated 15 min or not with 30 µg/ml Noc. Same legend as in (B). Images of representative cells are shown Bar is 2 µm. (E) Western blot using anti-myc antibodies on total protein extracts from cells expressing ipl1-5as-myc treated 60 hr with DMSO or 50 µM NA-PP1 after quiescence entry. Ade13 was used as a loading reference. (F) Nuclear MT length in cells of the indicated genotypes grown 48 hr at 37°C or 96 hr at 25°C, treated 15 min or not with 30 µg/ml Noc. Same legend as in (B) (n = 2, n > 200). Images of representative cells are shown. Bar is 2 µm. (G) Distribution of Bim1-3GFP intensity as a function of mTQZ-Tub1 intensity in individual Q-nMT bundles (green: phase I – 7 hr after glucose exhaustion; orange: phase II – 26 hr after glucose exhaustion; and red: phase III – 50 hr after glucose exhaustion). Each circle represents an individual Q-nMT bundle. (H) Viability (methylene blue staining) after the indicated time in quiescence (left graph), capacity to form colony after single live cell micro-manipulation after 12 d in quiescence (right graph). Pictures of representative plates 3 d after cell micro-manipulation are shown. (I) Western blot using anti-GFP antibodies on total protein extracts from proliferating or 4-day-old cells expressing the indicated GFP fusion protein. Ade13 and Act1 were used as loading controls. (J) Percentage of cells of the indicated genotype displaying a MT star-like array. Each circle represents the percentage obtained for an independent culture (n > 200). Mean and SD are indicated. (K) WT cells (6 d) expressing mRuby-Tub1 (red) and Nuf2-GFP (green) were transferred onto an agarose pad. Q-nMT bundles were cut using a pulsed laser (pink dashed line). White arrowheads point to dynamic cytoplasmic MT (cMT). Time is in min. Bar is 2 µm. (L) Proliferating cells expressing mRuby-Tub1 (red) and Dad2-GFP (green) were transferred onto an agarose pad. Anaphase spindles were cut and the behavior of the released fragments was followed. Time is in min. Bar is 2 μm. (M) Nuclear MT length in cells of the indicated genotypes, grown for 3 d at 25°C, shifted to 37°C or 25°C for 48 hr, and treated 15 min or not with 30 µg/ml Noc. Same legend as in (B). Images of representative cells are shown, p-value from unpaired t-test is indicated, and bar is 2 µm.
-
Figure 3—figure supplement 1—source data 1
Excel file containing the nuclear MT length distribution in WT and ipl1-1 cells.
- https://cdn.elifesciences.org/articles/89958/elife-89958-fig3-figsupp1-data1-v1.xlsx
-
Figure 3—figure supplement 1—source data 2
Excel file containing the nuclear MT length distribution in indicated strains background.
- https://cdn.elifesciences.org/articles/89958/elife-89958-fig3-figsupp1-data2-v1.xlsx
-
Figure 3—figure supplement 1—source data 3
Excel file containing the Bim1 intensity as a function of Tub1 intensity in individual Q-nMT bundles.
- https://cdn.elifesciences.org/articles/89958/elife-89958-fig3-figsupp1-data3-v1.xlsx
-
Figure 3—figure supplement 1—source data 4
Uncropped western blot for Figure 3—figure supplement 1E.
- https://cdn.elifesciences.org/articles/89958/elife-89958-fig3-figsupp1-data4-v1.zip
-
Figure 3—figure supplement 1—source data 5
Uncropped western blot for Figure 3—figure supplement 1I.
- https://cdn.elifesciences.org/articles/89958/elife-89958-fig3-figsupp1-data5-v1.zip
-
Figure 3—figure supplement 1—source data 6
Raw western blot for Figure 3—figure supplement 1E – Ade13.
- https://cdn.elifesciences.org/articles/89958/elife-89958-fig3-figsupp1-data6-v1.zip
-
Figure 3—figure supplement 1—source data 7
Raw western blot for Figure 3—figure supplement 1E – myc.
- https://cdn.elifesciences.org/articles/89958/elife-89958-fig3-figsupp1-data7-v1.zip
-
Figure 3—figure supplement 1—source data 8
Raw western blot for Figure 3—figure supplement 1I – csm1 Act1.
- https://cdn.elifesciences.org/articles/89958/elife-89958-fig3-figsupp1-data8-v1.zip
-
Figure 3—figure supplement 1—source data 9
Raw western blot for Figure 3—figure supplement 1I – csm1 GFP.
- https://cdn.elifesciences.org/articles/89958/elife-89958-fig3-figsupp1-data9-v1.zip
-
Figure 3—figure supplement 1—source data 10
Raw western blot for Figure 3—figure supplement 1I – lsr4 Act1.
- https://cdn.elifesciences.org/articles/89958/elife-89958-fig3-figsupp1-data10-v1.zip
-
Figure 3—figure supplement 1—source data 11
Raw western blot for Figure 3—figure supplement 1I – lsr4 GFP.
- https://cdn.elifesciences.org/articles/89958/elife-89958-fig3-figsupp1-data11-v1.zip
-
Figure 3—figure supplement 1—source data 12
Raw western blot for Figure 3—figure supplement 1I – mam1 ase13.
- https://cdn.elifesciences.org/articles/89958/elife-89958-fig3-figsupp1-data12-v1.zip
-
Figure 3—figure supplement 1—source data 13
Raw western blot for Figure 3—figure supplement 1I – mam1 GFP.
- https://cdn.elifesciences.org/articles/89958/elife-89958-fig3-figsupp1-data13-v1.zip
Figure 4 with 1 supplement

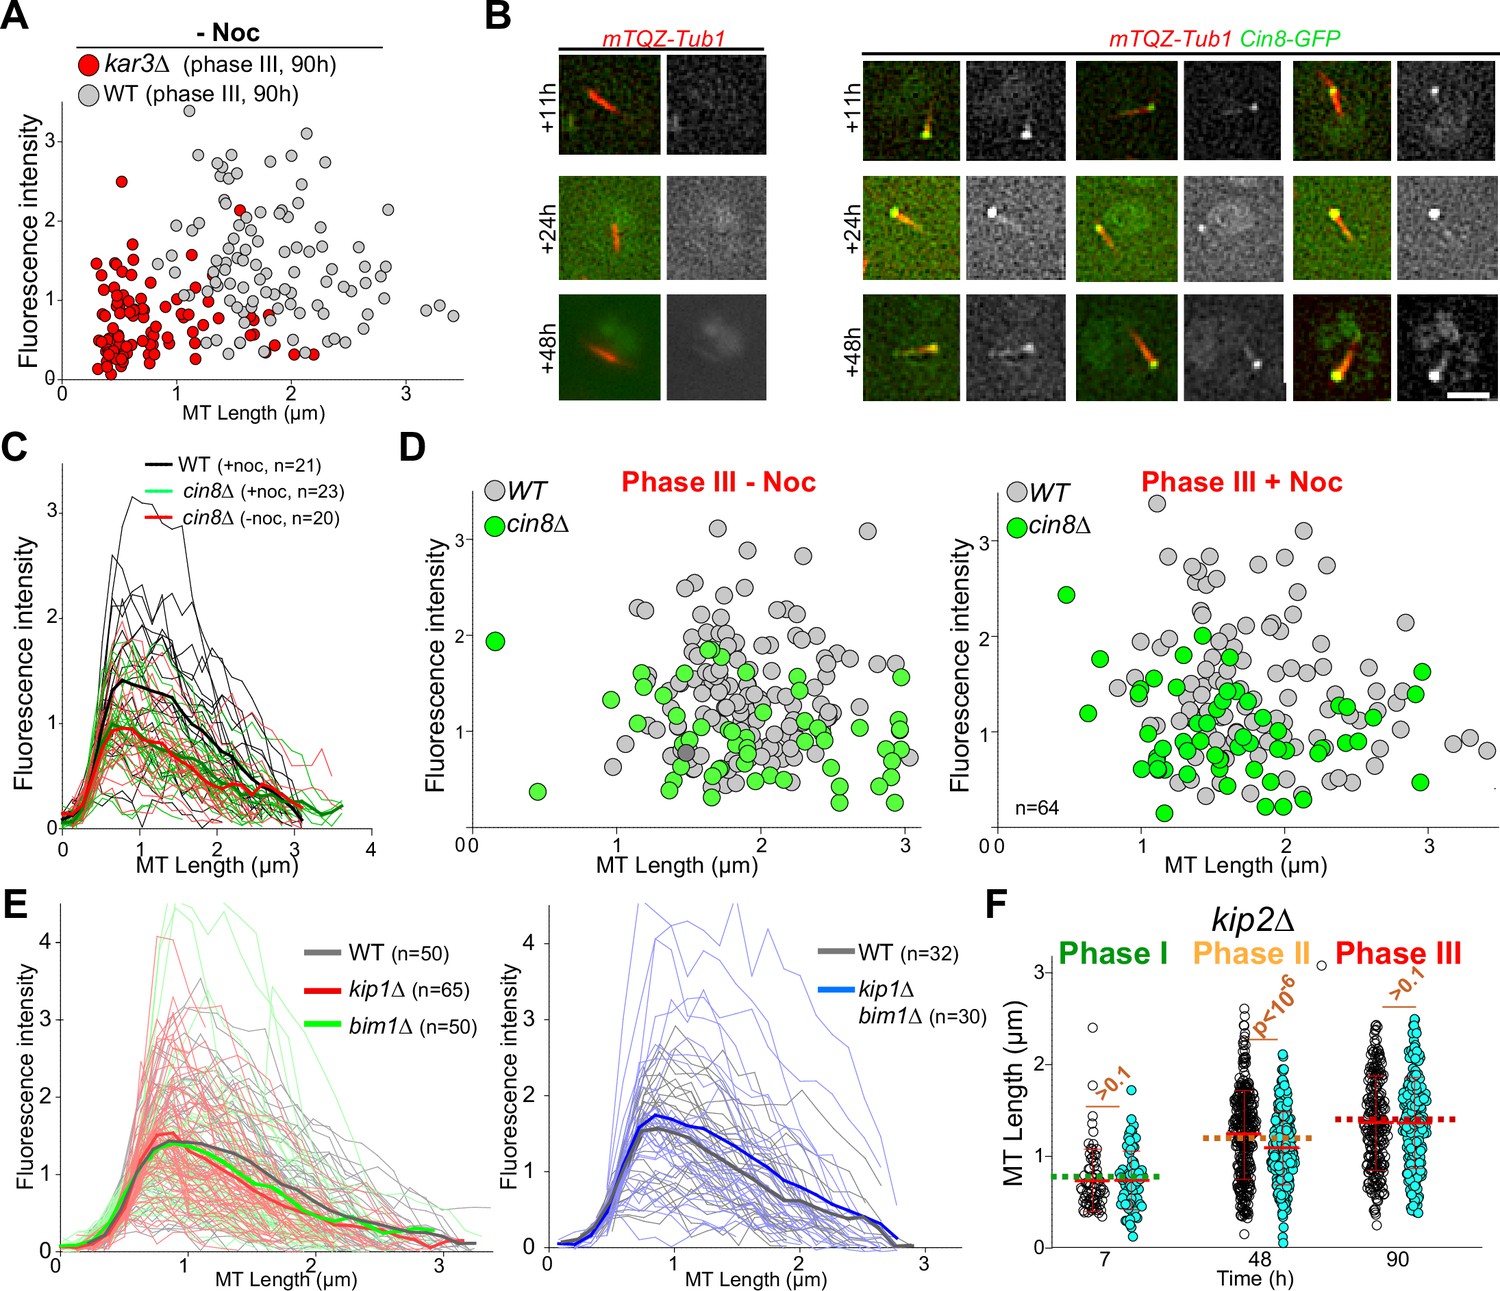
Each phase of quiescent-cell nuclear microtubule (Q-nMT) formation requires a specific kinesin.
(A) Images of representative WT cells (2 d) expressing Kar3-3GFP (green) and mTQZ-Tub1 (red) and corresponding fluorescence intensity along normalized Q-nMT bundles (see ‘Materials and methods’ section). Bar is 2 µm. (B) Morphometric Q-nMT bundle properties distribution in 4 d WT (gray), kar3∆ (red), vik1∆ (blue), and cik1∆ cells (green) expressing mTQZ-Tub1 after Noc treatment (30 µg/ml) – see Figure 4—figure supplement 1A for the control without Noc. Each circle corresponds to an individual Q-nMT bundle (N ≥ 2, n > 50). Black crosses are mean and SD. Images of representative cells are shown. Bar is 2 µm. (C) Nuclear MT length distribution in WT and cin8∆ cells expressing mTQZ-Tub1 treated (+) or not (-) with 15 min Noc (30 µg/ml). Each circle corresponds to the length of an individual MT structure, mean and SD are shown. A Student’s test (t-test with two independent samples) was used to compare (+) or (-) Noc samples from the same experiment (n > 250, N = 1). ***p-value<1.10–5. (D) Fluorescence intensity along Q-nMT bundles in WT and cin8∆ cells expressing mTQZ-Tub1 7 hr and 24 hr after glucose exhaustion. Thin line: intensity from an individual cell; bold line: mean intensity. Images of representative cells are shown. Bar is 2 µm. (E) WT and cin8∆ cells expressing mEOS3.2-Tub1 were imaged using PALM Images in pseudo-colors of representative cells are shown. Full width at half maximum (FWHM) was measured at the indicated distance from the spindle pole body (SPB). Each line in the bottom graphs corresponds to a single cell (n > 25); p-value between WT and cin8∆ is indicated (unpaired t-test). Bar is 1 µm. (F) Images of representative WT cells (3 d) expressing Kip1-GFP (green) and mTQZ-Tub1 (red). Graphs show fluorescence intensity along normalized Q-nMT bundles (plain and dash lines: mean and SD respectively, n = 30). Bar is 2 µm, blue arrowhead: SPB. (G) Representative images of WT, kip1∆, and kip3∆ cells expressing mTQZ-Tub1 treated (+) or not (-) with 15 min Noc (30 µg/ml). Bar is 2 µm. (H) Nuclear MT length distribution in WT, kip1∆, and kip3∆ cells expressing mTQZ-Tub1 treated (+) or not (-) 15 min with Noc (30 µg/ml). Legend is the same as in (C); n > 250, N = 1; *p-value<1.10–3; ***p-value<1.10–6. MT mean length and SD are indicated.
-
Figure 4—source data 1
Excel file containing the morphometric Q-nMT bundle property distribution in indicated cells, treated with nocodazole.
- https://cdn.elifesciences.org/articles/89958/elife-89958-fig4-data1-v1.xlsx
-
Figure 4—source data 2
Excel file containing the nuclear MT length distribution in indicated cells.
- https://cdn.elifesciences.org/articles/89958/elife-89958-fig4-data2-v1.xlsx
-
Figure 4—source data 3
Excel file containing fluorescence intensity measurement along Q-nMT bundles in WT and cin8∆ cells.
- https://cdn.elifesciences.org/articles/89958/elife-89958-fig4-data3-v1.xlsx
-
Figure 4—source data 4
Excel file containing individual mesurments of the FWHM mesured along the Q-nMT bundle.
- https://cdn.elifesciences.org/articles/89958/elife-89958-fig4-data4-v1.xlsx
-
Figure 4—source data 5
Excel file containing individual line scans of Kip1-GFP fluorescence intensities along Q-nMT bundles.
- https://cdn.elifesciences.org/articles/89958/elife-89958-fig4-data5-v1.xlsx
Figure 4—figure supplement 1
The impact of kinesin deletion on quiescent-cell nuclear microtubule (Q-nMT) bundle morphometric parameters.
(A) Q-nMT bundle length as a function of Q-nMT bundle width for individual WT cells (gray) and kar3∆ cells (red) 90 hr after glucose exhaustion. (B) WT cells expressing mTQZ-Tub1 (red) and Cin8-GFP (green) were imaged at the indicated times after glucose exhaustion. Cells expressing only mTQZ-Tub1 (left panel) testify for the absence of fluorescence leak from the mTQZ signal into the GFP channel. Bar is 2 μm. (C) Fluorescence intensity along Q-nMT bundles in WT (black) and cin8Δ cells expressing mTQZ-Tub1, treated (green) or not (red) with Noc. Each line is an individual cell, the bold lines are the mean (n > 20). (D) Morphometric Q-nMT bundle properties distribution in WT (gray) and cin8Δ (green) cells expressing mTQZ-Tub1. Each circle is an individual cell. (E) Fluorescence intensity along Q-nMT bundles in WT (gray, n > 50), kip1Δ (red, n > 50), bim1Δ (green, n > 50), and kip1Δ bim1Δ (blue, n > 30) cells (4 d). Each line is an individual cell, the bold lines are the mean. (F) Nuclear MT length distribution in kip2Δ cells expressing mTQZ-Tub1 treated 15 min (blue dots) or not (black dots) with 30 µg/ml Noc. For a comparison, the mean WT length is indicated as dashed line. Unpaired t-test p-values are indicated.
-
Figure 4—figure supplement 1—source data 1
Excel file containing fluorescence intensity measurement along Q-nMT bundles in the indicated cells.
- https://cdn.elifesciences.org/articles/89958/elife-89958-fig4-figsupp1-data1-v1.xlsx
-
Figure 4—figure supplement 1—source data 2
Excel file containing the morphometric Q-nMT bundle property distribution in WT and cin8Δ cells.
- https://cdn.elifesciences.org/articles/89958/elife-89958-fig4-figsupp1-data2-v1.xlsx
Figure 5 with 1 supplement
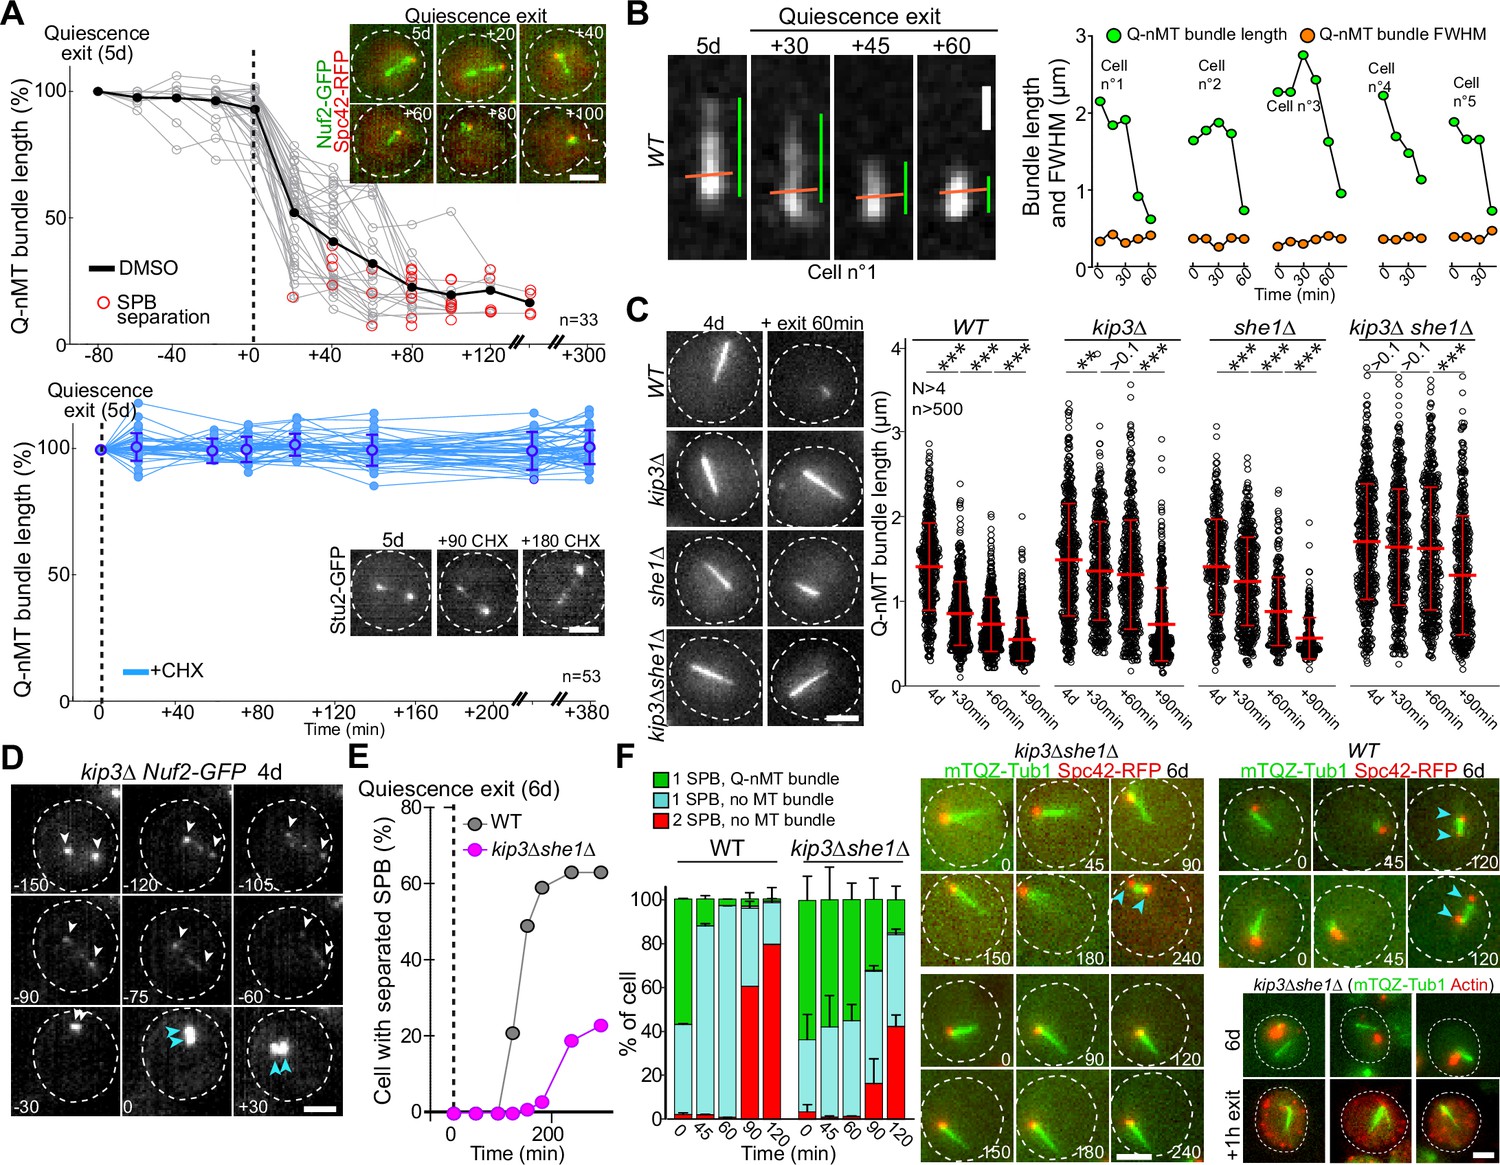
Quiescent-cell nuclear microtubule (Q-nMT) bundle disassembly always occurs before spindle pole body (SPB) separation upon quiescence exit.
(A) WT cells expressing Spc42-RFP (red) (5 d) were re-fed on a YPDA microscope pad. Individual Q-nMT bundles were measured in cells expressing Nuf2-GFP-treated DMSO (top panel, n = 33) or in cells expressing Stu2-GFP treated with CHX (bottom panel, n = 53). Each line corresponds to an individual cell. In the upper panel, time was set to zero at the onset of MT bundle depolymerization. In the lower panel, time was set to zero when cells were deposited on the agarose pad. Images of representative cells are shown. Bar is 2 µm. (B) Q-nMT bundle length (green) and fluorescence intensity at full width half maximum (FWHM, orange) were measured upon quiescence exit in WT cells (5 d) expressing mTQZ-Tub1. Representative example of shrinking Q-nMT bundle is shown on the left. Bar is 1 µm. (C) Cells of the indicated genotype expressing mTQZ-Tub1 were grown for 4 d, and re-fed. Q-nMT bundle length was measured at the indicated time points, 15 min after a Noc treatment (30 µg/ml), to remove dynamic cMTs that assemble upon quiescence exit. Each circle corresponds to a single cell. MT mean length and SD are indicated. A Student’s test (t-test with two independent samples) was used to compare samples from the same experiment (n > 250, N = 4). The indicated p-values are the highest p-value calculated among the four repeated experiments. ***p-value<1.10–5. MT mean length and SD are indicated. Images of representative 4-day-old cells of the indicated genotype expressing mTQZ-Tub1 before and 60 min after quiescence exit are shown. Bar is 2 µm. (D) Representative images of a kip3∆ cell expressing Nuf2-GFP upon quiescence exit. Blue and white arrowheads: SPBs and Q-nMT bundle extremities, respectively. Bar is 2 µm. (E) Percentage of 6-day-old WT or kip3∆she1∆ cells expressing Spc42-mRFP1 with separated SPB as a function of time upon quiescence exit (n > 200). (F) WT and kip3∆she1∆ cells (6 d) expressing Spc42-mRFP1 (red) and mTQZ-Tub1 (green) were re-fed on a YPDA microscope pad. Percentage of cells with a single SPB with or without Q-nMT bundle or with duplicated SPBs were scored (N = 4, n > 200), SDs are indicated. Images of representative cells are shown. Bar is 2 µm. Bottom-right panel: actin (phalloidin staining, red) in kip3∆ she1∆ cells (6 d) expressing mTQZ-Tub1 (green) before and 1 hr after quiescence exit.
-
Figure 5—source data 1
Excel file containing Q-nMT bundle length measurement upon quiescence exit.
- https://cdn.elifesciences.org/articles/89958/elife-89958-fig5-data1-v1.xlsx
-
Figure 5—source data 2
Excel file containing Q-nMT bundle length measurement at the indicated time.
- https://cdn.elifesciences.org/articles/89958/elife-89958-fig5-data2-v1.xlsx
-
Figure 5—source data 3
Excel file containing the percentage of cells with a single or a duplicated SBP, and with or without Q-nMT bundle.
- https://cdn.elifesciences.org/articles/89958/elife-89958-fig5-data3-v1.xlsx
Figure 5—figure supplement 1
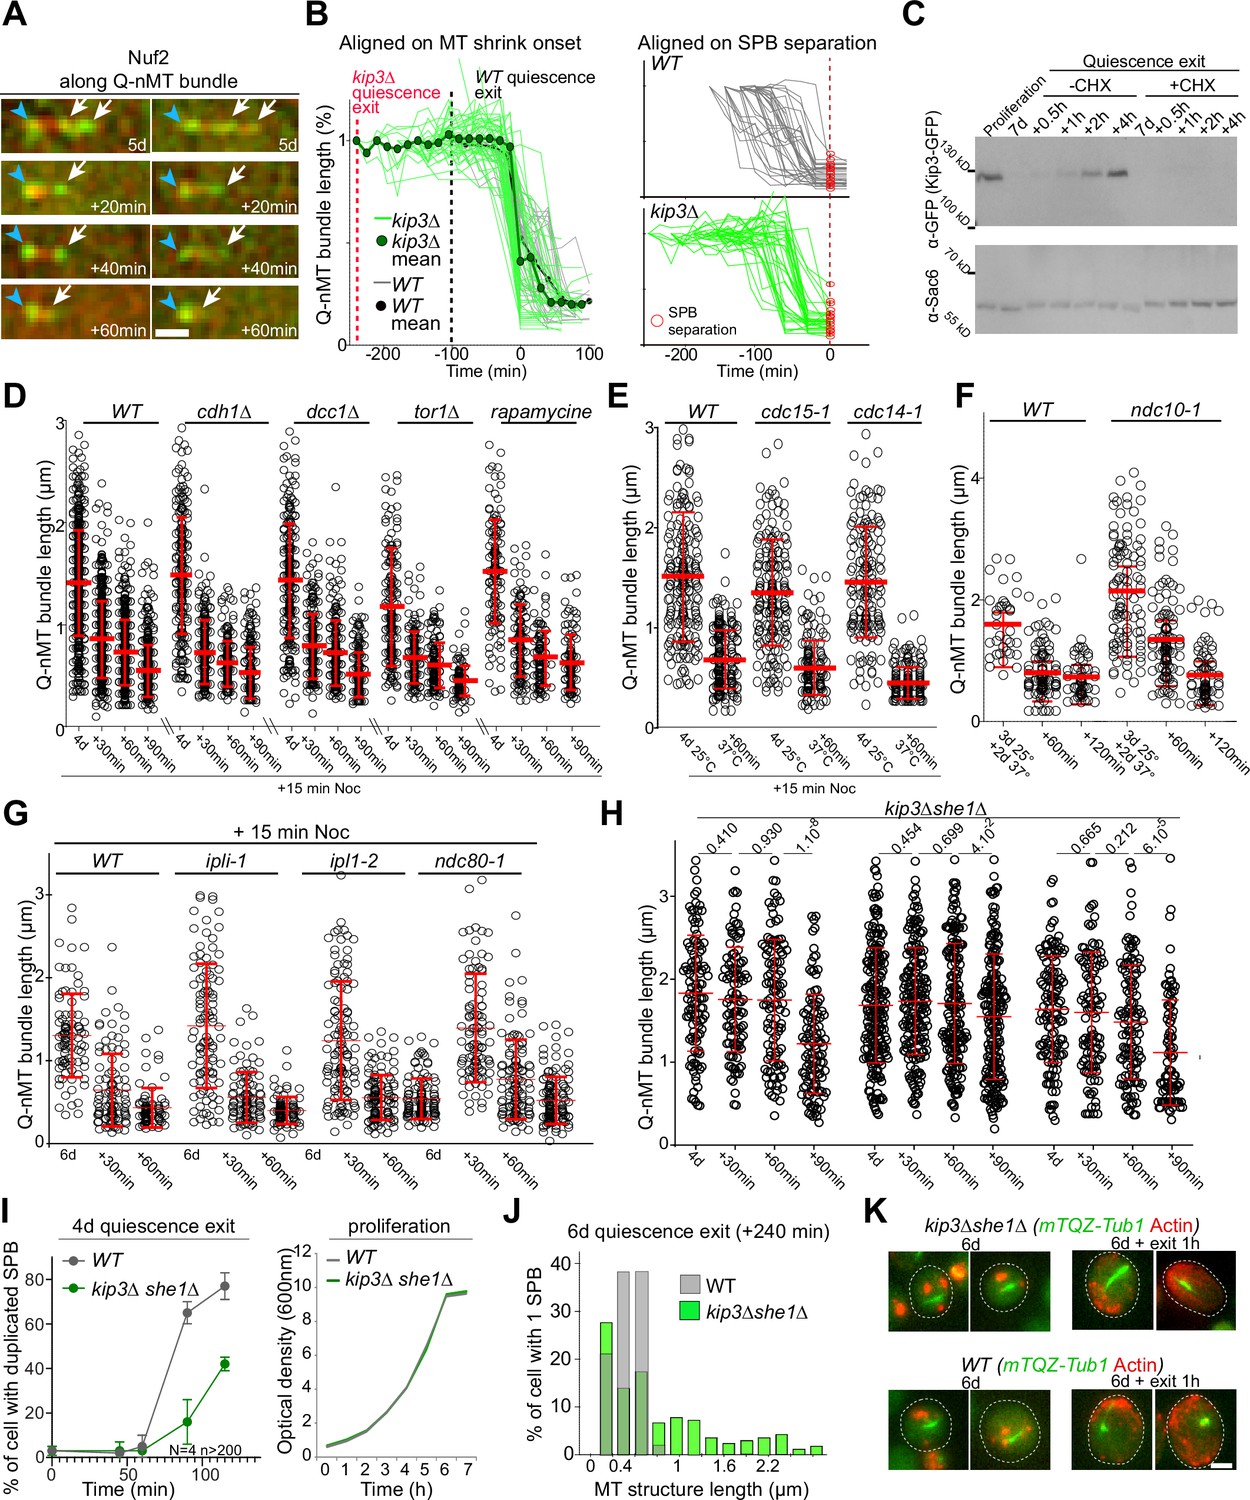
Quiescent-cell nuclear microtubule (Q-nMT) bundle disassembly in mutants involved in mitotic spindle dismantlement.
(A) Representative 5-day-old cells (left and right) expressing mTQZ-Tub1 (red) and Nuf2-GFP (green) exiting quiescence on a YPDA agarose pad. Blue arrowhead: spindle pole body (SPB); white arrows: Nuf2-GFP clusters. Time is in min. Bar is 1 µm. (B) WT and kip3∆ cells (5 d) expressing Nuf2-GFP were re-fed on a YPDA microscope pad. Each line corresponds to an individual cell. Data were presented either (left) with the time set to zero at the onset MT depolymerization or (right) at the onset of SPB separation (red dash line). (C) Western blot using GFP antibodies on total protein extracts from WT cells expressing Kip3-GFP grown for the indicated time. Sac6 was used as a loading control. (D, E) Nuclear Q-nMT bundle length in cells of the indicated genotype expressing mTQZ-Tub1, grown for 4 d and imaged at the indicated time after refeeding. For the rapamycin experiment in (D), WT cells were pre-incubated 1 hr with rapamycin (1 μg/ml), and then re-fed in presence of the drug. For thermo-sensitive strains in (E), cells were grown 4 d at 25°C, shifted 1 hr at 37°C, and then transferred to new medium at 37°C to trigger quiescence exit. Measurements were done after a 15 min Noc treatment (30 µg/ml) to remove dynamic cytoplasmic MTs (cMTs). Each circle represents an individual cell. Mean and SD are indicated. (F, G) Nuclear Q-nMT bundle length in cells of the indicated genotype expressing mTQZ-Tub1 grown for the indicated time at 25°C, shifted to 37°C, and re-fed. In (G), measurements were done after a 15 min Noc treatment (30 µg/ml) to remove dynamic cMTs. Each circle represents an individual cell. Mean and SD are indicated. (H) Three individual experiments in which nuclear MT length was measured in 4-day-old kip3∆she1∆ cells expressing mTQZ-Tub1 upon quiescence exit (n > 100). p-Values from unpaired t-test are shown. Each circle represents an individual cell. Mean and SD are indicated. (I) Percentage of cells with separated SPBs upon quiescence exit on YPDA agarose pad (N = 4, n > 200, left panel). Right: proliferation of WT and kip3∆she1∆ strains in YPDA (OD 600 nm as function of time). (J) Q-nMT bundle length distribution in WT (gray) or kip3∆she1∆ (green) cells with unseparated SPBs, 240 min after quiescence exit. (K) Actin (red, phalloidin-staining) in WT and kip3Δshe1Δ cells expressing mTQZ-TUB1 (green) at the indicated time upon quiescence exit. Bar is 2 μm.
-
Figure 5—figure supplement 1—source data 1
Excel file containing Q-nMT bundle length measurements in WT and kip3∆ cells upon quiescence exit.
- https://cdn.elifesciences.org/articles/89958/elife-89958-fig5-figsupp1-data1-v1.xlsx
-
Figure 5—figure supplement 1—source data 2
Uncropped western blot for Figure 5—figure supplement 1C.
- https://cdn.elifesciences.org/articles/89958/elife-89958-fig5-figsupp1-data2-v1.zip
-
Figure 5—figure supplement 1—source data 3
Raw western blot for Figure 5—figure supplement 1C – loading control.
- https://cdn.elifesciences.org/articles/89958/elife-89958-fig5-figsupp1-data3-v1.zip
-
Figure 5—figure supplement 1—source data 4
Raw western blot for Figure 5—figure supplement 1C.
- https://cdn.elifesciences.org/articles/89958/elife-89958-fig5-figsupp1-data4-v1.zip
Figure 6

Model for quiescent-cell nuclear microtubule (Q-nMT) bundle assembly.
(a) In G1, the nucleus is in a Rabl-like configuration. (b) Upon quiescence establishment, chromosomes get condensed. MT–kinetochore interaction and Ilp1 are required for the onset of phase I. (c) Kar3 and its regulator Cik1 are essential to initiate Q-nMT bundle elongation. Although deletion of BIM1 has no effect, it becomes critical for phase I if kinetochore–MT interactions are destabilized by the absence of Chromosome Passenger Complex components. Kinetochore clustering by the monopolin complex and Slk19 is needed to maintain MT bundling while phase I-MTs elongate. During phase I, Tub4 accumulates at the spindle pole body (SPB). (d) In phase II, a second wave of MT nucleation and elongation occurs. Phase II-MTs are concurrently stabilized along pre-existing phase I-MTs, in a Cin8-dependent manner. Phase I and phase II MTs +ends (>1 µm) remain dynamic until the full-length Q-nMT bundle stabilization is reached via the action of Kip1, about 2 d after glucose exhaustion (e).
Author response image 1
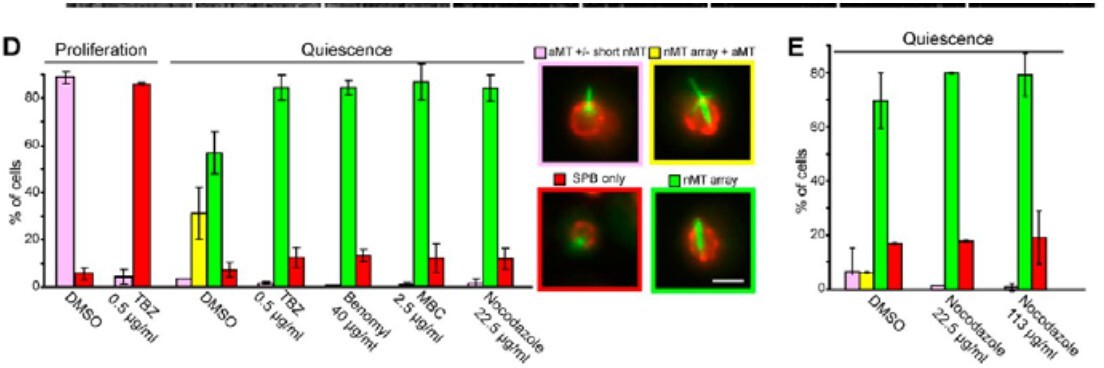
The nMT array contains highly stable MTS.
(A) Variation Of nuclear MT length in function Of time (second) in proliferating cells. Cells express GFP•Tubl (green) and Nup2•RFP (red). Bars, 2 pm. N = l, n is indicated. (B) Variation of the nMT array length in function of time measured for BirnlGFP—expressing cells In = 161, for 6-d•old Dad2GFP—expressing cells In = 171, for Stu2GFP—expressing cells (n = 17), and 6•d-old Nuf2• GFP—expressing cells (n = 17). Examples Of corresponding time lapse are shown. Time is in minutes experiments). Bar, 2 pm. (CJ Nuf2•GFP dots detected along nMT array (arrow) are immobile. Several time lapse images of cells are shown. Time is in minutes. gar, 2 pm _ MT organizations in proliferating cells and 4-d•old quiescent cells before and after a 90-min treatment With indicated drugs. Bar, 2 pm. (E) MT organizations in Sci-old quiescent cells before and after a 90min treatment With increasing concentrations Of nocodazole.
Author response image 2

The nuclear array is composed of stable MTS.
Variation of the length in function of time of (A) aMTs in proliferating cells, (B) nMT array in quiescent cells (7 d), and the two MT structures in early quiescent cells (4 d). White arrows point ot dynamic aMTs. In A—C, N = 2, n is indicated (ID) FRAP on 7-d-old quiescent cells. White arrows point to bleach areas. Error bars are SEM. In A—D. time is in seconds. (E) nMT array is not affected by nocodazole treatment. Before and various times after carbon exhaustion (red dashed line), cells were incubated for 3 h with 22.5 pg/pL nocodozole and then imaged. The corresponding control experiment is shown in Fig I A. In all panels, cells expressing GFP-TtJbl (green) and Nup2-RFP (red) are shown; bars, 2 pm.
Author response image 3

Proliferating cells expressing NOf2=GFP and mTQZ-TUb1 (00—2) were treated or not With NOC (30vgfmI) for 15 min.
% Of cells With detectable MT and representative cells are shown. Khi-teet values are indicated. Bar: 2 pm,
Author response image 4
Author response image 5
Author response image 6

MTsare organized as a nuclear array in quiescent cells.
(A) MT reorganization upon quiescence entry. Cells expressing GFP-Tub1 (green) and Nup2RFP (red) are shown. Glucose exhaustion is indicated as a red dashed line. Quiescent cells dl expressing Tub I-RFP and either Spc72GFP,
Author response image 7

(top) or coexpr;sse8 with Tub I-RFP (bottom).
Arrows point dot along the nMT array. Bars: (A—C) 2 pm. (E) AMT arroy visualized in WT cells by EMI Yellow arrows, MTS; red arrowheads, nuclear membrane; pink arrow, SPB. Insets: nMT cut transversally. Bar, 100 nm.
Author response image 8
Author response image 9
Author response image 10

Additional files
Download links
A two-part list of links to download the article, or parts of the article, in various formats.
Downloads (link to download the article as PDF)
Open citations (links to open the citations from this article in various online reference manager services)
Cite this article (links to download the citations from this article in formats compatible with various reference manager tools)
A stable microtubule bundle formed through an orchestrated multistep process controls quiescence exit
eLife 12:RP89958.
https://doi.org/10.7554/eLife.89958.3


