Regulation of multiple signaling pathways promotes the consistent expansion of human pancreatic progenitors in defined conditions
- Paul Langerhans Institute Dresden (PLID) of Helmholtz Center Munich at the University Clinic Carl Gustav Carus of TU Dresden, Helmholtz Zentrum München, German Research Center for Environmental Health, Germany
- German Centre for Diabetes Research (DZD), Germany
- Dresden Concept Genome Centre (DcGC), TU Dresden, Germany
- Center for Molecular and Cellular Bioengineering (CMCB) Technology Platform, TU Dresden, Germany
- Center for Regenerative Therapies Dresden (CRTD), Faculty of Medicine, TU Dresden, Germany
- Stem Cell Engineering Facility, (SCEF), CRTD, Faculty of Medicine, TU Dresden, Germany
- Department of Medicine III, University Hospital Carl Gustav Carus and Faculty of Medicine, TU Dresden, Germany
Figures
Figure 1 with 1 supplement
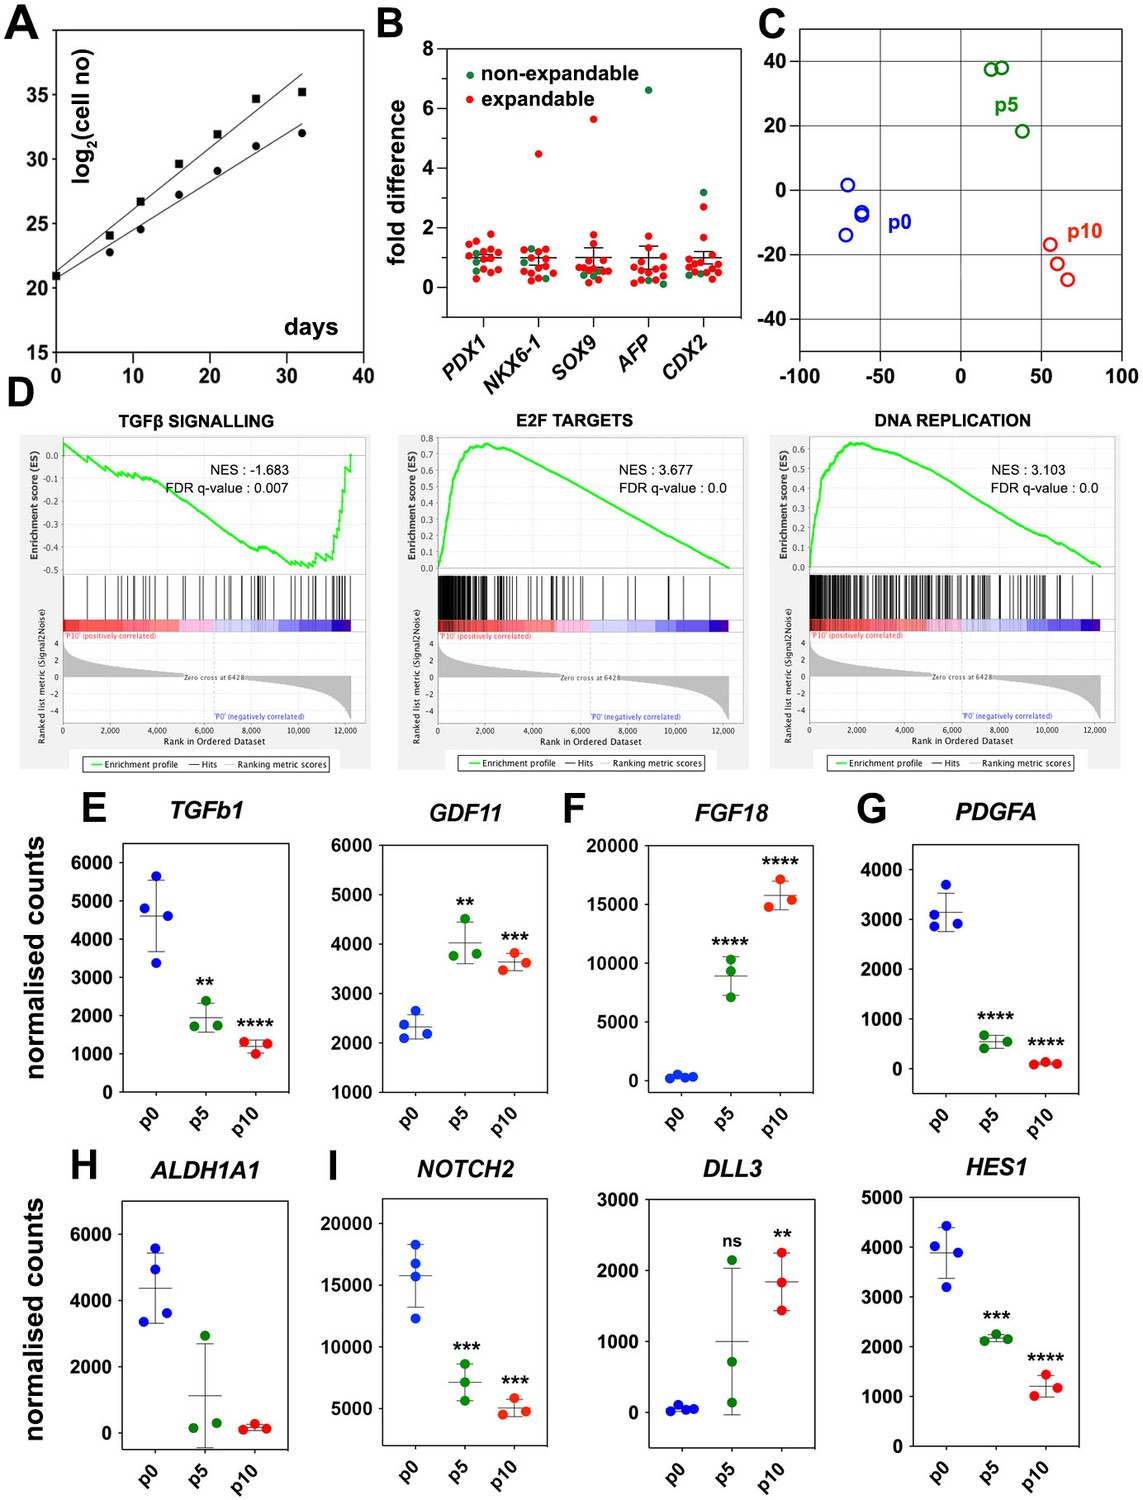
Regulated genes and signaling pathways during the expansion of pancreatic progenitor (PP)-containing cells (PP cells) under the initial condition (CINI).
(A) Growth curves of two samples showing exponential expansion of PP cells for 32 d. (B) Expression of pancreatic (PDX1, NKX6-1, SOX9) as well as liver and gut markers (AFP, CDX2, respectively) at the PP stage of representative differentiations before expansion. Expression at each sample is shown as a fold difference from the average expression level. In red are shown samples that could not be expanded and in green samples that could be expanded. (C) Metric multidimensional scaling (MDS) plot representing the Euclidean distance of samples at p0 (n = 4), p5 (n = 3), and p10 (n = 3). (D) Enrichment plots for regulated genes (p0 vs p10) of the TGFβ signaling pathway, E2F target genes, and DNA replication show a negative correlation of the TGFβ pathway but a positive correlation of E2F target genes and DNA replication with expansion. (E–I) Transcript levels expressed in normalized RNA-Seq counts of p0 (n = 4), p5 (n = 3), and p10 (n = 3) PP cells for genes encoding signals or receptors of the TGFβ (E), FGF (F) and PDGF (G) signaling pathways, the RA-producing enzyme ALDH1A1 (H), as well as components of the NOTCH (I) signaling pathway. Dots in all graphs represent values from independent experiments. Horizontal lines represent the mean ± SD. Statistical tests were one-way ANOVA using p0 as the control condition for the comparison with *p≤0.033, **p≤0.002, ***p≤0.0002, and ****p≤0.0001.
Figure 1—figure supplement 1
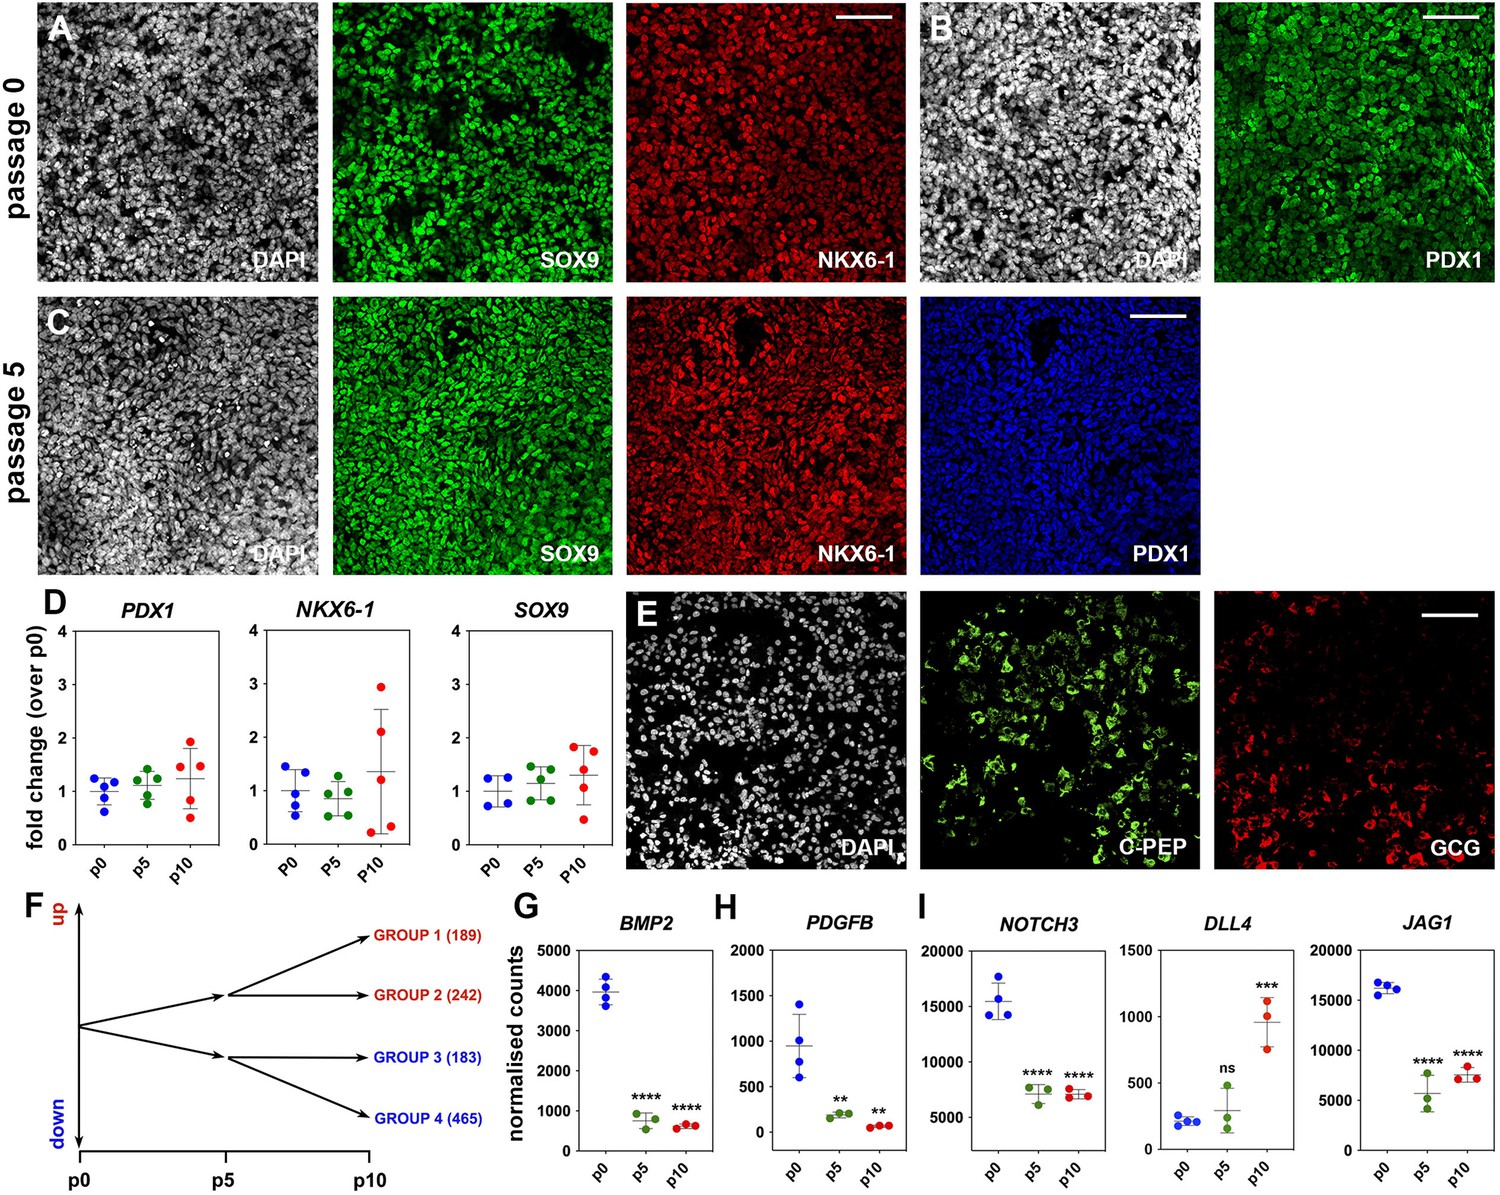
Regulated genes and signaling pathways during pancreatic progenitor (PP) expansion under initial condition (CINI).
(A–C) Immunofluorescence staining of H1-derived PPs showed that expression of PP markers at p0 (A, B) was retained for at least five passages (p5) of expansion under the initial condition (CINI) (C). (D) qPCR analyses indicated that transcript levels of pancreatic progenitor markers were retained at p5 and p10. Values at p5 and p10 were normalized against the value of the corresponding expansion at p0 to give the calculated fold change. Values at p0 were normalized against the average p0 value. (E) Stained cryosections of CINI expanding PP (ePP)-derived endocrine cell clusters showing expression of endocrine markers. (F) Schematic showing the number of genes significantly up- or downregulated after filtering the RNA-Seq data for 1.6 ≤ fold change ≤ 0.6, normalized counts ≥ 100, and padj≤0.05. (G–I) Average transcript levels in normalized RNA-Seq counts of p0 (n = 4), p5 (n = 3), and p10 (n = 3) PP cells for genes encoding regulated ligands or receptors of the TGFβ (G), PDGF (H), and NOTCH signaling pathways (I). Dots in all graphs represent values from independent experiments. Horizontal lines represent the mean ± SD. Statistical tests were one-way ANOVA using p0 as the control condition for the comparison with *p≤0.033, **p≤0.002, ***p≤0.0002, and ****p≤0.0001.Scale bar corresponds to 50 μm (A–C).
Figure 2 with 1 supplement
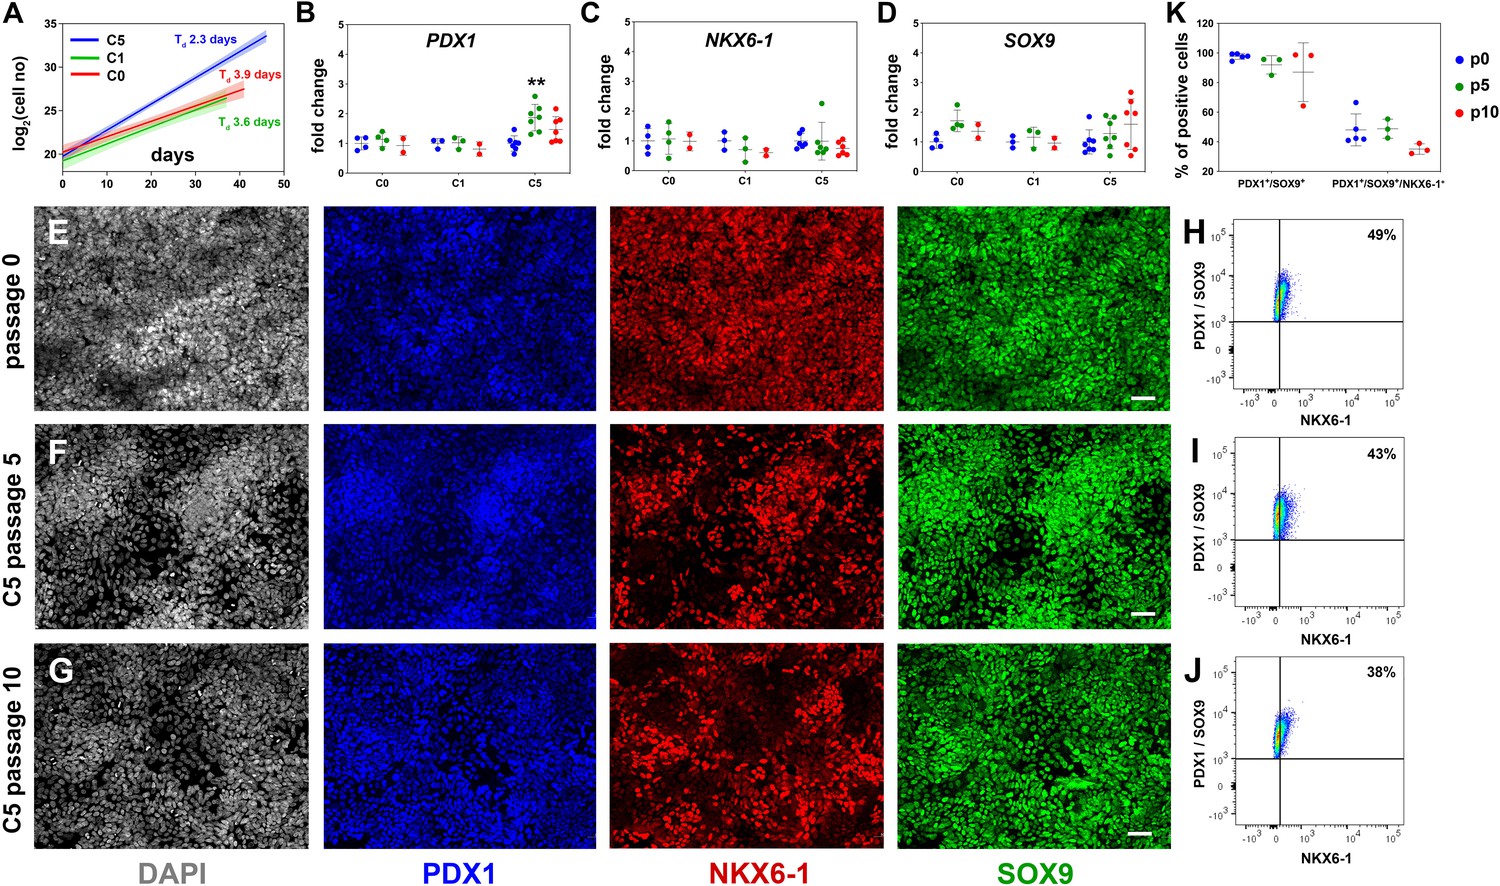
Reproducible expansion of pancreatic progenitor (PP) cells under condition 5 (C5).
(A) Growth curves and regression analysis for PP cells expanded under C0, C1, and C5 for at least 10 passages. The doubling time (Td) of C5-expanded cells (n = 7) was 2.3 d with a 95% confidence interval (CI) of 2.13–2.51 d. This was clearly increased compared to C0- (n = 2, Td = 3.92 d, 95% CI = 3.22–4.98 d) and C1-expanded cells (n = 2, Td = 3.55 d, 95% CI = 2.88–4.62 d). The translucent shading represents the 95% CI of the growth rate at the different conditions. (B–D) Gene expression profile of C0-, C1-, and C5-expanded cells as shown by qPCR for expression of the key pancreas progenitor markers PDX1 (B), NKX6.1 (C), and SOX9 (D) during the expansion. Expression is normalized against the expression of each marker at p0. (E–G) Representative images of immunofluorescent staining of p0 PP cells (E) as well as C5-expanded cells at p5 (F) and p10 (G) for the PP transcription factors PDX1, NKX6.1, and SOX9. (H–J) Flow cytometry analysis of p0 PP cells (H), as well as C5-expanded cells at p5 (I) and P10 (J) for PDX1, NKX6.1, and SOX9. (K) Cumulative results of the flow cytometry analyses for PDX1+/SOX9+ and PDX1+/SOX9+/NKX6.1+ C5-expanded PP cells at p0, p5, and p10. Dots in all graphs represent values from independent experiments. Horizontal lines represent the mean ± SD. Statistical tests were two-way ANOVA with Tukey’s test using p0 as the control condition for the comparison with *p≤0.033, **p≤0.002, ***p≤0.0002, and ****p≤0.0001. Scale bar corresponds to 50 μm.
Figure 2—figure supplement 1
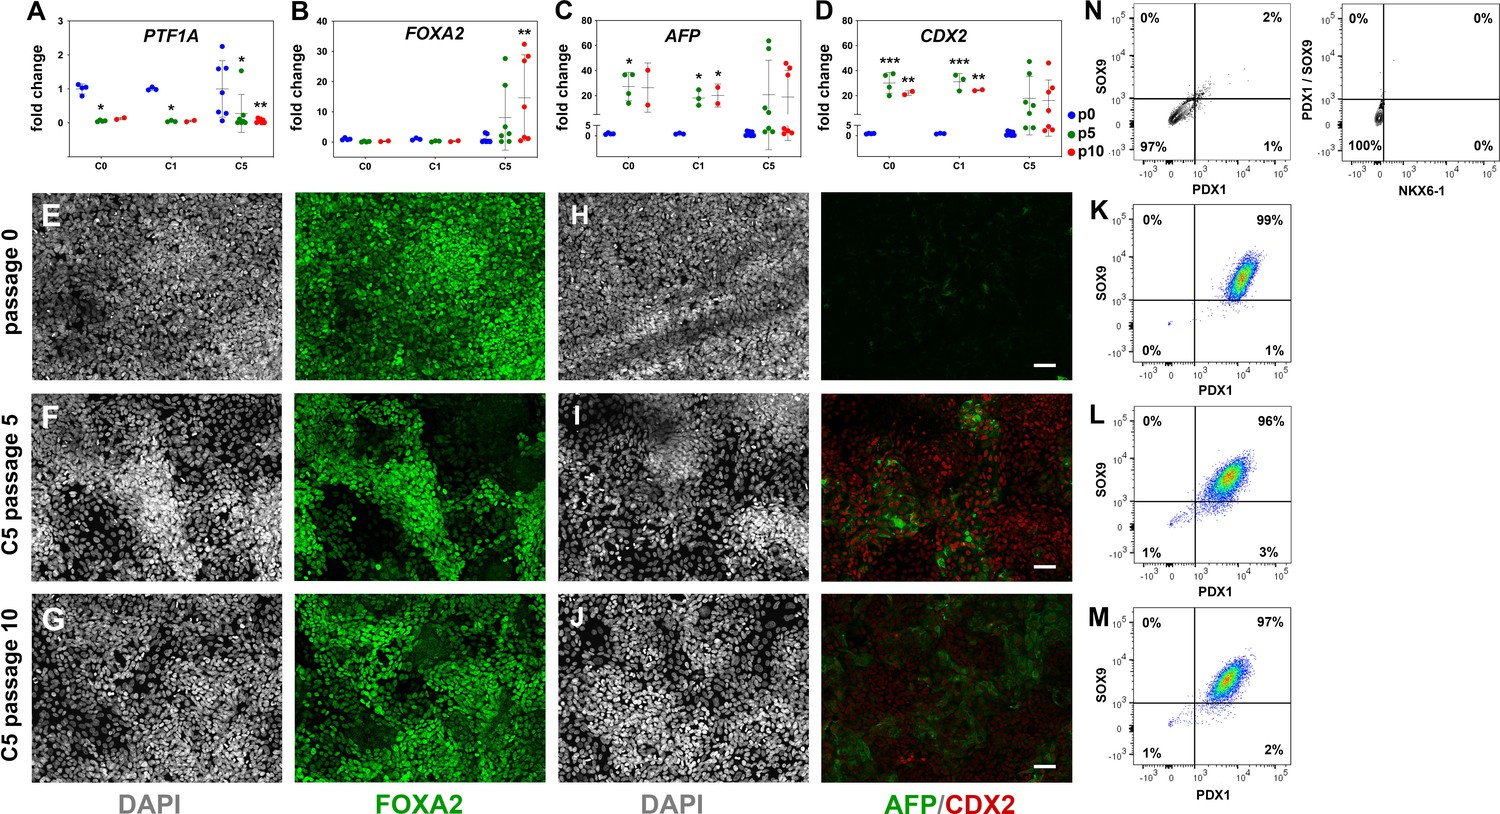
Reproducible expansion of pancreatic progenitor (PP) cells under condition 5 (C5).
(A–D) Gene expression profile of C0-, C1-, and C5-expanded cells as shown by qPCR for the PP markers PTF1A (A) and FOXA2 (B) as well as the liver marker AFP (C) and the gut marker CDX2 (D). Expression is normalized against the expression of each marker at p0. (E–J) Representative images of immunofluorescent staining of p0 PP cells and C5-expanded cells at p5 and p10 for FOXA2 (E–G) and AFP/CDX2 expression (H–J). (K–M) Flow cytometry analysis of p0 PP cells and C5-expanded cells at p5 and p10 for PDX1+/SOX9+ cells. (N) Flow cytometry analysis of PP cells incubated with only secondary antibodies. Dots in all graphs represent values from independent experiments. Horizontal lines represent the mean ± SD. Statistical tests were two-way ANOVA with Tukey’s test using p0 as the control condition for the comparison with *p≤0.033, **p≤0.002, ***p≤0.0002, and ****p≤0.0001. Scale bar corresponds to 50 μm.
Figure 3 with 1 supplement
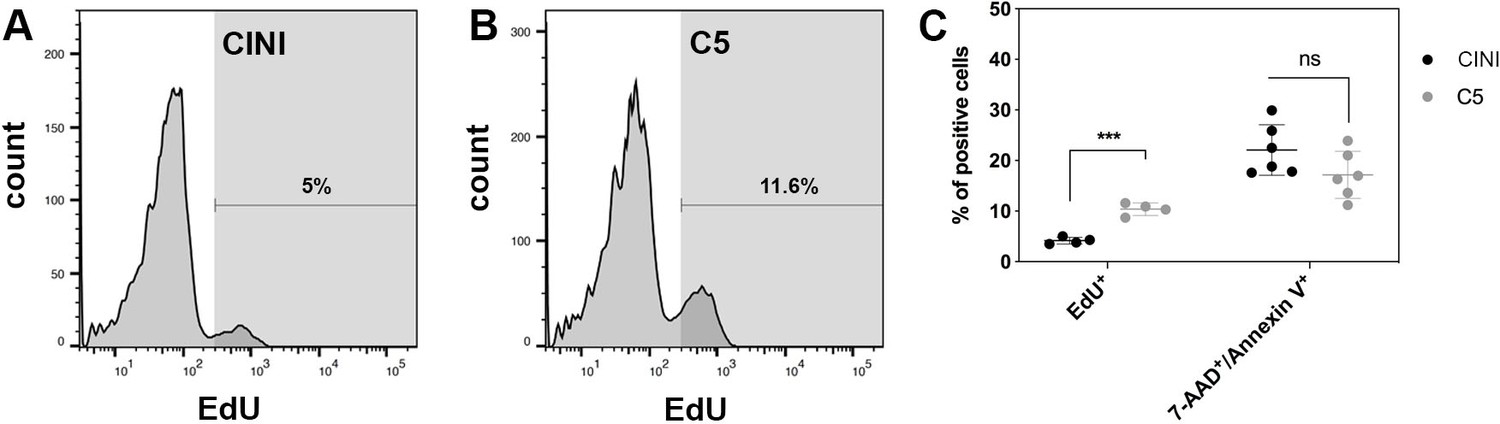
Expansion of pancreatic progenitor (PP) cells promotes primarily their proliferation rather than their survival.
(A, B) Histogram plots showing the percentage of PP cells that had incorporated EdU during expansion under CINI (A) and C5 (B). (C) Summary of flow cytometry data comparing proliferation, measured by EdU incorporation (n = 4), and cell death, measured by Annexin V/7-AAD staining (n = 6), of PP cells expanded under CINI and C5. Dots in all graphs represent values from independent experiments. Horizontal lines represent mean ± SD. Means were compared with multiple t-tests and significance is *p≤0.033, **p≤0.0021, ***p≤0.0002, or ****p≤0.0001.
Figure 3—figure supplement 1
Expansion of pancreatic progenitor (PP) cells promotes primarily their proliferation rather than their survival.
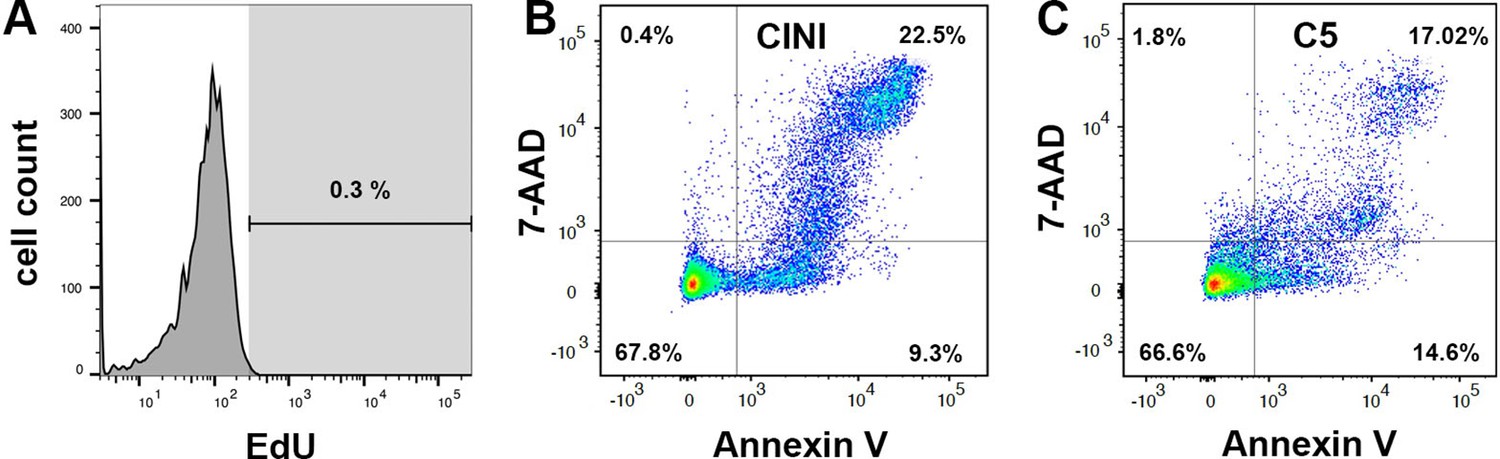
(A) Cells without EdU incorporation but processed in the same manner as the sample were used to set the threshold for the quantification. (B, C) Dot plot diagrams of the flow cytometry assay for cell death. Dead cells present in CINI- (B) and C5- (C) expanding PP (ePP) cells appear in the upper-right quadrant as cells positive for both Annexin V-FITC and 7-AAD.
Figure 4 with 1 supplement
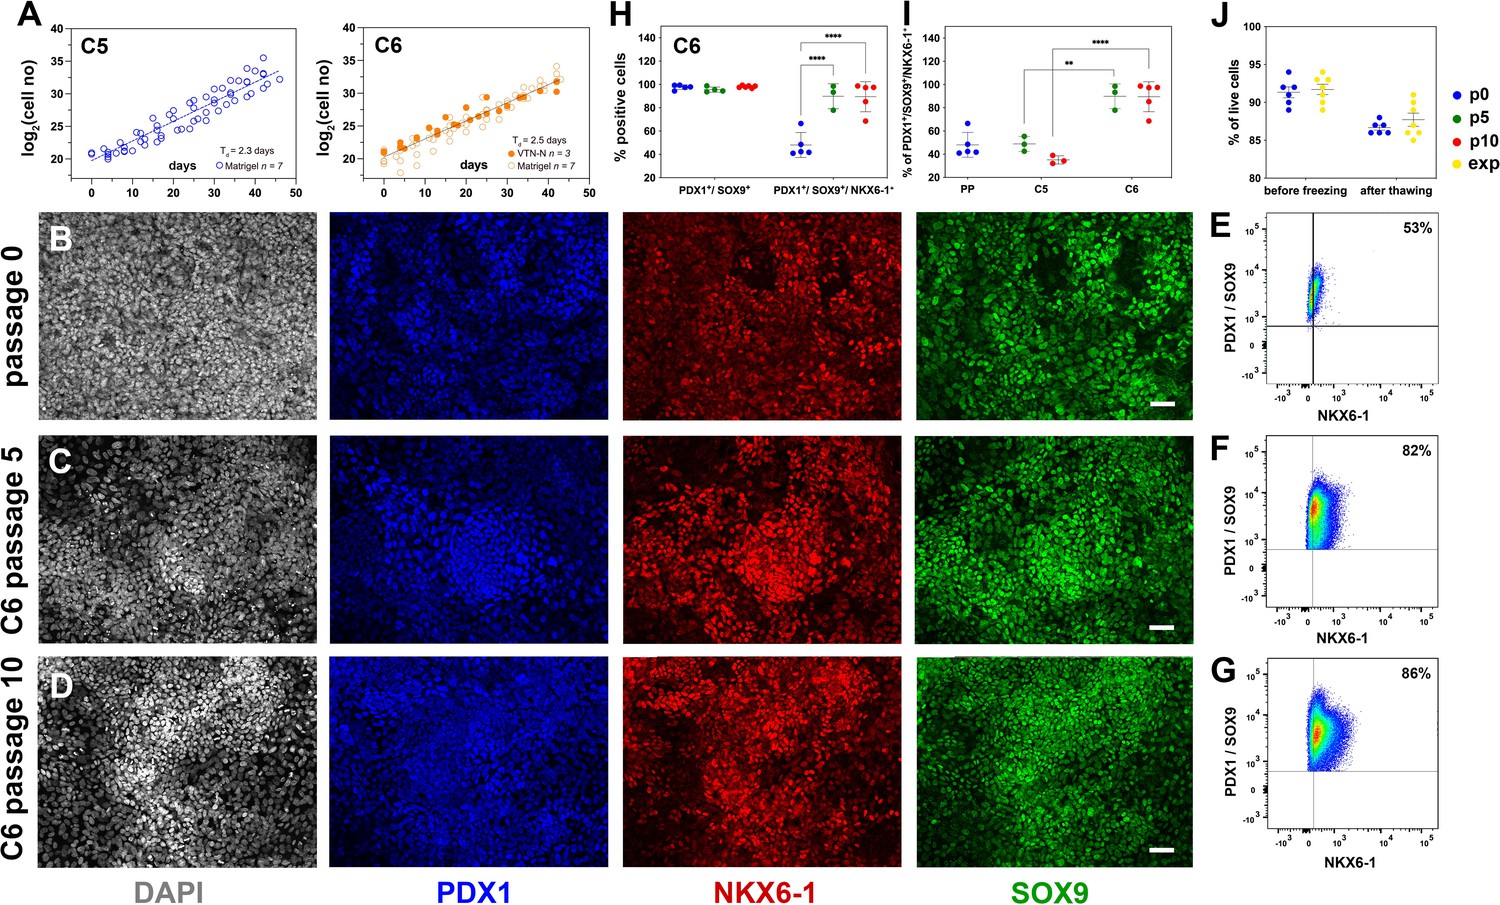
Reproducible expansion under condition 6 promotes pancreatic progenitor (PP) identity.
(A) Growth curves and regression analysis for PP cells expanded under C5 and C6 for 10 passages. The regression line for C5 showed a doubling time of 2.3 d (n = 7) compared to 2.5 d (n = 10) for C6. (B–D) Representative images of immunofluorescent staining of p0 PP cells (B) as well as C6-expanded cells at p5 (C) and p10 (D) for the PP transcription factors PDX1, NKX6.1, and SOX9. (E–G) Flow cytometry analysis of non-expanded p0 PP cells (E) and C6-expanded cells at p5 (F) and p10 for PDX1+/SOX9+/ NKX6.1+ cells (G). (H, I) Cumulative results of the flow cytometry analyses for PDX1+/SOX9+ and PDX1+/SOX9+/NKX6.1+ C6-expanded cells at p0, p5, and p10 (H) and comparison of the percentage of C5- and C6- expanded PDX1+/SOX9+/NKX6.1+ cells at p5 and p10 (I). (J) Survival rates of PP cells before freezing and after thawing at p0 or during expansion. Dots in all graphs represent values from independent experiments. Horizontal lines represent the mean ± SD. Statistical tests were two-way ANOVA with Tukey’s test using p0 as the control condition for the comparison with *p≤0.033, **p≤0.002, ***p≤0.0002, and ****p≤0.0001. Scale bar corresponds to 50 μm.
Figure 4—figure supplement 1
Reproducible expansion in condition 6 promotes pancreatic progenitor (PP) identity.
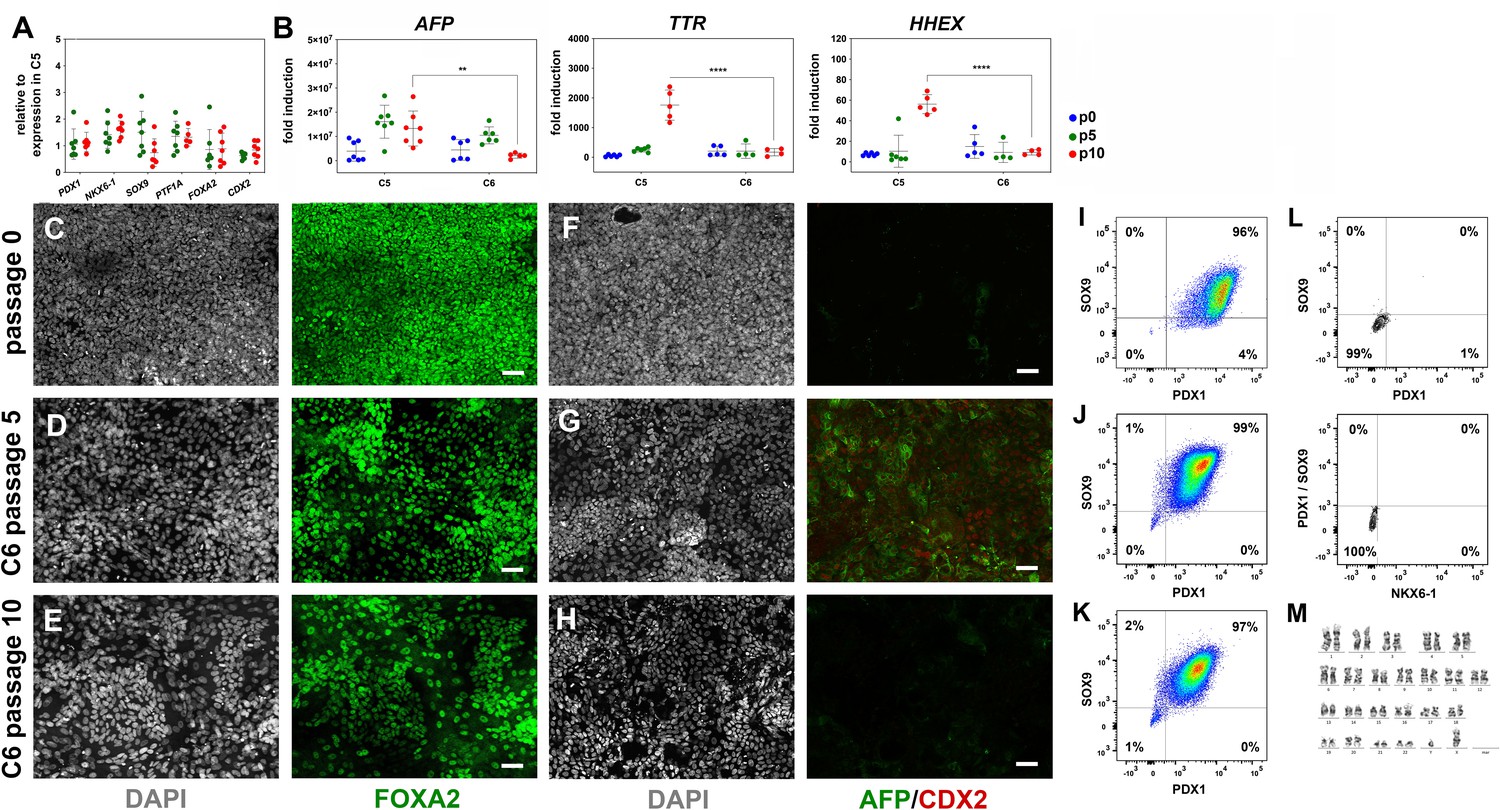
(A) Gene expression profile of C6-expanded PP cells p5 (green) and p10 (red) as determined by qPCR. Values are expressed as fold change relative to the expression values in C5-expanded cells at the corresponding passage number. (B) The expression of the hepatic markers AFP, TTR, and HHEX, as determined by qPCR, was significantly lower in C6- than in C5-expanded cells by p10. Fold induction was calculated with reference to expression levels at the human pluripotent stem (hPS) cell stage. (C–H) Representative images of immunofluorescent staining of p0 PP cells and C6-expanded cells at p5 and p10 for FOXA2 (C–E) and AFP/CDX2 expression (F–H). (I–K) Flow cytometry analysis of p0 PP cells (I) and C6 expanding PP (ePP) cells at p5 (J) and p10 (K) for PDX1+/SOX9+ cells. (L) Flow cytometry analysis of PP cells incubated with only secondary antibodies. (M) Karyotyping of C6-expanded PP cells after 16 passages showed no chromosomal abnormalities. Dots in all graphs represent values from independent experiments. Horizontal lines represent the mean ± SD. Statistical tests were two-way ANOVA with Tukey’s test using p0 as the control condition for the comparison with *p≤0.033, **p≤0.002, ***p≤0.0002, and ****p≤0.0001. Scale bar corresponds to 50 μm.
Figure 5 with 1 supplement
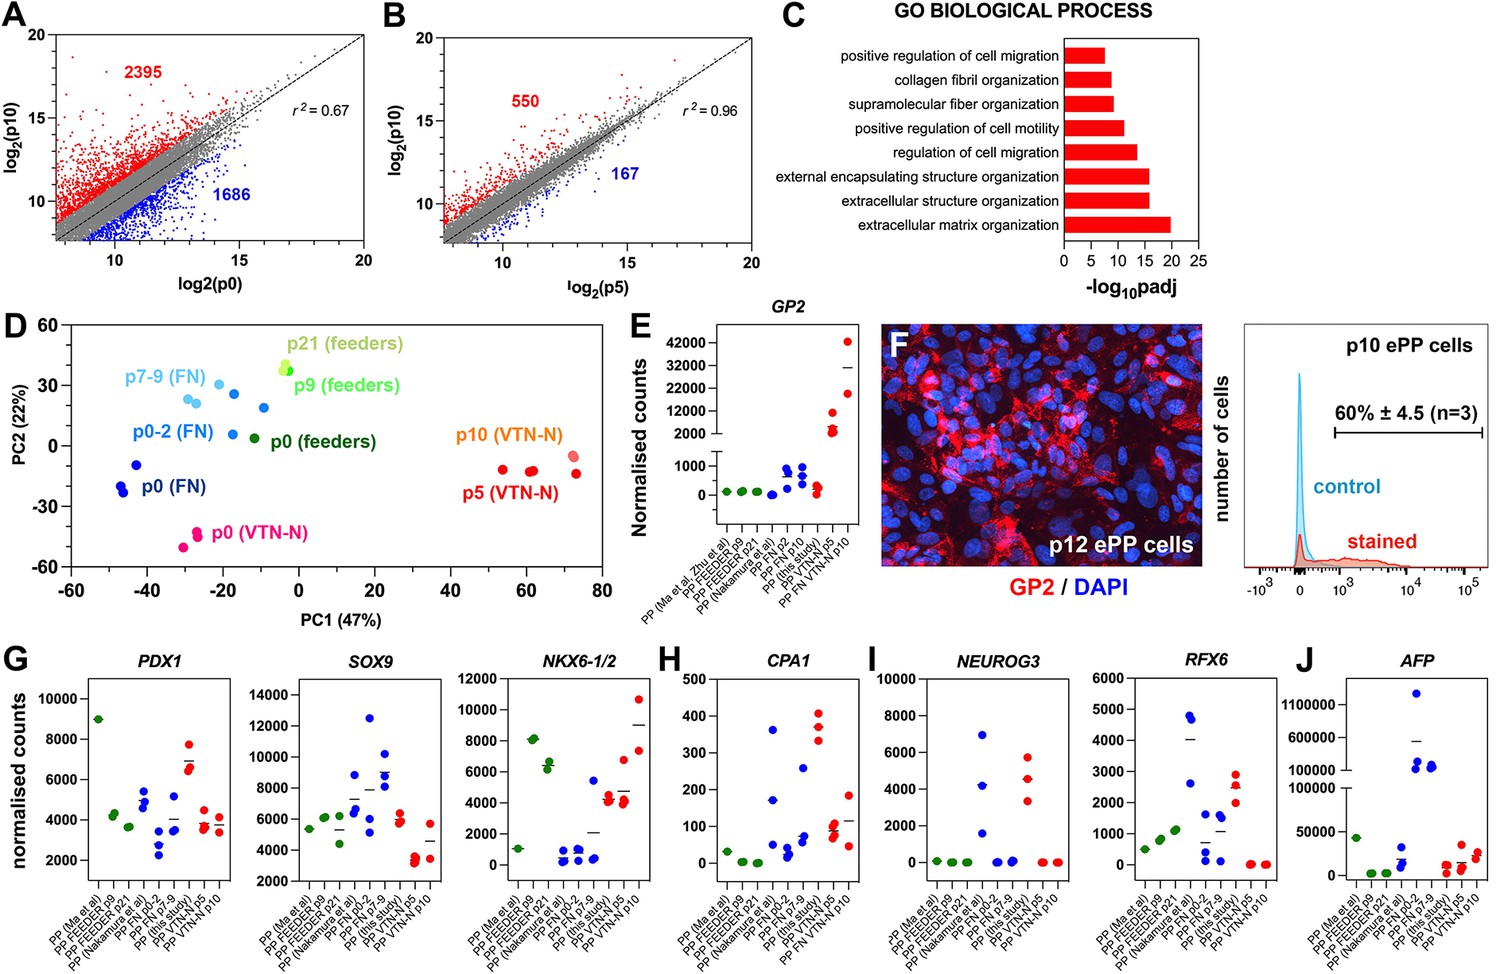
Expansion under C6 stabilizes pancreatic progenitor (PP) cell identity by repressing differentiation and alternative cell fates.
(A, B) Correlation analyses of the transcriptome profiles of non-expanded (p0) and p10 expanded PP cells (A) and the transcriptome profiles of p5 and p10 expanded cells (B). The numbers of upregulated and downregulated genes (normalized counts ≥200 and 0.5≥ FC ≥ 2) are shown in red and blue, respectively, and r is the correlation coefficient. (C) Mostly affected biological processes between p0 and p10. (D) Principal component analysis (PCA) of feeder expanded cells and corresponding p0 cells (shades of green), fibronectin (FN)-expanded cells, and corresponding p0 cells (shades of blue), as well as vitronectin-N (VTN-N)-expanded cells and corresponding p0 cells (shades of red). Darker shades correspond to earlier passages. (E) Comparative expression levels of GP2 in normalized RNA-Seq counts. (F) GP2 immunofluorescence of p12 expanded PP cells and FC of p10 expanding PP (ePP) cells. (G–J) Comparative expression levels of progenitor (G), multipotent progenitor cell (MPC) (H), endocrine (I), and liver (J) markers in normalized RNA-Seq counts of ePP cells and their corresponding p0 cells expanded on feeders (green), FN (blue), and VTN-N (red). Dots in all graphs represent values from independent experiments. Horizontal lines in the graphs represent the mean value.
Figure 5—figure supplement 1
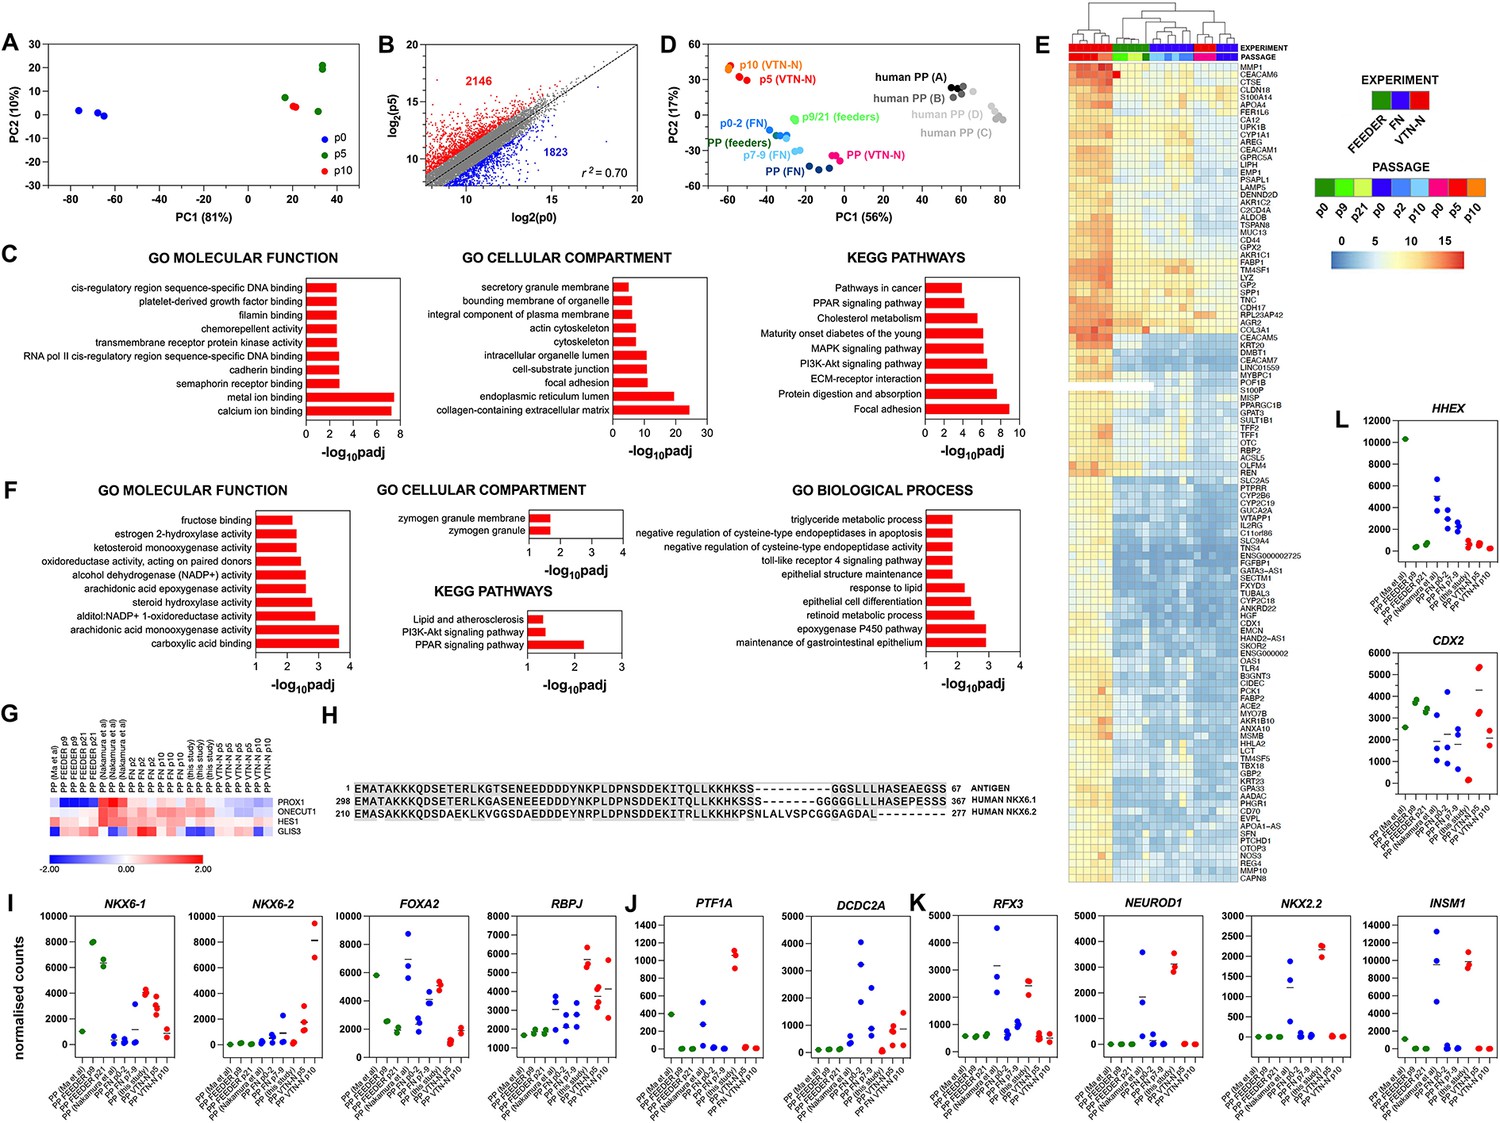
Expansion under C6 stabilizes pancreatic progenitor (PP) cell identity by repressing endocrine differentiation.
(A) Principal component analysis (PCA) of our p0 as well as p5 and p10-expanded PP cells. (B) Correlation analyses of the transcriptome profile of p0 PP cells and p5 expanding PP (ePP) cells. The numbers of upregulated and downregulated genes (normalized counts ≥200 and 0.5 ≥ FC ≥ 2) are shown in red and blue, respectively, and r is the correlation coefficient. (C) Most affected molecular functions, cellular compartments, and Kyoto Encyclopedia of Genes and Genomes (KEGG) pathways between p0 and p10. (D) PCA of feeder ePP cells and their corresponding p0 PP cells (shades of green), fibronectin (FN) ePP cells and their corresponding p0 cells (shades of blue), vitronectin-N (VTN-N) ePP cells and corresponding p0 cells (shades of red), as well as different populations of human fetal pancreas progenitor cells (shades of gray). Darker shades correspond to earlier cells. (E) Heat map of the genes contributing to the difference between our ePP cells (VTN-N expanded) and those of others (feeder or FN expanded), derived using the variance stabilizing transformation (vst). Darker shades of red correspond to stronger upregulation. (F) Most affected molecular functions, cellular compartments, biological processes, and KEGG pathways in genes that separate our ePP cells (VTN-N expanded) from those of others (feeder or FN expanded). (G) Comparative heat map of the expression levels of duct TFs in feeder or FN or VTN-N ePP and their corresponding p0 cells. (H) Alignment of the mouse Nkx6-1 antigen, used to generate the NKX6-1 antibody, with the human NKX6-1 and NKX6-2 sequences. (I–L) Comparative expression levels of progenitor (I), multipotent progenitor cell (MPC) and bipotent (BP) cells (J), endocrine (L), as well as liver and gut (J) markers in normalized RNA-Seq counts. Dots in all graphs represent values from independent experiments. Horizontal lines in the graphs represent the mean value.
Figure 6 with 1 supplement
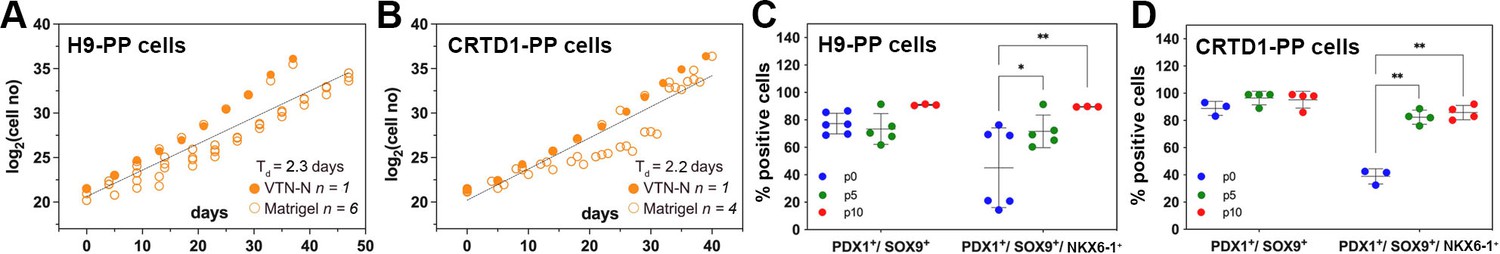
Expansion of H9-derived and CRTD1-derived pancreatic progenitor (PP) cells under C6.
(A, B) Growth curve and regression analysis of the expansion of H9-derived PP cells (A) and CRTD1-derived PP cells (B). (C, D) Flow cytometry analysis for PDX1+/SOX9+ and PDX1+/SOX9+/NKX6.1+ cells during the expansion under C6 of H9-derived PP cells (C) and CRTD1-derived PP cells (D) at p0, p5, and p10. Dots in all graphs represent values from independent experiments. Statistical tests were two-way ANOVA with Tukey’s test using p0 as the control condition for the comparison with *p≤0.033, **p≤0.002, ***p≤0.0002, and ****p≤0.0001.
Figure 6—figure supplement 1
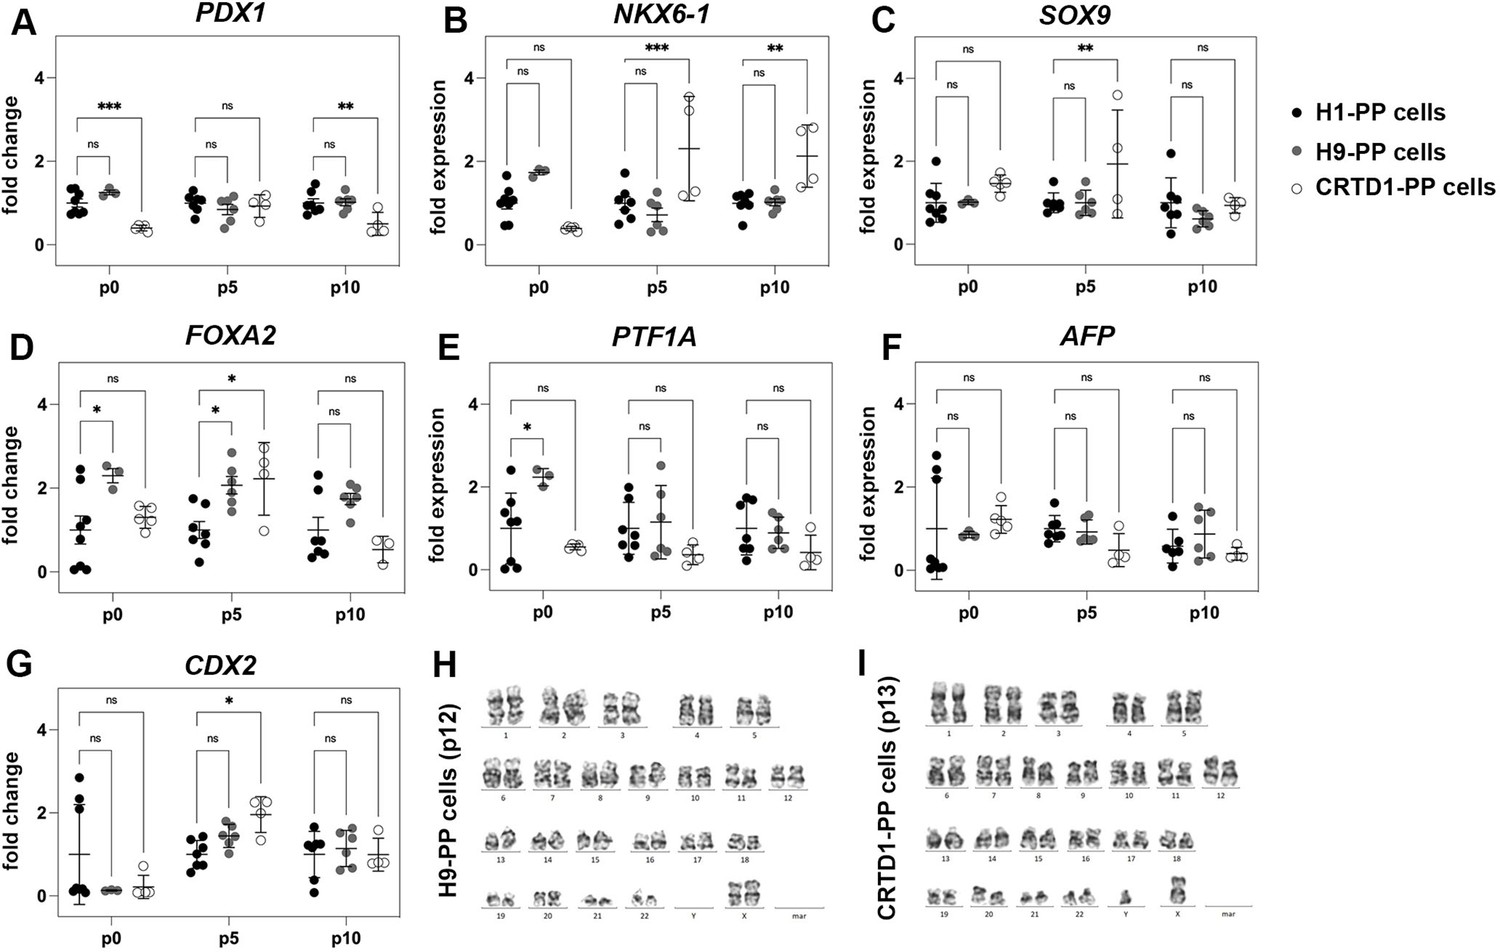
Expansion of H9-derived and CRTD1-derived pancreatic progenitor (PP) cells.
(A–G) Gene expression profile of PP cells derived from H1, H9, and the CRTD1 human pluripotent stem (hPS) cells at p0, p5, and p10 as shown by qPCR for the progenitor markers PDX1 (A), NKX6.1 (B), SOX9 (C), FOXA2 (D), and PTF1A (E), as well as for the liver marker AFP (F) and the gut marker CDX2 (G). Expression levels are normalized against the expression levels of H1-PP cells at the corresponding passages (p0, p5, and p10). (H, I) Karyotyping of C6-expanded H9-PP cells after 12 passages (H) and C6-expanded CRTD1-PP cells after 13 passages (I) showed no chromosomal abnormalities. Dots in all graphs represent values from independent experiments. Statistical tests were two-way ANOVA with Tukey’s test using p0 as the control condition for the comparison with *p≤0.033, **p≤0.002, ***p≤0.0002, and ****p≤0.0001.
Figure 7 with 1 supplement
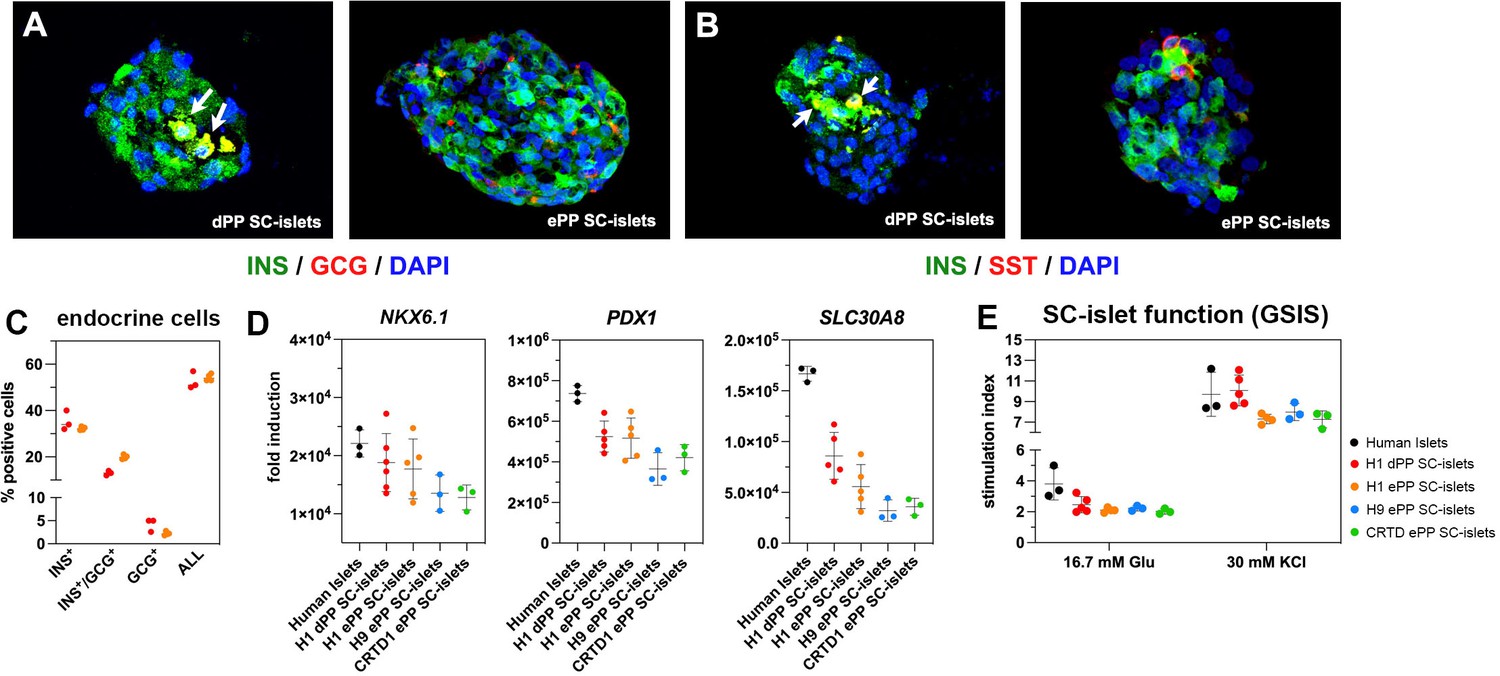
Differentiation of expanding pancreatic progenitor (ePP) cells into SC-islets containing functional β-cells.
(A, B) Immunofluorescence analysis of SC-islets derived from p0 PP cells (dPP) or expanded PP cells for at least 10 passages (ePP) for INS and GCG expression (A) or INS and SST expression (B). (C) Percentages of INS+, INS+/GCG+, as well as GCG+ cells in SC-islets derived from dPP or ePP cells as determined by flow cytometry. (D) Expression levels of NKX6-1, PDX1, and SLC30A8 as determined by qPCR and expressed as fold induction relative to expression levels in human pluripotent stem (hPS) cells. (E) Secretion of C-peptide following sequential stimulation by 16.7 mM glucose and 16.7 mM glucose/30 mM KCl (30 mM KCl) after exposure in basal conditions with 2.8 mM glucose. Stimulation index is the ratio of secretion under these conditions to secretion in basal conditions. Dots in all graphs represent values from independent experiments. Horizontal lines represent the mean ± SD. Statistical tests were two-way ANOVA with Tukey’s test using p0 as the control condition for the comparison with *p≤0.033, **p≤0.002, ***p≤0.0002, and ****p≤0.0001.
Figure 7—figure supplement 1
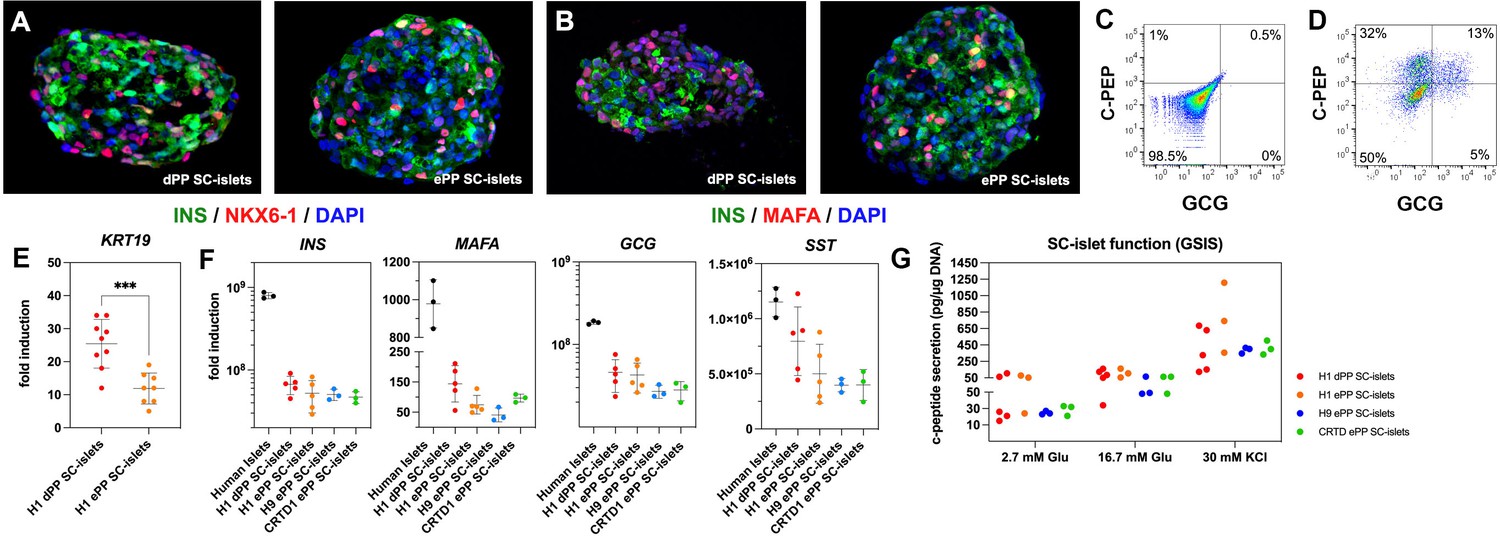
Differentiation of expanding pancreatic progenitor (ePP) cells into SC-islets containing functional β-cells.
(A, B) Immunofluorescence analysis of SC-islets for INS/NKX6-1 expression (A) or INS/MAFA expression (B) derived from p0 PP cells (dPP) or expanded PP cells for at least 10 passages (ePP). (C, D) Representative flow cytometry analysis of SC-islet cells incubated with only secondary antibodies (C) or with both C-PEP and GCG primary and corresponding secondary antibodies (D). (E) KRT19 expression in relation to expression levels in human pluripotent stem (hPS) cells (fold induction) as determined by qPCR in SC-islets derived from H1-derived dPP and ePP cells. (F) Expression levels of INS, GCG, MAFA, and SST in relation to expression levels in hPS cells (fold induction) as determined by qPCR. (G) Normalized secreted C-peptide levels after exposure to basal conditions with 2.8 mM glucose and following sequential stimulation by 16.7 mM glucose and 16.7 mM glucose/30 mM KCl (30 mM KCl). The absolute secreted C-peptide levels were normalized against cell numbers (DNA content). Dots in all graphs represent values from independent experiments. Horizontal lines represent the mean ± SD. Statistical tests were two-way ANOVA with Tukey’s test using p0 as the control condition for the comparison with *p≤0.033, **p≤0.002, ***p≤0.0002, and ****p≤0.0001.
Author response image 1

Author response image 2

Additional files
-
Supplementary file 1
Tables.
(a) Expansion conditions tested and corresponding doubling times. ND; not determined. (b) Regulated genes in CINI expansion. In group 1, there are genes continuously upregulated in p5 and p10, in group 2 genes upregulated at p5 but stable at p10, in group 3 genes downregulated at p5 but stable in p10, and in group 4 genes continuously downregulated. (c) Gene regulation of components of selected signaling pathways during expansion in CINI. (d) Basal media and supplements for S1–S7. (e) Normalized RNA-Seq counts of selected genes from feeder-expanded cells, fibronectin-expanded cells, and vitronectin-N-expanded cells. (f) List of primary antibodies for immunofluorescense (IF) and flow cytometry (FC).
- https://cdn.elifesciences.org/articles/89962/elife-89962-supp1-v1.xlsx
-
MDAR checklist
- https://cdn.elifesciences.org/articles/89962/elife-89962-mdarchecklist1-v1.docx
Download links
A two-part list of links to download the article, or parts of the article, in various formats.
Downloads (link to download the article as PDF)
Open citations (links to open the citations from this article in various online reference manager services)
Cite this article (links to download the citations from this article in formats compatible with various reference manager tools)
Regulation of multiple signaling pathways promotes the consistent expansion of human pancreatic progenitors in defined conditions
eLife 12:RP89962.
https://doi.org/10.7554/eLife.89962.3


