The molecular mechanism and evolutionary divergence of caspase 3/7-regulated gasdermin E activation
- CAS and Shandong Province Key Laboratory of Experimental Marine Biology, Institute of Oceanology; CAS Center for Ocean Mega-Science, Chinese Academy of Sciences, China
- Laboratory for Marine Biology and Biotechnology, Qingdao Marine Science and Technology Center, China
- College of Marine Sciences, University of Chinese Academy of Sciences, China
Figures
Figure 1 with 3 supplements
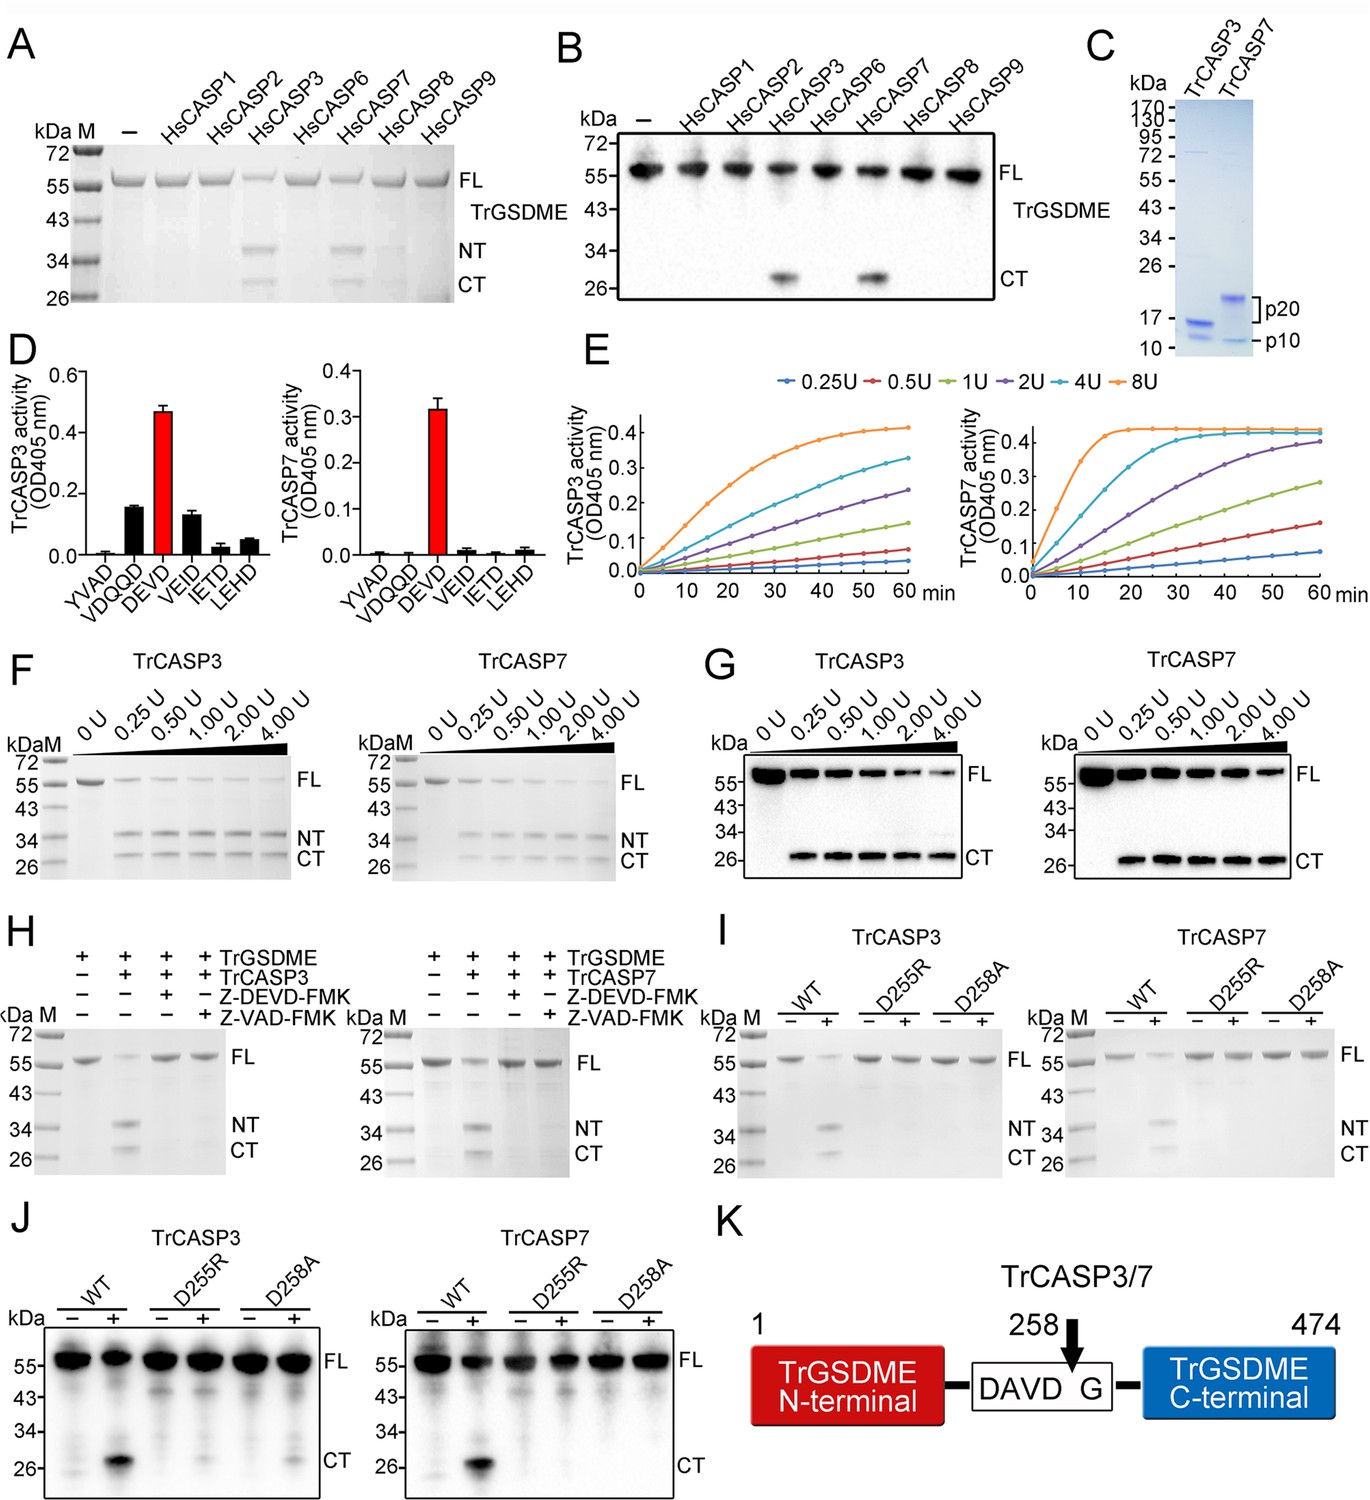
Cleavage of TrGSDME by caspases.
(A, B) TrGSDME was treated with 1 U of different HsCASPs for 2 hr and then subjected to SDS-PAGE (A) and immunoblotting (B). (C) SDS-PAGE analysis of purified TrCASP3/7. The p10 and p20 subunits are indicated. (D) TrCASP3/7 cleavage of different colorimetric CASP substrates was monitored by measuring released ρNA. n=3. The values are the means ± SD of three replicates. (E) TrCASP3/7 (0.25–8 U) were incubated with Ac-DEVD-ρNA, and time-dependent release of ρNA was measured. (F, G) SDS-PAGE (F) and immunoblotting (G) analysis of TrGSDME cleavage by TrCASP3/7 (0.25–4 U). (H) TrGSDME cleavage by TrCASP3/7 was determined in the presence or absence of 20 μM Z-DEVD-FMK or Z-VAD-FMK. (I, J) TrGSDME wild type (WT) and mutants (D255R or D258A) were incubated with TrCASP3/7 for 2 hr, and the cleavage was determined by SDS-PAGE (I) and immunoblotting (J). (K) A schematic of TrGSDME cleavage by TrCASP3/7. The arrow indicates cleavage site. For all panels, FL, full length; NT, N-terminal fragment; CT, C-terminal fragment.
-
Figure 1—source data 1
Original file for the western blot or SDS-PAGE analysis in Figure 1.
- https://cdn.elifesciences.org/articles/89974/elife-89974-fig1-data1-v1.zip
-
Figure 1—source data 2
File containing Figure 1A–C and F–J and original scans of the relevant western blot or SDS-PAGE analysis with highlighted bands.
- https://cdn.elifesciences.org/articles/89974/elife-89974-fig1-data2-v1.zip
-
Figure 1—source data 3
Numerical data from all bar graphs shown in Figure 1.
- https://cdn.elifesciences.org/articles/89974/elife-89974-fig1-data3-v1.zip
Figure 1—figure supplement 1

Phylogenetic analysis of the TrGSDME used in this study.
The phylogenetic tree was constructed using 15 fish GSDMEa (red) and 51 fish GSDMEb (blue) collected from the NCBI databank. The TrGSDME used in this study is indicated by a red star.
Figure 1—figure supplement 2

Cleavage of TrGSDME mutants by HsCASP3/7.
TrGSDME wild type (WT) and mutants (D255R and D258A) were treated with or without (-) HsCASP3/7 for 2 hr, and the cleavage was determined by immunoblotting with anti-His antibody. FL, full length; CT, cleaved C-terminal region.
-
Figure 1—figure supplement 2—source data 1
Original file for the western blot analysis in Figure 1—figure supplement 2.
- https://cdn.elifesciences.org/articles/89974/elife-89974-fig1-figsupp2-data1-v1.zip
-
Figure 1—figure supplement 2—source data 2
File containing Figure 1—figure supplement 2 and original scans of the relevant western blot analysis with highlighted bands.
- https://cdn.elifesciences.org/articles/89974/elife-89974-fig1-figsupp2-data2-v1.zip
Figure 1—video 1
TrGSDME-NT induces pyroptosis of HEK293T cells.
HEK293T cells were transfected with the vector expressing mCherry-tagged TrGSDME-NT, and time-lapse images of the cells were recorded with a confocal microscope.
Figure 2 with 3 supplements
The pyroptotic activity of TrGSDME.
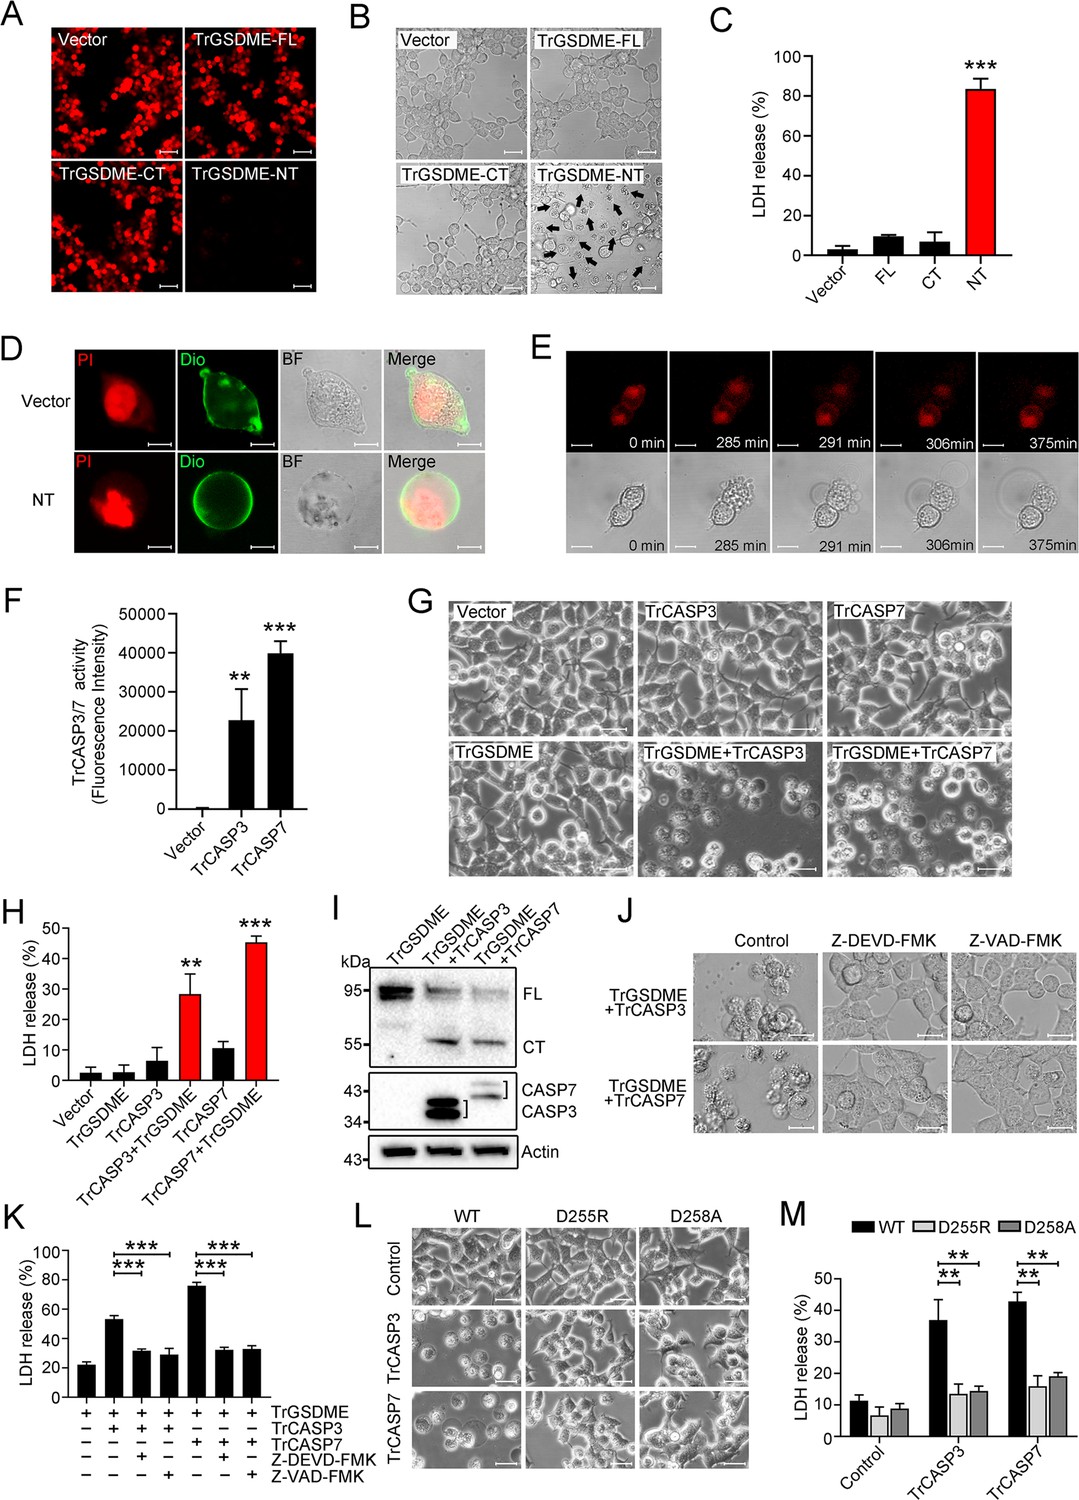
(A–C) HEK293T cells were transfected with C-terminally mCherry-tagged TrGSDME FL or truncate (NT or CT) for 24 hr, and then analyzed for TrGSDME expression (A), morphological change (B), and lactate dehydrogenase (LDH) release (C). Scale bars, 50 μm (A) and 20 μm (B). (D) HEK293T cells were transfected with the backbone vector or vector expressing Myc-tagged TrGSDME-NT for 24 hr. The cell nuclei and membrane were stained with propidium iodide (PI) and DiO, respectively. Scale bar, 10 μm. (E) HEK293T cells were transfected with mCherry-tagged TrGSDME-NT for 16 hr, and the progression of cell death was shown by time-lapse microscopic imaging. Scale bar, 10 μm. (F) HEK293T cells were transfected with TrCASP3/7 for 24 hr, and the proteolytic activity of TrCASP3/7 was assessed by treatment with fluorogenic Ac-DEVD-AFC. (G) Phase-contrast images of HEK293T cells transfected with the indicated vectors for 24 hr. Scale bar, 20 μm. (H, I) LDH release (H) and TrGSDME cleavage and TrCASP3/7 expression (I) in the above transfected cells were determined. For panel (I), FL, full-length; CT, C-terminal fragment. (J, K) HEK293T cells co-expressing TrGSDME and TrCASP3/7 for 24 hr in the presence or absence (control) of 10 μM Z-VAD-FMK or Z-DEVD-FMK were subjected to microscopy (J) and LDH measurement (K). Scale bar, 20 μm. (L, M) HEK293T cells expressing TrCASP3/7 plus TrGSDME or TrCASP3/7 plus the D255R/D258A mutant were subjected to microscopy (L) and LDH measurement (M). Scale bar, 20 μm. For panels (C, F, H, K, M), values are the means of three experimental replicates and shown as means ± SD. n=3. **p<0.01, ***p<0.001.
-
Figure 2—source data 1
Original file for the western blot analysis in Figure 2.
- https://cdn.elifesciences.org/articles/89974/elife-89974-fig2-data1-v1.zip
-
Figure 2—source data 2
File containing Figure 2I and original scans of the relevant western blot analysis with highlighted bands.
- https://cdn.elifesciences.org/articles/89974/elife-89974-fig2-data2-v1.zip
-
Figure 2—source data 3
Numerical data from all bar graphs shown in Figure 2.
- https://cdn.elifesciences.org/articles/89974/elife-89974-fig2-data3-v1.zip
Figure 2—figure supplement 1
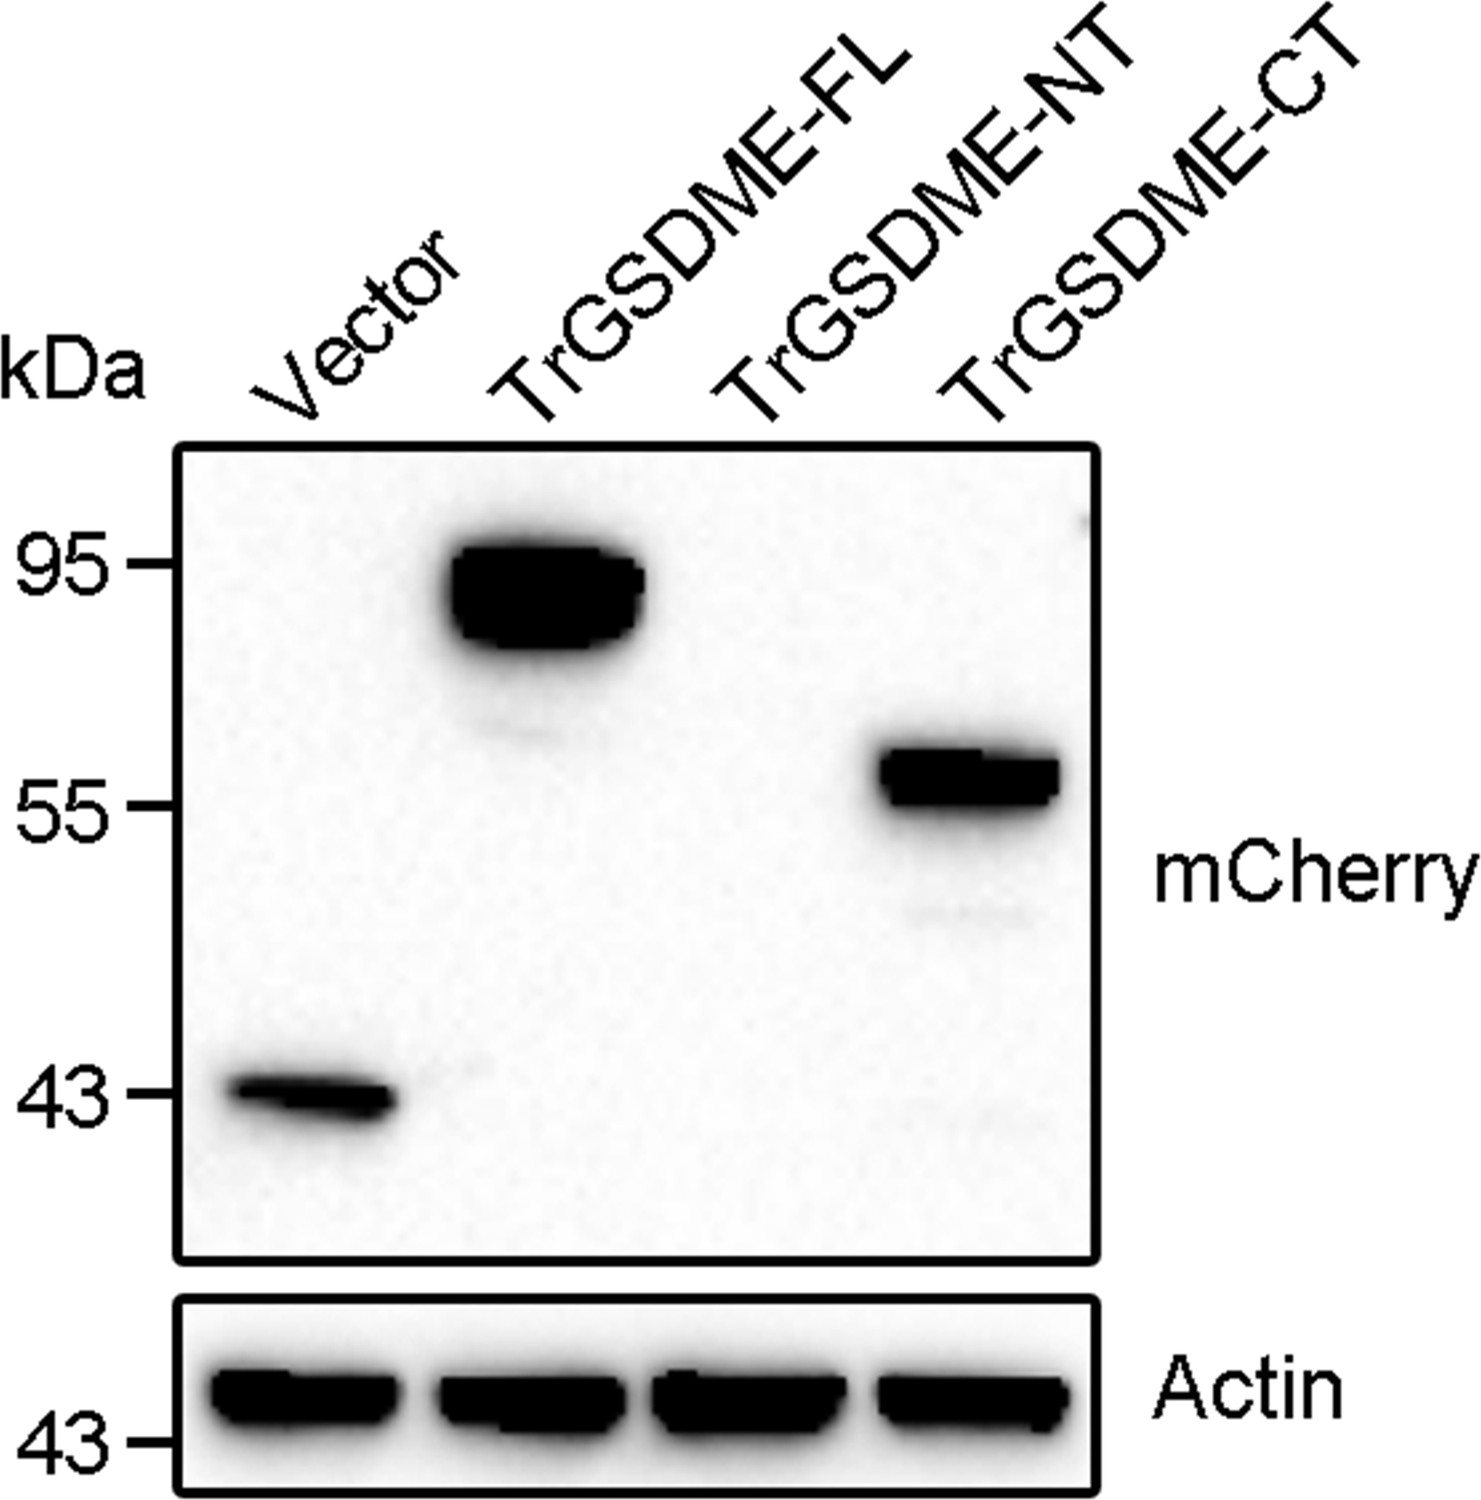
Ectopic expression of TrGSDME-FL and truncates.
HEK293T cells were transfected with the backbone vector or the vector expressing mCherry-tagged TrGSDME full length (FL) or truncates (NT or CT) for 24 h. The cell lysate was then immunoblotted with antibody against mCherry or β-actin.
-
Figure 2—figure supplement 1—source data 1
Original file for the western blot analysis in Figure 2—figure supplement 1.
- https://cdn.elifesciences.org/articles/89974/elife-89974-fig2-figsupp1-data1-v1.zip
-
Figure 2—figure supplement 1—source data 2
File containing Figure 2—figure supplement 1 and original scans of the relevant western blot analysis with highlighted bands.
- https://cdn.elifesciences.org/articles/89974/elife-89974-fig2-figsupp1-data2-v1.zip
Figure 2—figure supplement 2
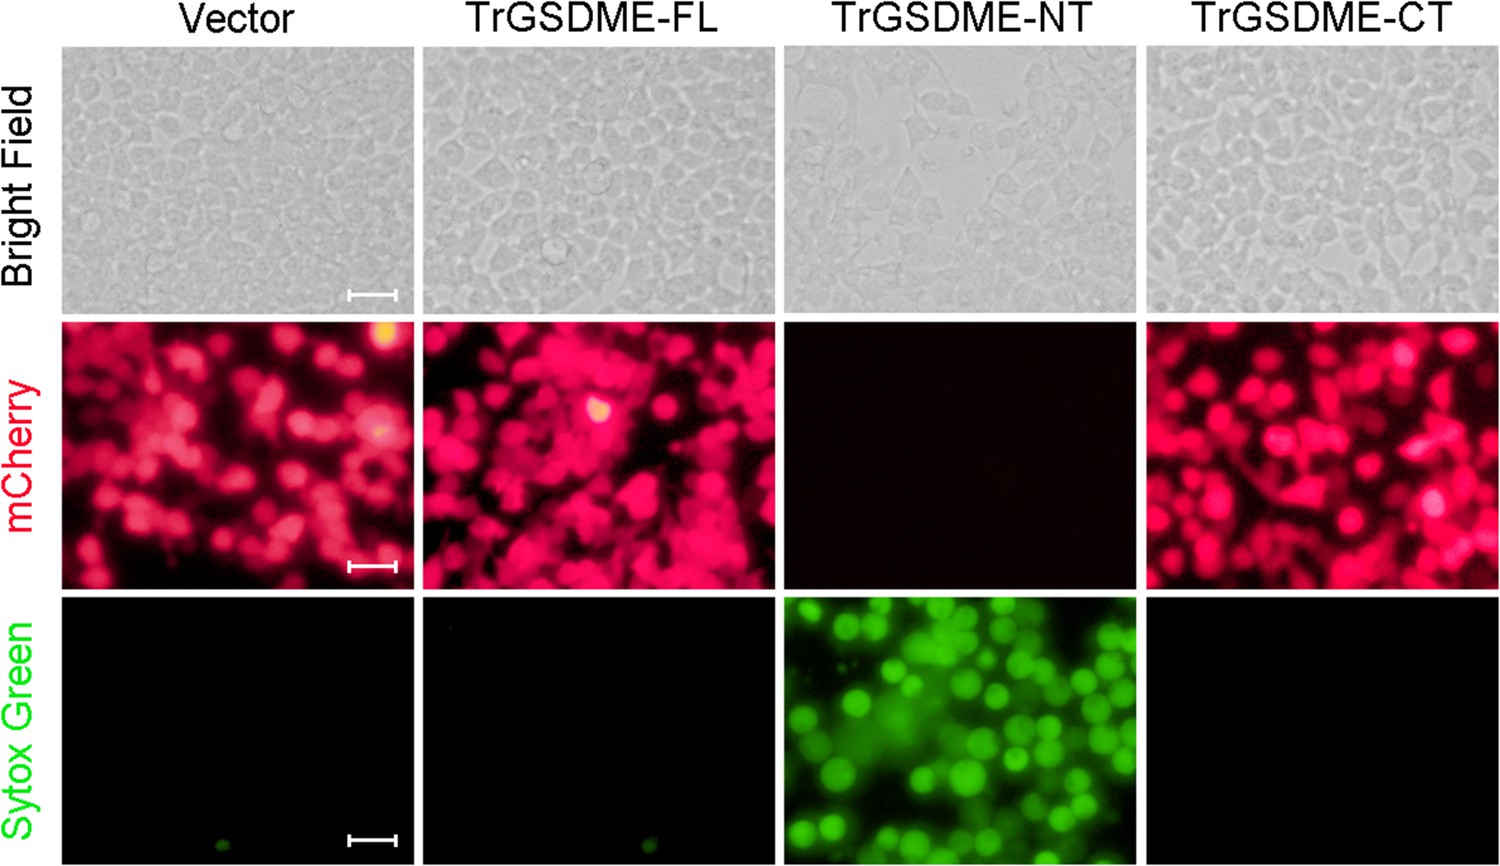
The cell death-inducing ability of TrGSDME-FL and truncates.
HEK293T cells were transfected with the backbone vector or the vector expressing mCherry-tagged TrGSDME full length (FL) or truncate (NT or CT) for 24 hr. The cells were then stained with Sytox Green and examined with a microscope. Scale bar, 30 μm.
Figure 2—figure supplement 3

Activation of TrGSDME-mediated pyroptosis by TrCASP3/7.
(A) HEK293T cells were transfected with the backbone vector or the vector expressing the indicated protein for 24 hr and then stained with Sytox Green. Scale bars, 30 μm. (B, C) HEK293T cells expressing wild type (WT) or mutant TrGSDME together with or without (control) TrCASP3 or TrCASP7 were subjected to Sytox Green staining (B) and TrGSDME cleavage analysis by immunoblot with antibodies against mCherry (upper), Myc (middle), and actin (lower) (C). Scale bar, 30 μm.
-
Figure 2—figure supplement 3—source data 1
Original file for the western blot analysis in Figure 2—figure supplement 3.
- https://cdn.elifesciences.org/articles/89974/elife-89974-fig2-figsupp3-data1-v1.zip
-
Figure 2—figure supplement 3—source data 2
File containing Figure 2—figure supplement 3C and original scans of the relevant western blot analysis with highlighted bands.
- https://cdn.elifesciences.org/articles/89974/elife-89974-fig2-figsupp3-data2-v1.zip
Figure 3 with 2 supplements

GSDME-CT domain determines the recognition by CASP7.
(A) HsGSDME was treated with 1 U of various HsCASPs for 2 hr, and the products were analyzed by immunoblotting with anti-HsGSDME-CT antibody. (B) HsCASP3/7 and TrCASP3/7 were incubated with Ac-DAVD-ρNA or Ac-DMPD-ρNA at 37°C for 30 min, and the proteolytic activity was determined. n=3. Data are expressed as the means ± SD of three replicates. (C) Structure analysis of the linker region from HsGSDME and TrGSDME with moue GSDMA3 (PDB:5b5r) as the template. Two regions that may form α-helix and loop are indicated. (D) HsGSDME wild type (WT) and mutants (Δ261–266 and Δ281–296) were treated with or without 1 U of HsCASP3/7 for 2 hr, and the cleaved fragments were subjected to immunoblotting with anti-HsGSDME-CT antibody. (E) Schematics of the chimeric GSDME constructs. (F–I) TrGSDME (F), HsNT-TrCT (G), HsGSDME (H), and TrNT-HsCT (I) were incubated with 1 U of TrCASP3/7 or HsCASP3/7 for 2 hr, and the cleavage was determined by immunoblotting with anti-TrGSDME or anti-HsGSDME-CT antibodies. For panels (A, D, F–I): FL, full length; NT, N-terminal fragment; CT, C-terminal fragment.
-
Figure 3—source data 1
Original file for the western blot analysis in Figure 3.
- https://cdn.elifesciences.org/articles/89974/elife-89974-fig3-data1-v1.zip
-
Figure 3—source data 2
File containing Figure 3A, D–F, and I and original scans of the relevant western blot analysis with highlighted bands.
- https://cdn.elifesciences.org/articles/89974/elife-89974-fig3-data2-v1.zip
-
Figure 3—source data 3
Numerical data from the bar graph shown in Figure 3.
- https://cdn.elifesciences.org/articles/89974/elife-89974-fig3-data3-v1.zip
Figure 3—figure supplement 1

Cleavage of HsGSDME by caspases.
Recombinant HsGSDME was incubated with or without (-) HsCASP1, 2, 3, 6, 7, 8, and 9 for 2 hr, and the cleavage was determined by SDS-PAGE. M, molecular markers. FL, full length; NT, N-terminal fragment; CT, C-terminal fragment.
-
Figure 3—figure supplement 1—source data 1
Original file for the SDS-PAGE analysis in Figure 3—figure supplement 1.
- https://cdn.elifesciences.org/articles/89974/elife-89974-fig3-figsupp1-data1-v1.zip
-
Figure 3—figure supplement 1—source data 2
File containing Figure 3—figure supplement 1 and original scans of the relevant SDS-PAGE analysis with highlighted bands.
- https://cdn.elifesciences.org/articles/89974/elife-89974-fig3-figsupp1-data2-v1.zip
Figure 3—figure supplement 2

Proteolytic activity of TrCASP1.
TrCASP1 was incubated with colorimetric Ac-YVAD-ρNA, Ac-DAVD-ρNA, and Ac-DMPD-ρNA for 1 hr, and the cleavage was determined by measuring the release of ρNA. n=3. Values are the means of triplicate experiments and shown as means ± SD.
-
Figure 3—figure supplement 2—source data 1
Numerical data from the bar graph shown in Figure 3—figure supplement 2.
- https://cdn.elifesciences.org/articles/89974/elife-89974-fig3-figsupp2-data1-v1.zip
Figure 4 with 1 supplement
The p10 subunit of CASP7 is essential for discrimination on GSDME.
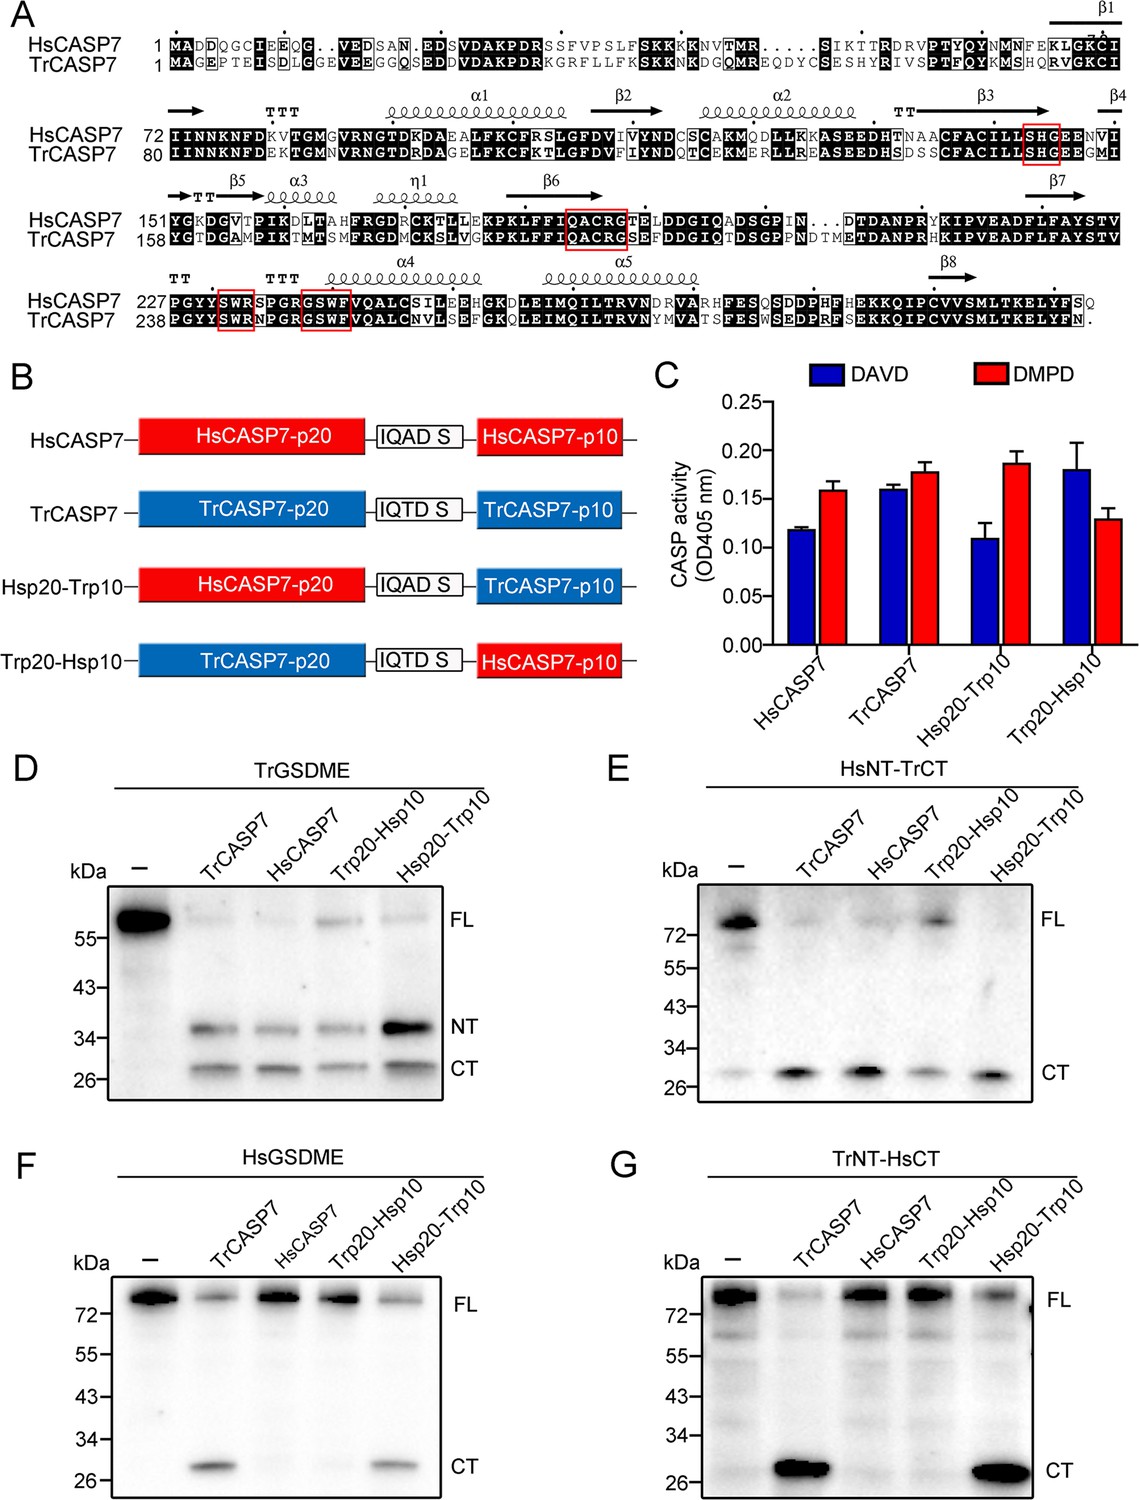
(A) Sequence alignment of HsCASP7 and TrCASP7 with HsCASP7 (PDB:1K86) as the template. α-helices and β-strands are indicated. The motifs involved in catalytic reaction (SHG and QACRG) and substrate binding (SWR and GSWF) are boxed in red. (B) Schematics of CASP7 chimeras. (C) The proteolytic activities of TrCASP7, HsCASP7, and their chimeras were determined by cleaving Ac-DAVD-ρNA and Ac-DMPD-ρNA. n=3. Data are expressed as the means ± SD of three replicates. (D–G) TrGSDME (D), HsNT-TrCT (E), HsGSDME (F), or TrNT-HsCT (G) were incubated with TrCASP7, HsCASP7 and their chimeras for 2 hr. The products were assessed by immunoblotting with anti-TrGSDME or anti-HsGSDME-CT antibodies. For panels (D–G): FL, full length; NT, N-terminal fragment; CT, C-terminal fragment.
-
Figure 4—source data 1
Original file for the western blot analysis in Figure 4.
- https://cdn.elifesciences.org/articles/89974/elife-89974-fig4-data1-v1.zip
-
Figure 4—source data 2
File containing Figure 4D–G and original scans of the relevant western blot analysis with highlighted bands.
- https://cdn.elifesciences.org/articles/89974/elife-89974-fig4-data2-v1.zip
-
Figure 4—source data 3
Numerical data from the bar graph shown in Figure 4.
- https://cdn.elifesciences.org/articles/89974/elife-89974-fig4-data3-v1.zip
Figure 4—figure supplement 1

Preparation of recombinant proteins.
(A) SDS-PAGE analysis of purified Hsp20-Trp10 and Trp20-Hsp10. (B, C) Purified TrCASP7 (B) and HsCASP7 (C) were subjected to SDS-PAGE (upper panel) and immunoblotting with anti-His tag antibody (lower panel). (D) HsCASP3 and its mutant (N208S) were analyzed by SDS-PAGE. (E) SDS-PAGE analysis of purified MmCASP7 and its mutant (N234S). In all panels, the p10 and p20 subunits are indicated.
-
Figure 4—figure supplement 1—source data 1
Original file for the western blot or SDS-PAGE analysis in Figure 4—figure supplement 1.
- https://cdn.elifesciences.org/articles/89974/elife-89974-fig4-figsupp1-data1-v1.zip
-
Figure 4—figure supplement 1—source data 2
File containing Figure 4—figure supplement 1A–E and original scans of the relevant western blot or SDS-PAGE analysis with highlighted bands.
- https://cdn.elifesciences.org/articles/89974/elife-89974-fig4-figsupp1-data2-v1.zip
Figure 5 with 3 supplements
Functional importance of the non-conserved residues in the p10 of HsCASP7 and TrCASP7.
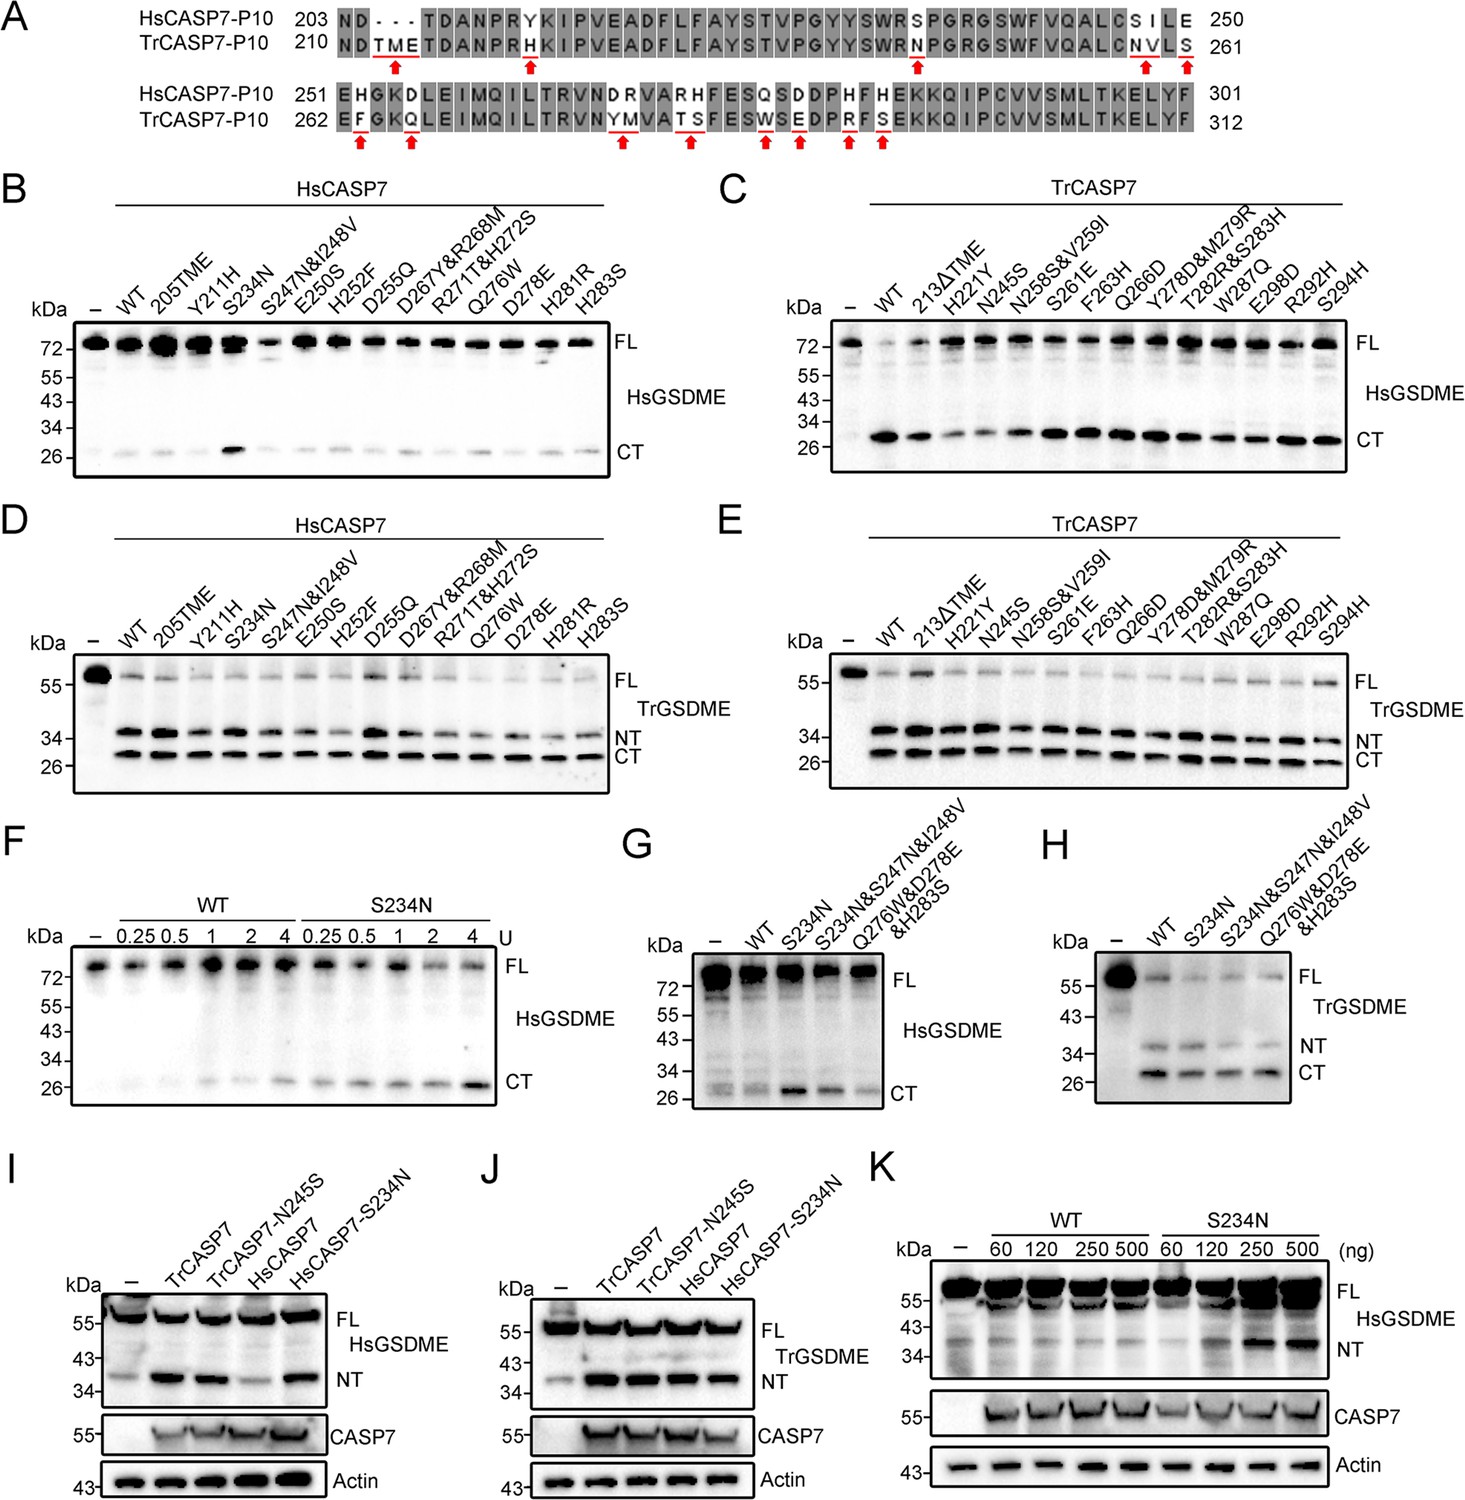
(A) Sequence alignment of the p10 region in HsCASP7 and TrCASP7. The arrows indicate non-conserved residues. (B, C) HsGSDME was treated with wild type (WT) or mutant HsCASP7 (B) or TrCASP7 (C) for 2 hr. The cleavage was determined by immunoblotting with anti-HsGSDME-CT antibody. 205TME, HsCASP7 with TME insertion at position 205; 213ΔTME, TrCASP7 with TME deleted at position 213. (D, E) TrGSDME was incubated with wild type (WT) or mutant HsCASP7 (D) or TrCASP7 (E) for 2 hr. The cleavage was determined by immunoblotting with anti-TrGSDME antibody. (F) HsGSDME was incubated with HsCASP7 or the S234N mutant (0.25–4 U) for 2 hr. HsGSDME cleavage was analyzed as above. (G, H) HsGSDME (G) and TrGSDME (H) were treated with wild type or mutant HsCASP7 for 2 hr. The cleavage was determined as above. (I, J) TrGSDME (I) or HsGSDME (J) was co-expressed with wild type or mutant TrCASP7/HsCASP7 for 24 hr. GSDME cleavage, CASP7, and β-actin were determined as above. (K) HsGSDME was co-expressed with HsCASP7 or HsCASP7-S234N for 48 hr. Cleavage of GSDME was detected as above. For panels (B–K): FL, full length; NT, N-terminal fragment; CT, C-terminal fragment.
-
Figure 5—source data 1
Original file for the western blot analysis in Figure 5.
- https://cdn.elifesciences.org/articles/89974/elife-89974-fig5-data1-v1.zip
-
Figure 5—source data 2
File containing Figure 5B–K and original scans of the relevant western blot analysis with highlighted bands.
- https://cdn.elifesciences.org/articles/89974/elife-89974-fig5-data2-v1.zip
Figure 5—figure supplement 1
Cleavage of poly (ADP-ribose) polymerase 1 (PARP1) and gelsolin by HsCASP7.
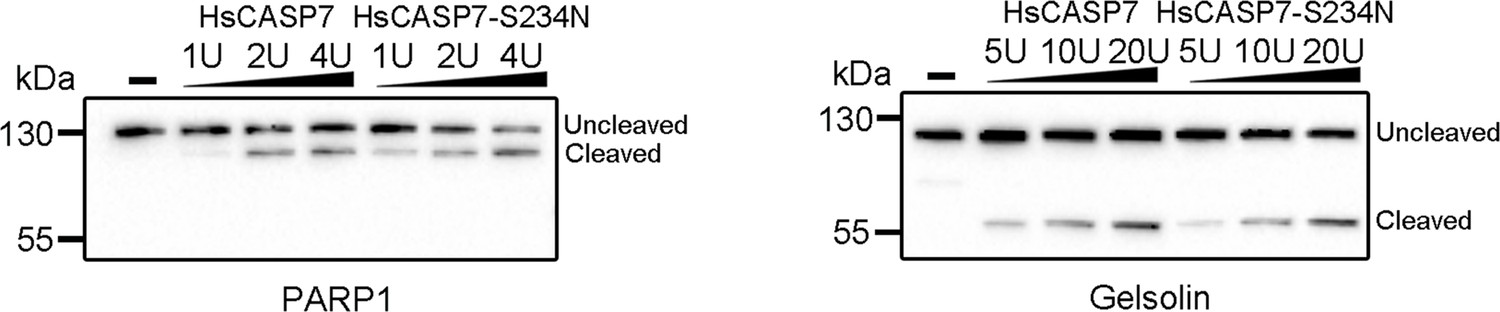
HEK293T cells were transfected with C-terminal Flag-tagged PARP1 (left panel) or gelsolin (right panel) for 24 hr. The cell lysates were incubated with or without (-) different units of HsCASP7 and HsCASP7-S234N for 2 hr and then subjected to immunoblotting with anti-Flag antibody.
-
Figure 5—figure supplement 1—source data 1
Original file for the western blot analysis in Figure 5—figure supplement 1.
- https://cdn.elifesciences.org/articles/89974/elife-89974-fig5-figsupp1-data1-v1.zip
-
Figure 5—figure supplement 1—source data 2
File containing Figure 5—figure supplement 1 and original scans of the relevant western blot analysis with highlighted bands.
- https://cdn.elifesciences.org/articles/89974/elife-89974-fig5-figsupp1-data2-v1.zip
Figure 5—figure supplement 2
Structural analysis of HsCASP1/4/7.
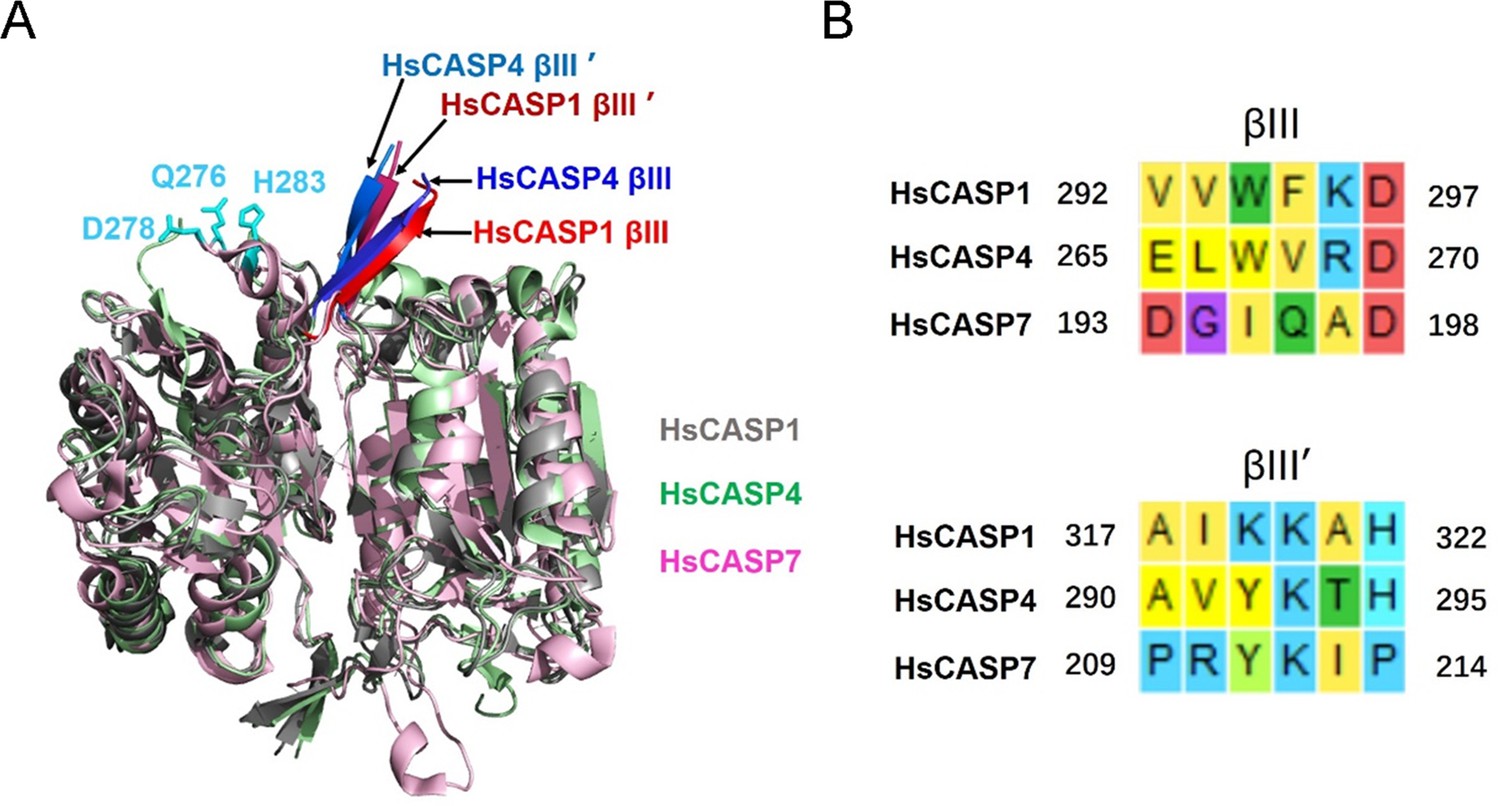
(A) The structures of HsCASP1 (PDB: 6kn0, gray), HsCASP4 (PDB: 6kmz, green), and HsCASP7 (PDB: 6kn0, purple) are superimposed. The βIII/βIII’ sheets of HsCASP1/4 are indicated by arrows; the residues Q276, D278, and H283 of HsCASP7 are shown in cyan. (B) The sequence alignment of HsCASP1/4 βIII/βIII’ sheet with the corresponding region of HsCASP7.
Figure 5—figure supplement 3

GSDME cleavage by CASP7 in cellular system.
TrGSDME (A) or HsGSDME (B) was co-expressed with different doses of TrCASP7/HsCASP7 for 48 hr in HEK293T cells. The expression/cleavage of TrGSDME/HsGSDME and the expression of TrCASP7/HsCASP7 were determined by immunoblotting. β-actin was used as a loading control.
-
Figure 5—figure supplement 3—source data 1
Original file for the western blot analysis in Figure 5—figure supplement 3.
- https://cdn.elifesciences.org/articles/89974/elife-89974-fig5-figsupp3-data1-v1.zip
-
Figure 5—figure supplement 3—source data 2
File containing Figure 5—figure supplement 3 and original scans of the relevant western blot analysis with highlighted bands.
- https://cdn.elifesciences.org/articles/89974/elife-89974-fig5-figsupp3-data2-v1.zip
Figure 6 with 2 supplements
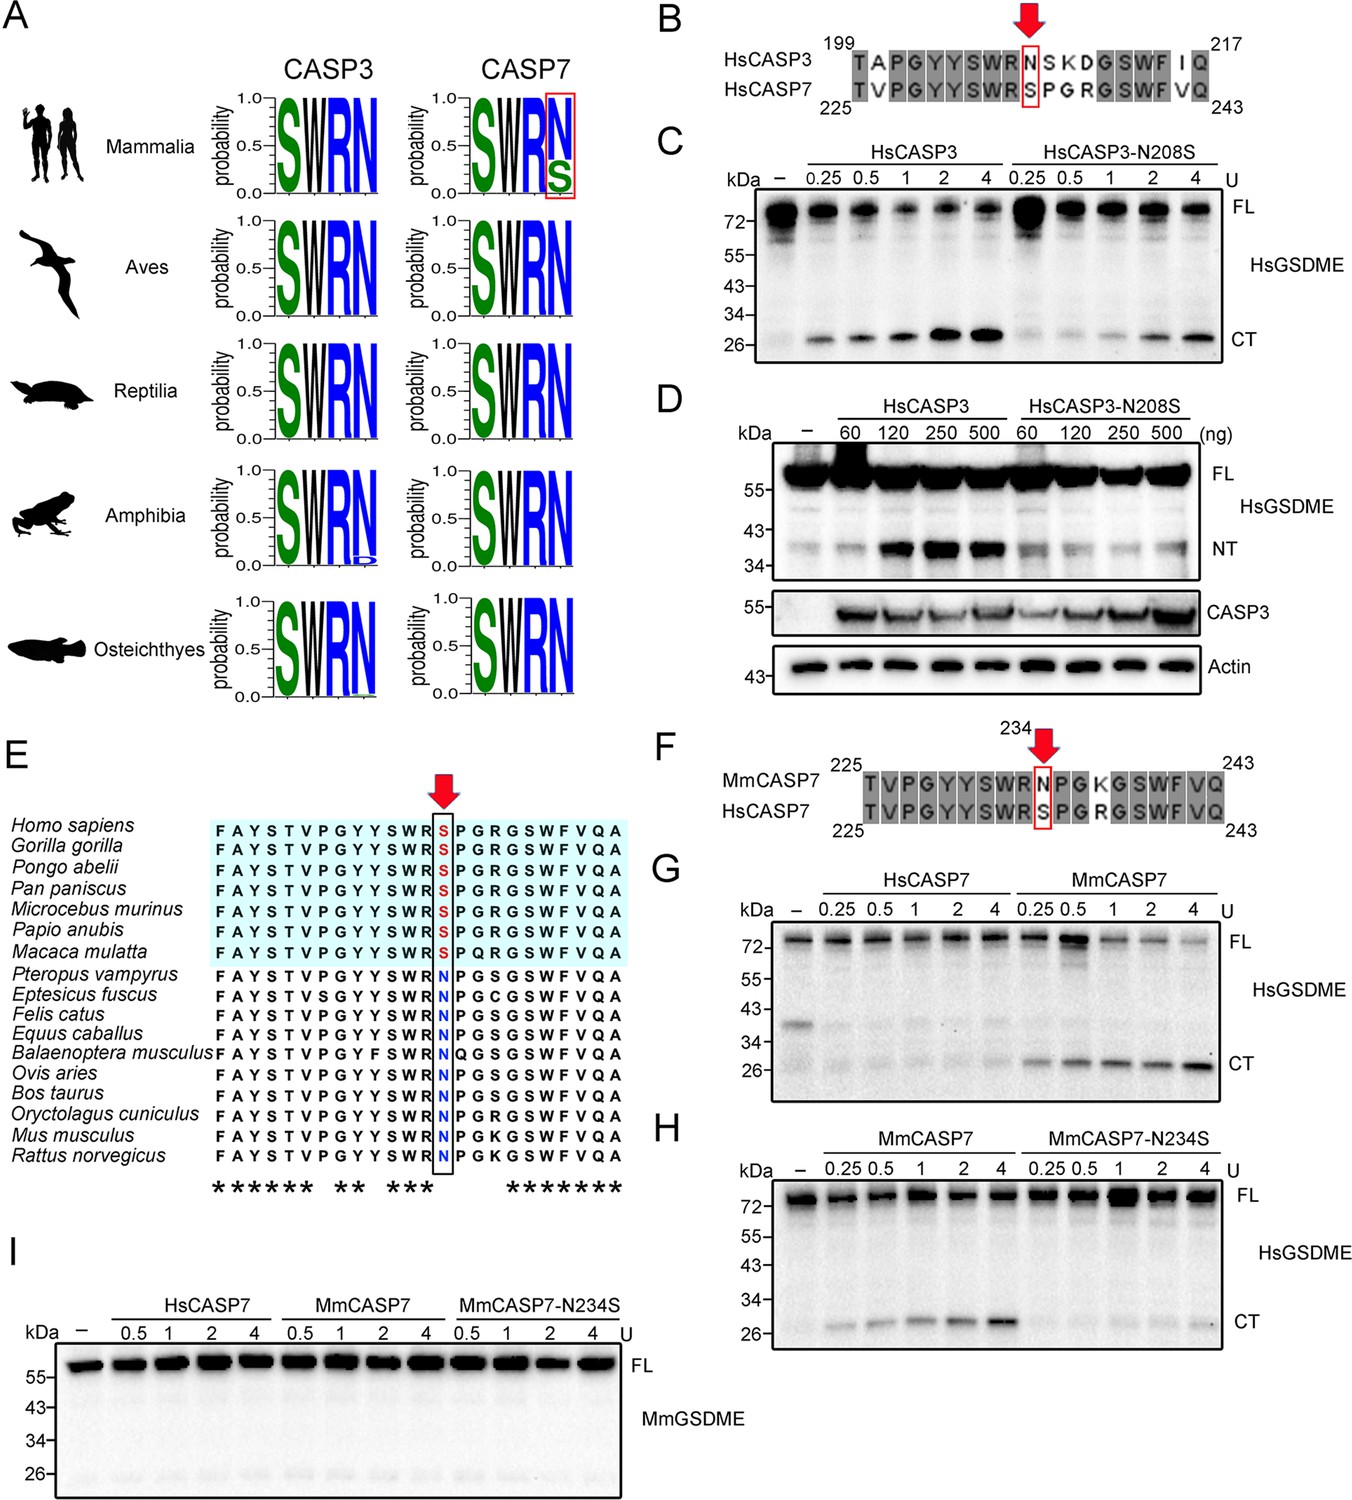
Conservation and functional importance of S/N234 in CASP3/7.
(A) Weblogo analysis of the conservation of S/N234 in CASP3/7 in Mammalia, Aves, Reptilia, Amphibia, and Osteichthyes. (B) Sequence alignment of HsCASP3/7. The S/N residues are indicated by red arrow. (C) HsGSDME was treated with HsCASP3 or HsCASP3-N208S for 2 hr, and then subjected to immunoblotting with anti-HsGSDME-CT antibody. (D) HsGSDME was co-expressed in HEK293T cells with different doses of HsCASP3 or HsCASP3-N208S for 24 hr. The cell lysates were immunoblotted to detect HsGSDME, CASP3, and β-actin. (E) Sequence alignment of the S/N234 region in the CASP7 of primate (shaded cyan) and non-primate mammals. The S/N residues are indicated by red arrow. Asterisks indicate identical residues. (F) Alignment of human and mouse CASP7 sequences. The S/N234 residues are indicated by arrow. (G) HsGSDME was treated with different units of HsCASP7 or MmCASP7 for 2 hr, and the cleavage was assessed by immunoblotting with anti-HsGSDME-CT antibody. (H) HsGSDME was incubated with different units of MmCASP7 or its mutant (N234S) for 2 hr, and HsGSDME cleavage was analyzed as above. (I) MmCASP7 was treated with HsCASP7, MmCASP7, or MmCASP7-N234S for 2 hr. The cleavage was determined by immunoblotting with anti-MmGSDME-NT antibody. For panels (C, D, G–I), FL, full length; NT, N-terminal fragment; CT, C-terminal fragment.
-
Figure 6—source data 1
Original file for the western blot analysis in Figure 6.
- https://cdn.elifesciences.org/articles/89974/elife-89974-fig6-data1-v1.zip
-
Figure 6—source data 2
File containing Figure 6C, D–G, and I and original scans of the relevant western blot analysis with highlighted bands.
- https://cdn.elifesciences.org/articles/89974/elife-89974-fig6-data2-v1.zip
Figure 6—figure supplement 1

Conservation of S/N234 in mammalian CASP7.
The four conserved amino acids are shown in LOGOs, with height representing the relative proportion of the corresponding amino acid at that position. The S/N234 is presented as the fourth LOGO and indicated with a red star.
Figure 6—figure supplement 2

The cleavage of MmGSDME by MmCASP3.
(A) SDS-PAGE analysis of purified MmCASP3. (B) MmGSDME was treated with 1 U of MmCASP3 for 2 hr and then subjected to SDS-PAGE.
-
Figure 6—figure supplement 2—source data 1
Original file for the SDS-PAGE analysis in Figure 6—figure supplement 2.
- https://cdn.elifesciences.org/articles/89974/elife-89974-fig6-figsupp2-data1-v1.zip
-
Figure 6—figure supplement 2—source data 2
File containing Figure 6—figure supplement 2 and original scans of the relevant SDS-PAGE analysis with highlighted bands.
- https://cdn.elifesciences.org/articles/89974/elife-89974-fig6-figsupp2-data2-v1.zip
Author response image 1
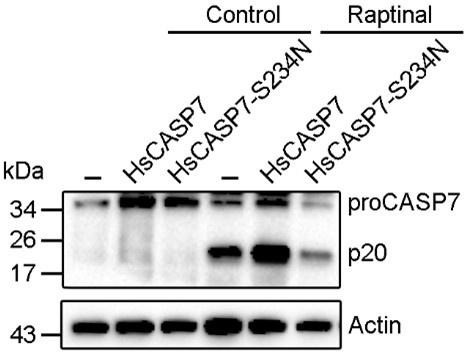
HsCASP7 activation by raptinal.
HEK293T cells were transfected with the empty vector (-), or the vector expressing HsCASP7 or HsCASP7-S234N for 24 h. The cells were then treated with or without (control) 5 μM raptinal for 4 h. The cells were lysed, and the lysates were blotted with anti-CASP7 antibody.
Author response image 2

The three-dimensional structure model of HsGSDME.
(A) The structure of HsGSDME was modeled by using mouse GSDMA3 (MmGSDMA3) as the template. The N-terminal domain (1-246 aa) and the C-terminal domain (279-468 aa) of HsGSDME are shown in red and blue, respectively. (B) The superposed structure of HsGSDME (cyan) and MmGSDMA3 (purple).
Author response image 3
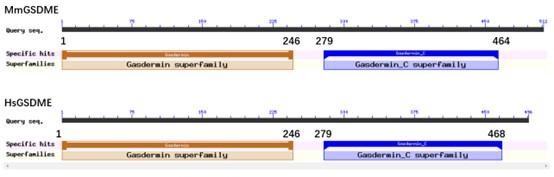
Conserved domain analysis of mouse (upper) and human (lower) GSDME.
Tables
Key resources table
| Reagent type (species) or resource | Designation | Source or reference | Identifiers | Additional information |
|---|---|---|---|---|
| Gene (Takifugu rubripes) | TrGSDME | GenBank | XP_029701077.1 | |
| Strain, strain background (Escherichia coli) | Trelief 5a | Tsingke Biological Technology | Cat#TSC01 | |
| Strain, strain background (E. coli) | Transetta (DE3) | TransGen | Cat#CD801 | Protein purification |
| Cell line (Homo sapiens) | HEK293T | ATCC | Cat#CRL-3216 | |
| Transfected construct (human) | Lipofectamine 3000 | Invitrogen | Cat#L3000075 | |
| Antibody | Anti-GSDME (rabbit monoclonal) | Abcam | Cat#ab215191 | WB (1:2000) |
| Antibody | Anti-GSDME (rabbit monoclonal) | Abcam | Cat#ab221843 | WB (1:2000) |
| Antibody | Anti-Flag (mouse polyclonal) | Abclonal | Cat#AE005 | WB (1:5000) |
| Antibody | Anti-Myc (mouse polyclonal) | Abclonal | Cat#AE010 | WB (1:5000) |
| Antibody | Anti-His (mouse polyclonal) | Abclonal | Cat#AE003 | WB (1:5000) |
| Antibody | Anti-mCherry (mouse polyclonal) | Abclonal | Cat#AE002 | WB (1:5000) |
| Antibody | Anti-TrGSDME (mouse polyclonal) | This paper | Against TrGSDME (1:1000 for WB) | |
| Recombinant DNA reagent | pmCherry-N1-TrGSDME variants (plasmid) | This paper | Transient expression (backbone: pmCherry-N1) | |
| Recombinant DNA reagent | pCMV-C-Myc-CASP3/7 (plasmid) | This paper | Transient expression (backbone: pCMV-C-Myc) | |
| Recombinant DNA reagent | pET-30a (+)-TrGSDME (plasmid) | This paper | Protein purification (backbone: pET-30a) | |
| Recombinant DNA reagent | pET-30a (+)-CASPs (plasmid) | This paper | Protein purification (backbone: pET-30a) | |
| Recombinant DNA reagent | pET-28a (+)-SUMO-HsGSDME (plasmid) | This paper | Protein purification (backbone: pET-28a) | |
| Recombinant DNA reagent | pET-28a (+)-SUMO-MmGSDME (plasmid) | This paper | Protein purification (backbone: pET-28a) | |
| Recombinant DNA reagent | pET-28a (+)-SUMO-GSDME chimeras (plasmid) | This paper | Protein purification (backbone: pET-28a) | |
| Sequence-based reagent | Primers | This paper | Supplementary file 1e | |
| Peptide, recombinant protein | HsCASP1 | Enzo Life Sciences | Cat#ALX-201-056 | |
| Peptide, recombinant protein | HsCASP2 | Enzo Life Sciences | Cat#ALX-201-057 | |
| Peptide, recombinant protein | HsCASP3 | Enzo Life Sciences | Cat#ALX-201-059 | |
| Peptide, recombinant protein | HsCASP6 | Enzo Life Sciences | Cat#ALX-201-060 | |
| Peptide, recombinant protein | HsCASP7 | Enzo Life Sciences | Cat#ALX-201-060 | |
| Peptide, recombinant protein | HsCASP8 | Enzo Life Sciences | Cat#ALX-201-060 | |
| Peptide, recombinant protein | HsCASP9 | Enzo Life Sciences | Cat#ALX-201-047 | |
| Chemical compound, drug | Ac-YVAD-ρNA | Enzo Life Sciences | Cat#ALX-260-026 | |
| Chemical compound, drug | Ac-VDQQD-ρNA | Sigma-Aldrich | Cat#SCP0105 | |
| Chemical compound, drug | Ac-DEVD-ρNA | Enzo Life Sciences | Cat#ALX-260-033 | |
| Chemical compound, drug | Ac-IETD-ρNA | Enzo Life Sciences | Cat#ALX-260-045 | |
| Chemical compound, drug | Ac-LEHD-ρNA | Enzo Life Sciences | Cat#ALX-260-081 | |
| Chemical compound, drug | Ac-DAVD-ρNA | This paper | Activity comparison of CASP3/7 | |
| Chemical compound, drug | Ac-DMPD-ρNA | This paper | Activity comparison of CASP3/7 | |
| Commercial assay or kit | CytoTox 96 Non-Radioactive Cytotoxicity Assay | Promega | Cat#G1780 | LDH release |
| Commercial assay or kit | Hieff Mut Site-Directed Mutagenesis Kit | Yeasen | Cat#11003ES10 | |
| Commercial assay or kit | FastPure Cell/Tissue Total RNA Isolation Kit V2 | Vazyme | Cat#RC112-01 | |
| Commercial assay or kit | Revert Aid First Strand cDNA Synthesis Kit | Thermo Fisher Scientific | Cat#K1622 | |
| Commercial assay or kit | Endotoxin-free plasmid kit | Sparkjade | Cat#AD0105 | |
| Software, algorithm | Prism software | GraphPad | https://www.graphpad.com/scientific-software/prism/ | |
| Other | Propidium iodide (PI) | Invitrogen | Cat#P1304MP | Cell death examination |
| Other | DiO | Solarbio | Cat#C1038 | Cell death examination |
Additional files
-
Supplementary file 1
Supplementary tables.
(a) The CASP3 sequences used for WebLogo analysis in this study. (b) The CASP7 sequences used for WebLogo analysis in this study. (c) The credits for the pictures used in this study. (d) The constructs of the truncate and chimeric proteins. (e) The primers used in this study.
- https://cdn.elifesciences.org/articles/89974/elife-89974-supp1-v1.docx
-
MDAR checklist
- https://cdn.elifesciences.org/articles/89974/elife-89974-mdarchecklist1-v1.docx
Download links
A two-part list of links to download the article, or parts of the article, in various formats.
Downloads (link to download the article as PDF)
Open citations (links to open the citations from this article in various online reference manager services)
Cite this article (links to download the citations from this article in formats compatible with various reference manager tools)
The molecular mechanism and evolutionary divergence of caspase 3/7-regulated gasdermin E activation
eLife 12:RP89974.
https://doi.org/10.7554/eLife.89974.3


