An engineered biosensor enables dynamic aspartate measurements in living cells
- Human Biology Division, Fred Hutchinson Cancer Center, United States
- Molecular and Cellular Biology Program, University of Washington, United States
- Howard Hughes Medical Institute (HHMI), Janelia Research Campus, United States
Figures
Figure 1 with 4 supplements
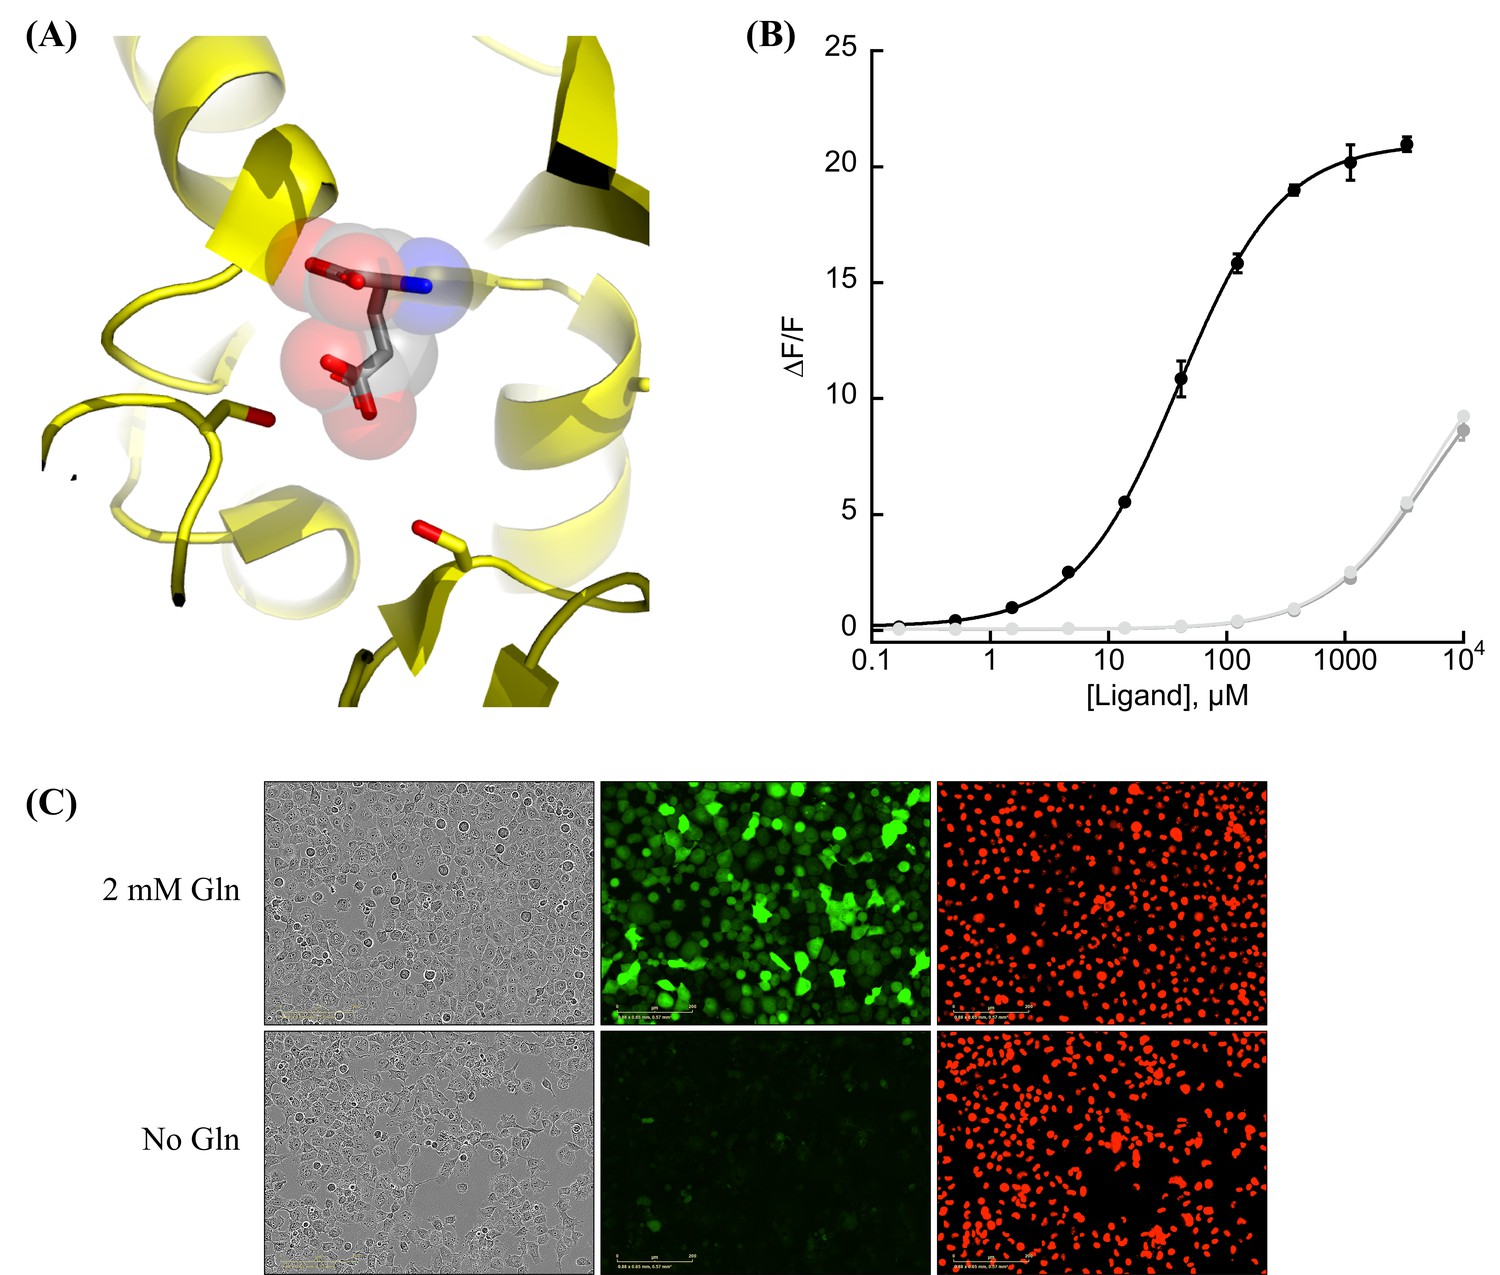
Protein engineering and in vitro characterization.
(A) Structure of the binding pocket of glutamate-bound GltI (2VHA.pdb) with residues S72 (left) and S27 (right) shown as sticks and bound glutamate as sticks inside transparent spheres. (B) Fluorescence response of purified jAspSnFR3-mRuby3 when titrated with aspartate (black) or glutamate or asparagine (gray tones). Ex. 485 nm (20 nm bandpass), Em. 535 nm (20 nm bandpass). Error bars are standard deviation (SD) of three technical replicates. (C) Live cell imaging in the phase contrast, GFP and red fluorescent protein (RFP) channels of H1299 Nuclear-RFP cells expressing jAspSnFR3 after 24 hr with/without glutamine.
-
Figure 1—source data 1
Fluorescence measurements for Figure 1.
- https://cdn.elifesciences.org/articles/90024/elife-90024-fig1-data1-v1.xlsx
Figure 1—figure supplement 1

Aspartate specificity and excitation/emission spectra.
(A) Switching specificity of the iGluSnFR3 precursor from glutamate to aspartate using S72X library (left) and S72P, S27X library (right). Titrations with aspartate (solid lines) and glutamate (dashed lines) in bacterial lysate. (B) Excitation and emission spectra of jAspSnFR3-mRuby3. Left, one-photon spectra. Excitation wavelength was varied from 400 to 520 nm (7.5 nm bandpass) while observing emission at 535 nm (10 nm bandpass). Emission wavelength was varied from 535 to 600 nm (10 nm bandpass) while exciting at 510 nm (7.5 nm bandpass). Fluorescence was measured both in the absence (dashed lines) and presence of 10 mM aspartate (solid lines). Right, two-photon cross-sections, also ±10 mM aspartate, with an overlay of calculated ΔF/F (green). Vertical bar indicates 1040 nm.
-
Figure 1—figure supplement 1—source data 1
Fluorescence measurements for Figure 1—figure supplement 1.
- https://cdn.elifesciences.org/articles/90024/elife-90024-fig1-figsupp1-data1-v1.xlsx
Figure 1—figure supplement 2

Decoy, temperature, and pH sensitivity.
(A) jAspSnFR3-mRuby3 does not appreciably change its green fluorescence in response to other amino acids (alanine, phenylalanine, glycine, histidine (red line), isoleucine, leucine, methionine, proline, glutamine, arginine, serine, threonine, valine, or tryptophan). Insert with aspartate in black and glutamate/asparagine in gray for comparison. Ex. 485 nm (20 nm bandpass), Em. 535 nm (20 nm bandpass), 0.2 µM purified protein in phosphate-buffered saline (PBS). (B) jAspSnFR3-mRuby3 does not respond to other decoys: citrate, lactate, pyruvate, malate, alpha-ketoglutarate, cis-aconitate, succinate, fumarate, or oxaloacetate (orange squares); nor to relevant pharmacological treatments: rotenone (green squares) or metformin. The small increase in fluorescence from rotenone is likely due to the scattering of a visibly turbid solution; rotenone has very low solubility in water. Ex. 485 nm (20 nm bandpass), Em. 535 nm (20 nm bandpass). (C) jAspSnFR3-mRuby3 is not adversely affected by temperature. Fluorescence as a function of aspartate titration at 23°C (light gray), 30°C (medium gray), and 37°C (black). Error bars are standard deviation of three technical replicates. (D) pH sensitivity of jAspSnFR3-mRuby3 (green component). Ex 485 nm (5 nm bp), Em 515 nm (10 nm bp). Error bars are standard deviation of five technical replicates. Solid line is with 3 mM aspartate, dashed line is without aspartate.
-
Figure 1—figure supplement 2—source data 1
Fluorescence measurements for Figure 1—figure supplement 2.
- https://cdn.elifesciences.org/articles/90024/elife-90024-fig1-figsupp2-data1-v1.xlsx
Figure 1—figure supplement 3

Stopped-flow kinetics.
(A) Stopped-flow kinetics of jAspSnFR3 using different aspartate concentrations for injection. Measurements were performed at a frequency of 1 per ms and indicated by dots. To each time-series an exponential function was fit, shown as a solid line with matching color. (B) as a function of aspartate concentration shown for two independent stopped-flow experiments. The line represents the linear function, fitted to the linear range to extract the kinetic rates.
-
Figure 1—figure supplement 3—source data 1
Fluorescence measurements and kobs values for Figure 1—figure supplement 3.
- https://cdn.elifesciences.org/articles/90024/elife-90024-fig1-figsupp3-data1-v1.xlsx
Figure 1—figure supplement 4
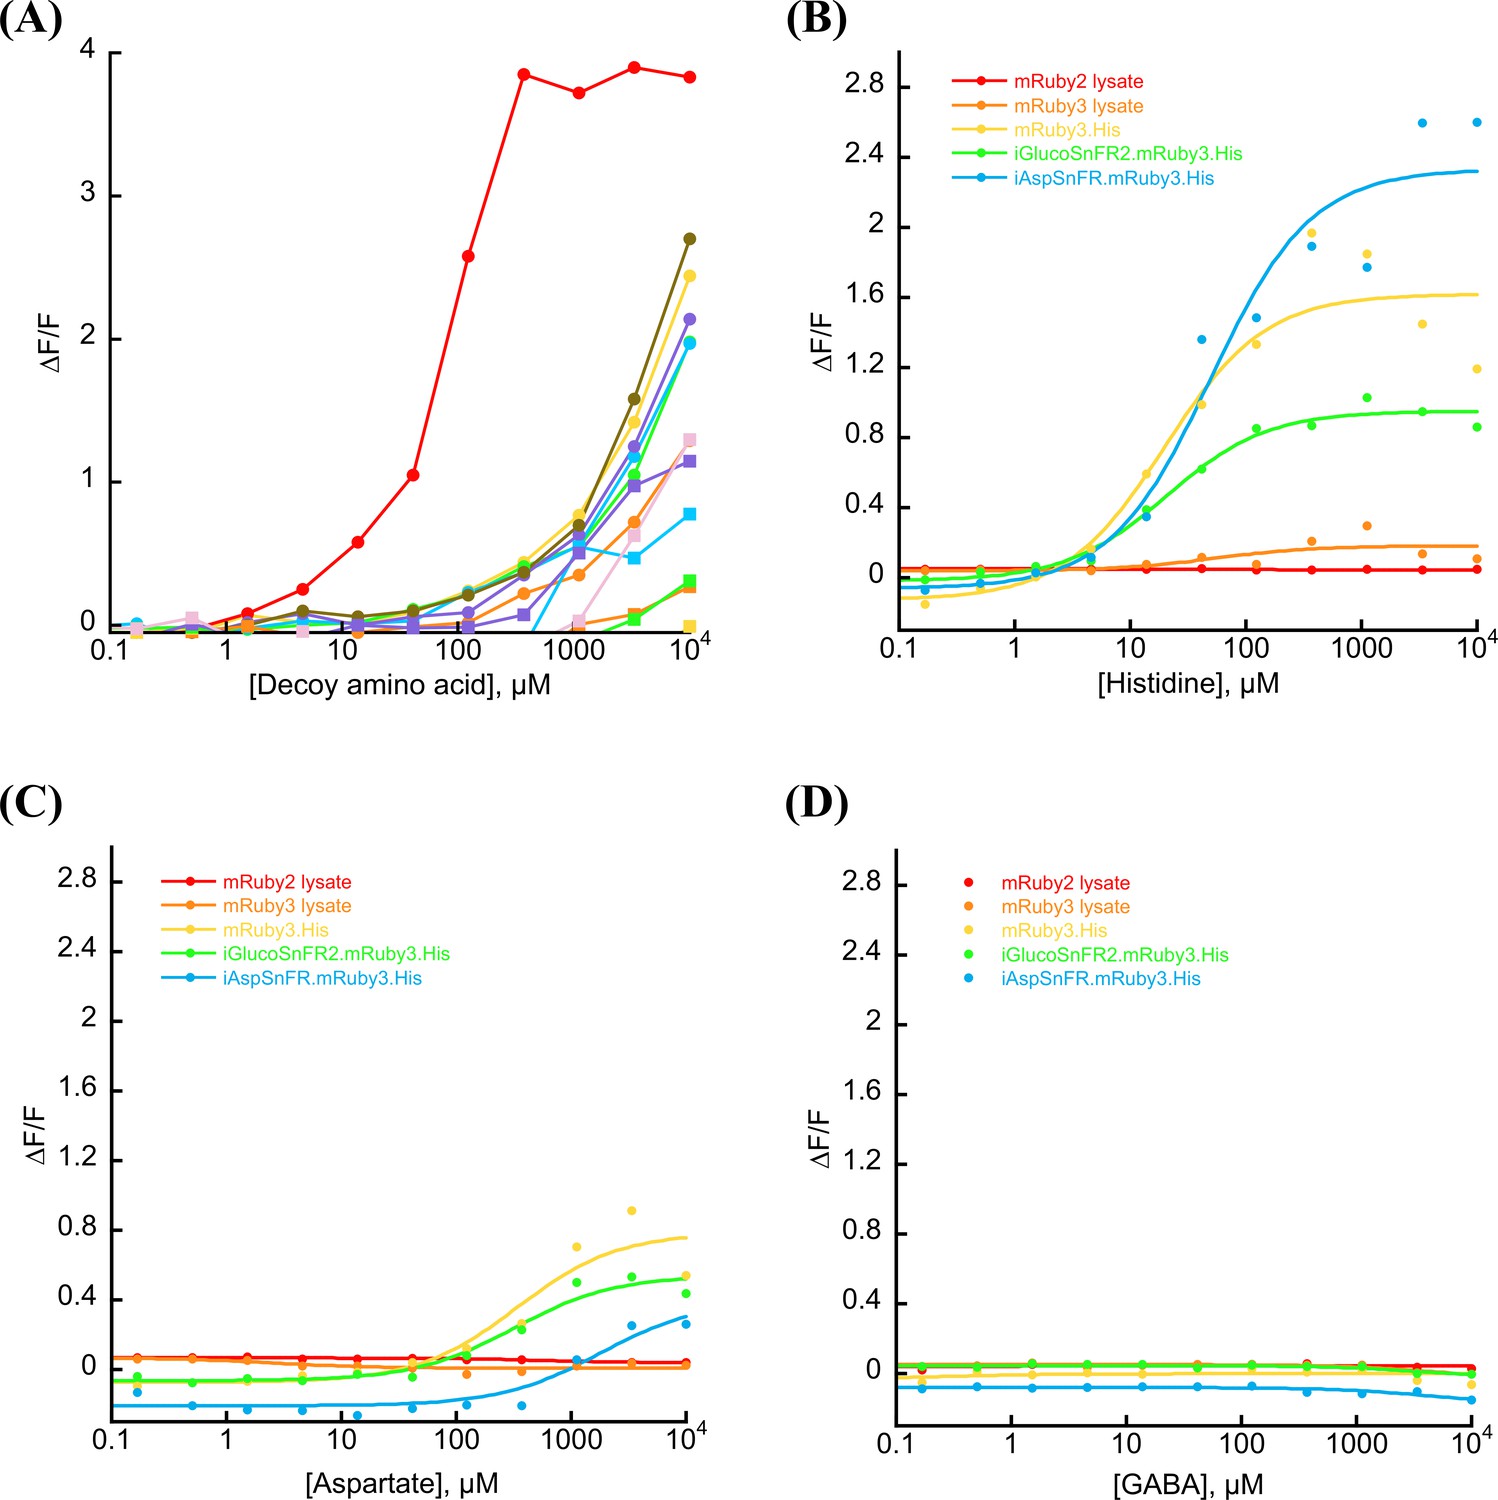
mRuby3 interaction with histidine tag.
(A) jAspSnFR3-mRuby3 shows increased red fluorescence at millimolar concentrations of all amino acids amino acids (alanine, phenylalanine, glycine, histidine, isoleucine, leucine, methionine, proline, glutamine, arginine, serine, threonine, valine, or tryptophan), with apparent responses to histidine at 100 µM (red line). (B) Increased red fluorescence of mRuby3 in response to histidine requires a C-terminal histidine tag. (C) Increased red fluorescence of mRuby3 in response to millimolar concentrations of aspartate requires a C-terminal histidine tag. (D) mRuby, with or without histidine tag, does not increase in fluorescence upon treatment with amino acid-related compound gamma-aminobutyric acid (GABA). For all plots Ex. 555 nm (20 nm bandpass), Em. 600 nm (20 nm bandpass).
-
Figure 1—figure supplement 4—source data 1
Fluorescence measurements for Figure 1—figure supplement 4.
- https://cdn.elifesciences.org/articles/90024/elife-90024-fig1-figsupp4-data1-v1.xlsx
Figure 2 with 2 supplements
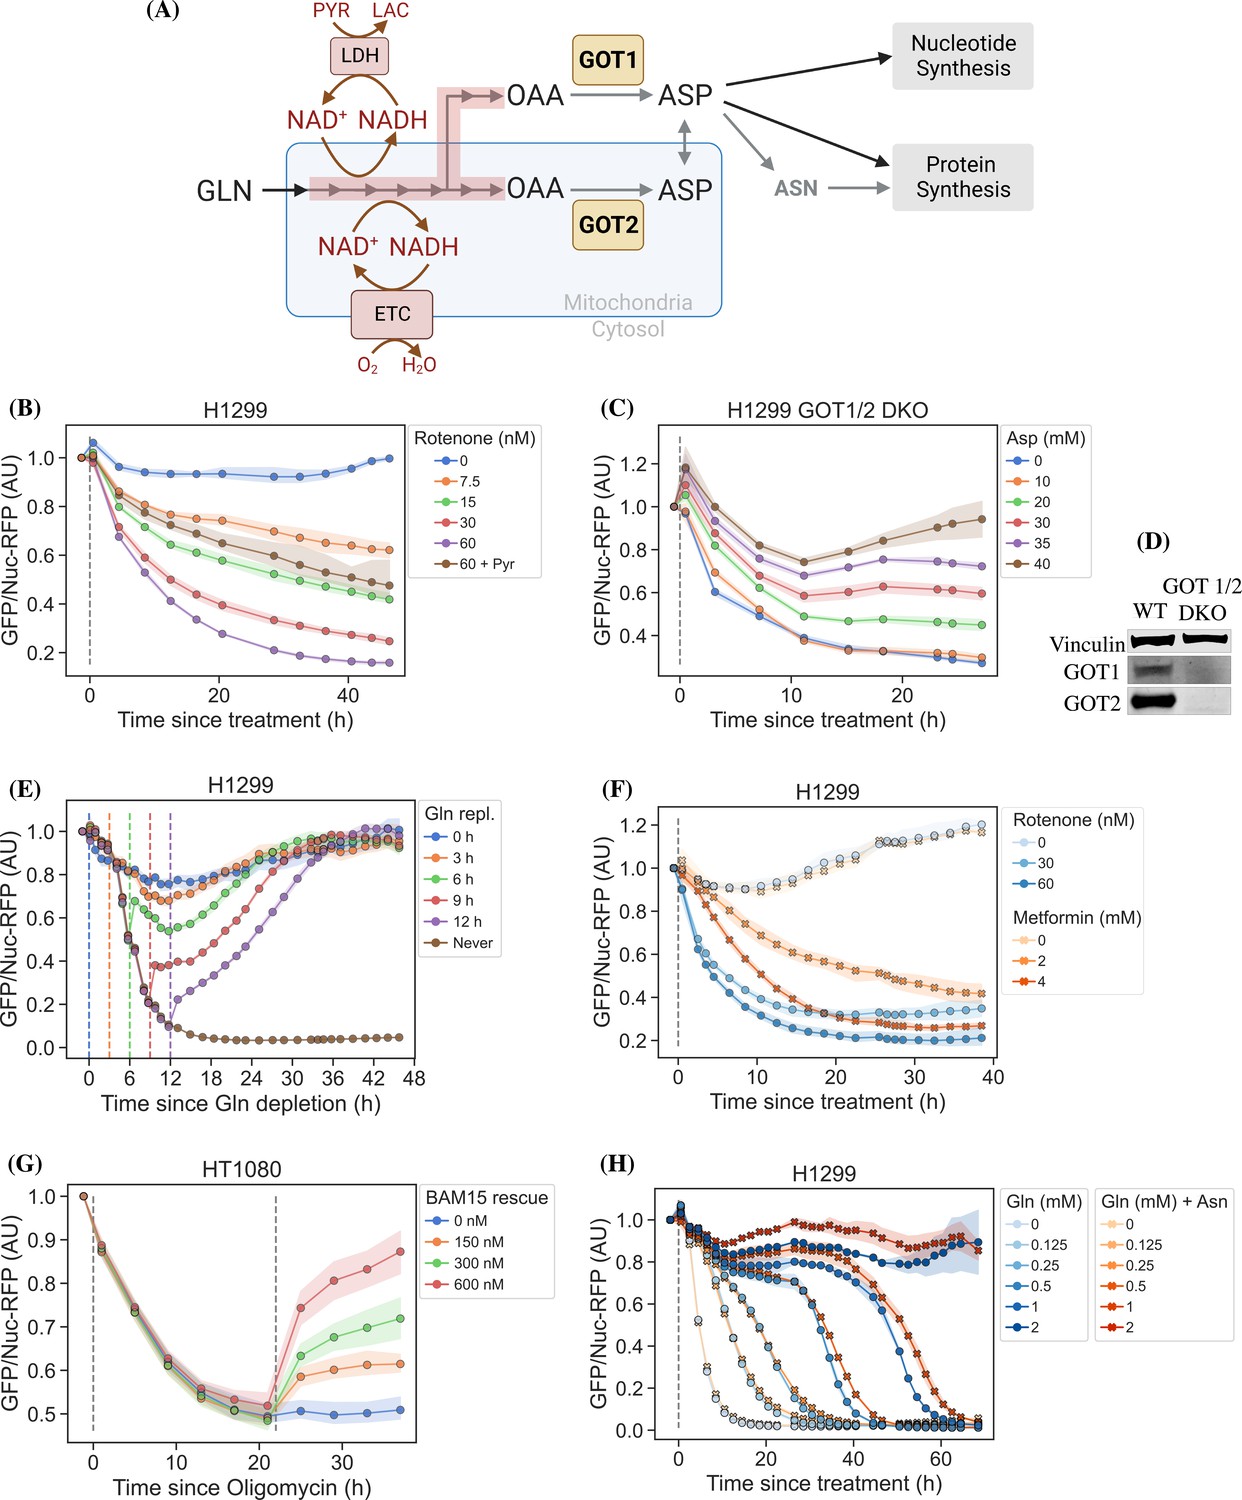
jAspSnFR3 resolves temporal aspartate changes in live cells.
(A) Overview of aspartate metabolism, highlighting how glutamine depletion, mitochondrial inhibition, GOT1/2 knockout and pyruvate/asparagine supplementation can impact aspartate levels. (B) H1299 cells treated with a rotenone titration and rescued by co-treatment with pyruvate. (C) H1299 GOT1/2 double knockout cells grown in media with 40 mM aspartate, washed thrice in media without aspartate and then changed into media with a titration of aspartate. (D) Western blot verification of H1299 GOT1/2 double knockout. (E) H1299 cells changed into media without glutamine and then glutamine repleted (repl.) at the different timepoints. (F) H1299 cells treated with either rotenone or metformin to compare inhibitor kinetics. (G) HT1080 cells treated with oligomycin A and after 22 hr rescued with a titration of mitochondrial uncoupler BAM15. (H) H1299 cells changed into media with a titration of glutamine with or without 1 mM asparagine. For (B), (C), (E–H), sensor signal over time shown as RFP normalized jAspSnFR3 signal following various perturbations of live cells. All experiments shown are normalized to a pre-treatment scan and then treated with the specified drug or amino acid. Gray dashed lines indicate the time of treatment. Colored dashed lines indicate the time of treatment for multiple treatments in the same plot. Markers indicate the average using available well replicates and are superimposed on a bootstrapped 95% confidence interval colored using the same color code as the markers. GLN, glutamine; ETC, electron transport chain; LDH, lactate dehydrogenase; OAA, oxaloacetic acid; ASP, aspartate; ASN, asparagine; AU, arbitrary unit.
-
Figure 2—source data 1
Fluorescence measurements for Figure 2.
- https://cdn.elifesciences.org/articles/90024/elife-90024-fig2-data1-v1.xlsx
-
Figure 2—source data 2
Original files for Western blot analysis in Figure 2D (anti-Vinculin, anti-GOT1, anti-GOT2).
- https://cdn.elifesciences.org/articles/90024/elife-90024-fig2-data2-v1.zip
-
Figure 2—source data 3
PDF containing Figure 2D and original scans of relevant Western blot analysis (anti-Vinculin, anti-GOT1, anti-GOT2) with highlighted bands and sample labels.
- https://cdn.elifesciences.org/articles/90024/elife-90024-fig2-data3-v1.pdf
Figure 2—figure supplement 1
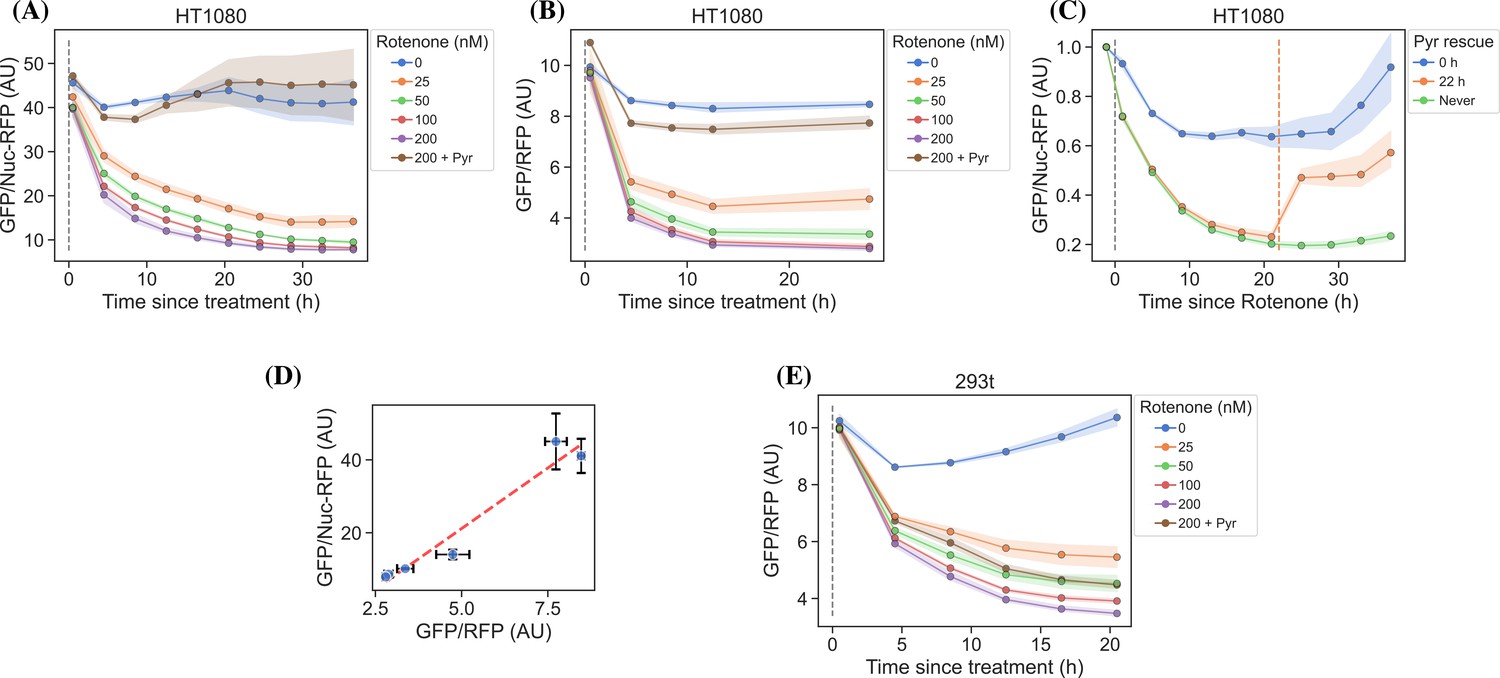
Rotenone titration in different cell lines.
jAspSnFR3 temporal response after rotenone treatment. (A) HT1080 cells using nuclear RFP to normalize the jAspSnFR3 signal, treated with a rotenone titration. (B) HT1080 cells using an RFP fused to jAspSnFR3 (jAspSnFR3-mRuby3) for normalization, treated with a rotenone titration. (C) HT1080 cells treated with 100 nM rotenone at the start of the experiment (0 hr) and then rescued with pyruvate at start, 22 hr or never. (D) Comparison between the steady-state signal of (A) and (B) with a linear regression shown as a red dashed line to show that nuclear RFP and RFP fusion normalizations are equivalent. (E) HEK293t cells using an RFP fused to jAspSnFR3 for normalization, treated with a rotenone titration. For plots (A–C) and (E), markers indicate the average using available well replicates and are superimposed on a bootstrapped 95% confidence interval colored using the same color code as the markers. For plot (D), markers indicate the average using available well replicates and error bars are drawn as ± the standard deviation of the replicates. Gray dashed lines indicate the time of treatment. Orange dashed line in panel (C) indicates time of pyruvate addition. AU, arbitrary unit.
-
Figure 2—figure supplement 1—source data 1
Fluorescence measurements for Figure 2—figure supplement 1.
- https://cdn.elifesciences.org/articles/90024/elife-90024-fig2-figsupp1-data1-v1.xlsx
Figure 2—figure supplement 2

Plots related to glutamine limitation.
(A) Nuclei count over time for conditions displayed in Figure 2E. (B) Cell confluency over time for conditions displayed in Figure 2E. (C) H1299 cells changed into media with a titration of glutamine with or without 1 mM asparagine. Identical to Figure 2H but with fewer glutamine concentrations and more well replicates.
-
Figure 2—figure supplement 2—source data 1
RFP nuclei counts, confluency measurements, and fluorescence measurements for Figure 2—figure supplement 2.
- https://cdn.elifesciences.org/articles/90024/elife-90024-fig2-figsupp2-data1-v1.xlsx
Figure 3 with 1 supplement
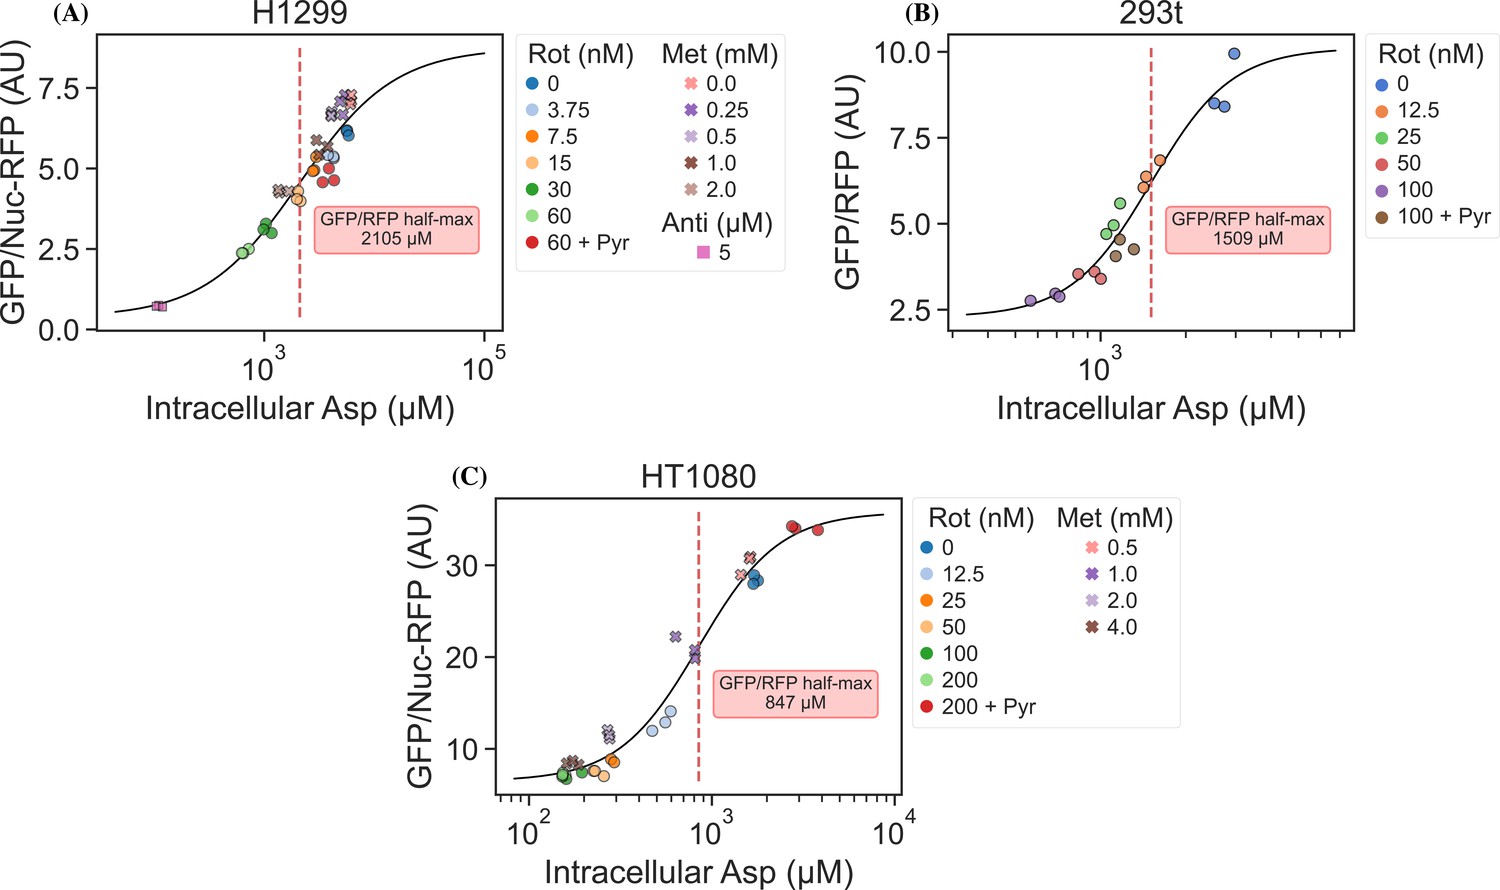
jAspSnFR3 signal predicts liquid chromatography–mass spectrometry (LCMS) measured intracellular aspartate concentration.
(A) Hill equation with top and bottom asymptotes, midpoint and slope as free variables is fitted to the data points and shown by the black line. The intracellular aspartate concentration at the inferred half maximum of RFP normalized jAspSnFR3 signal is reported in the red inserts. (A) Rotenone, metformin, and antimycin A titrations in H1299 cells. (B) Rotenone titration in HEK293t cells. (C) Rotenone and metformin titrations in HT1080 cells. Markers indicate a single well from which both LCMS and jAspSnFR3 data was collected. Replicate wells have identical color and marker shape. AU, arbitrary unit.
-
Figure 3—source data 1
Fluorescence measurements and intracellular aspartate measurements for Figure 3.
- https://cdn.elifesciences.org/articles/90024/elife-90024-fig3-data1-v1.xlsx
Figure 3—figure supplement 1
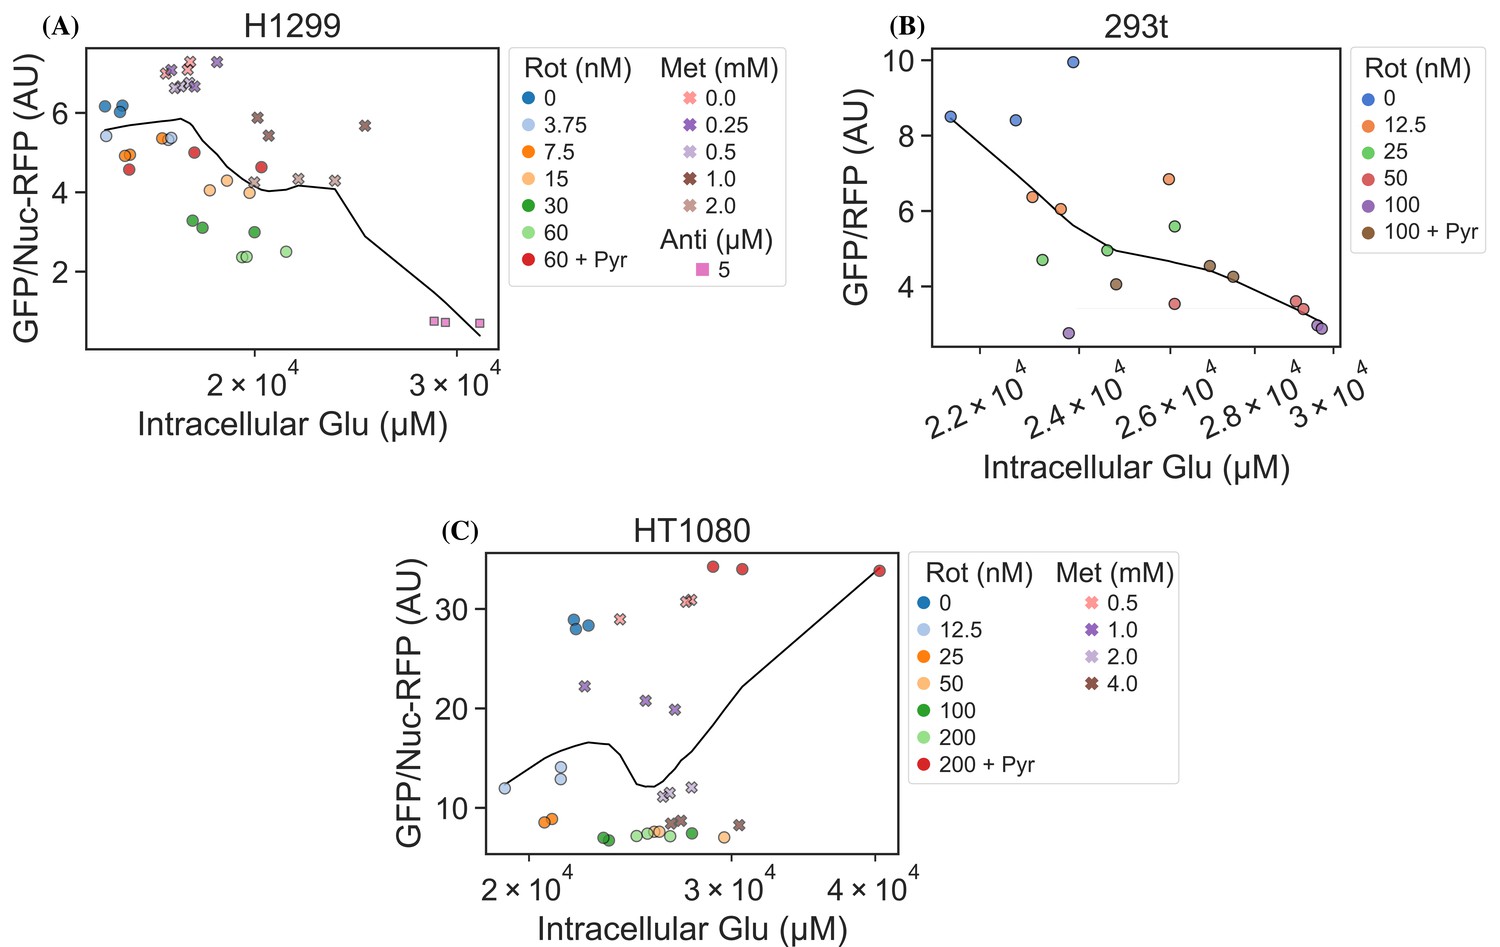
jAspSnFR3 signal does not correlate with glutamate concentration.
RFP normalized jAspSnFR3 signal, following various perturbations to live cells, is not correlated with the liquid chromatography–mass spectrometry (LCMS) measured intracellular glutamate concentration. Data points are fitted to a local linear regression, shown by the black line, otherwise, these plots are identical to those in Figure 3. AU, arbitrary unit.
-
Figure 3—figure supplement 1—source data 1
Fluorescence measurements and intracellular glutamate measurements for Figure 3—figure supplement 1.
- https://cdn.elifesciences.org/articles/90024/elife-90024-fig3-figsupp1-data1-v1.xlsx
Tables
Key resources table
| Reagent type (species) or resource | Designation | Source or reference | Identifiers | Additional information |
|---|---|---|---|---|
| Cell line (human) | H1299 | ATCC | CRL-5803 | |
| Cell line (human) | HEK293T | ATCC | CRL-1573 | |
| Cell line (human) | HT1080 | ATCC | CCL-121 | |
| Other | EF1A-nuclear RFP lentivirus | Cellomics Technology | PLV-10205--50 | Virus |
| Other | U-13C, U-15N-labeled canonical amino acid mix | Cambridge Isotope Laboratories | MSK-CAA-1 | Isotopic standard |
| Antibody | anti-Vinculin, mouse monoclonal | Sigma | SAB4200729 | 1:10,000 dilution |
| Antibody | anti-GOT2, rabbit polyclonal | Proteintech | 14800-1-AP | 1:750 dilution |
| Antibody | anti-GOT1, rabbit monoclonal | Cell Signaling | 34423S | 1:1000 dilution |
| Sequence-based reagent | GOT1_1 | Synthego | CRISPR guide | CAGUCAUCCGUGCGAUAUGC |
| Sequence-based reagent | GOT1_2 | Synthego | CRISPR guide | GCACGGAUGACUGCCAUCCC |
| Sequence-based reagent | GOT1_3 | Synthego | CRISPR guide | CGAUCUUCUCCAUCUGGGAA |
| Sequence-based reagent | GOT2_1 | Synthego | CRISPR guide | UUUCUCAUUUCAGCUCCUGG |
| Sequence-based reagent | GOT2_2 | Synthego | CRISPR guide | CGGACGCUAGGCAGAACGUA |
| Sequence-based reagent | GOT2_3 | Synthego | CRISPR guide | UCCUUCCACUGUUCCGGACG |
| Other | Incucyte S3 | Sartorius | Instrument | |
| Other | Q Exactive HF-X Hybrid Quadrupole | Thermo | Instrument | |
| Sequence-based reagent | S72X | IDT | Primer | CAG CAG TGG AAT ACG GTT TTG SNN GGT AAT CGG AAT CAG TTT TAC |
| Sequence-based reagent | S27X.E25K | IDT | Primer | GTC GTA ATA AGA GAA AGG CAC SNN AGA TTT ACG GTG ACC GAC GAC |
| Chemical compound | Aspartate | Sigma-Aldrich | A6683 | |
| Chemical compound | Glutamate | Sigma-Aldrich | G8415 | |
| Chemical compound | Alanine | Sigma-Aldrich | A7627 | |
| Chemical compound | Cysteine | Sigma-Aldrich | C7352 | |
| Chemical compound | Phenylalanine | Sigma-Aldrich | P2126 | |
| Chemical compound | Glycine | Fisher Bioreagents | BP381 | |
| Chemical compound | Histidine | Sigma-Aldrich | H8125 | |
| Chemical compound | Isoleucine | Sigma-Aldrich | I2752 | |
| Chemical compound | Leucine | Sigma-Aldrich | L8000 | |
| Chemical compound | Lysine | Sigma-Aldrich | L5626 | |
| Chemical compound | Methionine | Sigma-Aldrich | M9625 | |
| Chemical compound | Asparagine | Sigma-Aldrich | A4159 | |
| Chemical compound | Proline | Sigma-Aldrich | P5607 | |
| Chemical compound | Glutamine | Sigma-Aldrich | G3126 | |
| Chemical compound | Arginine | Sigma-Aldrich | A5131 | |
| Chemical compound | Serine | Sigma-Aldrich | S4311 | |
| Chemical compound | Threonine | Sigma-Aldrich | T8625 | |
| Chemical compound | Valine | Sigma-Aldrich | V0513 | |
| Chemical compound | Tyrosine | Fluka | 93830 | |
| Chemical compound | Tryptophan | Sigma-Aldrich | T0254 | |
| Chemical compound | Citrate | Thermo Fisher Scientific | A940 | |
| Chemical compound | L-Lactate | Sigma-Aldrich | L7022 | |
| Chemical compound | Pyruvate | Gibco | 11360070 | |
| Chemical compound | Rotenone | Sigma-Aldrich | R9975 | |
| Chemical compound | Metformin | Sigma-Aldrich | 317240 | |
| Chemical compound | Malate | Sigma-Aldrich | 240176 | |
| Chemical compound | Fumarate | Sigma-Aldrich | F1506 | |
| Chemical compound | alpha-Ketoglutarate | Sigma-Aldrich | 75890 | |
| Chemical compound | cis-Aconitic acid | Sigma-Aldrich | A3412 | |
| Chemical compound | Oxaloacetate | Sigma-Aldrich | O4126 | |
| Chemical compound | Succinate | Sigma-Aldrich | S2378 | |
| Chemical compound | GABA | Sigma-Aldrich | A2129 |
Table 1
CRISPR guides.
| Gene | sgRNA sequence (5′–3′) |
|---|---|
| GOT1 | CAGUCAUCCGUGCGAUAUGC GCACGGAUGACUGCCAUCCC CGAUCUUCUCCAUCUGGGAA |
| GOT2 | UUUCUCAUUUCAGCUCCUGG CGGACGCUAGGCAGAACGUA UCCUUCCACUGUUCCGGACG |
Additional files
-
MDAR checklist
- https://cdn.elifesciences.org/articles/90024/elife-90024-mdarchecklist1-v1.pdf
-
Supplementary file 1
Protein engineering sequence information for jAspSnFR3.
- https://cdn.elifesciences.org/articles/90024/elife-90024-supp1-v1.docx
-
Supplementary file 2
Ion count quantification for liquid chromatography–mass spectrometry (LCMS) metabolomics measurements used to calculate aspartate and glutamate concentrations in Figure 3 and Figure 3—figure supplement 1.
- https://cdn.elifesciences.org/articles/90024/elife-90024-supp2-v1.xlsx
Download links
A two-part list of links to download the article, or parts of the article, in various formats.
Downloads (link to download the article as PDF)
Open citations (links to open the citations from this article in various online reference manager services)
Cite this article (links to download the citations from this article in formats compatible with various reference manager tools)
An engineered biosensor enables dynamic aspartate measurements in living cells
eLife 12:RP90024.
https://doi.org/10.7554/eLife.90024.3


