Taste shaped the use of botanical drugs
- Department of Biomedical Sciences, University of Cagliari, Cittadella Universitaria, Italy
- School of Biological Sciences, University of Reading, United Kingdom
- Department of Life and Environmental Sciences, University of Cagliari, Cittadella Universitaria, Italy
Figures
Figure 1
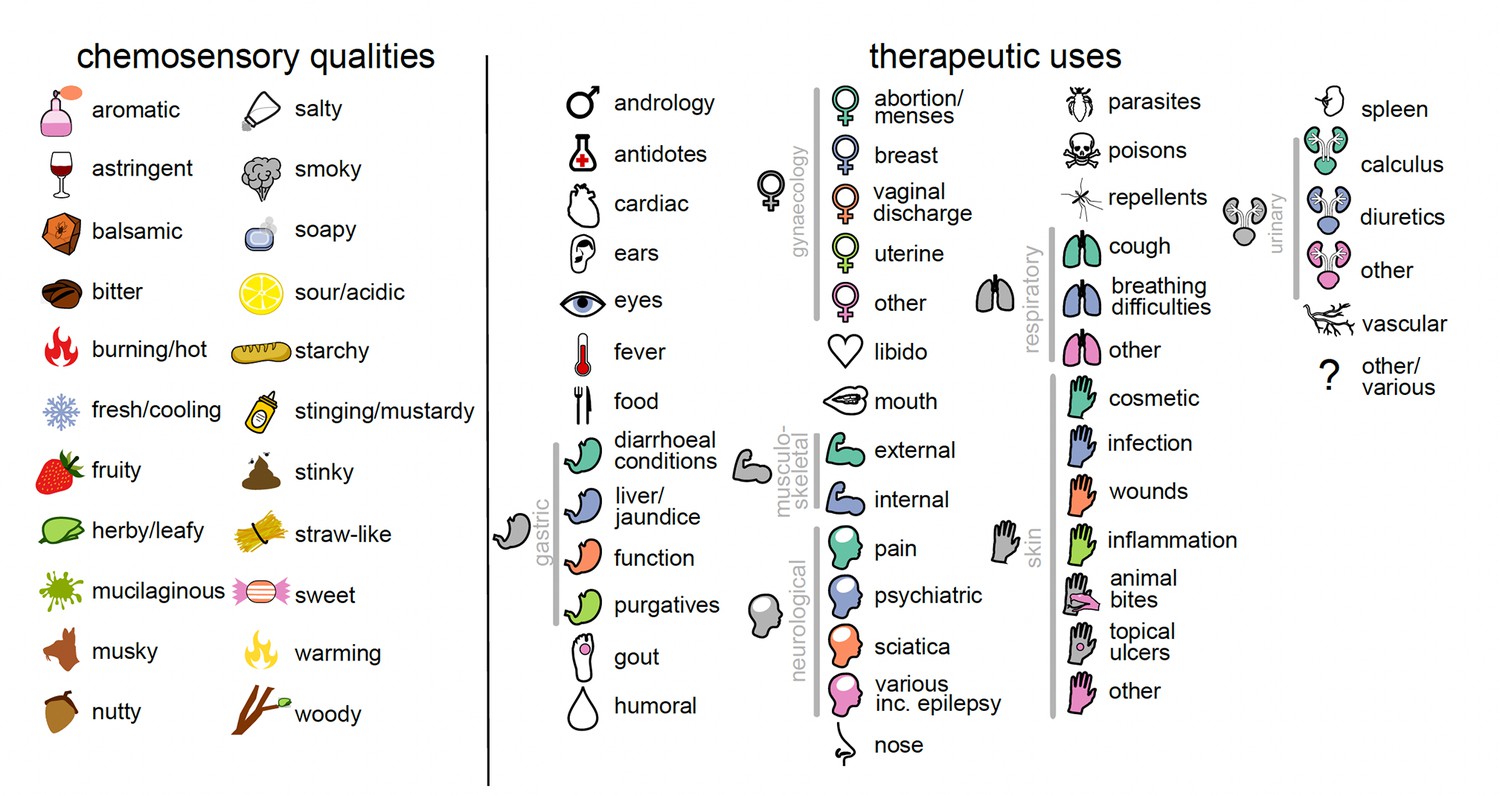
The 22 chemosensory qualities and 46 therapeutic uses studied here.
Each chemosensory quality and use is represented by an icon that is used throughout the manuscript. Therapeutic uses that share an icon are considered to represent the same category of use (25 in total); these are linked by grey bars.
Figure 2 with 1 supplement
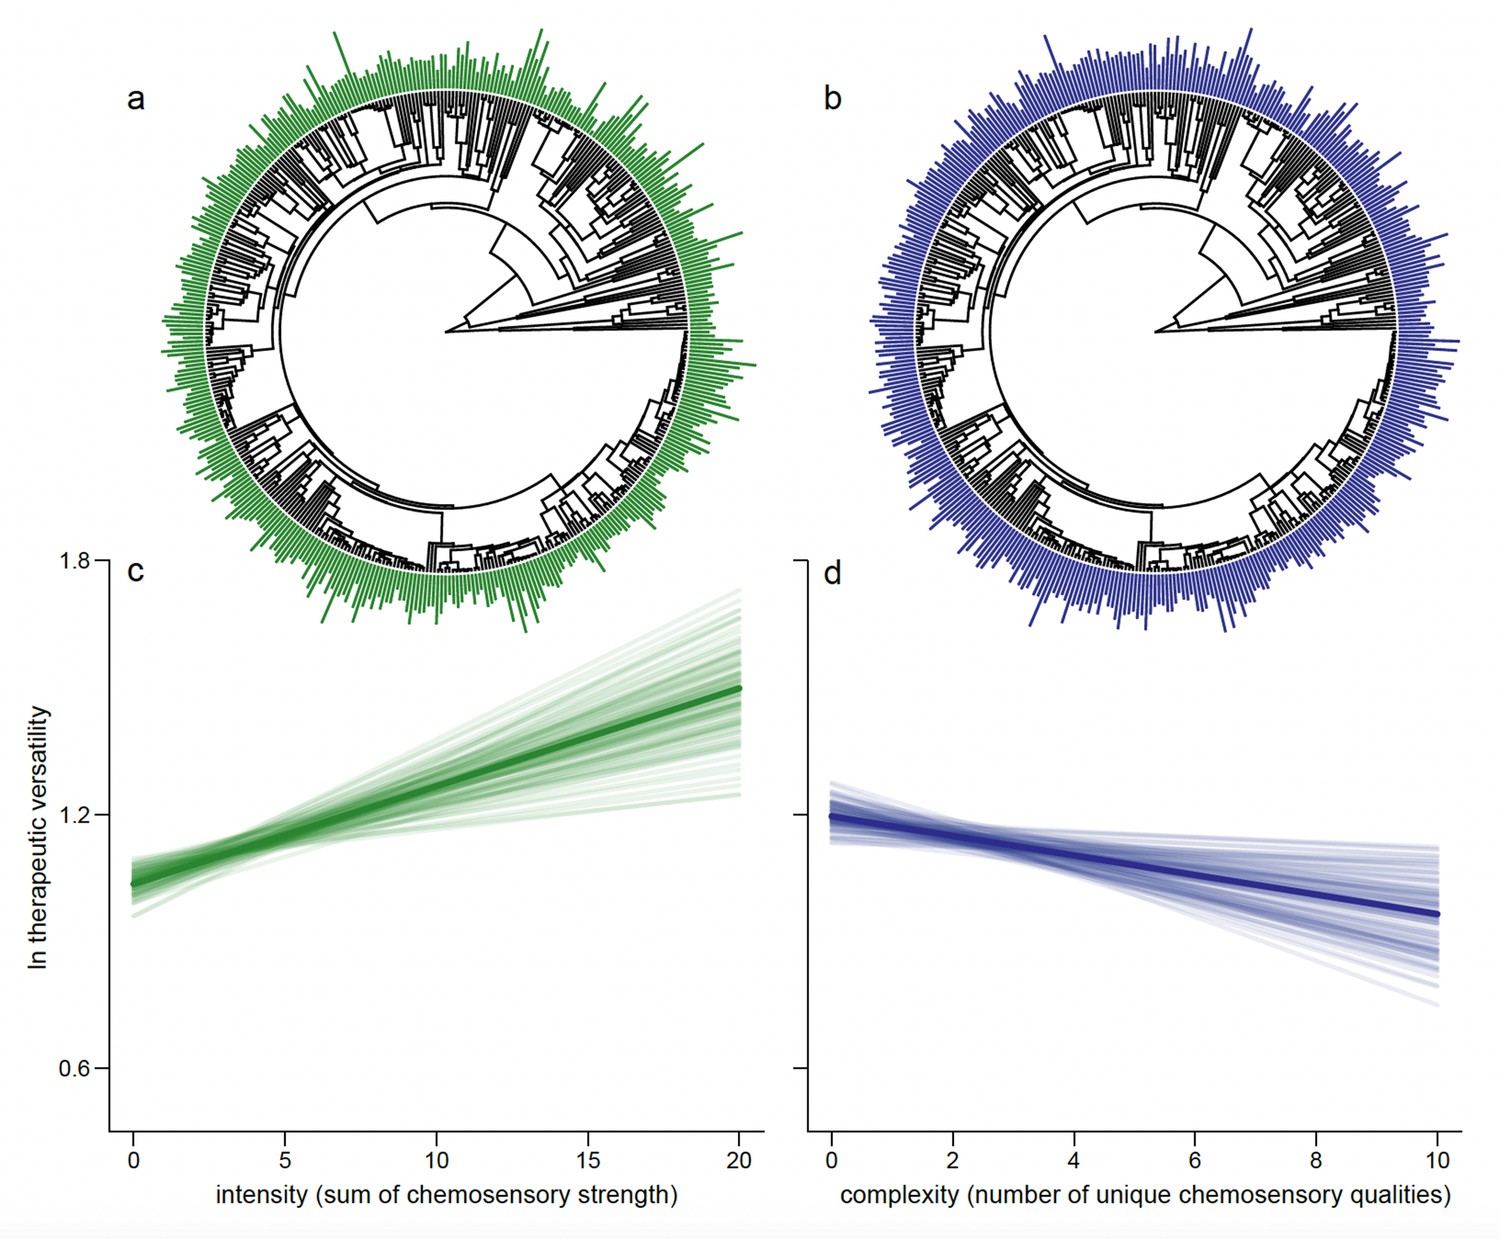
Drugs eliciting strong overall chemosensory perception (intense drugs) associated with relatively few perceived unique tastes (less complex) predict the number of categories of therapeutic use (therapeutic versatility).
We show the distribution of intensity (a) and complexity (b) at the tips of the phylogenetic tree. As some species are represented by multiple parts, an average is shown here for representative purposes; each plant part is considered separately in the analysis. We plot the mean regression line as estimated from the parameter estimates of our Bayesian phylogenetic regression analyses (dark line) along with 100 random samples of the posterior distribution (faded lines). For graphical representation, the slopes are estimated holding other effects at their mean. We do this for both the significant positive association between intensity and therapeutic versatility (c, px = <0.001) and the significant negative association between chemosensory complexity and therapeutic complexity (d, px = 0.008).
Figure 2—figure supplement 1
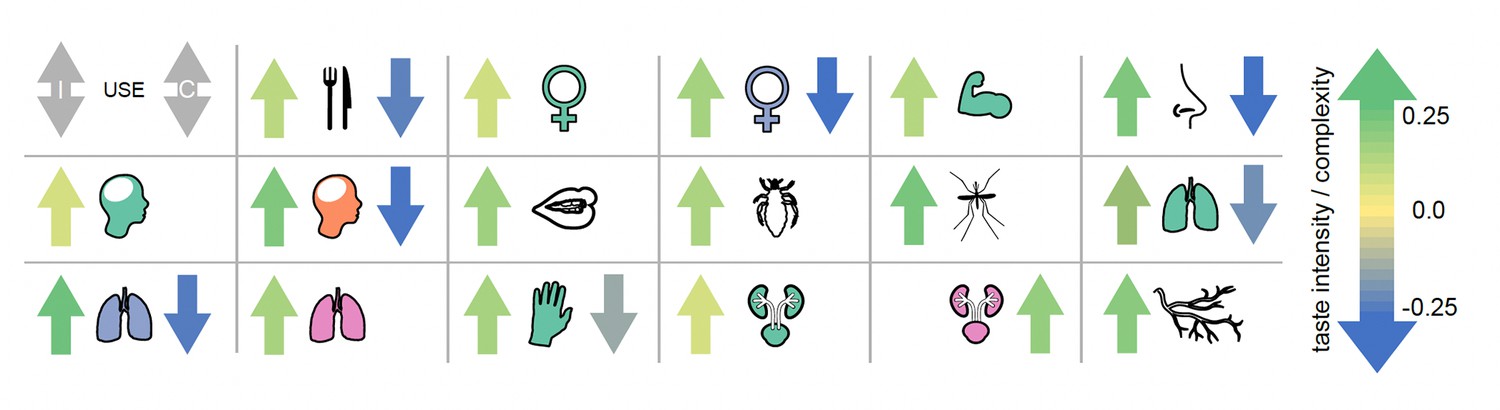
The relationship between individual therapeutic uses and chemosensory intensity/complexity.
Chemosensory intensity and complexity were significantly associated with 17 uses. No therapeutic use was predicted by weaker qualities. An arrow is shown indicating the direction of any significant association (px < 0.05) with either chemosensory intensity (left) or chemosensory complexity (right). An arrow points upward if a drug is more likely to be used for a given purpose with increasing chemosensory intensity or complexity. Arrows are shaded by the strength of the relationship (magnitude of estimated parameter, see scale). For seven individual uses more intense and less complex chemosensation increased the probability of a drug being used, i.e., there was a preference for stronger and simpler qualities. Nine uses had a significant positive association with chemosensory intensity and were predicted by stronger qualities alone. A single use (various urinary problems) was uniquely significantly associated with increased chemosensory complexity. No therapeutic use was predicted by weaker qualities.
Figure 3
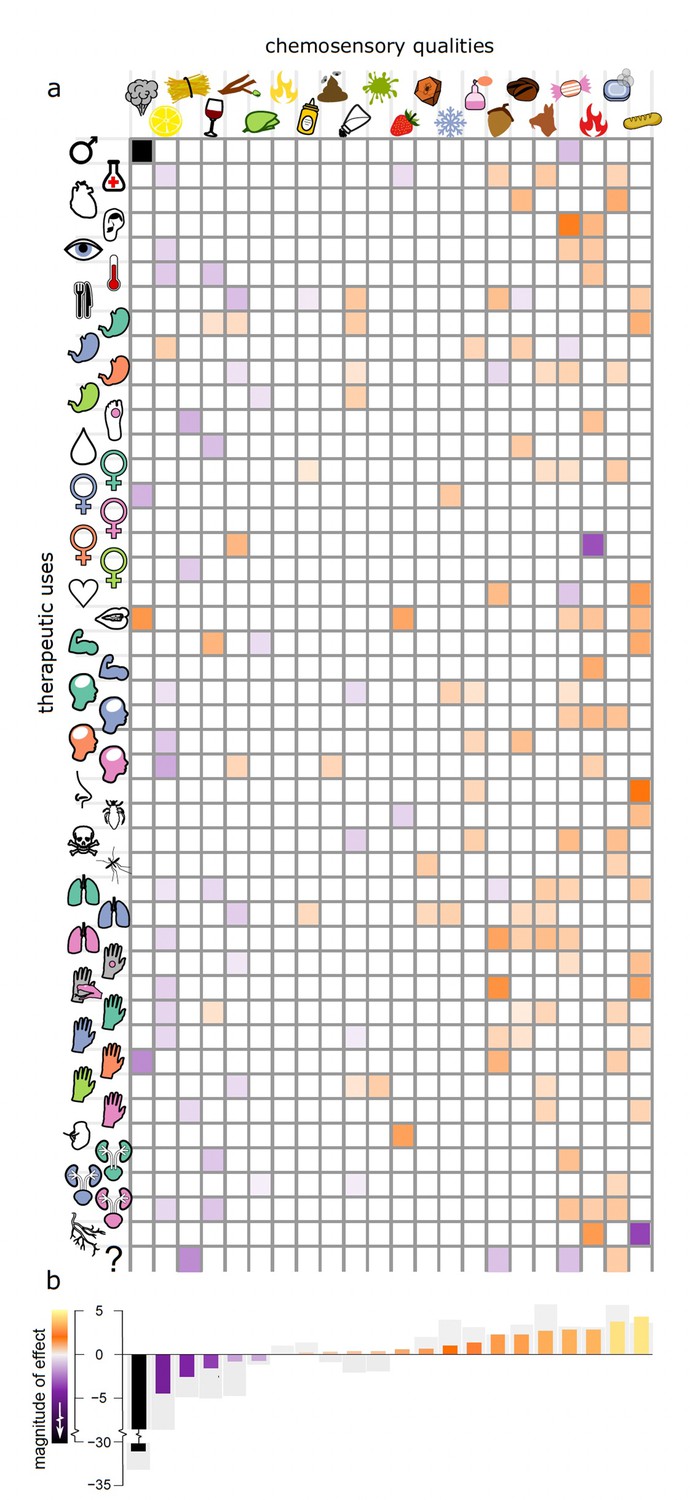
The magnitude of effect for 22 different specific chemosensory qualities across 46 different therapeutic uses.
(a) A heat map showing the strength of the association between specific qualities (columns) and therapeutic uses (rows). Where we find a significant association between the strength of chemosensory quality and whether a drug is used for a particular therapeutic purpose in our phylogenetic binary (probit) response model, the corresponding cell is coloured according to its estimated parameter value; see colour scale in panel (b). All other variables are zeroed and coloured white for visualisation. (b) An overall ‘magnitude of effect’ is calculated for each chemosensory quality by summing the significant betas (px < 0.05, i.e. those displayed in the heat map above) across all different uses and plotted as bars coloured by their magnitude; see colour scale alongside axis. The sum of all betas regardless of significance are shown as grey bars. Note that the large parameter estimate for ‘smoky’ is owing to the fact that no botanical drug with any smoky quality (scored by any participant) is ever used for androgynous therapeutic purposes and thus is poorly estimated in that model (Supplementary files 1, 2, 5, and 6).
Additional files
-
Supplementary file 1
Sampled botanical drugs and their uses ex Matthioli (1568).
- https://cdn.elifesciences.org/articles/90070/elife-90070-supp1-v1.xlsx
-
Supplementary file 2
Sampled botanical drugs and their chemosensory qualities (panel data).
- https://cdn.elifesciences.org/articles/90070/elife-90070-supp2-v1.xlsx
-
Supplementary file 3
Codes and the short descriptions of the 22 chemosensory qualities to represent tastes and flavours.
- https://cdn.elifesciences.org/articles/90070/elife-90070-supp3-v1.docx
-
Supplementary file 4
Codes and the short descriptions of the therapeutic uses.
- https://cdn.elifesciences.org/articles/90070/elife-90070-supp4-v1.docx
-
Supplementary file 5
Heat map showing the strength of the association between chemosensory quality and therapeutic use.
- https://cdn.elifesciences.org/articles/90070/elife-90070-supp5-v1.xlsx
-
Supplementary file 6
Significance of individual parameter estimates from the models of individual chemosensory quality against individual therapeutic use calculated as the proportion of the parameter estimate crossing zero, px.
- https://cdn.elifesciences.org/articles/90070/elife-90070-supp6-v1.xlsx
-
MDAR checklist
- https://cdn.elifesciences.org/articles/90070/elife-90070-mdarchecklist1-v1.docx
Download links
A two-part list of links to download the article, or parts of the article, in various formats.
Downloads (link to download the article as PDF)
Open citations (links to open the citations from this article in various online reference manager services)
Cite this article (links to download the citations from this article in formats compatible with various reference manager tools)
Taste shaped the use of botanical drugs
eLife 12:RP90070.
https://doi.org/10.7554/eLife.90070.3


