Inhibition of Cpeb3 ribozyme elevates CPEB3 protein expression and polyadenylation of its target mRNAs and enhances object location memory
- Department of Pharmaceutical Sciences, University of California, Irvine, United States
- Department of Neurobiology and Behavior, Center for the Neurobiology of Learning and Memory, University of California, Irvine, United States
- Ionis Pharmaceuticals, United States
- Department of Chemistry, University of California, Irvine, United States
- Institute for Memory Impairments and Neurological Disorders, University of California, Irvine, United States
- Department of Molecular Biology and Biochemistry, University of California, Irvine, United States
Figures
Figure 1
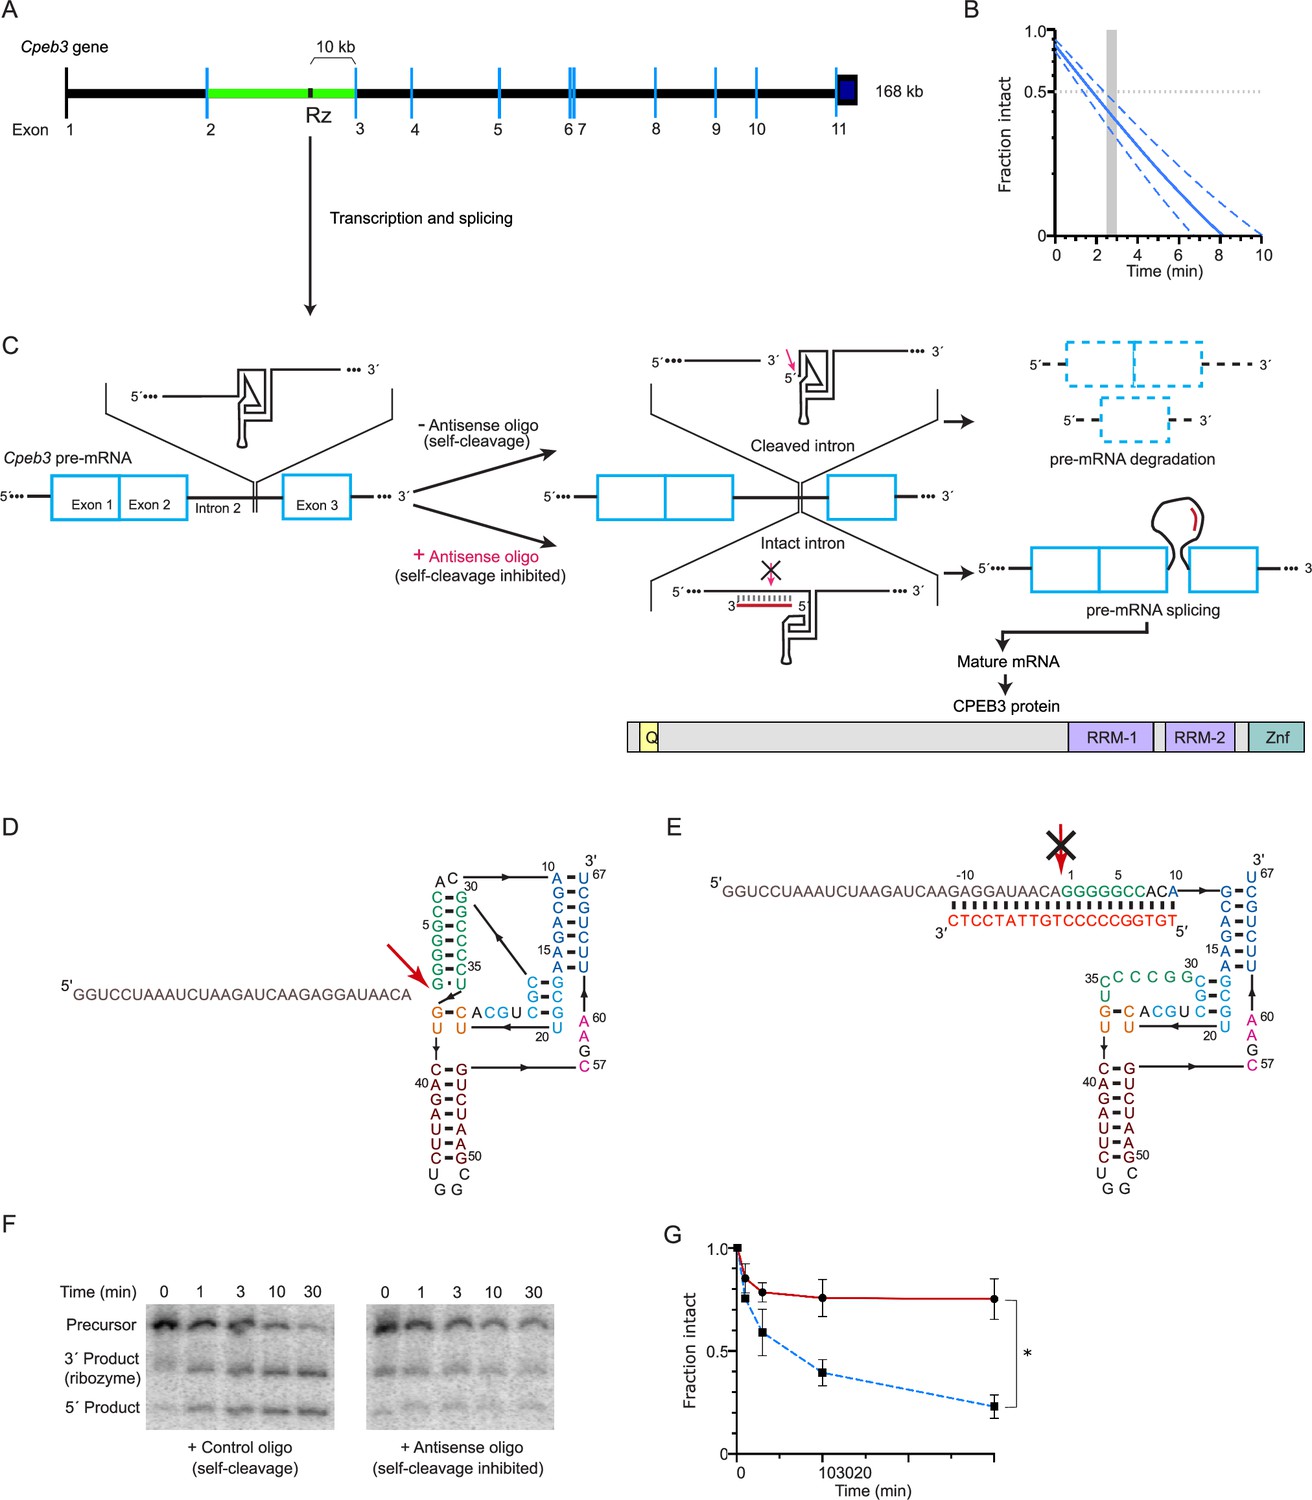
Cpeb3 gene structure and activity of its intronic self-cleaving ribozyme.
(A) Schematic representation of mouse Cpeb3 gene. Rz denotes the location of the self-cleaving ribozyme in the second intron (green) between the second and third exons. (B) Co-transcriptional self-cleavage activity of a 470-nt construct, incorporating the 72-nt ribozyme, which cuts the transcript 233 nts from the 5′ terminus (see Table 1 for kinetic parameters of this and other constructs). Log-linear graph of self-cleavage is shown with a solid blue line (dashed lines show ± standard deviation). Gray dotted line indicates midpoint of self-cleavage (with resulting t1/2 of ~2 min). Gray bar indicates the approximate time range for RNAPII to travel from the ribozyme to the third exon, at which point ~40% of the intron would remain intact. (C) Inhibition of the Cpeb3 ribozyme by an antisense oligonucleotide (ASO) targeting its cleavage site and the resulting effect on the levels of the spliced mRNA and the encoded protein. (D) Secondary structure of the ribozyme (colored by structural elements; Webb and Lupták, 2011). Sequence upstream of the ribozyme is shown in gray, and the site of self-scission is shown with a red arrow. (E) Model of the ribozyme inhibited by the ASO (red letters) showing base-pairing between the ASO and 10 nts upstream and downstream of the ribozyme cleavage site. Inhibition of self-scission is indicated by crossed arrow (C, E). (F) Inhibition of Cpeb3 ribozyme self-scission in vitro in the presence of ASO. Scrambled or ASO (1 µM) were added during co-transcriptional self-cleavage reactions. (G) Fraction intact values were calculated and plotted vs. time. Significant inhibition of co-transcriptional self-scission by the ASO (red line, compared with control oligo shown in blue), resulting in increase of intact RNA (F, G), is observed at the 3 min time point relevant to the transcription of the Cpeb3 gene (A, B) (unpaired t-test, t(3.599) = 8.204, p=0.0019, *p<0.05; n = 2: control, n = 4: ASO). Data are presented as mean ± SEM.
-
Figure 1—source data 1
Source data for Figure 1B, F, and G.
- https://cdn.elifesciences.org/articles/90116/elife-90116-fig1-data1-v2.zip
-
Figure 1—source data 2
Full raw unedited PAGE images.
- https://cdn.elifesciences.org/articles/90116/elife-90116-fig1-data2-v2.zip
Figure 2 with 1 supplement
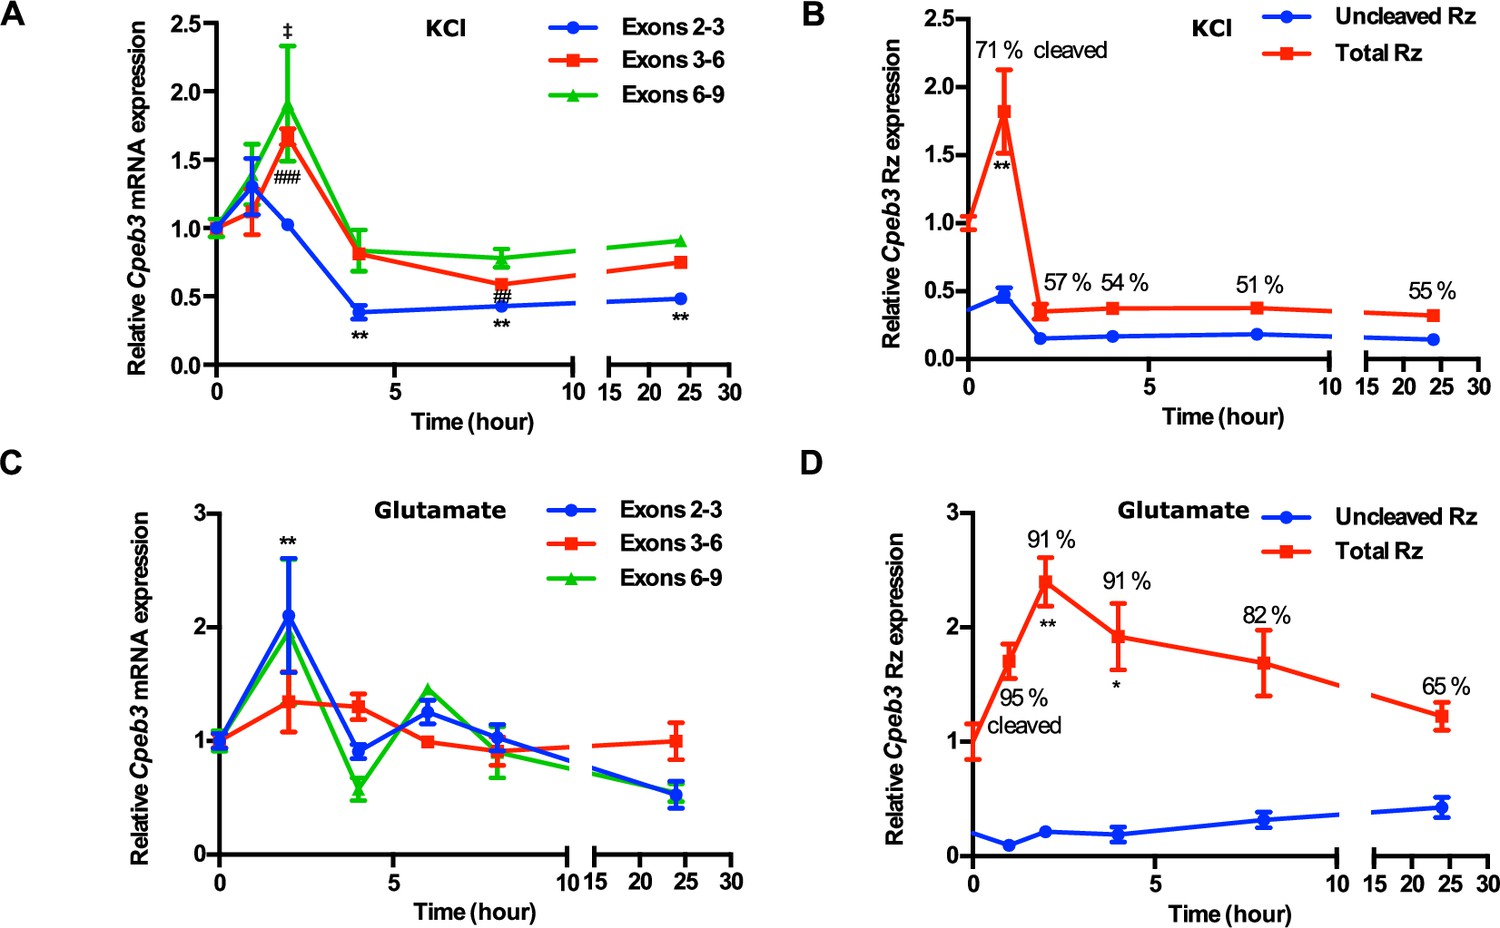
Cpeb3 expression in primary cortical neurons (DIV14).
(A) KCl stimulation profile of the Cpeb3 gene showing induction of spliced Cpeb3 exons (one-way ANOVA, exons 2–3: F(5,12) = 18.02, p<0.0001, Šidák’s post hoc tests,*p<0.05, **p<0.01; exons 3–6: F(5,12) = 25.48, p<0.0001, Šidák’s post hoc tests, ##p<0.01, ###p<0.001; exons 6–9: F(5,12) = 4.376, p=0.0168, Šidák’s post hoc tests, ‡p<0.05. n = 3). (B) KCl stimulation profile of Cpeb3 ribozyme expression (uncleaved and total). Cleaved ribozyme fraction is calculated as [(total ribozyme – uncleaved ribozyme)/total ribozyme] and shown as % cleaved (one-way ANOVA, F(5,17) = 12.96, p<0.0001, Šidák’s post hoc tests, **p<0.01. n = 6, 6, 3, 3, 3, 3). (C) Expression of Cpeb3 mRNA exons 2–3 is upregulated 2 hr after glutamate stimulation (one-way ANOVA: exons 2–3: F(5,21) = 5.826, p=0.0016, Šidák’s post hoc tests, **p<0.01; exons 3–6: F(5,22) = 2.002, p=0.1181; exons 6–9: F(5,22) = 1.763, p=0.1622. n = 6, 4, 4, 4, 6, 3). (D) Glutamate stimulation induces an increase in Cpeb3 ribozyme levels at 2 hr time point (one-way ANOVA, F(5,26) = 4.657, p=0.0036, Šidák’s post hoc test. *p<0.05, **p<0.01. n = 9, 4, 4, 6, 6, 3). Data are presented as mean ± SEM.
-
Figure 2—source data 1
Tabulated data for Figure 2.
- https://cdn.elifesciences.org/articles/90116/elife-90116-fig2-data1-v2.xlsx
Figure 2—figure supplement 1

Transcriptome analysis of Cpeb3 gene in the mouse hippocampus.
Analysis of the GSE125068 nuRNA-seq dataset for the Cpeb3 induction in the mouse hippocampus following kainic acid administration (Fernandez-Albert et al., 2019). (A) Kainic acid induces expression of Cpeb3 transcripts in mouse hippocampus at 1 hr (note that the gene direction is right-to-left). (B) Cpeb3 ribozyme is expressed as part of the intron. The abrupt boundary of the nuRNA-seq reads next to the site of self-scission suggests that the ribozyme self-cleaves co-transcriptionally.
Figure 3
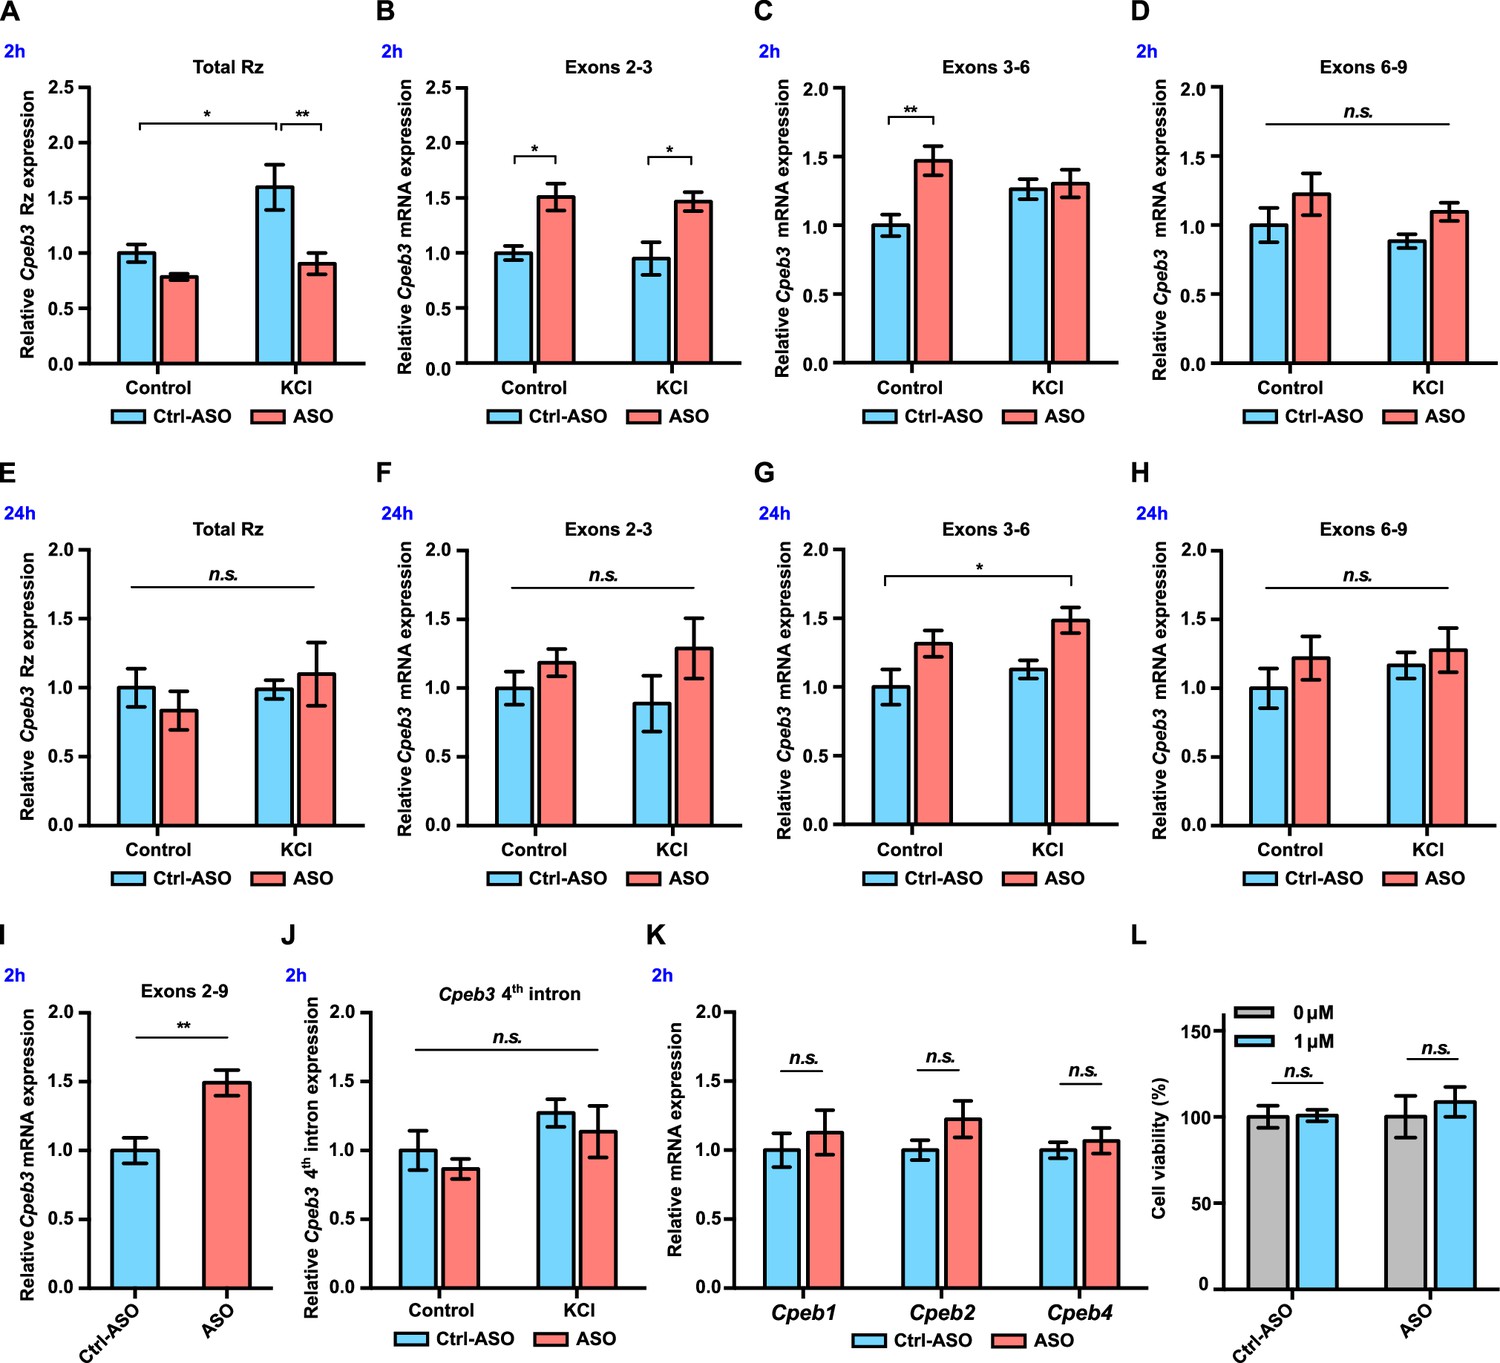
Cpeb3 mRNA is upregulated in primary neuronal cultures (DIV14) treated with ribozyme antisense oligonucleotide (ASO).
(A) Cpeb3 ribozyme levels increase together with levels of the surrounding exons 2 hr post-stimulation in experiments with control ASO. Ribozyme levels are significantly lower in ribozyme ASO experiments, suggesting that the RT-PCR reaction is blocked by the ASO (two-way ANOVA with Šidák’s post hoc tests, significant main effect of KCl: F(1,19) = 8.058, p=0.0105; significant effect of ASO: F(1,19) = 12.88, p=0.0020; no significant interaction: F(1,19) = 3.557, p=0.0747. n = 6). (B) Ribozyme inhibition by ASO resulted in upregulation of Cpeb3 (exons 2–3) mRNA (two-way ANOVA with Šidák’s post hoc tests, significant ASO × KCl interaction: F(1,19) = 5.726, p=0.0272; significant effect of ASO: F(1,19) = 8.042, p=0.0106; no significant effect of KCl: F(1,19) = 0.2922, p=0.5951. n = 6). (C) Inhibition of Cpeb3 ribozyme by ASO resulted in upregulation of Cpeb3 mRNA basal levels for exons 3–6 at the 2 hr time point (two-way ANOVA with Šidák’s post hoc tests, significant ASO × KCl interaction: F(1,19) = 5.726, p=0.0272; significant effect of ASO: F(1,19) = 8.042, p=0.0106; no significant effect of KCl: F(1,19) = 0.2922, p=0.5951 n = 6). (D) Levels of exons 6–9 did not increase significantly at the 2 hr time point (two-way ANOVA with Šidák’s post hoc tests, no significant effect of KCl: F(1,19) = 1.218, p=0.2835, no significant effect of ASO: F(1,19) = 3.919, p=0.0624, and no significant interaction: F(1,19) = 0.002317, p=0.9621). (E) No statistically significant difference in Cpeb3 ribozyme expression was observed after 24 hr post KCl induction, suggesting that all intronic RNA levels reached basal levels (two-way ANOVA with Šidák’s post hoc tests, no significant effect of KCl: F(1,18) = 0.7897, p=0.3859, no significant effect of ASO: F(1,18) = 0.03687, p=0.8499, and no significant interaction: F(1,18) = 0.9533, p=0.3418. n = 6). (F–H) Cpeb3 mRNA expression largely returned to the basal level 24 hr post-stimulation, although levels of spliced exons 3–6 remained elevated. (F) Exons 2–3, two-way ANOVA with Šidák’s post hoc tests, no significant effect of KCl: F(1,19) = 0.0004856, p=0.9826; no significant effect of ASO: F(1,19) = 3.188, p=0.0902, and no significant interaction: F(1,19) = 0.4343, p=0.5178; n = 6. (G) Exons 3–6, two-way ANOVA with Šidák’s post hoc tests, significant effect of ASO: F(1,19) = 11.48, p=0.0031; no significant effect of KCl: F(1,19) = 2.252, p=0.1499; no significant interaction: F(1,19) = 0.04047, p=0.8417. n = 6. (H) Exons 6–9, two-way ANOVA with Šidák’s post hoc tests, no significant effect of KCl: F(1,19) = 0.6316, p=0.4366; no significant effect of ASO: F(1,19) = 1.364, p=0.2573, and no significant interaction: F(1,19) = 0.1475, p=0.7052. n = 6. (I) ASO treatment leads to an increase of Cpeb3 full-length mRNA (exons 2–9, unpaired t-test, t(10.00)=3.774, p=0.0036. n = 6). (J) qRT-PCR analysis of Cpeb3 fourth intron expression reveals that the ribozyme ASO does not affect its levels, suggesting that it is specific for the ribozyme (two-way ANOVA with Šidák’s post hoc tests, no significant effect of KCl: F(1,18) = 4.187, p=0.0566; no significant effect of ASO: F(1,18) = 1.032, p=0.3232; no significant interaction: F(1,18) = 0.00001455, p=0.9970. n = 6). (K) Cpeb3 ribozyme ASO does not alter Cpeb1, Cpeb2, and Cpeb4 mRNA expression, demonstrating the specificity of the ASO (Cpeb1: t(8,777) = 0.6338, p=0.5423; Cpeb2: t(7,768) = 1.491, p=0.1753; Cpeb4: t(8.270) = 0.6268, p=0.5477; unpaired t-test. n = 6). (L) Effect of ASO treatment on cell viability. XTT assay was performed after 18 hr incubation of ASOs. Relative cell viability was normalized to the vehicle control (t(2.986) = 0.1257, p=0.9079; ASO: t(5.437) = 0.5869, p=0.5808; unpaired t-test. n = 4). *p<0.05, **p<0.01, n.s. not significant. Data are presented as mean ± SEM.
-
Figure 3—source data 1
Tabulated data for Figure 3.
- https://cdn.elifesciences.org/articles/90116/elife-90116-fig3-data1-v2.xlsx
Figure 4
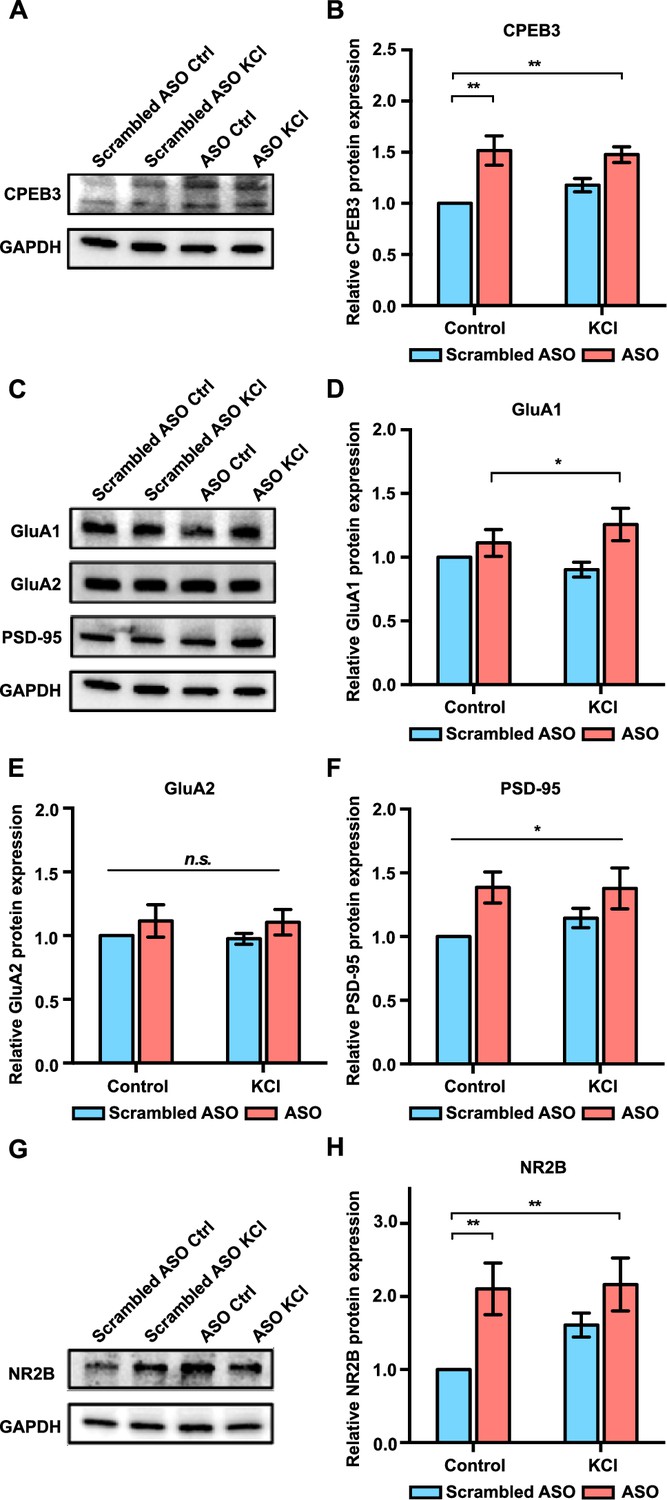
Effect of Cpeb3 ribozyme antisense oligonucleotide (ASO) on protein expression in cultured cortical neurons (DIV7).
(A) Effect of Cpeb3 ribozyme ASO on CPEB3 protein expression. Representative image of CPEB3 protein expression. GAPDH is used as a loading control. (B) Quantification of CPEB3 protein expression. Treatment of ASO followed by KCl stimulation led to an increase of CPEB3 (two-way ANOVA with Šidák’s post hoc tests, significant effect of ASO: F(1,24) = 21.68, p<0.0001; no significant effect of KCl: F(1,24) = 0.6204, p=0.4386; no significant interaction: F(1,24) = 1.556, p=0.2243. n = 7). (C) Representative immunoblotting image of GluA1, GluA2, and PSD-95 protein expression. GAPDH is used as a loading control. (D) Quantification of GluA1 protein expression. GluA1 is upregulated in the presence of ASO combined with neuronal stimulation (two-way ANOVA with Šidák’s post hoc tests, significant effect of ASO: F(1,24) = 7.134, p=0.134; no significant effect of KCl: F(1,24) = 0.07449, p=0.7872; and no significant interaction: F(1,24) = 1.911, p=0.1796. n = 7). (E) Quantification of GluA2 protein expression. No significant difference was observed between ASO and KCl groups (two-way ANOVA with Šidák’s post hoc tests, no significant effect of ASO: F(1,24) = 2.149, p=0.1556; no significant effect of KCl: F(1,24) = 0.04578, p=0.8324; and no significant interaction: F(1,24) = 0.006228, p=0.9358. n = 7) (F) Treatment with ASO leads to an increase of PSD-95 protein level in primary cortical neurons (two-way ANOVA with Šidák’s post hoc tests, significant effect of ASO: F(1,24) = 8.213, p=0.0085; no significant effect of KCl: F(1,24) = 0.4082, p=0.5290; and no significant interaction: F(1,24) = 0.5106, p=0.4818. n = 7). (G) Representative images of immunoblotting analysis showing NR2B protein expression. GAPDH is used as a loading control. (H) Quantification of NR2B protein expression. ASO treatment induces an increase in NR2B expression (two-way ANOVA with Šidák’s post hoc tests, significant effect of ASO: F(1,19) = 10.40, p=0.0045; no significant effect of KCl: F(1,19) = 1.791, p=0.2078; and no significant interaction: F(1,19) = 1.444, p=0.2982. n = 6). *p<0.05, **p<0.01, n.s. not significant. Data are presented as mean ± SEM.
-
Figure 4—source data 1
Uncropped western blot images and tabulated data for Figure 4.
- https://cdn.elifesciences.org/articles/90116/elife-90116-fig4-data1-v2.zip
-
Figure 4—source data 2
Full raw unedited images.
- https://cdn.elifesciences.org/articles/90116/elife-90116-fig4-data2-v2.zip
Figure 5
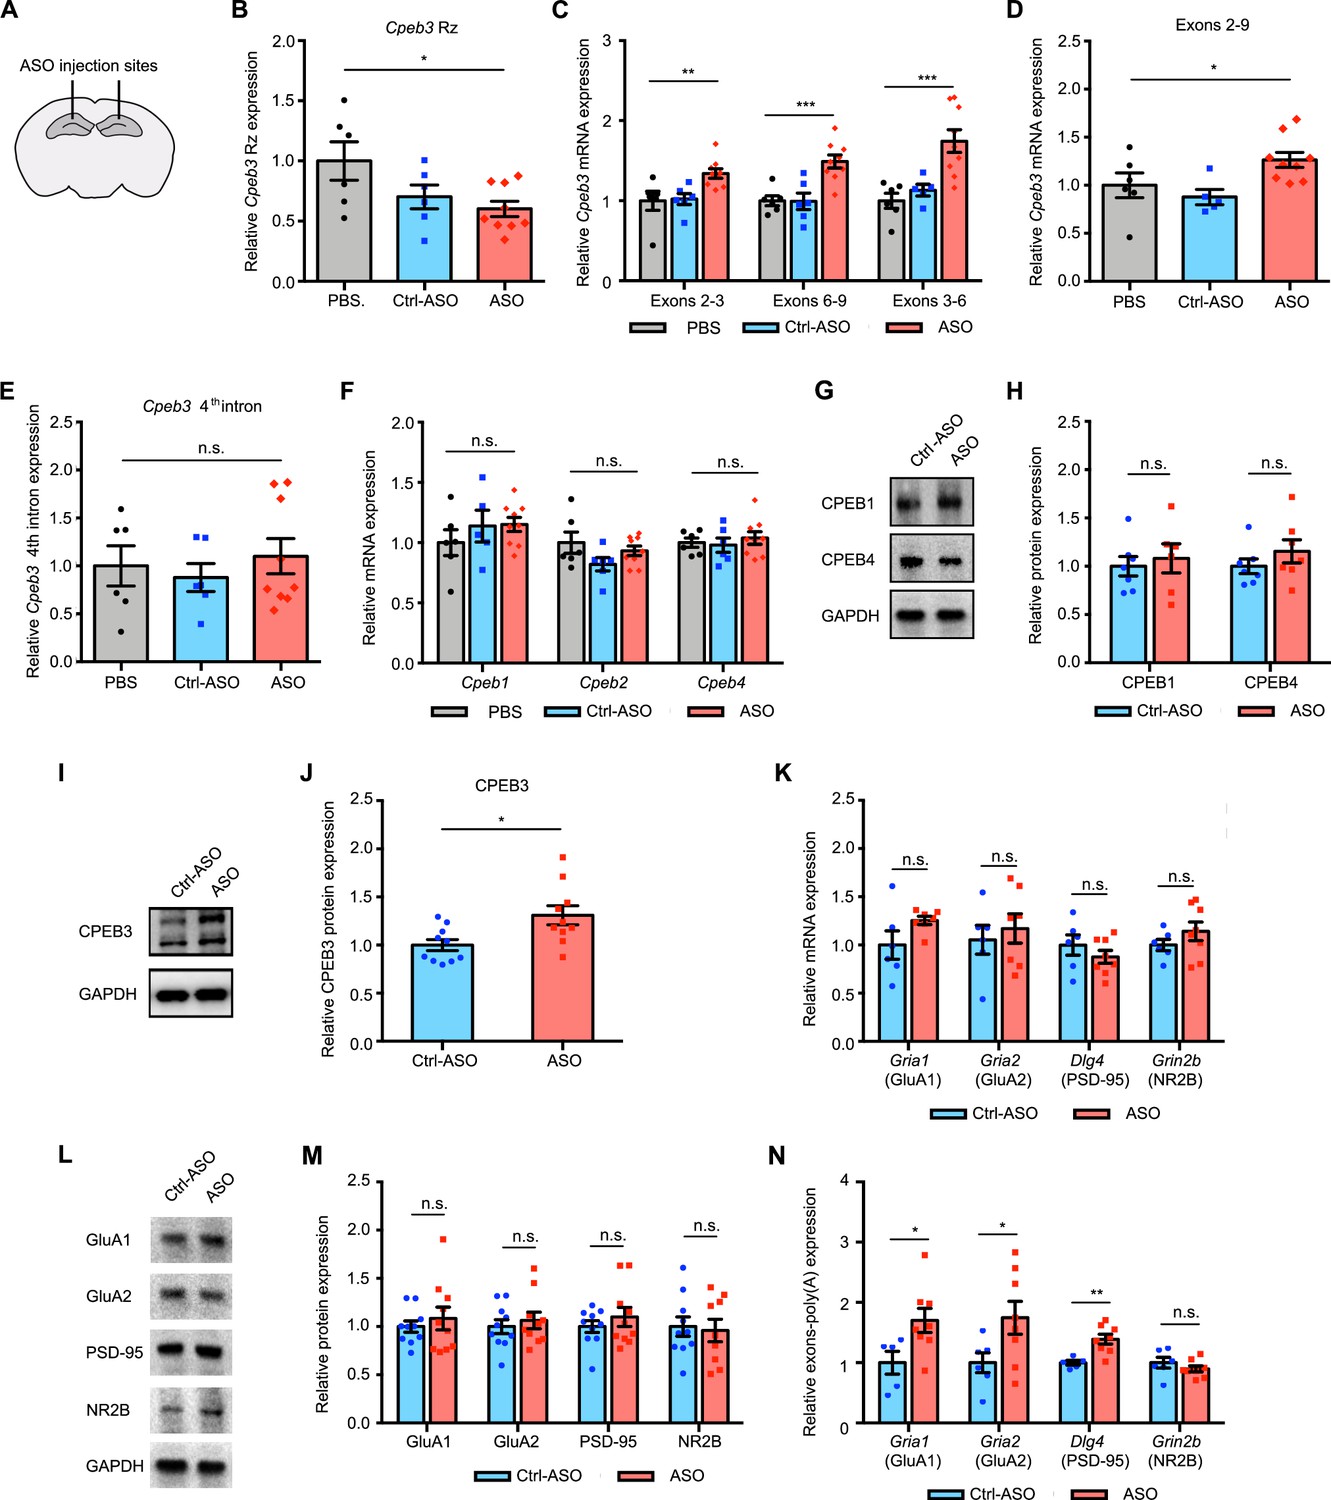
Cpeb3 ribozyme antisense oligonucleotide (ASO) leads to an increase of Cpeb3 mRNA and polyadenylation of plasticity-related proteins (PRPs) in the CA1 hippocampus.
(A) Schematic representation of stereotaxic procedure. ASO, Ctrl-ASO, or vehicle was bilaterally infused to the mouse CA1 hippocampus. (B) Administration of Cpeb3 ribozyme ASO to the mouse CA1 hippocampus leads to a decrease in Cpeb3 ribozyme levels (one-way ANOVA with Šidák’s post hoc tests; F(2,18) = 3.901, p=0.0391. n = 6 [vehicle], 6 [Ctrl-ASO], 9 [ASO]). (C) Cpeb3 mRNA expression is upregulated in the Cpeb3 ribozyme ASO treatment group compared to controls (one-way ANOVA with Šidák’s post hoc tests; exons 2–3: F(2,18) = 6.199, p=0.0089; exons 3–6: F(2,18) = 12.44, p=0.0004; exons 6–9: F(2,17) = 11.03, p=0.0008; n = 6, 6, 9). (D) Cpeb3 full-length mRNA (exons 2–9) is significantly elevated in the presence of ASO (one-way ANOVA with Šidák’s post hoc tests; F(2,17) = 4.385, p=0.0291 n = 6, 6, 9). (E) The Cpeb3 ribozyme ASO has high specificity for its cleavage site (in the third intron) in vivo. qRT-PCR analysis of the fourth intron of Cpeb3 gene demonstrates no significant difference between controls and ASO groups (one-way ANOVA with Šidák’s post hoc tests; F(2,18) = 0.3663, p=0.6984. n = 6, 6, 9). (F) qRT-PCR analysis reveals no significant difference between controls and ASO groups in Cpeb1, Cpeb2, and Cpeb4 mRNA expression (Cpeb1 mRNA: F(2,18) = 0.8203, p=0.4570; Cpeb2 mRNA: F(2,18) = 2.002, p=0.1641; Cpeb4 mRNA: F(2,18) = 0.3562, p=0.7052. n = 6, 6, 9). (G) Effect of Cpeb3 ribozyme on CPEB1 and CPEB4 protein expression. GAPDH is used as a loading control. (H) Quantification of CPEB1 and CPEB4 protein expression. Cpeb3 ribozyme ASO does not change CPEB1 and CPEB4 protein expression (CPEB1 protein: t(8.942) = 0.4469, p=0.6656; CPEB4 protein: t(10.24) = 1.089, p=0.3012. n = 7). (I) Effect of Cpeb3 ribozyme on CPEB3 protein expression. Representative image of immunoblotting analysis. GAPDH is used as a loading control. (J) Quantification of CPEB3 protein expression. Cpeb3 ribozyme ASO leads to an increase of CPEB3 protein expression in the CA1 hippocampus (t(14.50) = 2.709, p=0.0165; unpaired t-test. n = 10) (L, M). (K) Inhibition of Cpeb3 ribozyme does not affect transcription of other plasticity-related genes. qRT-PCR analysis of mature GluA1, GluA2, PSD-95, and NR2B mRNAs. No significant difference between ASO and control was observed for splice junctions within the mRNAs, showing that modulation of the Cpeb3 ribozyme does not affect transcription or splicing of these mRNAs (GluA1: t(5.848) = 1.655, p=0.1503; GluA2: t(10.96) = 0.5476, p=0.5949; PSD-95: t(8.760) = 0.9838, p=0.3516; NR2B: t(11.11) = 1.250, p=0.2369. n = 6–7). (L) Effect of Cpeb3 ribozyme on PRP protein expression. Representative images of immunoblotting analysis. GAPDH is used as a loading control. (M) Quantification of PRP protein expression. Blocking Cpeb3 ribozyme does not affect PCPs protein expression in the naïve state (GluA1: t(13.18) = 0.6339, p=0.5370; GluA2: t(17.54) = 0.5755, p=0.5723; PSD-95: t(14.94) = 0.8612, p=0.4027; NR2B: t(16.34) = 0.2604, p=0.7978; unpaired t-test. n = 10). (N) Inhibition of Cpeb3 ribozyme resulted in increased polyadenylation of plasticity-related genes (Gria1: t(10.44) = 2.535, p=0.0287; Gria2: t(11.02) = 2.327, p=0.0400; Dlg4: t(9.808) = 4.254, p=0.0018; Grin2b: t(8.020) = 0.9846, p=0.3536; unpaired t-test. n = 6, 8). *p<0.05, **p<0.01, ***p<0.001, n.s. not significant. Data are presented as mean ± SEM.
-
Figure 5—source data 1
Uncropped western blot images and tabulated data for Figure 5.
- https://cdn.elifesciences.org/articles/90116/elife-90116-fig5-data1-v2.zip
-
Figure 5—source data 2
Full raw unedited images.
- https://cdn.elifesciences.org/articles/90116/elife-90116-fig5-data2-v2.zip
Figure 6
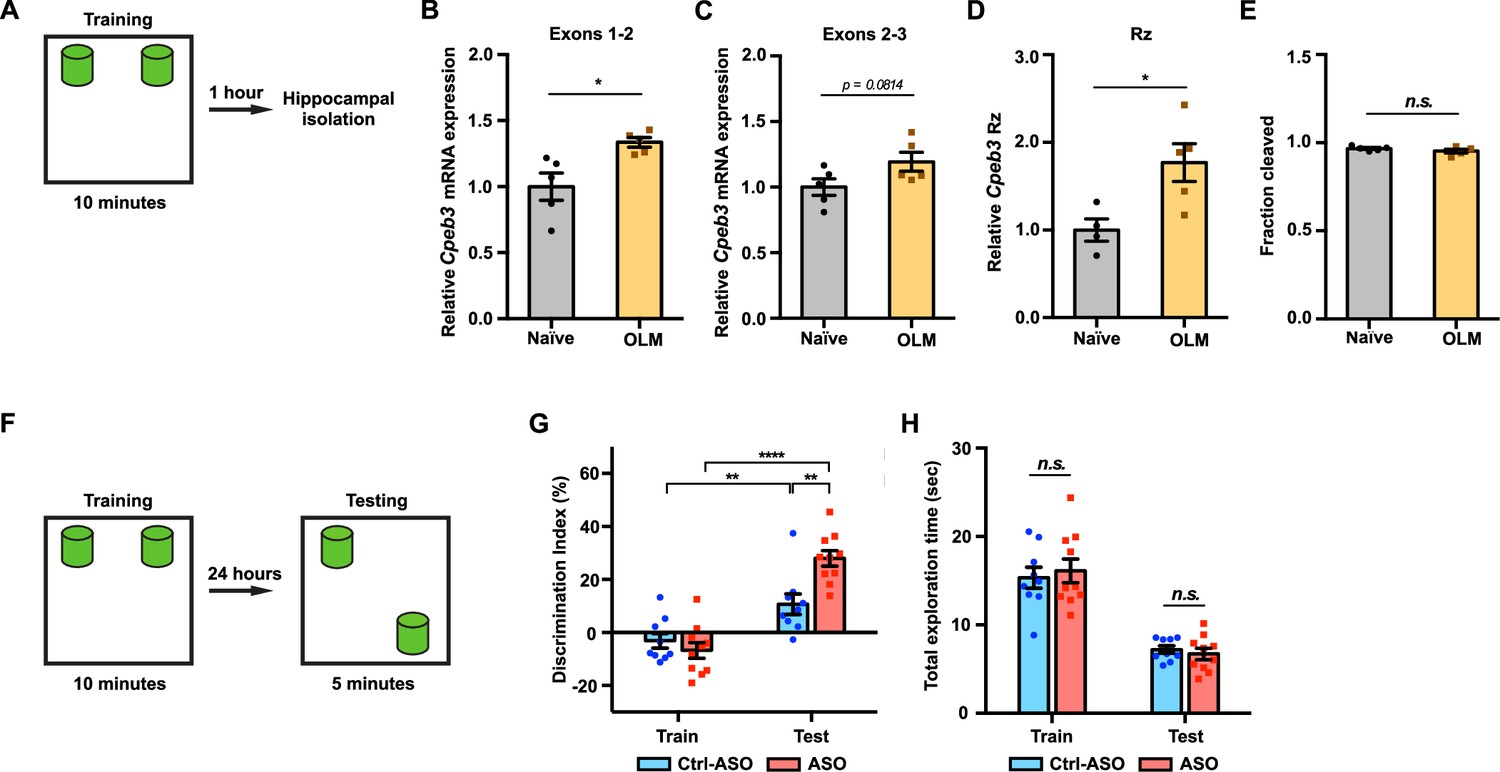
Inhibition of Cpeb3 ribozyme enhances long-term object location memory (OLM).
(A) Schematic representation of how the hippocampal gene expression is examined after OLM training task. (B) OLM training induces expression of Cpeb3 mRNA exons 1–2 in the CA1 hippocampus (t(4.991) = 3.085, p=0.0274. n = 5). (C) OLM training induces a slight upregulation of Cpeb3 mRNA exons 2–3 in the CA1 hippocampus (t(7.895) = 1.997, p=0.0814. n = 5). (D) The Cpeb3 ribozyme expression is elevated in OLM-trained mice compared to naïve mice (t(6.266) = 3.067, p=0.0208. n = 5). (E) The cleaved fraction of the Cpeb3 ribozyme showed no significant differences between OLM-trained and naïve mice (t(6.256) = 1.234, p=0.2616. n = 5). (F) Experimental procedure testing long-term memory. (G) Mice infused with Ctrl-ASO or Cpeb3 ribozyme antisense oligonucleotide (ASO) showed no preference for either object in OLM training. Mice infused with Cpeb3 ribozyme ASO show significant discrimination index in OLM testing (ASO × session interaction F(1,34) = 11.06, p=0.0021; two-way ANOVA with Šidák’s post hoc tests. n = 10). (H) Cpeb3 ribozyme ASO and control mice display similar total exploration time (train: t(17.00) = 0.2342, p=0.8176; test: t(13.48) = 1.644, p=0.1232; unpaired t-test. n = 10). *p<0.05, **p<0.01, ****p<0.0001, n.s. not significant. Data are presented as mean ± SEM.
-
Figure 6—source data 1
Tabulated data for Figure 6.
- https://cdn.elifesciences.org/articles/90116/elife-90116-fig6-data1-v2.xlsx
Figure 7
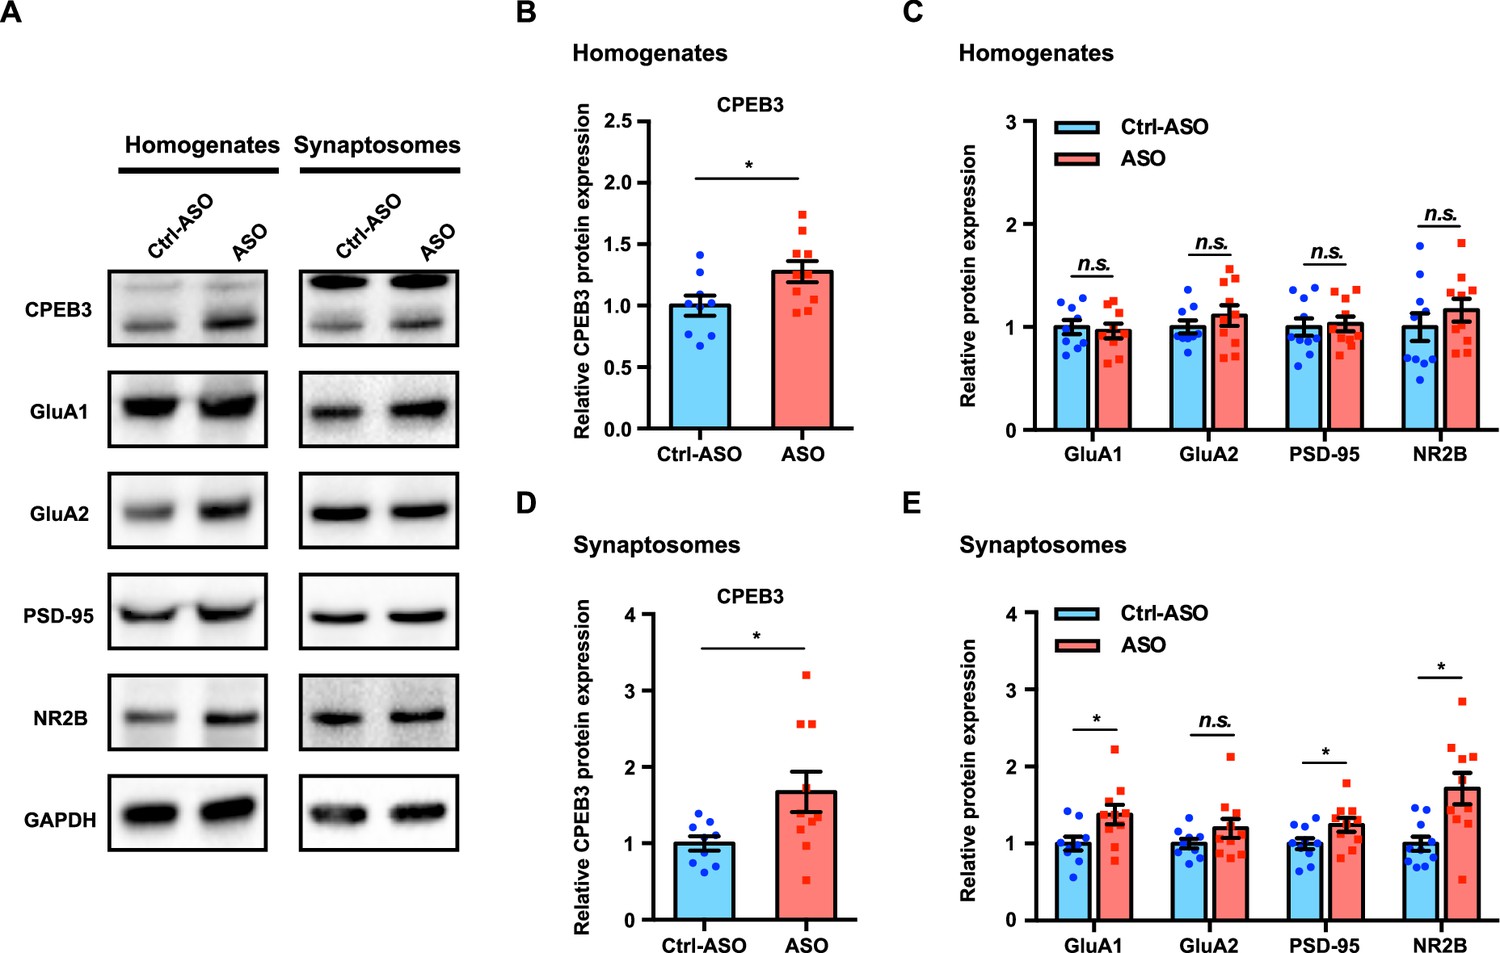
Inhibition of Cpeb3 ribozyme leads to upregulation of CPEB3 and plasticity-related protein (PRP) expression after object location memory (OLM).
(A) Representative images of immunoblotting analysis. GAPDH is used as a loading control. (B, C) Quantification of CPEB3 (B) and PRPs (C) in tissue homogenates shows increased expression of CPEB3 but not of PRPs (CPEB3: t(17.00) = 2.345, p=0.0314; GluA1: t(15.96) = 0.3751, p=0.7125; GluA2: t(15.16) = 0.9432, p=0.3604; PSD-95: t(17.63) = 0.2849, p=0.7790; NR2B: t(17.32) = 0.9415, p=0.3594; unpaired t-test. n = 10). (D, E) In synaptosomes, the protein expression of both CPEB3 (D) and PRPs (E) is increased (CPEB3: t(11.11) = 2.403, p=0.0349; GluA1: t(15.83) = 2.433, p=0.0272; GluA2: t(14.40) = 1.497, p=0.1559; PSD-95: t(17.25) = 2.115, p=0.0493; NR2B: t(12.42) = 3.174, p=0.0077; unpaired t-test. n = 10). *p<0.05, n.s. not significant. Data are presented as mean ± SEM.
-
Figure 7—source data 1
Uncropped western blot images and tabulated data for Figure 7.
- https://cdn.elifesciences.org/articles/90116/elife-90116-fig7-data1-v2.zip
-
Figure 7—source data 2
Full raw unedited images.
- https://cdn.elifesciences.org/articles/90116/elife-90116-fig7-data2-v2.zip
Tables
Table 1
Kinetic parameters of murine Cpeb3 ribozyme constructs†.
| Construct* | A | k1 | B | k2 | C |
|---|---|---|---|---|---|
| –10/72 | 0.72 ± 0.09 | 0.39 ± 0.09 | 0.082 ± 0.026 | ||
| –49/72/165 | 0.88 ± 0.02 | 0.42 ± 0.04 | 0.013 ± 0.015 | 0.11 ± 0.03 | 0.04 ± 0.02 |
| –233/72/165 | 0.78 ± 0.04 | 0.31 ± 0.04 | 0.035 ± 0.006 | 0.17 ± 0.02 | 0.029 ± 0.005 |
-
*
Construct size is defined as (length of sequence upstream of the ribozyme cleavage site)/[Cpeb3 ribozyme (72 nts)]/(downstream sequence).
-
†
Co-transcriptional self-scission was modeled by a bi-exponential decay model with a residual. A and B represent fractions of the population cleaving with fast (k1) and slow (k2) rate constants, cleave. Errors represent SEM of at least three experiments. For the smallest ribozyme construct (-10/72), a monoexponential decay function was sufficient to model the data.
Key resources table
| Reagent type (species) or resource | Designation | Source or reference | Identifiers | Additional information |
|---|---|---|---|---|
| Strain, strain background (Mus musculus) | C57/BL6J | The Jackson Laboratory | Strain # 000664 | |
| Antibody | Anti-CPEB3 (rabbit polyclonal) | Abcam | Cat# ab18833 | 1:1000 |
| Antibody | Anti-GluA1 (mouse monoclonal) | UC Davis/NIH NeuroMab Facility | Cat# 75-327 | 1:1000 |
| Antibody | Anti-GluA2 (rabbit polyclonal) | Proteintech | Cat# 11994-1-AP | 1:2000 |
| Antibody | Anti-PSD-95 (rabbit polyclonal) | Proteintech | Cat# 20665-1-AP | 1:2000 |
| Antibody | Anti-NR2B (rabbit polyclonal) | Proteintech | Cat# 21920-1-AP | 1:2000 |
| Antibody | Anti-GAPDH (mouse monoclonal) | Proteintech | Cat# 60004-1-Ig | 1:10,000 |
| Antibody | Anti-CPEB4 (rabbit polyclonal) | Proteintech | Cat# 25342-1-AP | 1:1000 |
| Antibody | Anti-CPEB1 (rabbit polyclonal) | Abclonal | Cat# A5913 | 1:1000 |
| Antibody | Anti-rabbit HRP (donkey) | Thermo Fisher Scientific | Cat# A16023 | 1:10,000 |
| Antibody | Anti-mouse HRP (goat) | R&D Systems | Cat# HAF007 | 1:1000 |
| Chemical compound, drug | Trizma hydrochloride solution | Sigma-Aldrich | Cat# T2319-1L | |
| Chemical compound, drug | DMSO | VWR | Cat# BDH1115-1LP | |
| Chemical compound, drug | Urea | Sigma-Aldrich | Cat# U5378-5KG | |
| Chemical compound, drug | Acrylamide | Thermo Fisher Scientific | Cat# BP1406-1 | |
| Chemical compound, drug | Triton X-100 | Sigma-Aldrich | Cat# T8787-100ML | |
| Chemical compound, drug | Tris Base | Thermo Fisher Scientific | Cat# BP152-500 | |
| Chemical compound, drug | TWEEN-20 | Sigma-Aldrich | Cat# P9416-100ML | |
| Chemical compound, drug | EDTA | Invitrogen | Cat# 15-575-020 | |
| Chemical compound, drug | [α-32P]ATP | PerkinElmer | Cat# BLU503H250UC | |
| Chemical compound, drug | Neurobasal medium | Thermo Fisher Scientific | Cat# 21103049 | |
| Chemical compound, drug | B27 supplement | Thermo Fisher Scientific | Cat# 17504044 | |
| Chemical compound, drug | Penicillin-streptomycin (10,000 U/mL) | Thermo Fisher Scientific | Cat# 15140122 | |
| Chemical compound, drug | l-Glutamine | Thermo Fisher Scientific | Cat# 25030081 | |
| Chemical compound, drug | Phosphate-buffered saline | Corning | Cat# 21030CV | |
| Chemical compound, drug | TRI reagent | Sigma-Aldrich | Cat# T9424 | |
| Chemical compound, drug | Poly d-lysine | Sigma-Aldrich | Cat# P6407-5MG | |
| Chemical compound, drug | l-Glutamic acid | Sigma-Aldrich | Cat# G1251-100G | |
| Chemical compound, drug | Potassium chloride | Sigma-Aldrich | Cat# P9541-1KG | |
| Chemical compound, drug | Trypan Blue | Corning | Cat# 25-900CI | |
| Chemical compound, drug | GlycoBlue Coprecipitant | Thermo Fisher Scientific | Cat# AM9515 | |
| Chemical compound, drug | 2-Mercaptoethanol | Sigma-Aldrich | Cat# M6250-100ML | |
| Chemical compound, drug | 10× Tris/Glycine/SDS | Bio-Rad | Cat# 1610732 | |
| Chemical compound, drug | 4× Laemmli Sample Buffer | Bio-Rad | Cat# 1610747 | |
| Chemical compound, drug | Restore Western Blot Stripping Buffer | Thermo Fisher Scientific | Cat# PI21059 | |
| Commercial assay or kit | Cell Viability and Proliferation Assays | Biotium | Cat# 30007 | |
| Commercial assay or kit | Pierce BCA Protein Assay Kit | Thermo Fisher Scientific | Cat# 23227 | |
| Commercial assay or kit | SuperSignal West Femto Substrate | Thermo Fisher Scientific | Cat# PI34094 | |
| Commercial assay or kit | RIPA Lysis Buffer System | Santa Cruz Biotechnology | Cat# sc-24948 | |
| Commercial assay or kit | iTaq Universal SYBR Green Supermix | Bio-Rad | Cat# 1725122 | |
| Commercial assay or kit | T7 RNA polymerase | New England Biolabs | Cat# M0251L | |
| Commercial assay or kit | M-MLV Reverse Transcriptase | Promega | Cat# M1701 | |
| Commercial assay or kit | RNase Inhibitor, Murine | New England Biolabs | Cat# M0314S | |
| Commercial assay or kit | DreamTaq PCR Master Mix (2×) | Thermo Fisher Scientific | Cat# K1072 | |
| Software, algorithm | Prism 9 | GraphPad | https://www.graphpad.com/features |
Table 2
List of primers used to make ribozyme constructs and measure RNA expression levels.
| Target | Sequence | |
|---|---|---|
| Cpeb3 exons 1-2 | Forward | CTCCCGTTTCCTTCCTCCAG |
| Reverse | GGGCTGGGTTTTGCTTTTGT | |
| Cpeb3 exons 2–3 | Forward | CGATAATGGTAACAATCTGTTGCC |
| Reverse | CCTTATCATATCCATTAAGGAGTTCTCC | |
| Cpeb3 exons 3–6 | Forward | GACCGGAGTAGGCCCTATGA |
| Reverse | CCAGACGATAAGGCCTGATCA | |
| Cpeb3 exons 6–9 | Forward | ACTCTAGAAAGGTGTTTGTTGGAGG |
| Reverse | TCGAAGGGGTCGTGGAACT | |
| Cpeb3 ribozyme cleaved (220 bp amplicon; 18 nts from the cleavage site) | Forward | GTTCACGTCGCGGCC |
| Reverse | GTGATATAGTGTGTTCTTCAGTGACTCCT | |
| Cpeb3 ribozyme uncleaved (283 bp amplicon starting 45 nts upstream and ending 238 nts downstream of the ribozyme cleavage site) | Forward | CCAAGCAGCAGCACAGGTC |
| Reverse | GTGATATAGTGTGTTCTTCAGTGACTCCT | |
| Cpeb3 fourth intron | Forward | CACTCTAGCCTAACTGGTGAGCTC |
| Reverse | AGTCATTCCAACAGAAATGAAGTACC | |
| Gria1 (GluA1) | Forward | GTCCGCCCTGAGAAATCCAG |
| Reverse | CTCGCCCTTGTCGTACCAC | |
| Gria2 (GluA2) | Forward | TGGTACGACAAAGGAGAGTGC |
| Reverse | ACCAGCATTGCCAAACCAAG | |
| Dlg4 (PSD-95) | Forward | TGAGATCAGTCATAGCAGCTACT |
| Reverse | CTTCCTCCCCTAGCAGGTCC | |
| Grin2b (NR2B) | Forward | GCCATGAACGAGACTGACCC |
| Reverse | GCTTCCTGGTCCGTGTCATC | |
| Cpeb1 | Forward | GACTCAGACACGAGTGGCTTCA |
| Reverse | ACGCCCATCTTTAGAGGGTCTC | |
| Cpeb2 | Forward | GAGATCACTGCCAGCTTCCGAA |
| Reverse | CAATGAGTGCCTGGACTGAGCT | |
| Cpeb4 | Forward | TCAGCTCCAGAAGTATGCTCGC |
| Reverse | GAGTGCATGTCAAACGTCCTGG | |
| Gapdh | Forward | TGACCACAGTCCATGCCATC |
| Reverse | GACGGACACATTGGGGGTAG |
Table 3
Primers used in 3' RACE.
| Target | Sequence |
|---|---|
| 3' RACE adaptor | CCAGTGAGCAGAGTGACGAGGACTCGAGCTCAAGCTTTTTTTTTTTTTTTTTTTT |
| 3' RACE outer primer | CCAGTGAGCAGAGTGACG |
| 3' RACE inner primer | GAGGACTCGAGCTCAAGC |
| Gria1 | GGTCCGCCCTGAGAGGTCCC |
| Gria1 nested | CCTGAGCAATGTGGCAGGCGT |
| Gria2 | GCTACGGCATCGCCACACCT |
| Gria2 nested | ATCCTTGTCGGGGGCCTTGGT |
| Dlg4 | GGCCACGAAGCTGGAGCAGG |
| Dlg4 nested | GGCCTGGACTCACCCTGCCT |
| Grin2b | GAGACGAAGGCTGCAAGCTGGT |
| Grin2b nested | CGCCAGGTGGACCTTGCTATCC |
Additional files
Download links
A two-part list of links to download the article, or parts of the article, in various formats.
Downloads (link to download the article as PDF)
Open citations (links to open the citations from this article in various online reference manager services)
Cite this article (links to download the citations from this article in formats compatible with various reference manager tools)
Inhibition of Cpeb3 ribozyme elevates CPEB3 protein expression and polyadenylation of its target mRNAs and enhances object location memory
eLife 13:e90116.
https://doi.org/10.7554/eLife.90116


