Tracing the substrate translocation mechanism in P-glycoprotein
- Osnabrück University, Department of Biology/Chemistry, Structural Biology Section, Germany
- Department of Structural Biology, Max Planck Institute of Biophysics, Germany
- Department of Integrative Structural and Computational Biology, The Scripps Research Institute, United States
- Osnabrück University, Center of Cellular Nanoanalytic Osnabrück (CellNanOs), Germany
- Department of Theoretical Biophysics, Max Planck Institute of Biophysics, Germany
- Department of Cell Biology and Biochemistry, Texas Tech University Health Sciences Center, United States
- Department of Chemistry & Environmental Science, New Jersey Institute of Technology, United States
- Institute for Biophysics, Goethe University Frankfurt, Germany
Figures
Figure 1 with 5 supplements
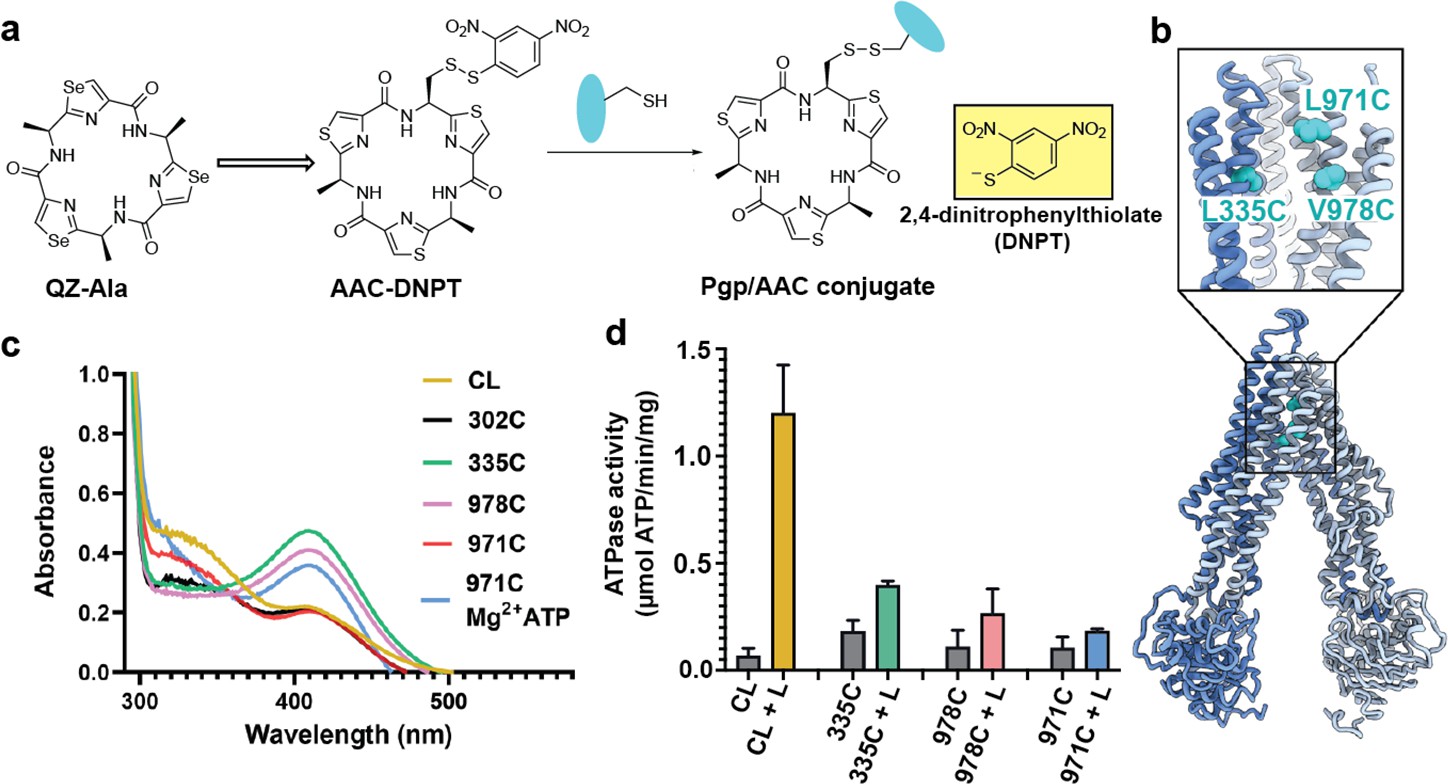
Covalent ligand design for P-glycoprotein (Pgp) transport studies.
(a) Design of AAC-DNPT, a derivative of the cyclic peptide QZ-Ala, for disulfide crosslinking with single-cysteine mutants of Pgp; yellow product DNPT used as readout. (b) Positions of L335 (TM6), V978, and L971 (TM12) in Pgp, residues targeted for cyclic peptide labeling. (c) Monitoring covalent reaction between AAC-DNPT and cysteine mutants (±Mg2+ ATP) by UV-visible spectrometry; CL-Pgp and I302C were included as negative controls. (d) ATPase activities of L335C, V978C, and L971C before and after crosslinking with AAC-DNPT; CL-Pgp was used as a control. Data are averaged from triplicate measurements with standard error bars.
Figure 1—figure supplement 1
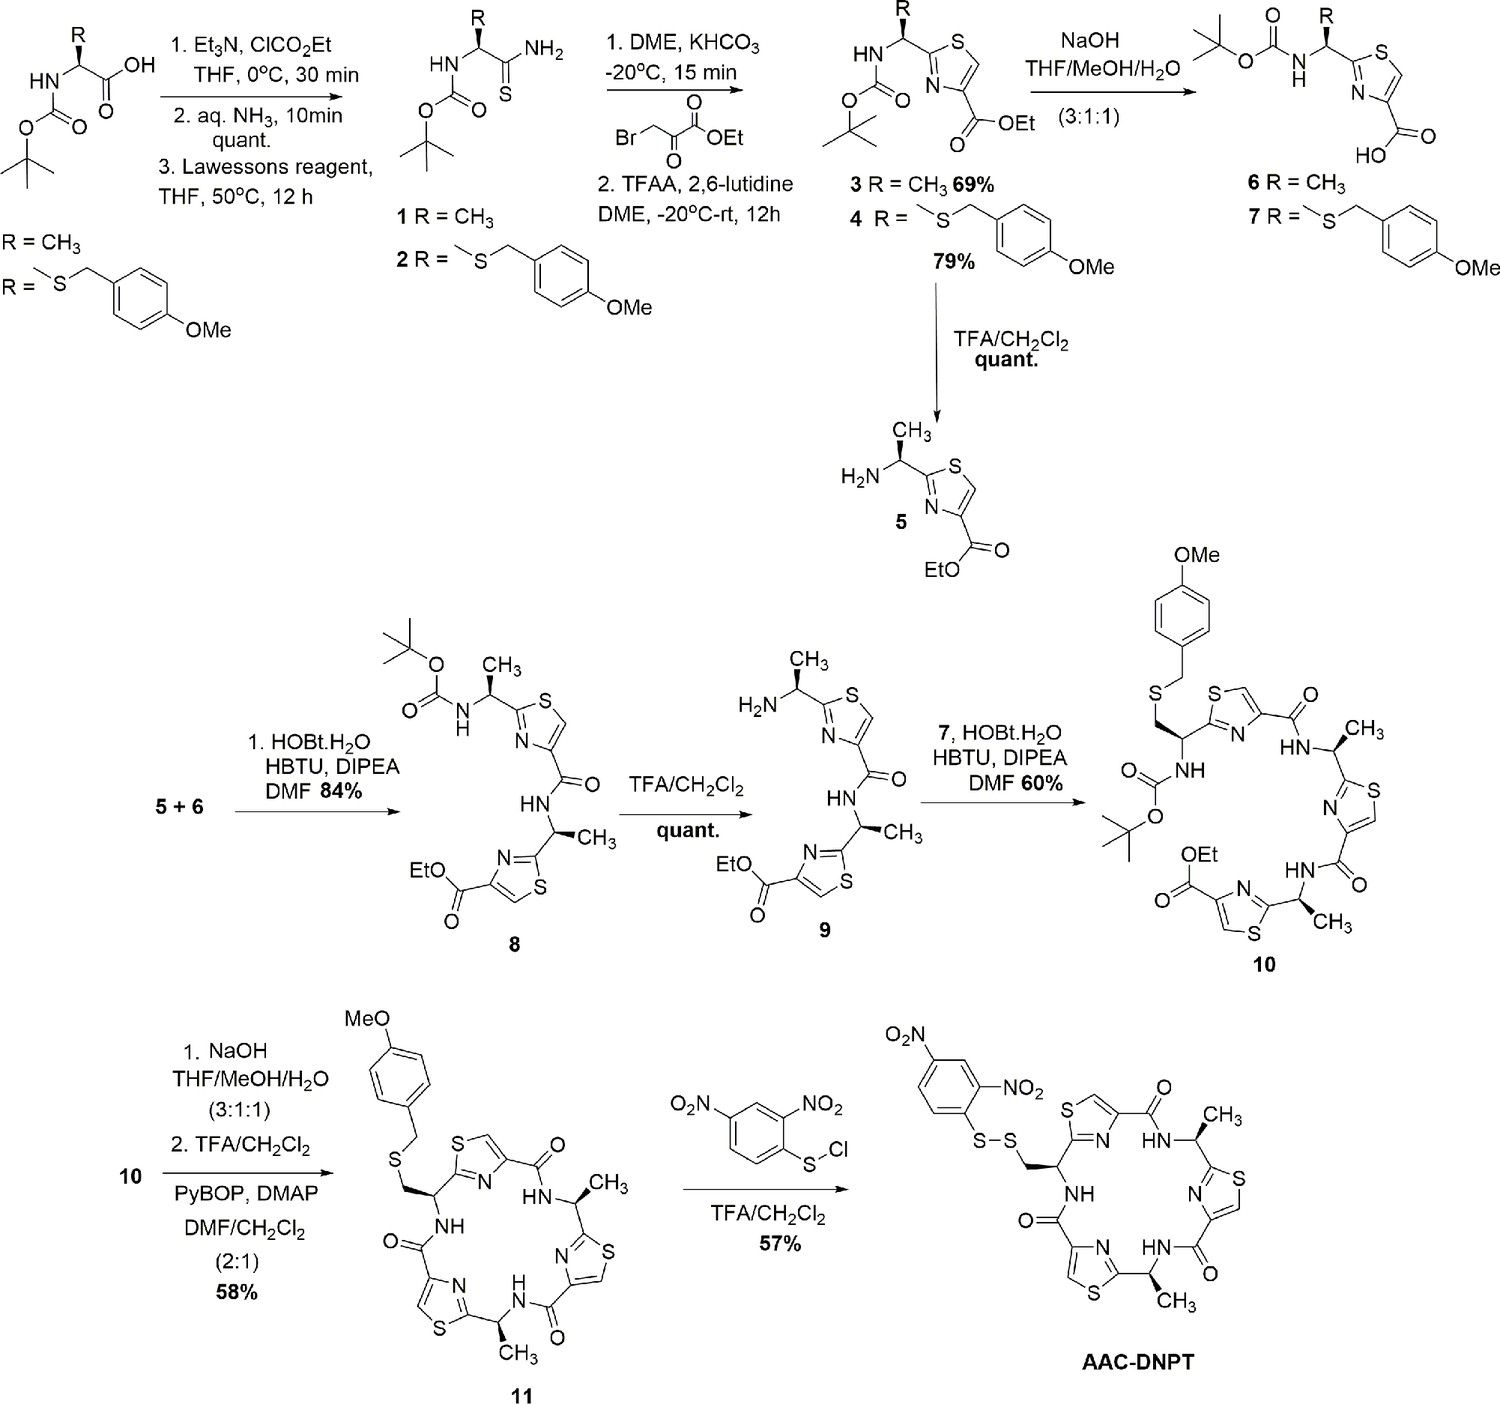
Chemical synthesis of AAC-DNPT.
Figure 1—figure supplement 2

MS detection of 335C peptide before and after AAC labeling.
Top: 335C peptide sequence. (a) LC-MS trace for the 335C peptide, with (b) measured and (c) simulated m/z ([335C+3H]3+). (d) LC-MS trace for the AAC-labeled 335C peptide, with (e) measured and (f) simulated m/z ([335C+L+3H]3+). The observed isotope peak distributions for unlabeled and labeled 335C peptides are in good agreement with the simulated peak distribution; mass errors are shown in the table underneath.
Figure 1—figure supplement 3
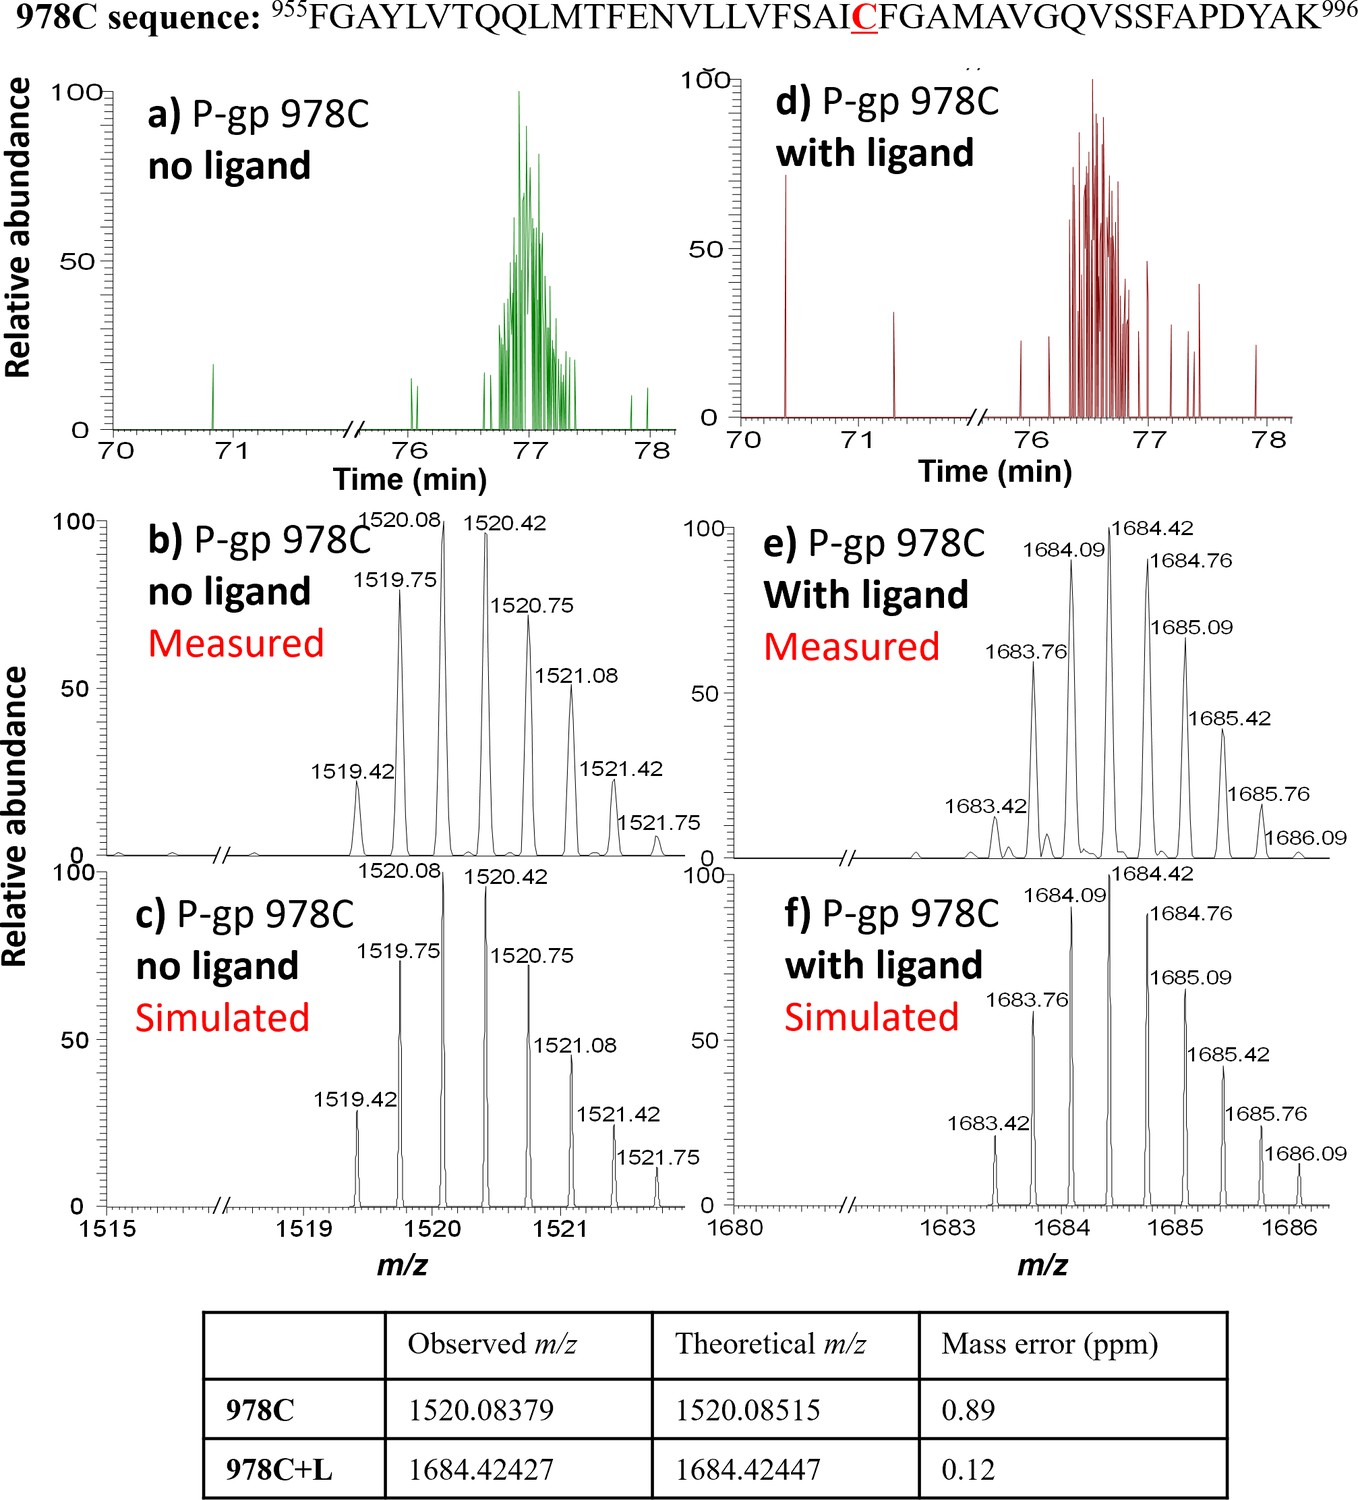
MS detection of 978C peptide before and after AAC labeling.
Top: 978C peptide sequence. (a) LC-MS trace for the 978C peptide, with (b) measured and (c) simulated m/z ([978C+2H+Na]3+). (d) LC-MS trace for the AAC-labeled 978C peptide, with (e) measured and (f) simulated m/z ([978C+L+2H+Na]3+). The observed isotope peak distributions for unlabeled and labeled 978C peptides are in good agreement with the simulated peak distributions; mass errors are shown in the table underneath.
Figure 1—figure supplement 4

MS detection of 971C peptide before and after AAC labeling.
Top: 971C peptide sequence. (a) LC-MS trace for the 971C peptide, with (b) measured and (c) simulated m/z ([971C+3H]3+). (d) LC-MS trace for the AAC-labeled 971C peptide, with (e) measured and (f) simulated m/z ([971C+L+3H]3+). The observed isotope peak distributions for unlabeled and labeled 971C peptides are in good agreement with the simulated peak distributions; mass errors are shown in the table underneath.
Figure 1—figure supplement 5

ATPase activities of P-glycoprotein (Pgp) mutants L335C, V978C, and L971C.
(a) ATPase activity was enhanced for each mutant after addition of verapamil (30 µM) or QZ-Ala (2 µM). Data are averaged from triplicate measurements with standard error bars. (b) ATPase activity after addition of various concentrations of AAC-DNPT. CL-Pgp was included as control. A representative curve was shown.
Figure 2 with 8 supplements
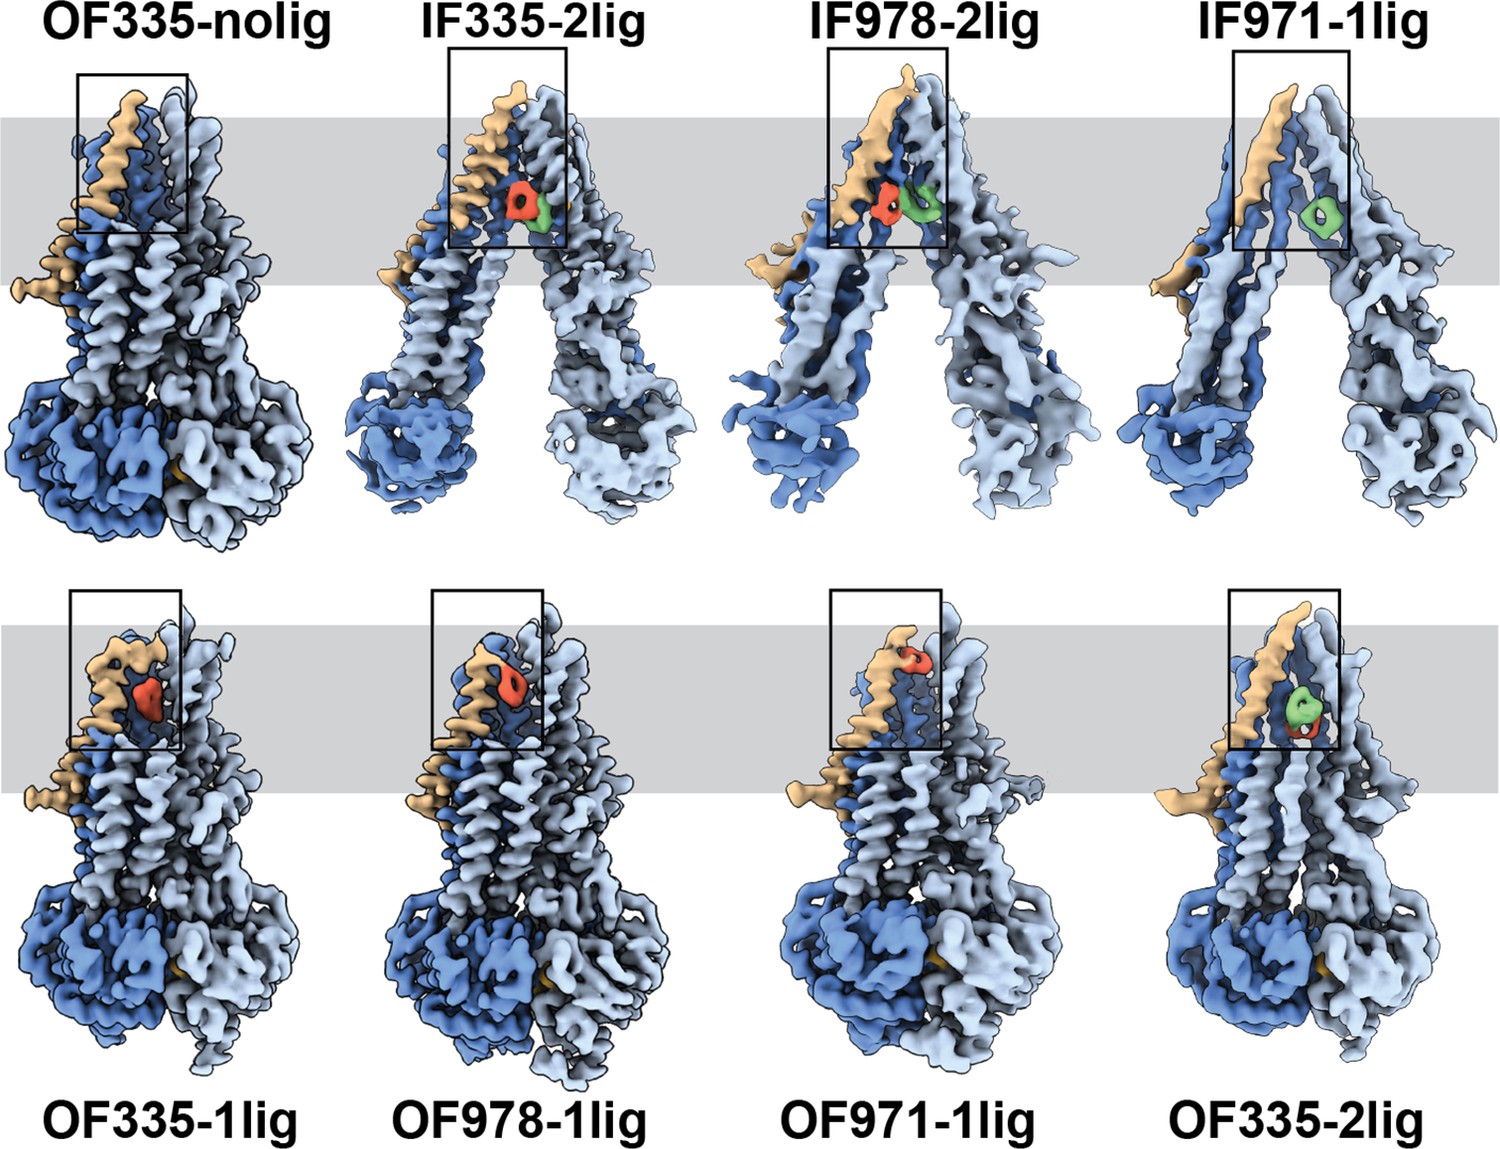
High-resolution structures of P-glycoprotein (Pgp) with bound ligands.
For all mutants, inward-facing (IF) and outward-facing (OF) structures were obtained, with ligands revealed in the transmembrane region (gray shadow). For Pgp335 three different OF conformations were detected in one dataset (OF335-nolig, OF335-1lig, OF335-2lig). To display the binding sites, the upper halves of TM2,10,11, and 12 were removed from the densities. For the IF structures, TM9 was also removed for clarity. TM1 is shown in brown, with the covalently bound ligand in red and the non-crosslinked in green. Significant conformational changes were observed among these structures from which a further zoom-in on TM1 (black box region) was shown in Figure 4 and Figure 2—figure supplement 3.
Figure 2—figure supplement 1
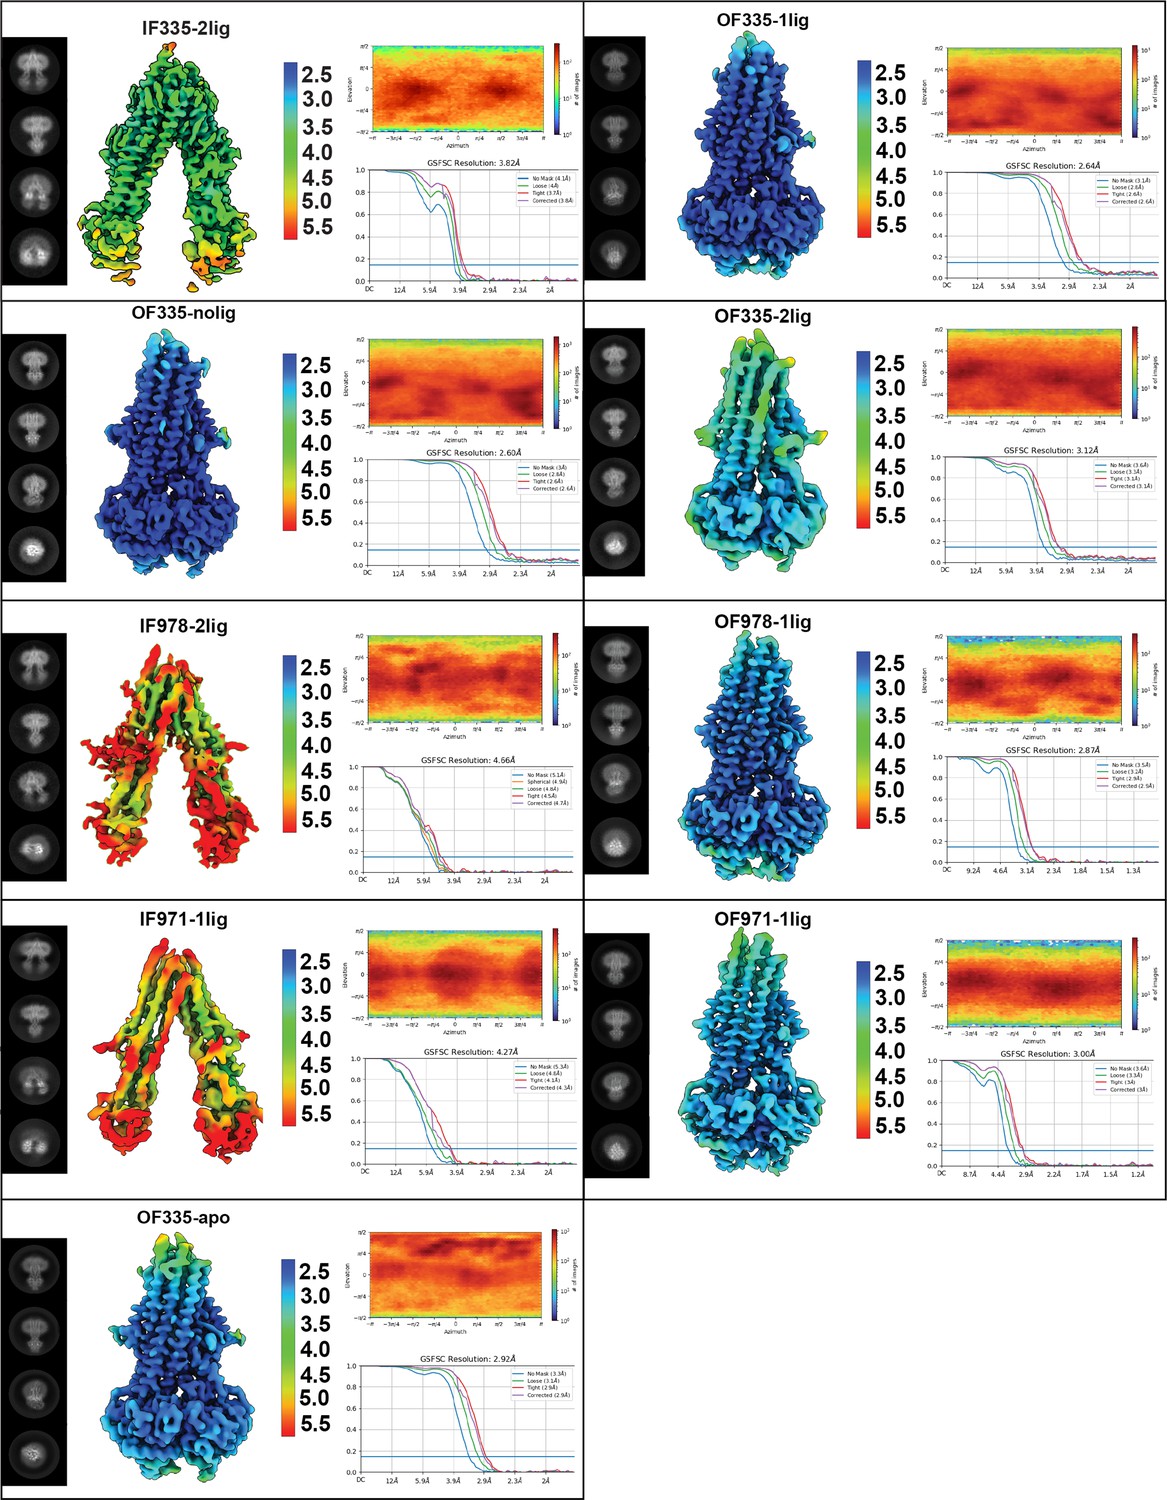
Summary of cryoEM data analysis for all structures.
Each panel shows 2D classes, local resolution estimation, viewing distribution, and FSC curves for each map. All data shown here were obtained using cryoSPARC.
Figure 2—figure supplement 2
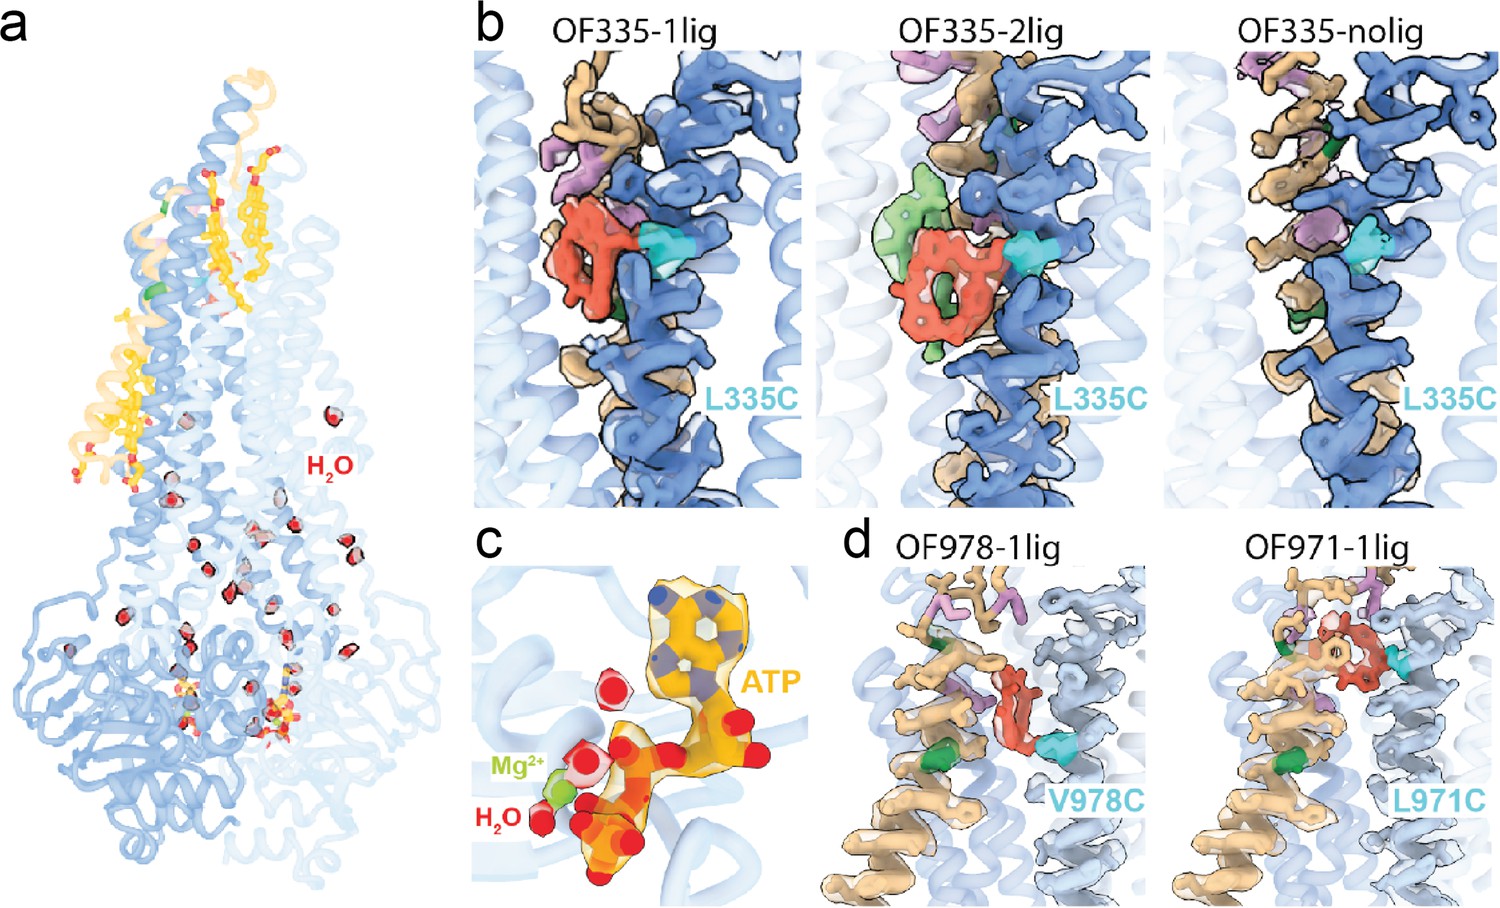
High-resolution features of the outward-facing (OF) structures.
(a) Overall structure of OF335-1lig solved at 2.6 Å resolution. High resolution allows for fitting of water (red balls) and the surface-bound cholesterol hemisuccinate molecules (yellow sticks), in addition to the bound nucleotides and the AAC cyclopeptide. Contour level in the density modified map is 0.6. (b) Local densities for TM6 (blue) and TM1 (brown) in the OF Pgp335 showing the disulfide bridge in cyan between AAC (red) and TM6. AAC-DNPT is shown in light green in the OF335-2lig. Contour level used is 0.19. (c) CryoEM densities for ATP (yellow), Mg2+ (green), and water molecules (red) in the OF335-1lig model. Contour level in the density modified map is 0.6 (water), 1.1 (ATP), and 1.7 (Mg2+). (d) Disulfide bridge (cyan) between TM12 (light blue) and AAC (red) for OF978-1lig and OF971-1lig. Contour levels used are 0.19 (OF978-1lig) and 0.05 (OF971-1lig). The densities for A63 and A72 (dark green) and M68, M74, and F78 (plum) are shown in each panel.
Figure 2—figure supplement 3

Comparison of the binding cavities of all structures from the crosslink experiments.
TM1 is shown in brown, the crosslinked AAC in red, and the non-crosslinked AAC-DNPT in light green, the crosslinked residue is marked in cyan. A63 and G72 are shown in dark green; M68, M75, and F78 are shown in plum.
Figure 2—figure supplement 4

Comparison of AAC binding in the different P-glycoprotein (Pgp) structures.
(a) Transition from inward-facing (IF) (left) to outward-facing (OF) (right) conformation for L335C. The IF ligand is shown in red for the crosslinked molecule, and in green for the non-crosslinked. The OF ligand is shown in yellow. (b) Transition from IF (left) to OF (right) for V978C. Ligand molecules for the IF conformation are shown in red (crosslinked) and green (non-crosslinked). The OF ligand is shown in plum. (c) Comparison between OF335 structures with one or two ligands bound. The ligands from OF335-1lig, with one molecule bound, is shown in yellow. The two molecules bound in structure OF335-2lig are shown in light pink (crosslinked) or light green (non-crosslinked). (d) Comparison of the ligand position between OF335 and OF978. The ligand for OF335 is shown in yellow, for OF978 in plum. (e) Overlay of the ligand in the three IF structures. The ligand in IF335 is shown in yellow, in IF978 in plum, and in IF971 in light green. The crosslinked residues L335C and V978C are shown in cyan. An overall alignment in ChimeraX was used for the comparison.
Figure 2—figure supplement 5
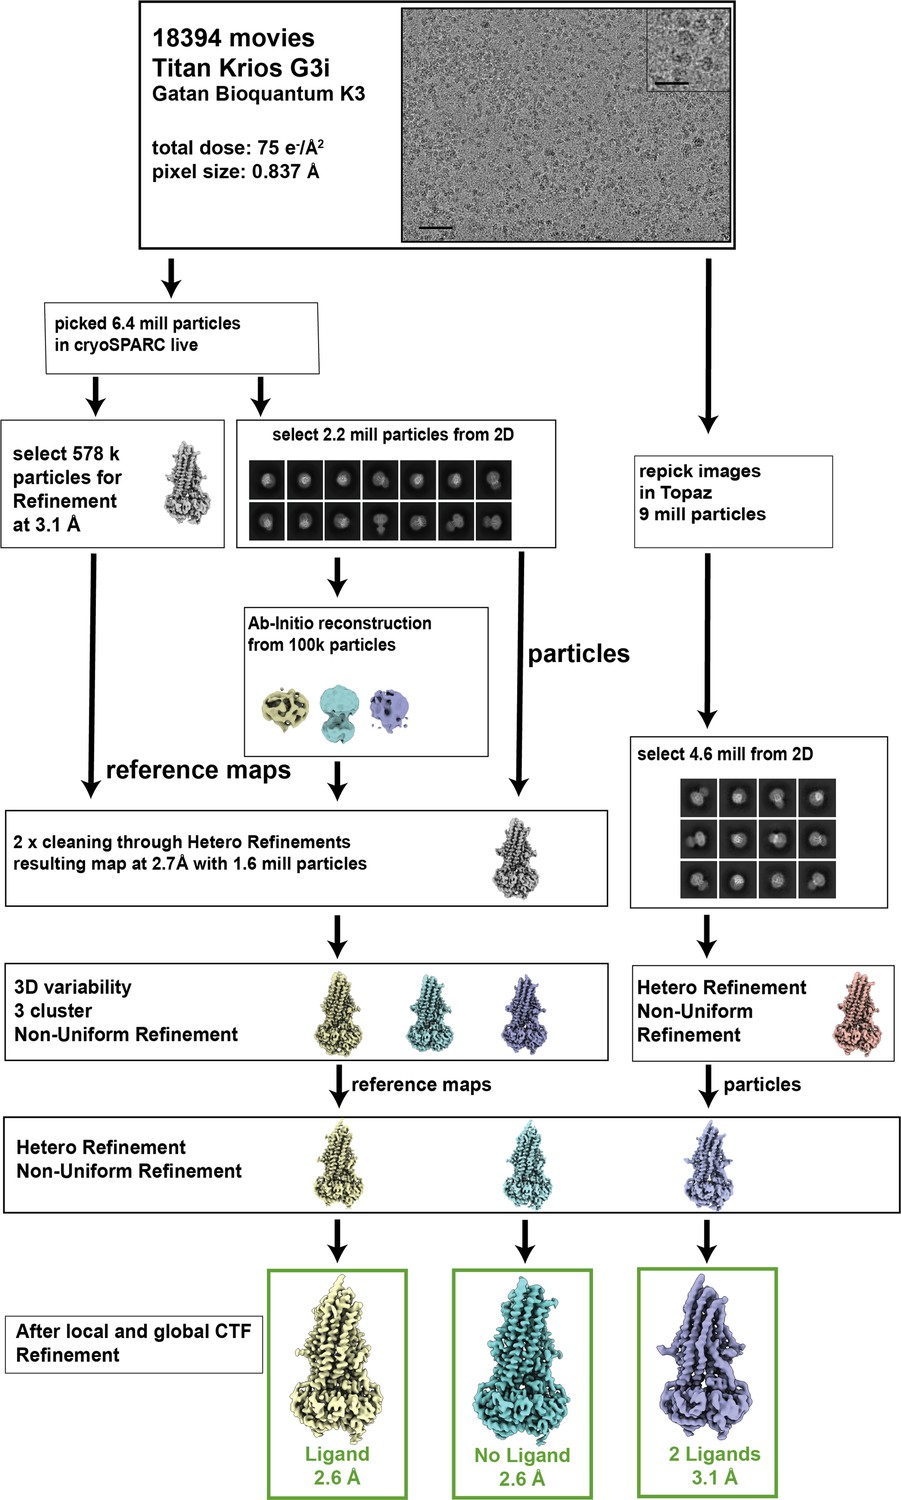
Example of cryoEM data processing pathway for P-glycoprotein (Pgp).
The cryoEM data for OF335 were collected on a Titan Krios G3i with a Gatan Bioquantum K3. In total, 18,394 micrographs were collected. The entire processing pipeline was performed in cryoSPARC and cryoSPARC live. All datasets were processed in a similar manner. The scale bar is 50 nm on the micrographs and 20 nm on the inset.
Figure 2—figure supplement 6
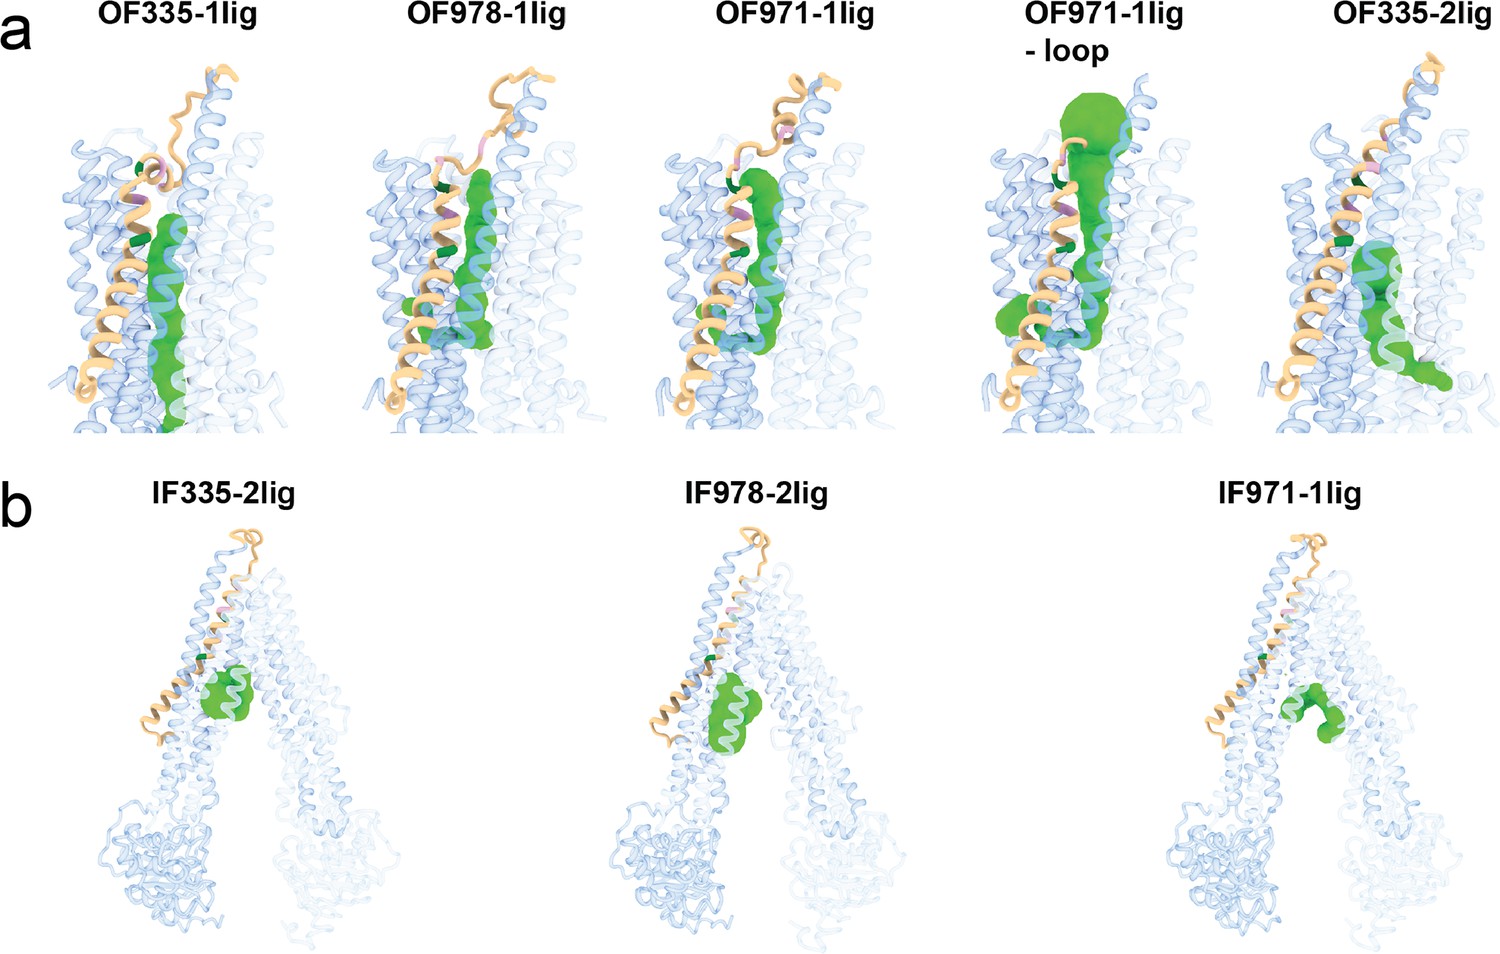
Visualization of tunnels in (a) outward-facing and (b) inward-facing P-glycoprotein (Pgp) structures by the CAVER plugin for PyMOL (Chovancova et al., 2012).
The standard value of 3 Å was chosen as the minimum probe diameter. With OF335-nolig as template, it was not possible to calculate a tunnel. The protein is shown as cartoon and individual tunnels colored as green spheres. TM1 is shown in brown; A63 and G72 are shown in green; M68, M74, and P78 are shown in plum. For clarity, please refer to Figure 2—figure supplement 3 for the position of these residues.
Figure 2—figure supplement 7

Residues in P-glycoprotein (Pgp) mutants interacting with AAC and AAC-DNPT.
Pgp335 outward-facing (OF) in the top panel refers to OF335-1lig. In the bottom panel describing OF335-2lig, the left and right diagrams refer to the binding positions of non-covalent and covalent ligand, respectively. Hydrophobic interactions are shown as red halos, amino acids for hydrogen bonds are shown in ball-and-stick representation. LigPlot+ was used for calculation and visualization of these interactions (Wallace et al., 1995).
Figure 2—figure supplement 8
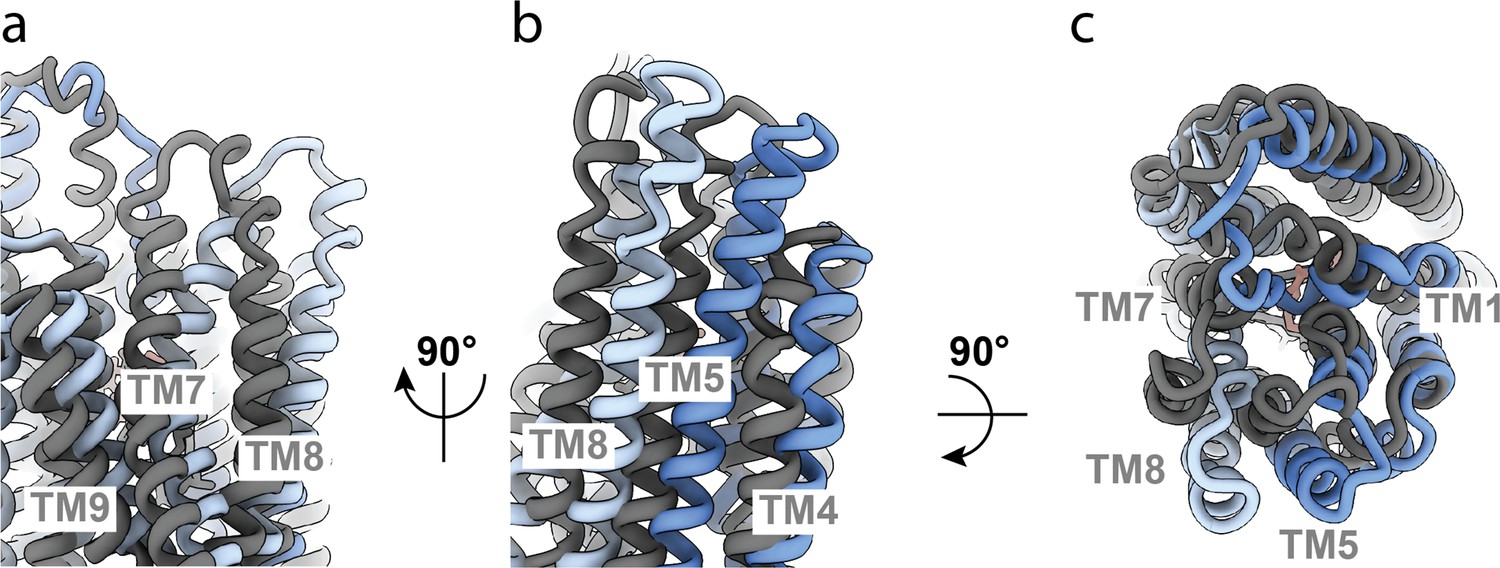
Comparison of OF335 with one AAC bound (blue) compared to two AAC molecules bound (gray).
(a) Conformational differences between TM7, TM8, and TM9. The tops of helices TM7 and TM8 point in opposite directions in the two structures. (b) Conformational differences in TM8, TM5, and TM4. All three helices are shifted significantly with one AAC bound compared to two AAC molecules bound. (c) Top view comparing the two structures. The top ends of the helices are all turned further inward when two substrate molecules are bound compared to one bound molecule. An overall alignment in ChimeraX-1.3 was used for the comparison.
Figure 3 with 1 supplement
Functional characterization of G72A mutant.
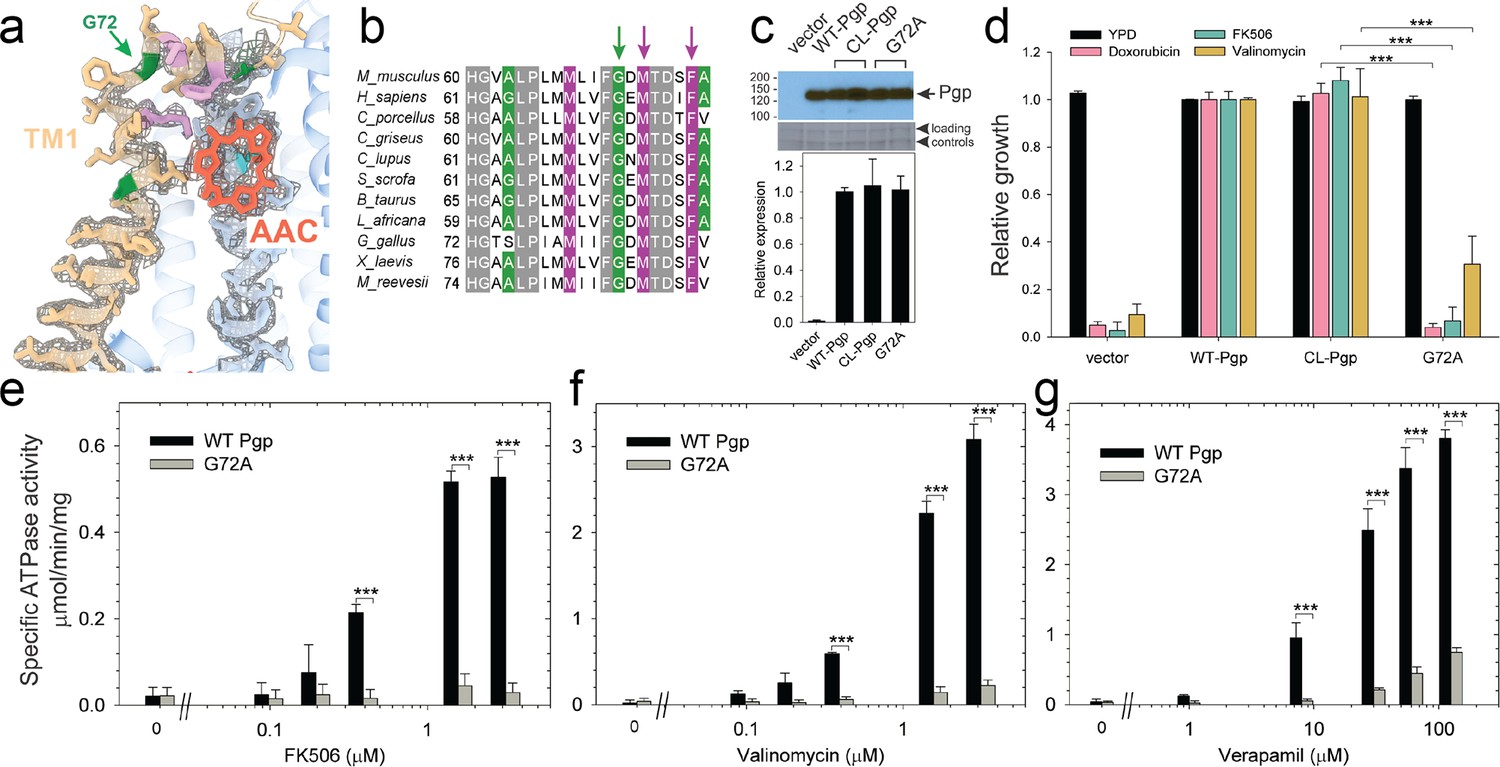
(a) TM1 breaks at the G72 position in the mid-transport states of P-glycoprotein (Pgp). Shown is a close-up view of TM1 (brown) with side chain densities, the G72 position (green arrow), and the adjacently bound cyclic peptide AAC (red sticks) in the OF335-1lig structure. (b) Sequence alignment of TM1 in vertebrate Pgps including the highly conserved G72 residue (green arrow). (c) Level of expression of the G72A mutant relative to the WT- and CL-Pgp in Saccharomyces cerevisiae cultures derived from the western blot analysis. (d) In vivo activity of the G72A mutant. The growth resistance of S. cerevisiae cultures transformed with either vector control plasmid, WT-Pgp, CL-Pgp, or the G72A mutant against several fungicides (doxorubicin, FK506, and valinomycin) relative to the YPD medium only (black bar) were analyzed. Compared to WT-Pgp and CL-Pgp, the G72A mutant severely compromised growth resistance against the tested drugs (p-values of <0.001 are indicated by ***). (e–g) ATPase activity of the purified G72A mutant. While basal ATP hydrolysis rates (in the absence or at low concentrations of drug) were indistinguishable between WT and G72A mutant proteins, stimulation of the ATPase activities by 1–3 µM FK506, 1–3 µM valinomycin, or 30–130 µM verapamil were severely impaired (p-values of <0.001 are indicated by ***).
Figure 3—figure supplement 1
Processing overview for OF335-G72.
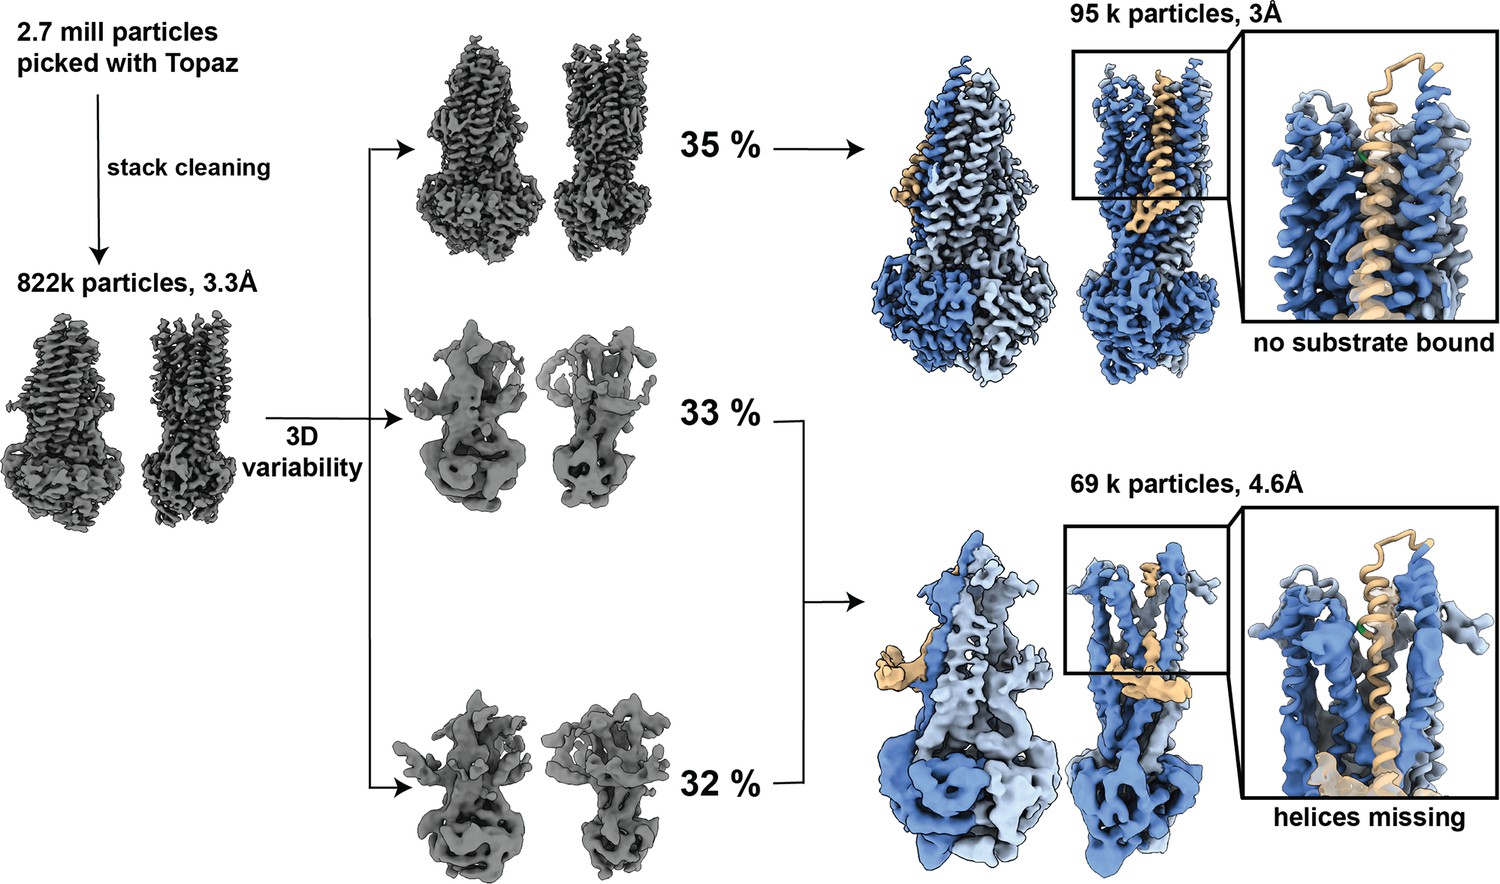
In total, 2.7 million particles were picked using Topaz. Particle stack was cleaned through several rounds of 3D classification. Stack with 822k particles was used for 3D variability and separated into three clusters. Clusters were further processed with iterative rounds of 3D classifications and refinements and revealed two distinct conformations in the dataset. An apo structure with 3 Å resolution with no AAC bound and a low-resolution structure of 4.6 Å with poor resolution in the transmembrane helices and TM1,2,3,4,5,6,10, and 12 partially missing. Magnified images: atomic model OF335-nolig fit into the structures. TM1 is shown in brown, G72A is marked in green.
Figure 4 with 3 supplements
Tracing the substrate movement in P-glycoprotein (Pgp).
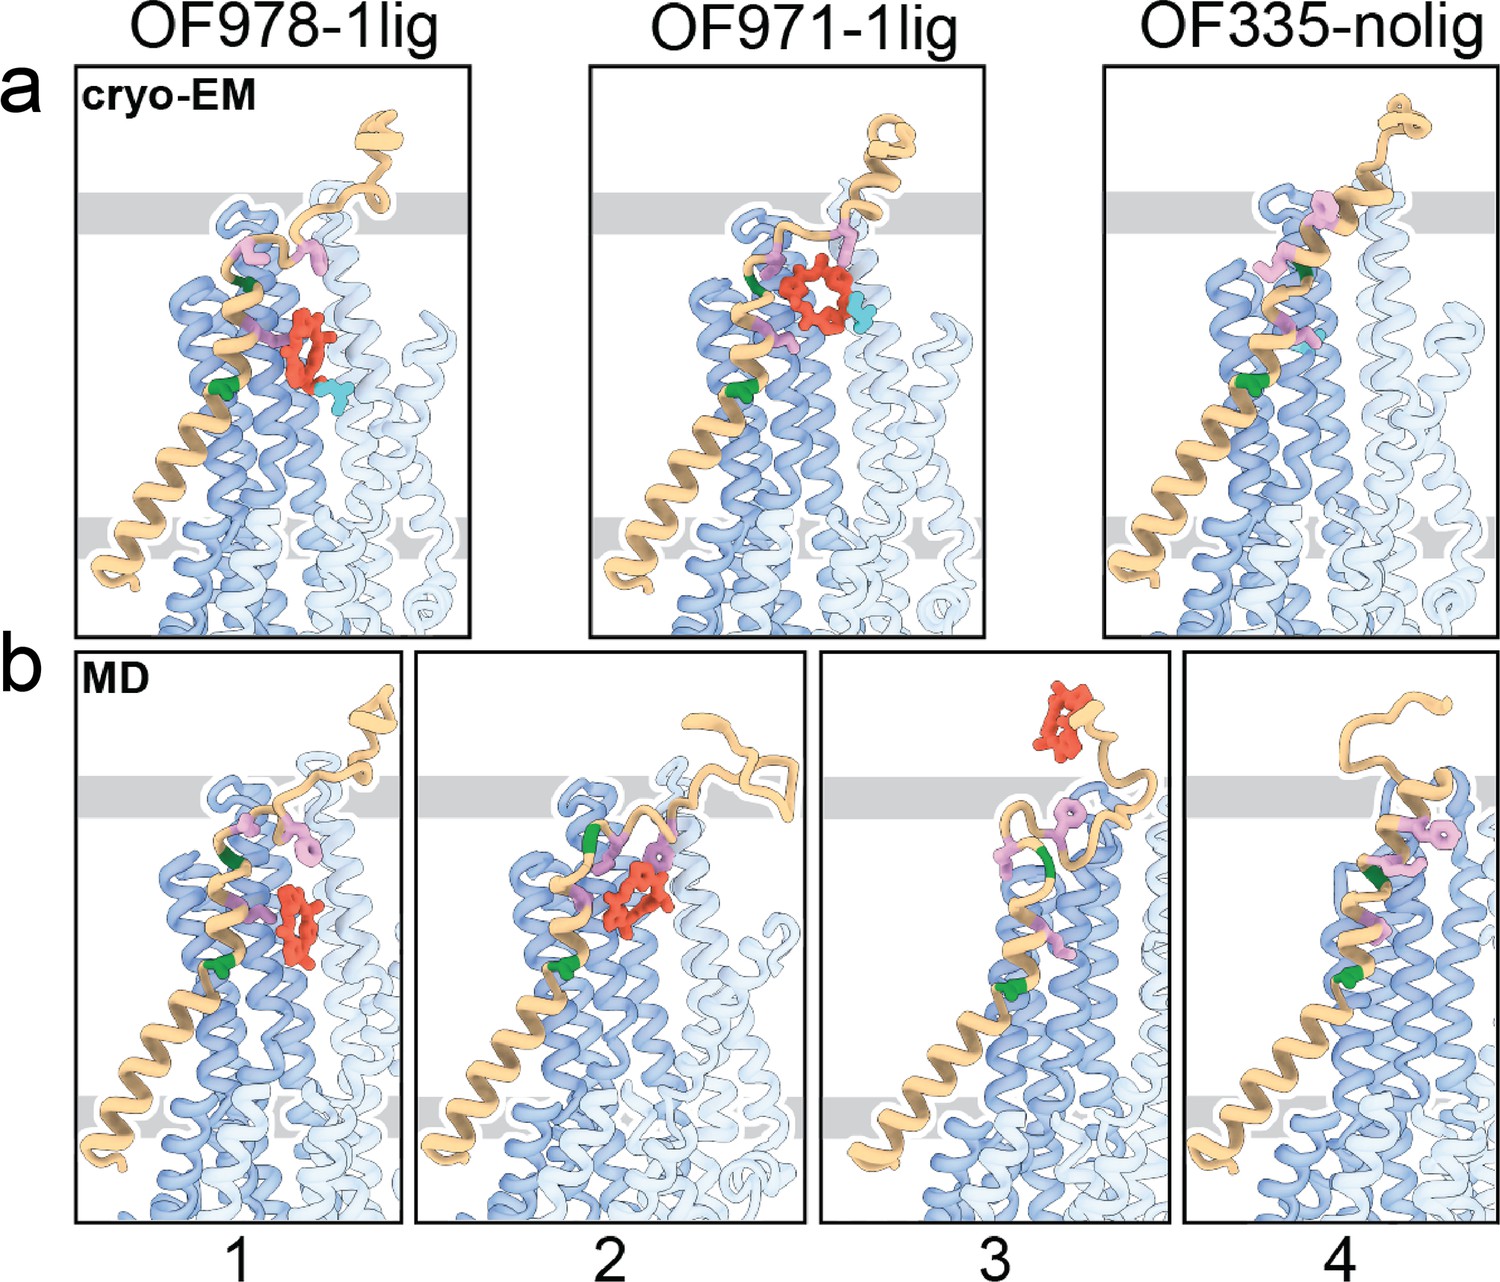
Structures of outward-facing (OF) Pgp from cryoEM (a) aligned with four snapshots from molecular dynamics (MD) simulations (b) of substrate transport and release. TM1 is rendered in brown, with A63 and G72 in green, and M68, M74, and F78 in plum. The cyclic peptide is shown as red sticks. Significant conformational changes were observed for TM1 along with the upward movement and release of the substrate from OF Pgp.
Figure 4—figure supplement 1
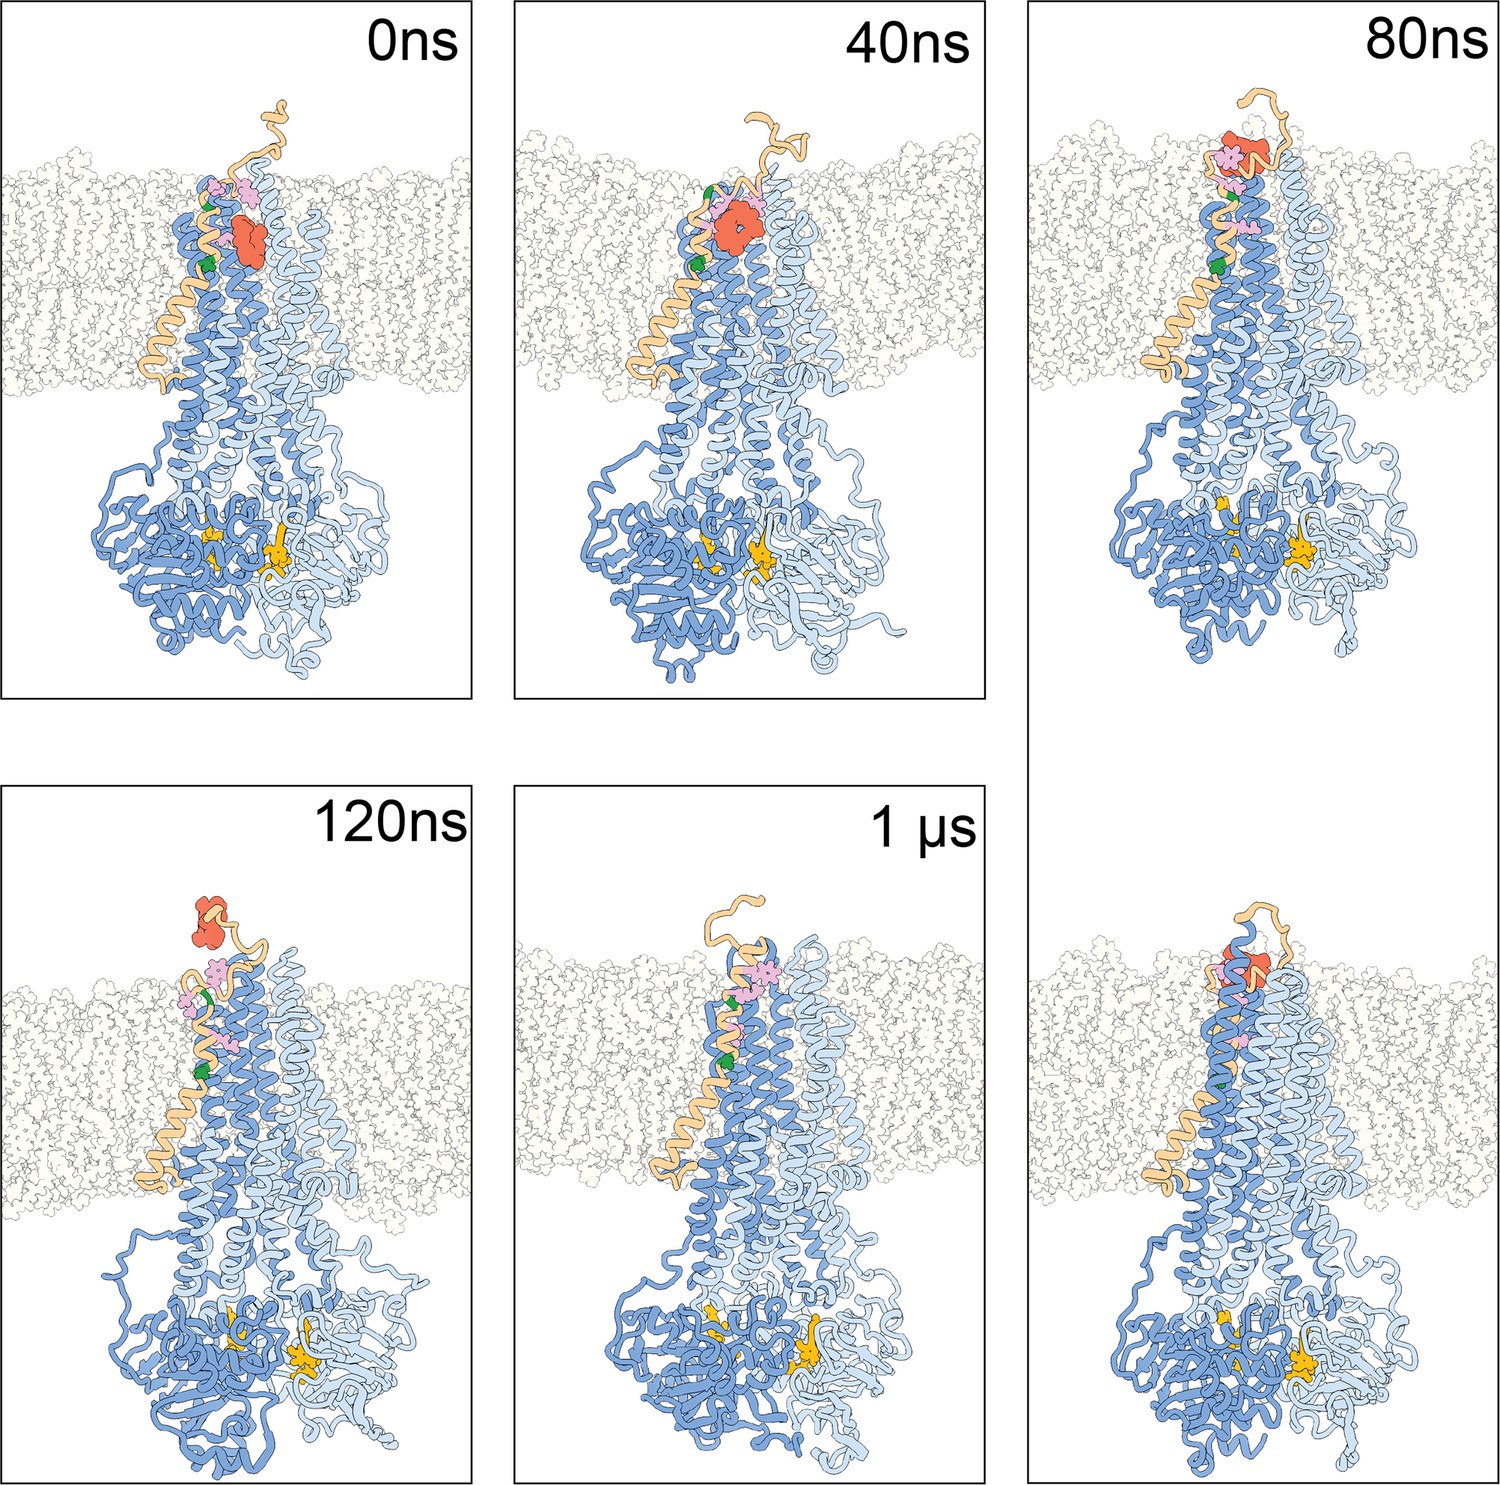
Snapshots for molecular dynamics (MD) simulation started from OF978-1lig at 400 K.
TM1 is shown in brown, the ligand is shown in red spheres. A63 and G72 are shown in green; M68, M74, and P78 are shown in plum. The plasma membrane is shown with gray outlines. Water is not shown. (0 ns) Cut through the initial configuration, OF978-1lig. (40 ns) TM1 has rearranged while interacting with the ligand from the top. (80 ns) The ligand is leaving the transporter while interacting with TM1 from the side. The top panel shows a cut through the structure, the bottom panel shows the full structure. (120 ns) The ligand has left the transporter and has its last transient interactions with the top of TM1. (1 µs) The end of the simulation shows a refolding of TM1.
Figure 4—figure supplement 2
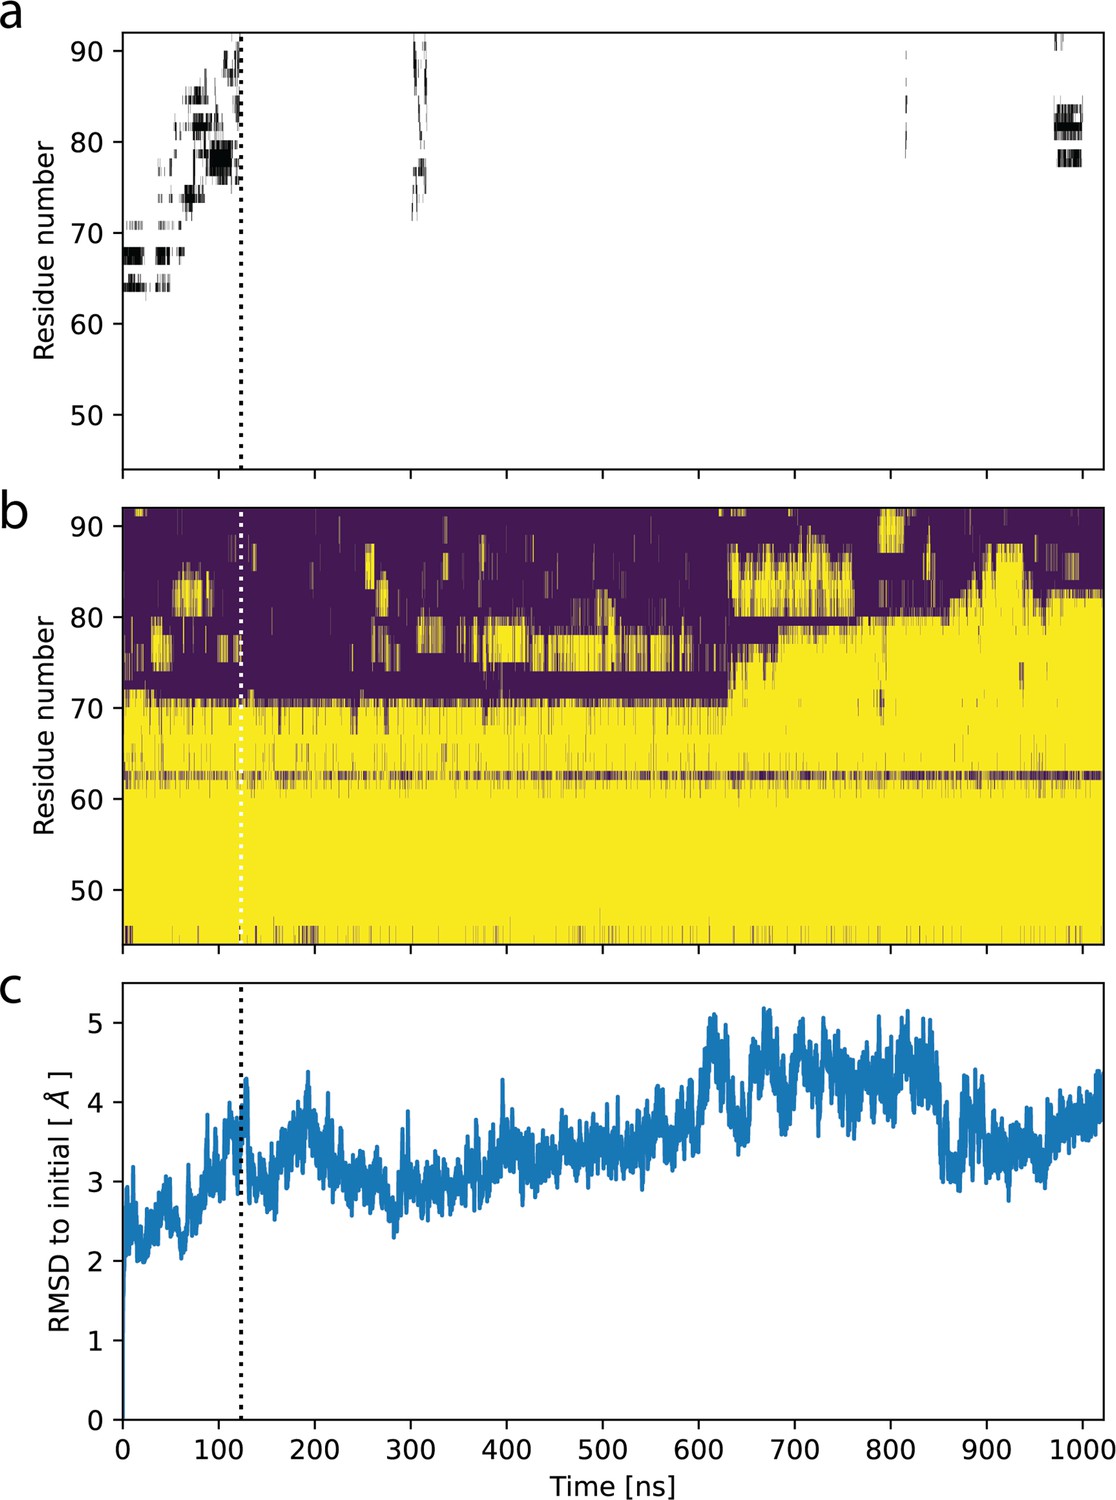
Ligand release in molecular dynamics (MD) simulation starting from OF978-1lig.
(a) Contacts of the ligand with residues in TM1 as function of time. Black bars indicate residues within 5 Å of the ligand. (b) Secondary structure in TM1 as function of time. Loop regions are shown in purple, alpha helices in yellow. (c) Root-mean-square distance (RMSD) of backbone atoms in P-glycoprotein (Pgp) transmembrane domain (residues 34–366 and 691–1010) to initial structure as function of time. Dotted lines indicate the time point of ligand release.
Figure 4—figure supplement 3

Molecular dynamics (MD) simulation of ligand release starting from OF335-1lig at T=330 K.
The top row illustrates key events in the simulation using four snapshots at different time points (from left to right). The bottom row shows the time series of the z-position of the ligand with respect to its initial position. In the snapshots, TM1 is rendered in brown, residues A63 and G72 in green, and M68, M74, and F78 in plum. The cyclic peptide is shown as red sticks and the lipid headgroups with transparent orange spheres.
Videos
Video 1
Morph between the individual models illustrates the sequence of conformational changes during substrate translocation from IF335 to OF335.
Video 2
Morph between the individual models illustrates the sequence of conformational changes during substrate translocation from IF978 to OF978.
Video 3
Molecular dynamics (MD) simulation of substrate movement and release from OF978.
Additional files
-
Supplementary file 1
CryoEM data collection, refinement, and validation statistics.
- https://cdn.elifesciences.org/articles/90174/elife-90174-supp1-v1.docx
-
Supplementary file 2
Summary of cryoEM data for the P-glycoprotein (Pgp) mutants.
- https://cdn.elifesciences.org/articles/90174/elife-90174-supp2-v1.docx
-
Supplementary file 3
Equilibration protocol for molecular dynamics (MD) simulations.
- https://cdn.elifesciences.org/articles/90174/elife-90174-supp3-v1.docx
-
MDAR checklist
- https://cdn.elifesciences.org/articles/90174/elife-90174-mdarchecklist1-v1.docx
Download links
A two-part list of links to download the article, or parts of the article, in various formats.
Downloads (link to download the article as PDF)
Open citations (links to open the citations from this article in various online reference manager services)
Cite this article (links to download the citations from this article in formats compatible with various reference manager tools)
Tracing the substrate translocation mechanism in P-glycoprotein
eLife 12:RP90174.
https://doi.org/10.7554/eLife.90174.3


