Oxygen isotopes in orangutan teeth reveal recent and ancient climate variation
- Griffith Centre for Social and Cultural Research, Griffith University, Australia
- Australian Research Centre for Human Evolution, Griffith University, Australia
- Department of Environmental Medicine and Public Health, Icahn School of Medicine at Mount Sinai, United States
- School of the Environment, The University of Queensland, Australia
- Centro Nacional de Investigación sobre la Evolución Humana (CENIEH), Spain
- Palaeoscience Labs, Department of Archaeology and History, La Trobe University, Australia
- Department of Geology, Universiti Malaya, Malaysia
- School of Archaeology and Anthropology, The Australian National University, Australia
- Department of Geology, Naturalis Biodiversity Center, Netherlands
- Research School of Earth Sciences, The Australian National University, Australia
- Radiogenic Isotope Facility, School of the Environment, The University of Queensland, Australia
- Department of Human Evolutionary Biology, Harvard University, United States
Figures
Figure 1
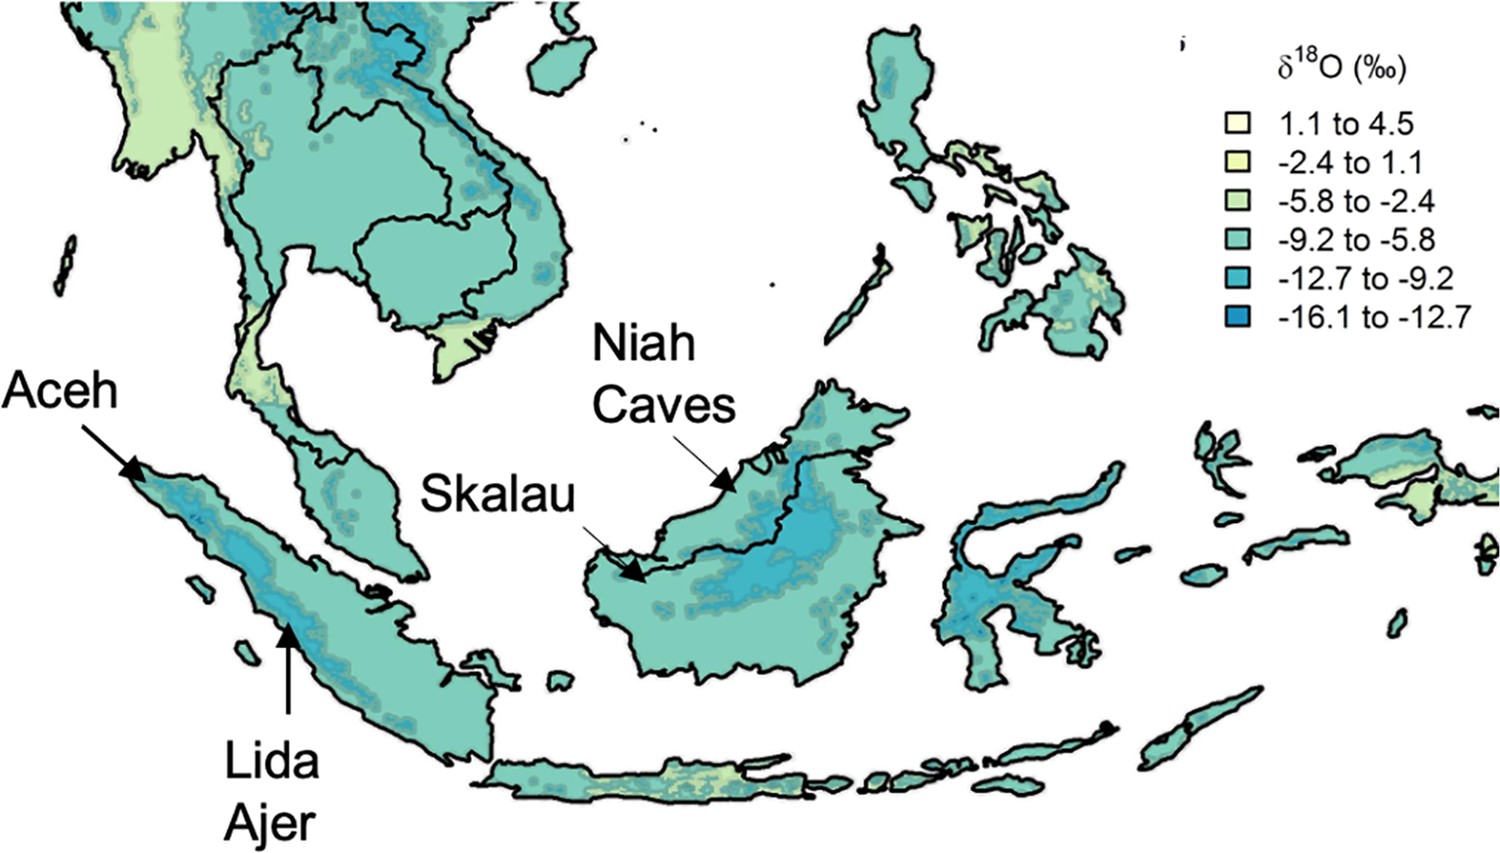
Approximate location of select modern and fossil orangutans superimposed on modeled isotopic variation.
Figure modified from https://www.waterisotopes.org based on data from the Online Isotopes in Precipitation Calculator (3.0). See Table 1 for the location of particular individuals. Sibrambang Cave has yet to be relocated since Eugene Dubois’ original excavations, but it is known to be in the general vicinity of Lida Ajer in the Padang Highlands, possibly near to the modern village of a similar name (Louys et al., 2024).
Figure 2
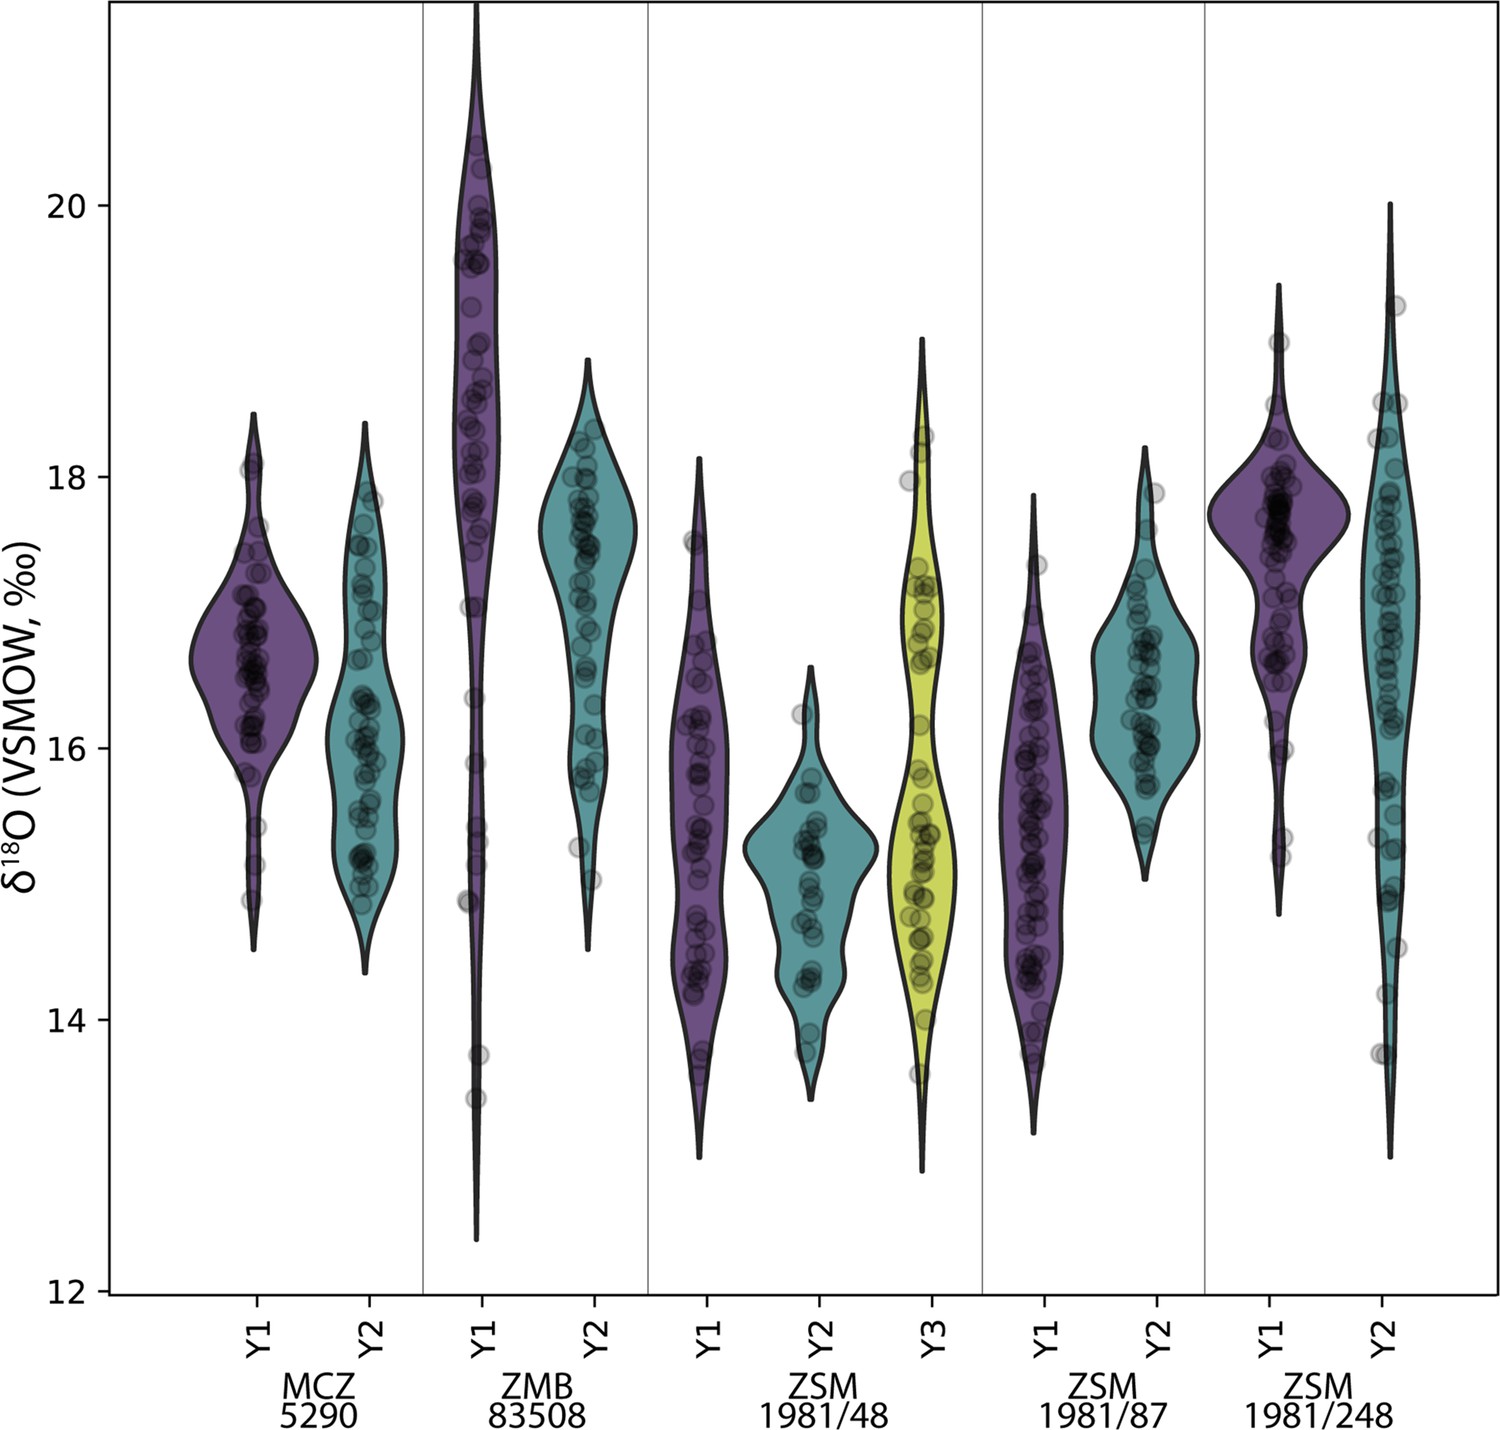
Comparison of sequential δ18O values across multiple years of first molar formation in five modern orangutans from Borneo and Sumatra.
Bornean individuals: MCZ 5290, ZSM 1981/48, ZSM 1981/87; Sumatran individuals: ZMB 83508, ZSM 1981/248. The width of each curve is a kernel density estimate (KDE) corresponding to the distribution of δ18O values. First year data (Y1) is shown with a purple violin plot, second year data (Y2) with a green plot, and third year data (Y3) with a yellow plot where complete/available. Actual data are plotted as black circles.
Figure 3
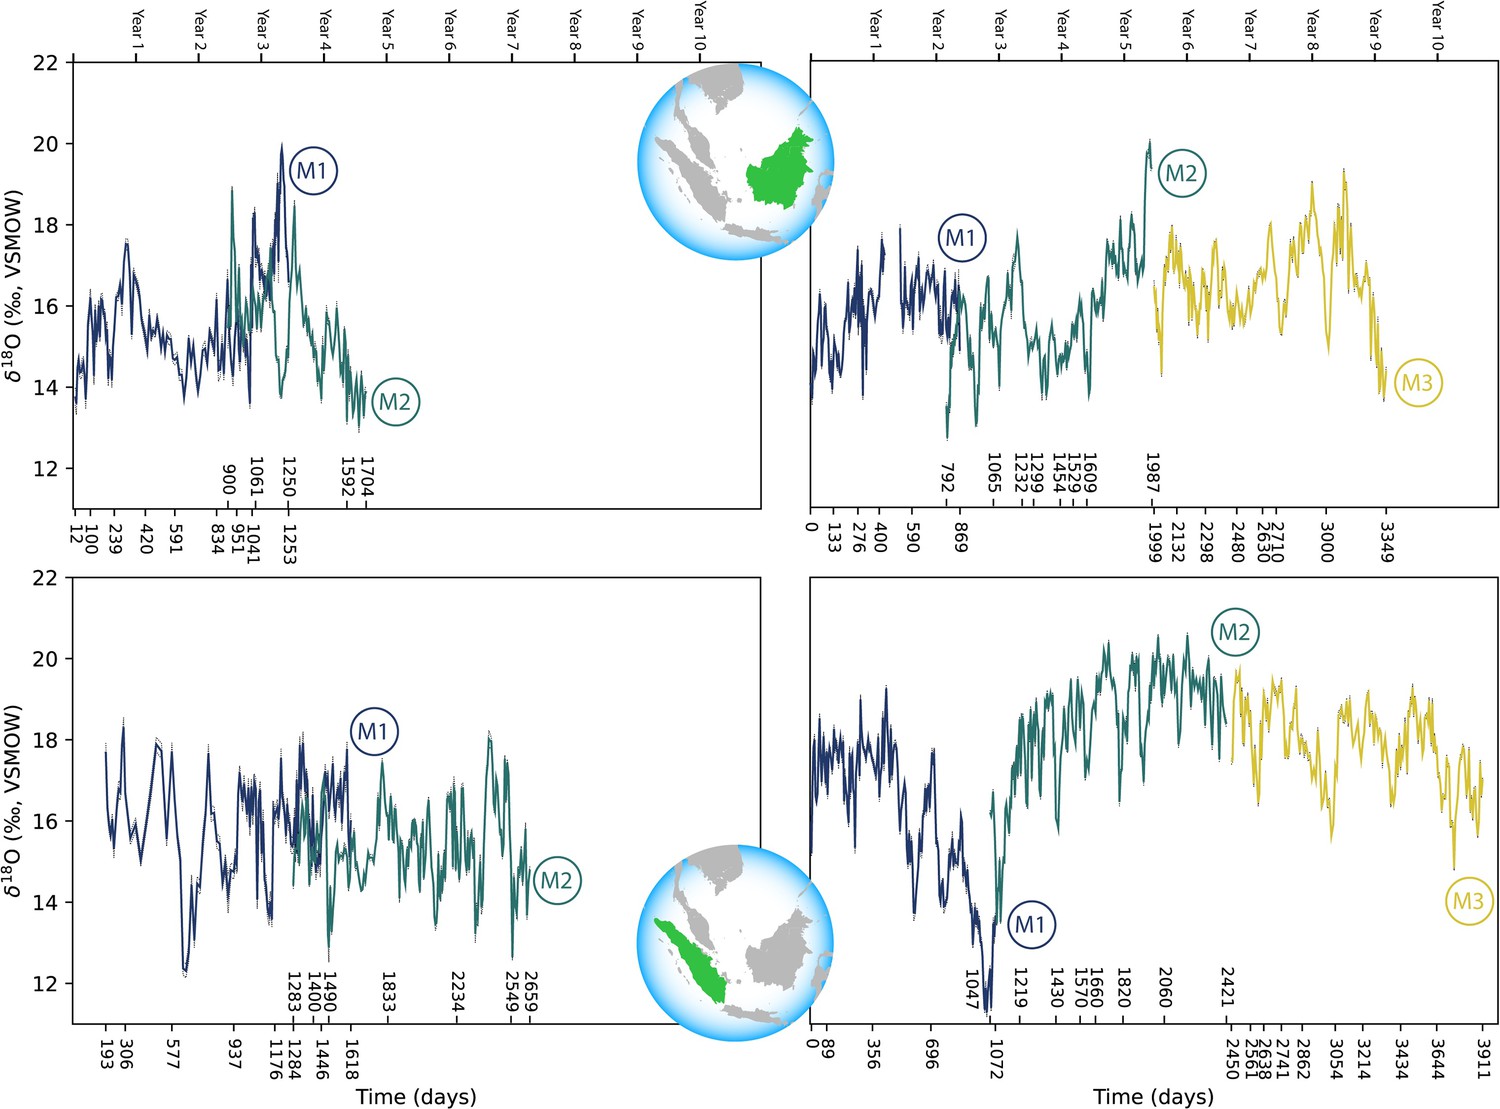
Comparison of sequential δ18O values across multiple years of serial molar formation in two modern orangutans from Borneo (top) and two from Sumatra (bottom).
Individual in upper left: ZSM 1981/48; upper right: ZSM 1981/87; lower left: ZSM 1981/246; lower right: ZSM 1981/248. Developmental overlap was determined through registration of trace elements as in Smith et al., 2017.
Figure 4 with 1 supplement
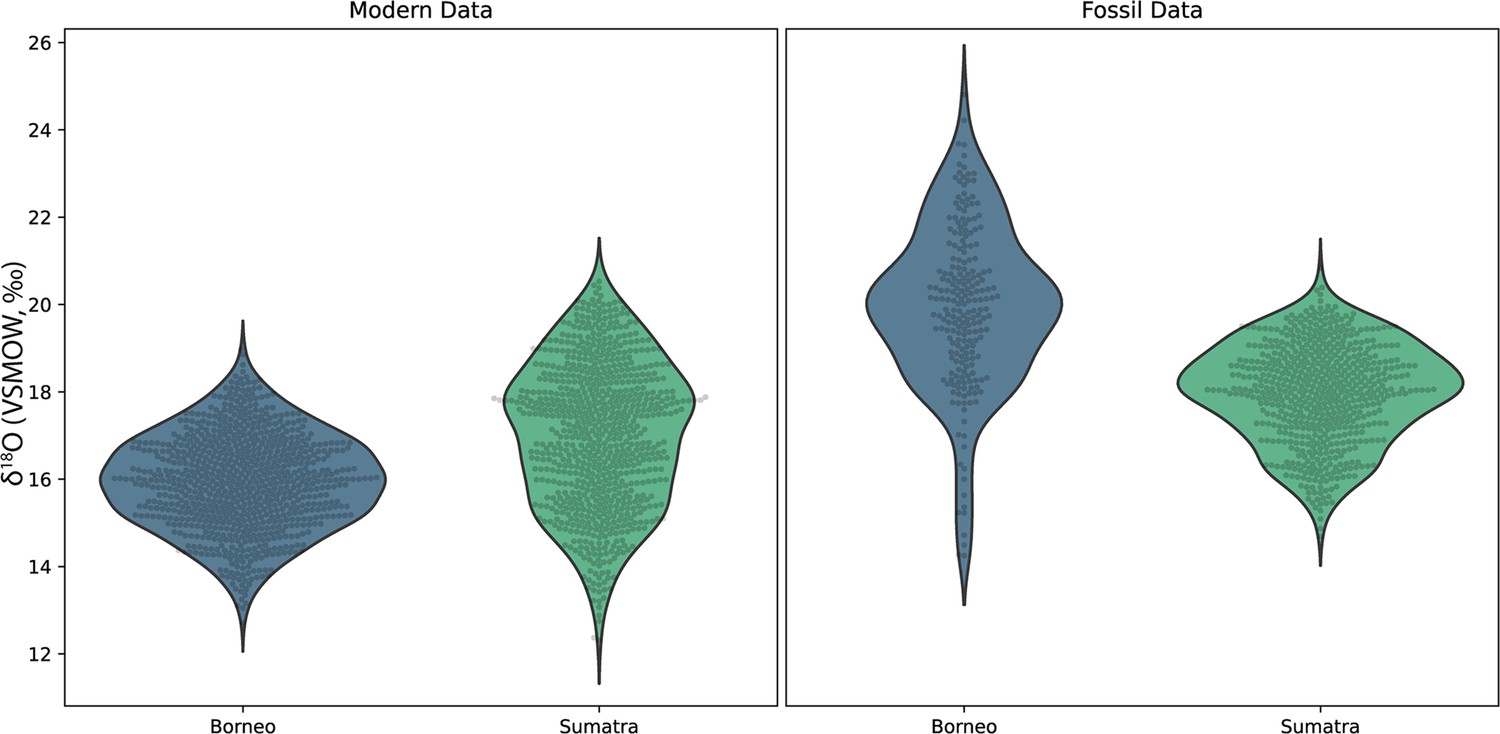
Comparison of δ18O values in fossil and modern orangutans from Borneo (blue) and Sumatra (green).
Violin plots show kernel density estimates representing the distribution of δ18O values in modern individuals (left plot) and in fossil individuals (right plot). Actual δ18O measurements are shown as black circles.
Figure 4—figure supplement 1

Comparison of δ18O values in fossil and modern orangutans from Borneo and Sumatra.
-
Figure 4—figure supplement 1—source data 1
Numerical data used to generate this figure.
- https://cdn.elifesciences.org/articles/90217/elife-90217-fig4-figsupp1-data1-v1.xlsx
Appendix 1—figure 1
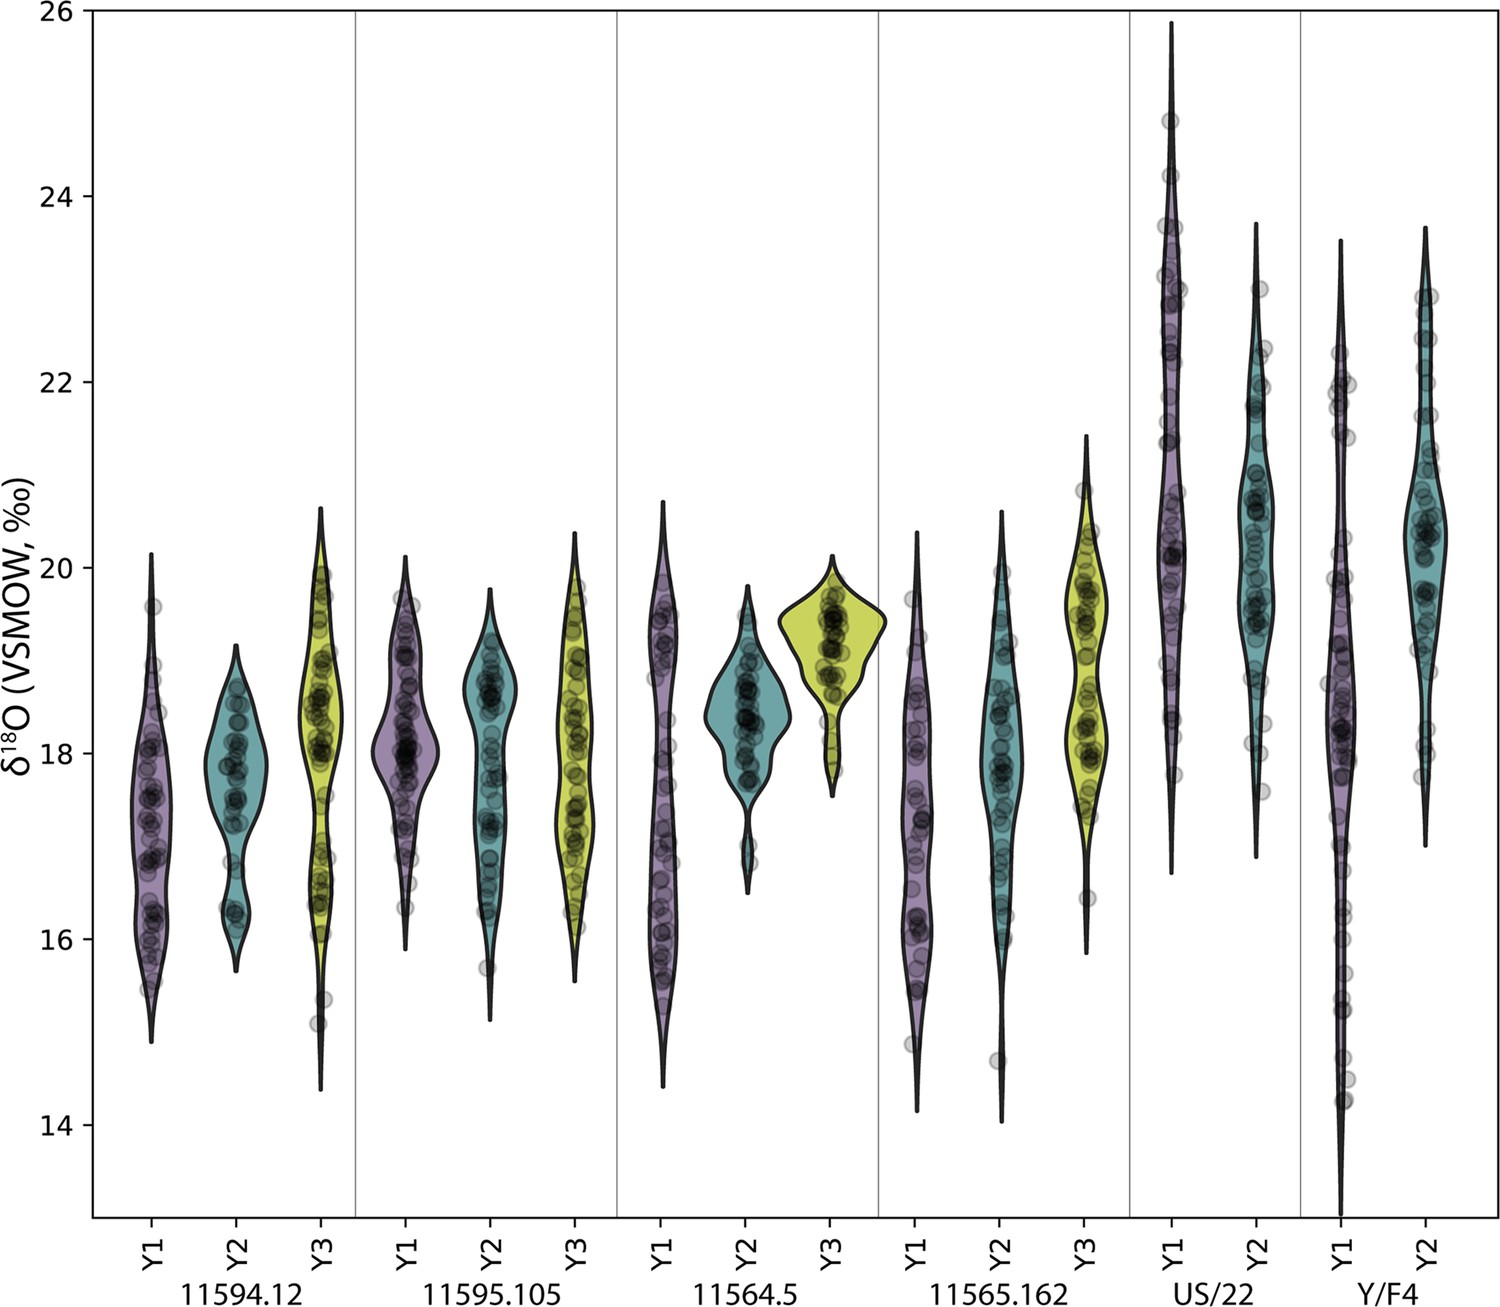
Comparison of sequential δ18O values across multiple years of molar formation in six putative fossil orangutan M1s from Borneo and Sumatra.
The width of each curve is a kernel density estimate (KDE) corresponding to the distribution of oxygen isotope values measured from different teeth. From each tooth, first year data (Y1) is shown with a purple violin plot, second year data (Y2) with a green plot, and third year data (Y3, if present) with a yellow plot. Actual data are plotted as black circles.
Appendix 1—figure 2
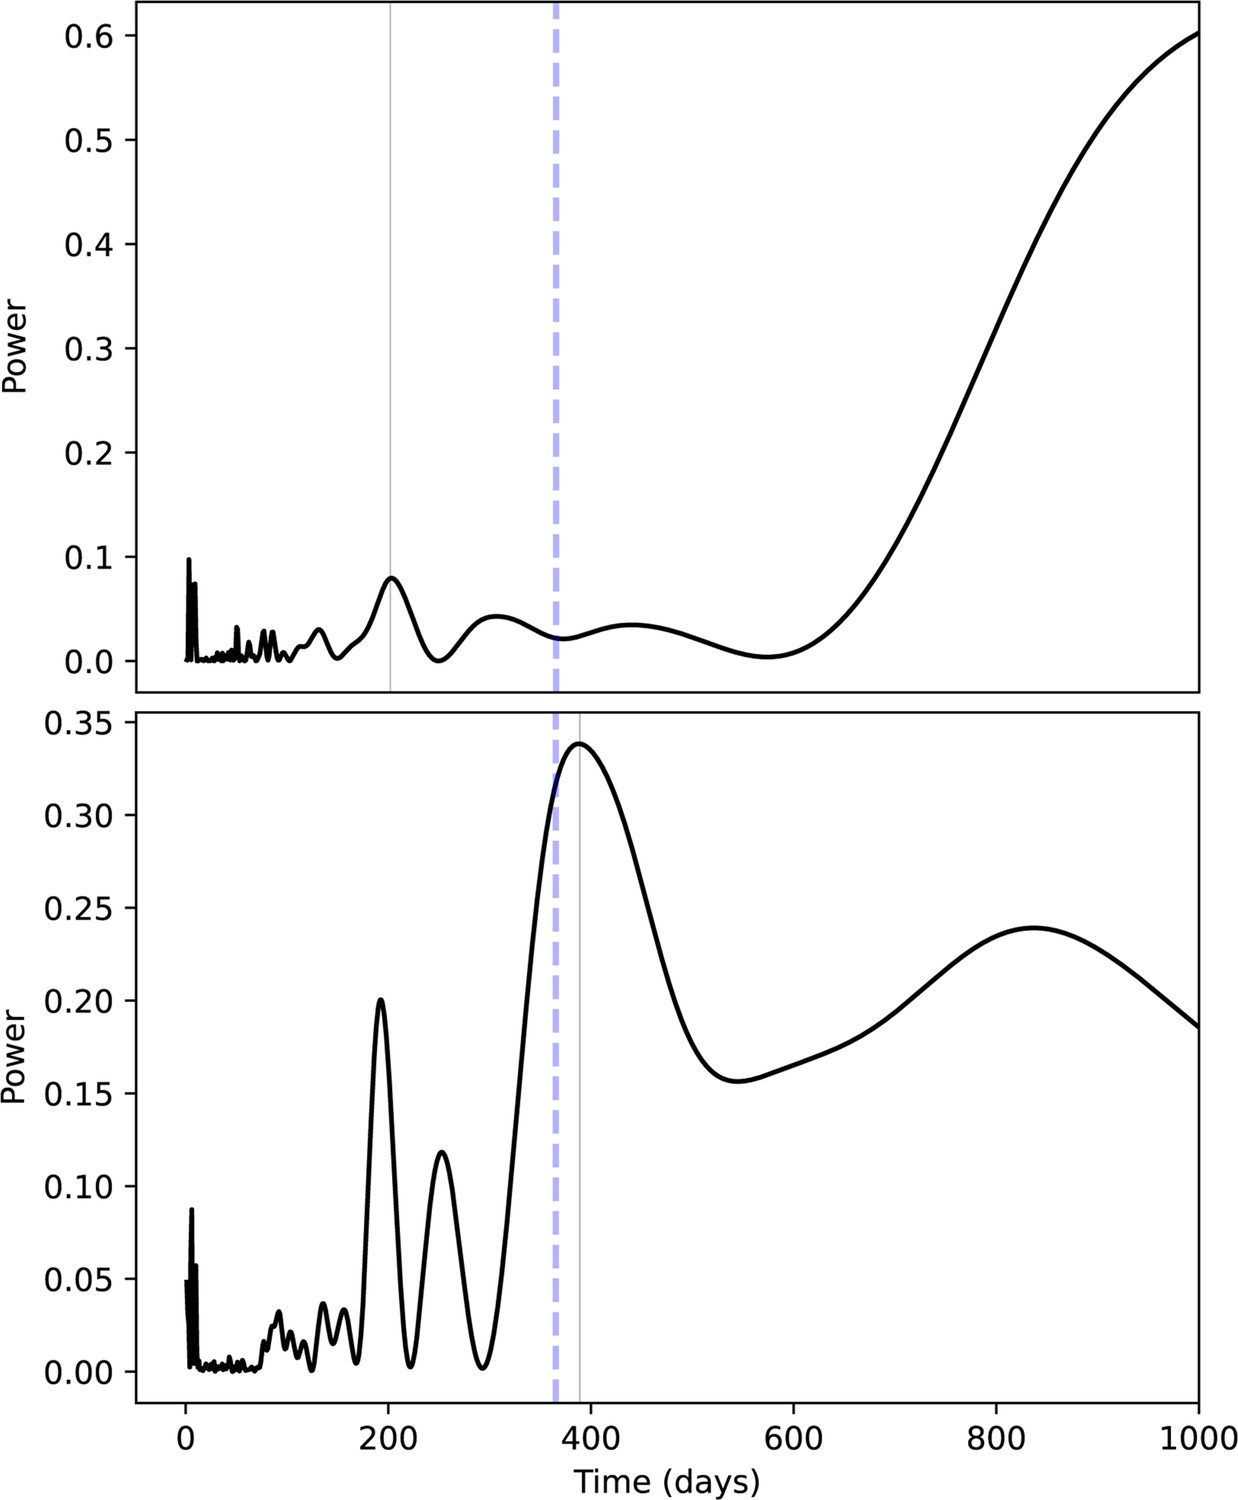
Inferred seasonality of δ18O values from a Bornean (top) and Sumatran (bottom) M1.
Lomb-Scargle periodograms show potential periods in days (x-axis) against period power (y-axis), where higher values on the y-axis indicate underlying sine wave periods that produce, contribute to, or explain δ18O value oscillations. Best-fit periodicities are shown as light gray vertical lines, whereas annual periodicities are indicated by blue dashed horizontal lines. We regard the Bornean M1 (MCZ 5290) as largely aperiodic; a minor peak is observed at c. 6 months, and increasing powers at very high periods are an artifact of limited sampling length within teeth relative to the model. The Sumatran M1 (ZMB 83508) has a 1.1 year inferred frequency, as well as an approximately 6-month peak, likely reflecting semiannual monsoons.
Appendix 1—figure 3

Laser ablation profiles performed across the two teeth from Lida Ajer.
#576 (left) refers to specimen 11595.105; #578 (right) refers to specimen 11594.12. The red dots represent the position of the rasters, and arrows indicate the sequence of the analyses. EN = enamel. DE = dentine.
Appendix 1—figure 4
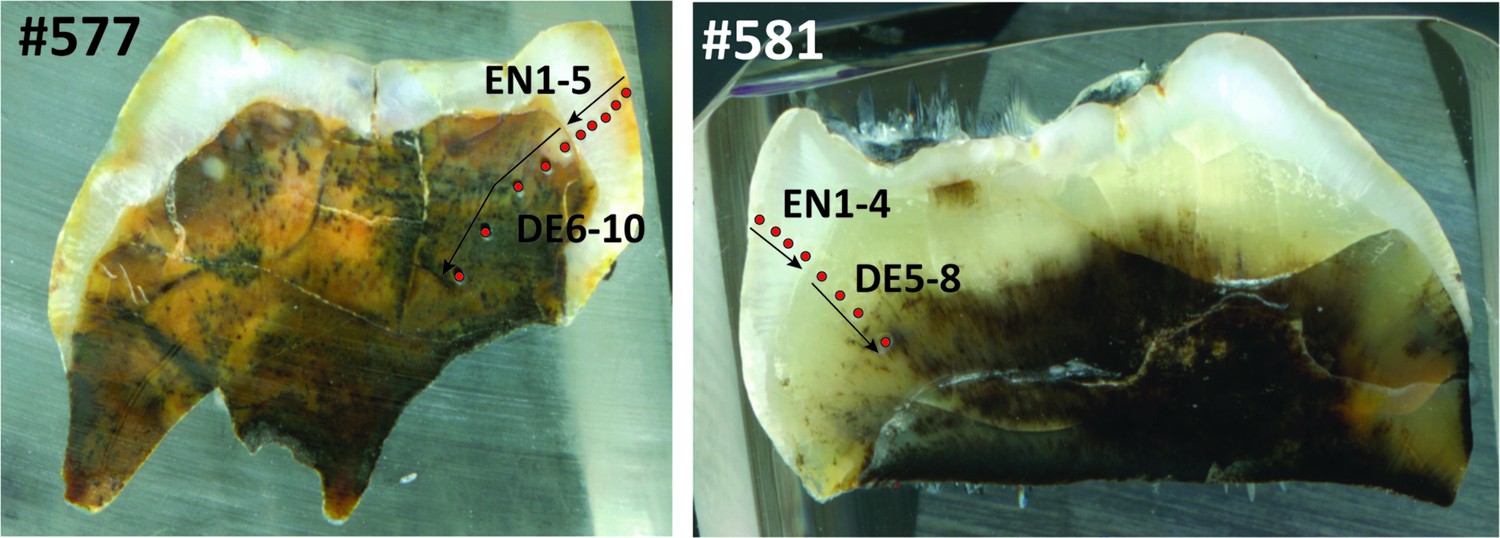
Laser ablation profiles across the two teeth from Sibrambang Cave.
#577 (left) refers to specimen 11565.162; #581 (right) refers to specimen 11564.5. The red dots represent the position of the rasters, and arrows indicate the sequence of the analyses. EN = enamel. DE = dentine.
Appendix 1—figure 5

Laser ablation profiles across the two teeth from Niah Caves.
#579 (left) refers to specimen from grid Y/F4; #580 (right) refers to specimen from grid US/22. The red dots represent the position of the rasters, and arrows indicate the sequence of the analyses. EN = enamel. DE = dentine.
Appendix 1—figure 6

Matching trace element patterns in cross-sections of two isolated molars from the Dubois collection of fossil orangutan teeth from Lida Ajer.
High concentrations are shown in warm colors, low concentration are in cool colors; here Li/Ca is shown, but identical corresponding patterns were also observed for Ba/Ca and Sr/Ca (not shown). The enamel cap of each tooth is to the left, and root dentine is to the right. Trace elements were measured according to LA-ICP-MS methods detailed in Smith et al., 2017.
Tables
Table 1
Modern and fossil orangutan teeth employed in the current study.
| Taxon | Accession | Origin | Sex | Age (years) | Teeth |
|---|---|---|---|---|---|
| Pongo pygmaeus | ZSM 1981/48 | Skalau, Borneo | F | ~8.4 | RUM1, LLM2 |
| ZSM 1981/87 | Skalau, Borneo | F | >9 | LUM1, RUM2, RLM3 | |
| MCZ 5290 | Borneo (location unspecified) | n/a | 4.5 | RUM1 | |
| Pongo abelii | ZSM 1981/246 | Aceh, Sumatra | M | ~8.5 | LLM1, LUM2 |
| ZSM 1981/248 | Aceh, Sumatra | F | adult | LUM1, LUM2, LLM3 | |
| ZMB 83508 | Sumatra (location unspecified) | n/a | 8.8 | RLM1 | |
| Fossil Pongo spp. | 11564.5 | Sibrambang, Sumatra | n/a | n/a | RUM |
| 11565.162 | Sibrambang, Sumatra | n/a | n/a | LUM | |
| 11594.12 | Lida Ajer, Sumatra | n/a | n/a | RLM | |
| 11595.105 | Lida Ajer, Sumatra | n/a | n/a | LLM | |
| US/22 | Niah Caves, Malaysia | n/a | n/a | RLM | |
| Y/F4 | Niah Caves, Malaysia | n/a | n/a | LLM |
-
Numerous taxonomic assignments have been made for fossil orangutans (Pongo spp.), some of which have not been based on clear morphological characteristics (Tshen, 2016), and are not relevant for the focus of this paper.
Table 2
Modern and fossil orangutan molar δ18O values.
| Taxon | Accession | Tooth | Cusp | Spots | Time (days) | dO18 range |
|---|---|---|---|---|---|---|
| P. pygmaeus | ZSM 1981/48 | RUM1 | dl | 151 | 1241 | 13.6–19.9 |
| ZSM 1981/48 | LLM2 | mb | 107 | 804 | 13.0–18.8 | |
| ZSM 1981/87 | LUM1 | ml | 131 | 869 | 13.7-17.9 | |
| ZSM 1981/87 | RUM2 | ml | 196 | 1195 | 12.7–20.0 | |
| ZSM 1981/87 | RLM3 | mb | 220 | 1350 | 13.7–19.2 | |
| MCZ 5290 | RUM1 | ml | 150 | 1002 | 13.8–18.1 | |
| P. abelii | ZSM 1981/246 | LLM1 | mb | 136 | 1425 | 12.3–18.3 |
| ZSM 1981/246 | LUM2 | ml | 229 | 1376 | 12.6–18.0 | |
| ZSM 1981/248 | LUM1 | db | 177 | 1072 | 11.3–19.3 | |
| ZSM 1981/248 | LUM2 | db | 193 | 1374 | 13.5–20.6 | |
| ZSM 1981/248 | LLM3 | db | 191 | 1461 | 14.8–19.6 | |
| ZMB 83508 | RLM1 | db | 135 | 1029 | 13.4–20.4 | |
| Fossil Pongo spp. | 11564.5 | RUM | mb | 178 | 1387 | 15.3–20.4 |
| 11565.162 | LUM | ml | 143 | 1144 | 14.7–20.8 | |
| 11594.12 | RLM | ml | 154 | 1081 | 15.1–19.9 | |
| 11595.105 | LLM | mb | 197 | 1312 | 15.7–20.0 | |
| US/22 | RLM | mb | 149 | 1023 | 15.9–24.8 | |
| Y/F4 | LLM | db | 134 | 869 | 14.2–22.9 |
Table 3
Comparisons of first and second year δ18O values in five first molars.
| Specimen | Adjusted p-values | Higher δ18O values |
|---|---|---|
| MCZ 5290 | p=0.010 | Year 1 |
| ZMB 83508 | p=0.006 | Year 1 |
| ZSM 1981/48 | p=0.161 (NS) | Year 1 |
| ZSM 1981/87 | p<0.001 | Year 2 |
| ZSM 1981/248 | p<0.001 | Year 1 |
Additional files
-
Supplementary file 1
U-series dates for fossil orangutan material.
230Th/238U and 234U/238U are activity ratios. It is worth noting that, for most transect analyses, the 232Th signal, which was measured on a Faraday collector, was indistinguishable from background noise. In this regard, the corresponding 230Th/232Th activity ratio of each transect should be >>100, and thus non-radiogenic or detrital 230Th correction would have negligible impact on the age. U-series data in italics should be viewed with caution due to U concentrations of ≤0.5 ppm. All errors are 2-σ. Key: EN = enamel; DE = dentine; n.c.=not calculable. Negative values were caused by background extraction from their measured peaks with intensities at detection levels.
- https://cdn.elifesciences.org/articles/90217/elife-90217-supp1-v1.docx
-
MDAR checklist
- https://cdn.elifesciences.org/articles/90217/elife-90217-mdarchecklist1-v1.docx
-
Source data 1
Source data for Figures 2—4, Appendix 1—figures 1 and 2.
- https://cdn.elifesciences.org/articles/90217/elife-90217-data1-v1.xlsx
Download links
A two-part list of links to download the article, or parts of the article, in various formats.
Downloads (link to download the article as PDF)
Open citations (links to open the citations from this article in various online reference manager services)
Cite this article (links to download the citations from this article in formats compatible with various reference manager tools)
Oxygen isotopes in orangutan teeth reveal recent and ancient climate variation
eLife 12:RP90217.
https://doi.org/10.7554/eLife.90217.3


