Trans regulation of an odorant binding protein by a proto-Y chromosome affects male courtship in house fly
- Department of Biology & Biochemistry, University of Houston, United States
Figures
Figure 1 with 1 supplement
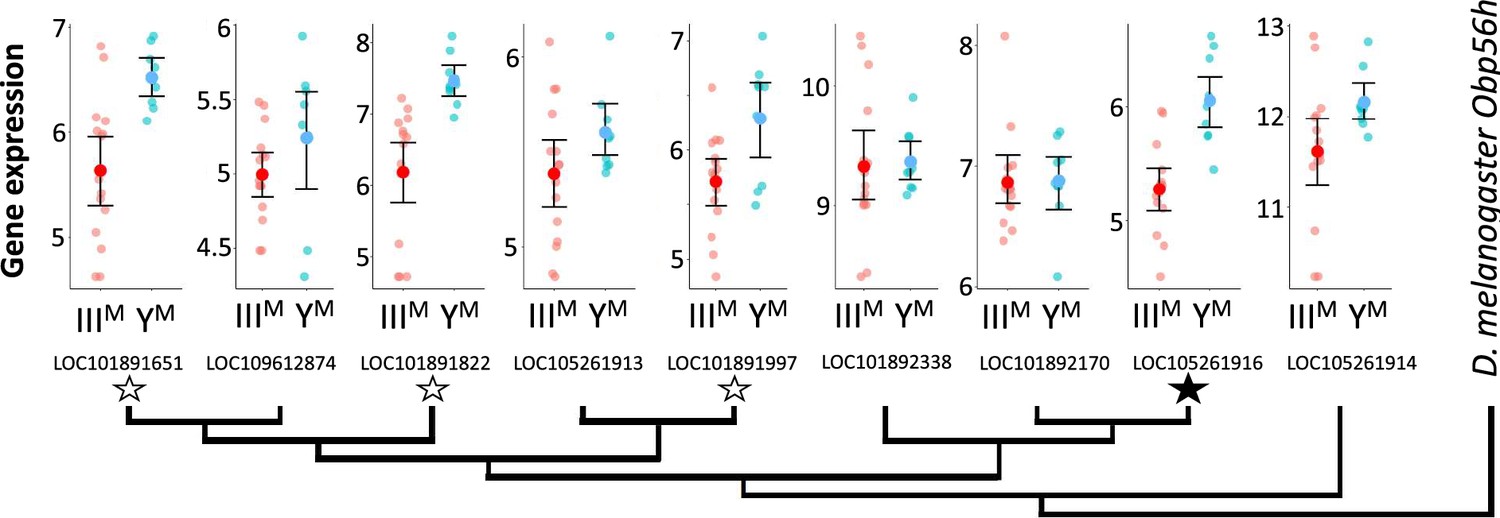
Neighbor-joining phylogenetic tree of the Obp56h gene family within M. domestica and D. melanogaster based on protein sequences constructed in MEGA X (Kumar et al., 2018).
Amino acid sequences were aligned by MUSCLE (Edgar, 2004). M. domestica Obp56h genes are identified based on gene IDs. The bootstrap consensus tree was inferred from 10,000 replicates. Branch lengths are scaled according to the number of amino acid substitutions per site. The phylogeny was arbitrarily rooted at D. melanogaster Obp56h. Graphs at the branch tips show batch-adjusted expression levels for each M. domestica Obp56h gene from each replicate (small circles). Large circles show the average across all replicates, with error bars denoting the standard error (unfilled stars: p<0.05 before false discovery rate [FDR] correction for multiple comparisons; filled star: p<0.05 after correction).
Figure 1—figure supplement 1
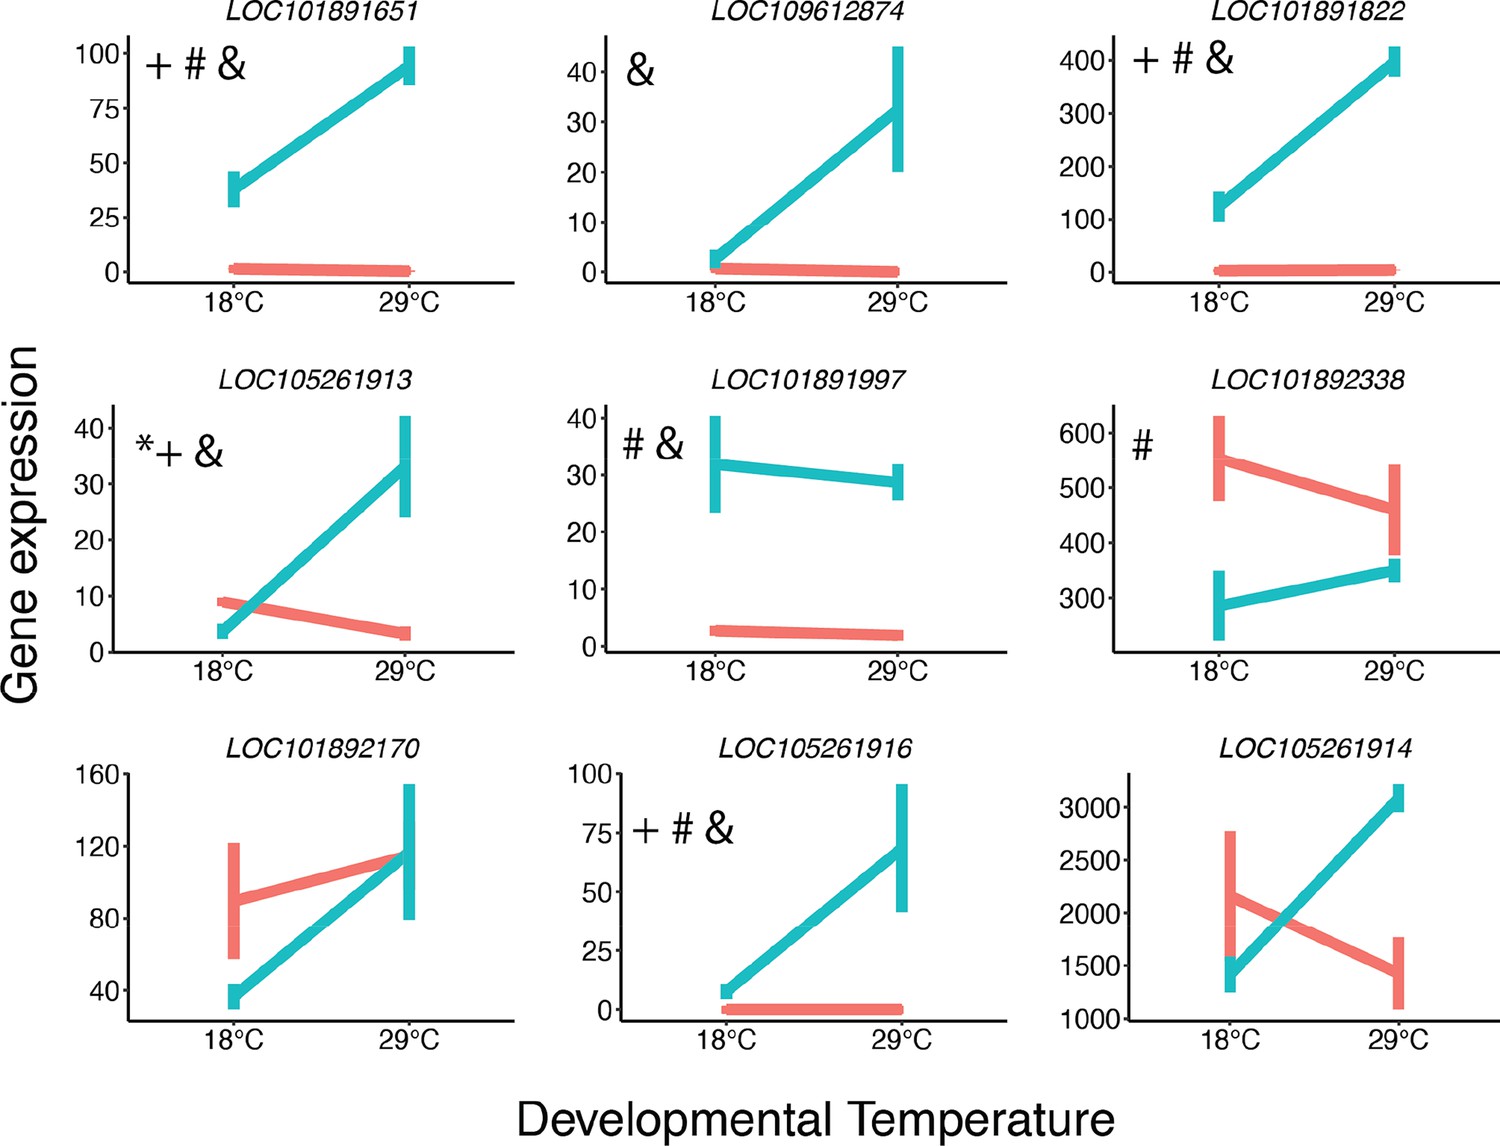
Summary of Obp56h expression in IIIM (red) and YM (blue) males reared at 18°C and 29°C.
Obp56h genes are identified based on gene ID. Error bars denote standard errors of the mean (three replicate samples per genotype × temperature group). Significance of effects are shown by symbols: * significant G×T effect, + Temperature effect in YM males, # Genotype effect at 18°C, and & Genotype effect at 29°C. Data taken from Adhikari et al., 2021.
Figure 2 with 2 supplements
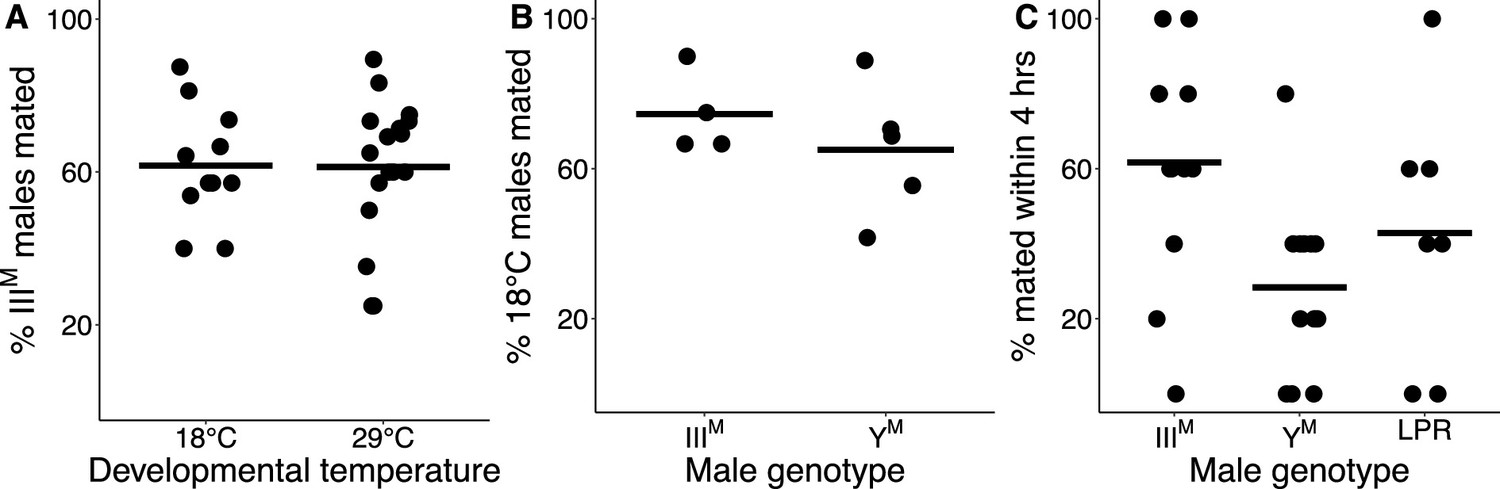
IIIM chromosome and developmental temperature affect male courtship success.
(A) Outcomes of competitive courtship assays between IIIM and YM males reared at 18°C or 29°C. Data points represent experimental batches. Horizontal lines denote the median across all batches. (B) Outcomes of competitive courtship assays conducted between males reared at 29°C and 18°C. Trials were conducted between males of the same proto-Y chromosome genotype (IIIM or YM). Each data point represents 10 replicate trials within a single batch. (C) Outcomes of single-choice courtship assays in males reared at 22°C. Data points refer to the percentage of males (five males within one replicate) that mated with females within 4 hr within each experimental trial. Horizontal lines denote means within male groups. All females used were from the LPR strain.
Figure 2—figure supplement 1
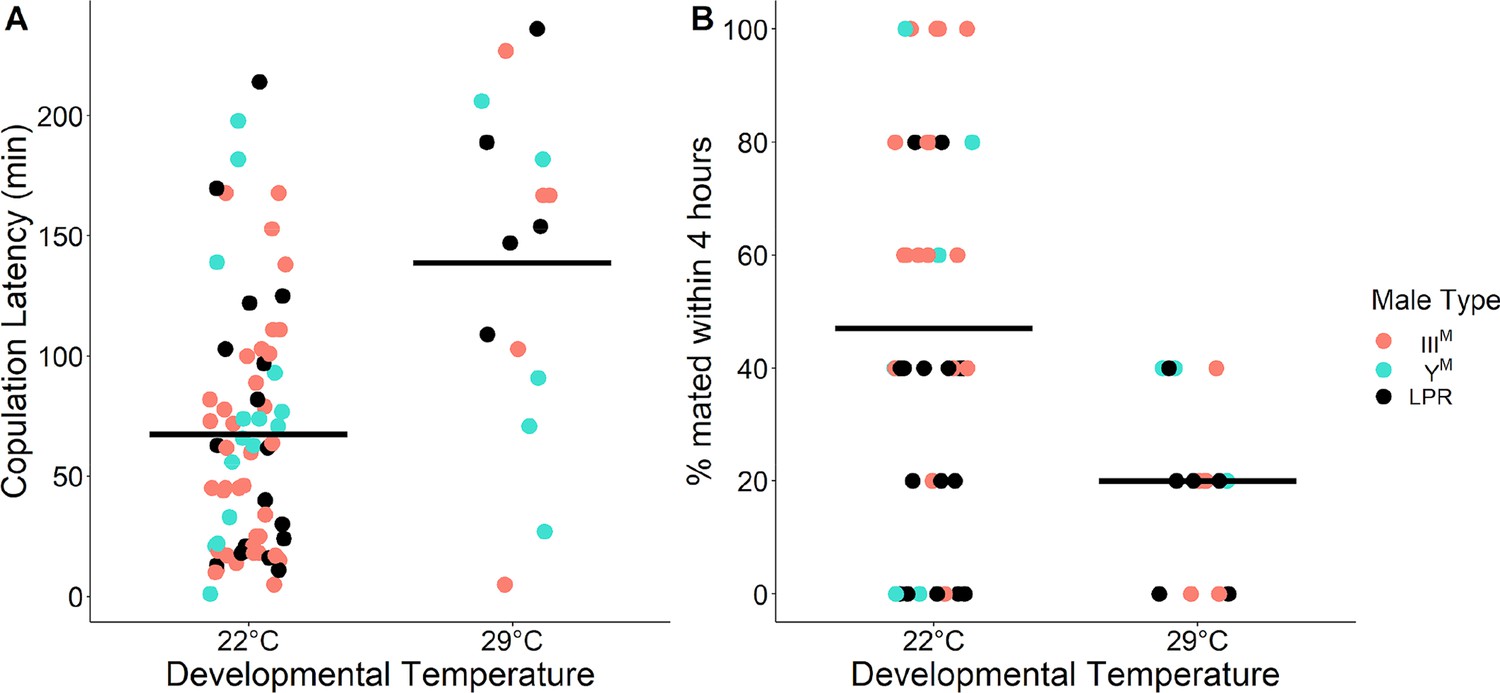
Summary of the effect of developmental temperature on copulation latency in IIIM (salmon), YM (turquoise), and LPR (black) males reared at 22°C and 29°C.
(A) Copulation latency is estimated as the time taken to copulate (attached >1 min) with a female. (B) Copulation latency is estimated as a proportion of males (out of five males within one replicate) that mated with females within 4 hr within each experimental trial. All females used were from the LPR strain. Horizontal lines denote means within a given developmental temperature treatment.
Figure 2—figure supplement 2
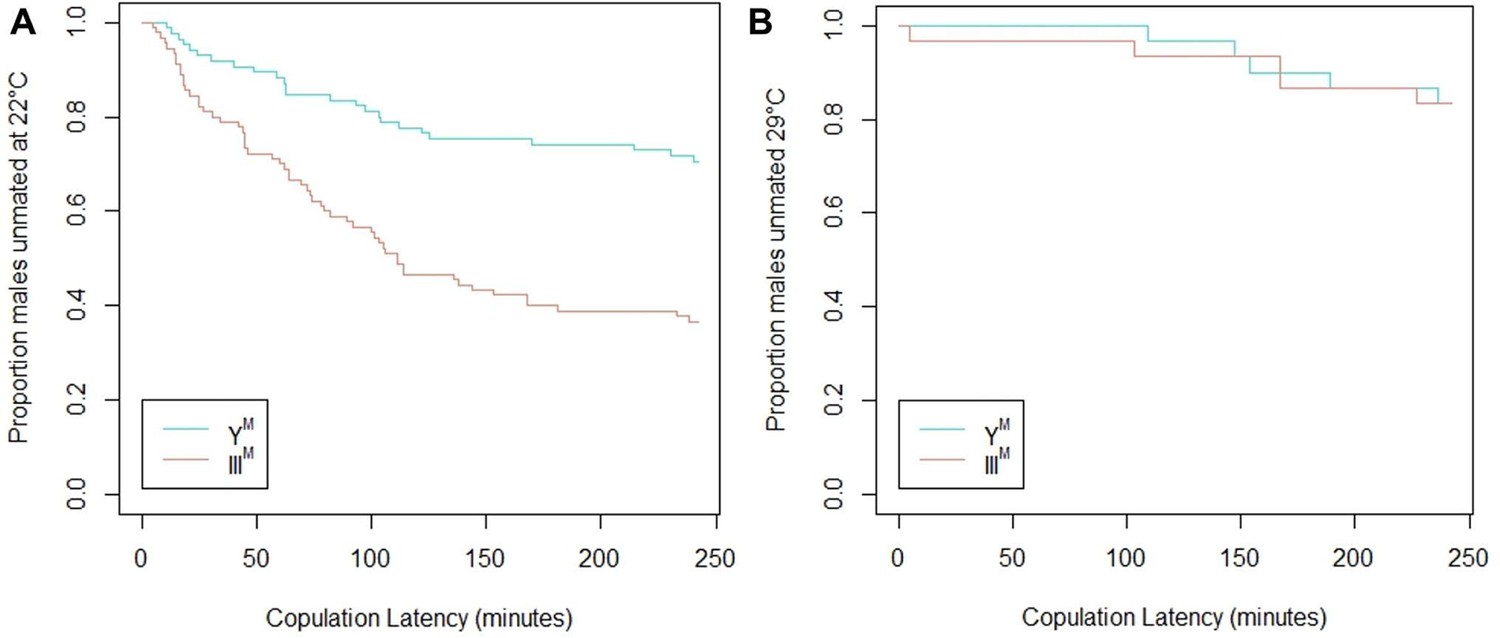
Summary of survival analysis results between male proto-Y chromosome genotypes and developmental temperatures.
Summary of survival analysis results (pooled across experimental batches) depicting the proportion of unmated YM (turquoise) and IIIM (salmon) males as a function of time (minutes), at 22°C (A) and 29°C (B). Censored observations not depicted.
Figure 3 with 1 supplement
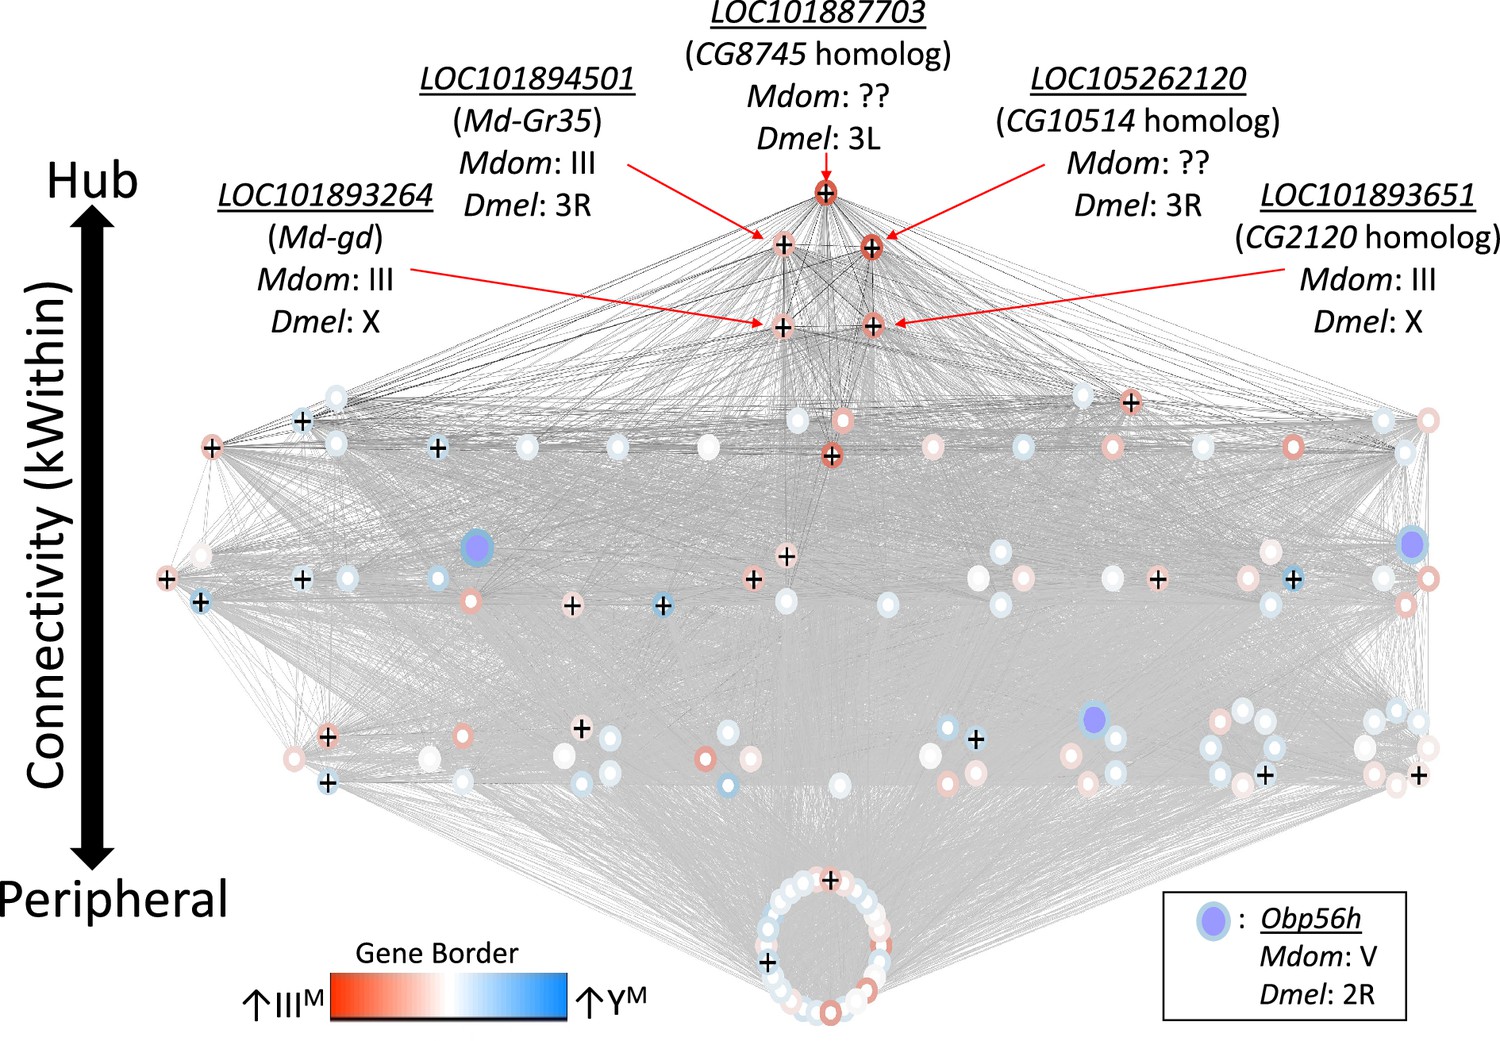
Network visualization of the co-expression module that is differentially regulated between IIIM and YM males.
Each circle within the module is a gene, and Obp56h genes are indicated with purple fill. Lines represent edge connections between genes. Genes labeled with ‘+’ are within the top 100 most strongly connected to Obp56h genes. Genes are ordered from top to bottom according to intramodular connectivity (kWithin), with genes of higher connectivity (i.e. hub genes) on top, and peripheral genes on the bottom. Borders around genes denote log2 fold-change in expression between YM and IIIIM male heads, with darker blue borders denoting upregulation in YM, and darker red borders denoting upregulation in IIIM. Chromosomal locations in house fly (Mdom) and D. melanogaster (Dmel) are shown for the five hub genes and Obp56h.
Figure 3—figure supplement 1
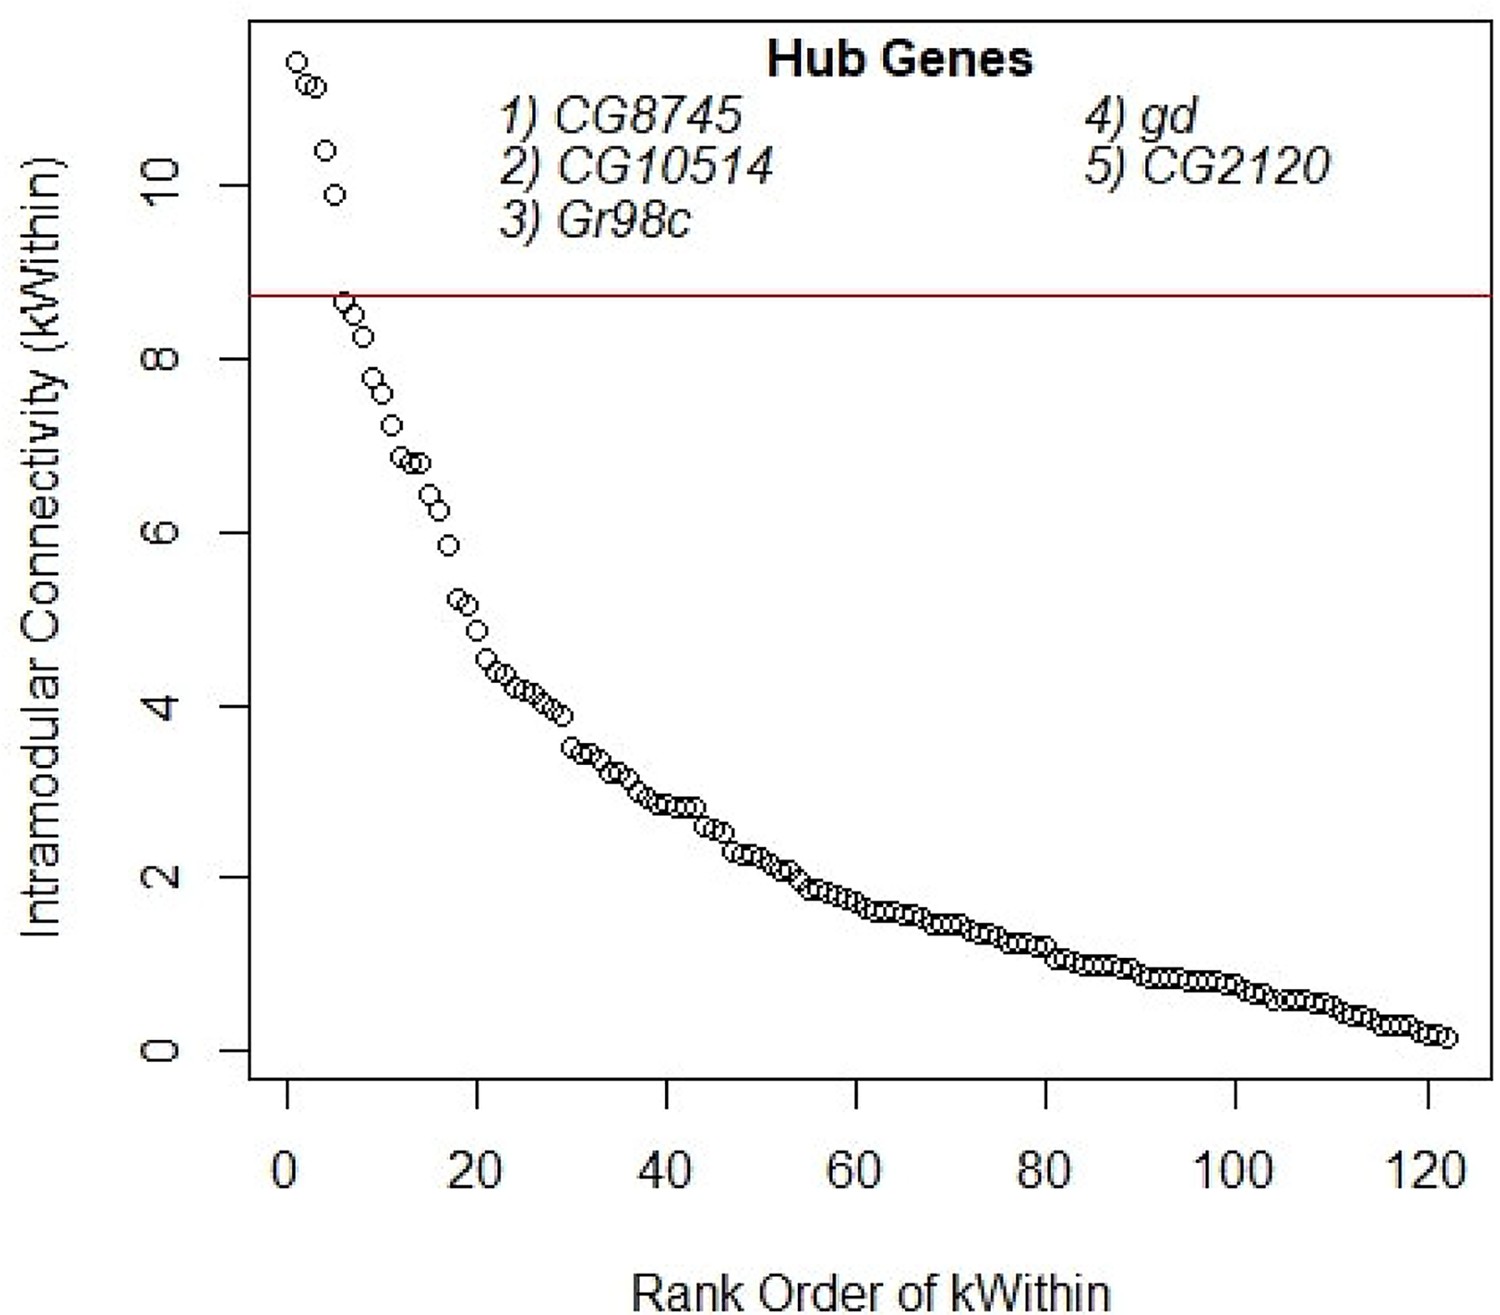
Measures of intramodular connectivity (kWithin) for individual genes within the gene co-expression module, ranked in descending order.
The horizontal red line denotes the separation between the top five hub genes (listed in descending order of kWithin) and the remainder of the genes in the module. Each data point indicates the kWithin value of an individual gene.
Figure 4 with 2 supplements
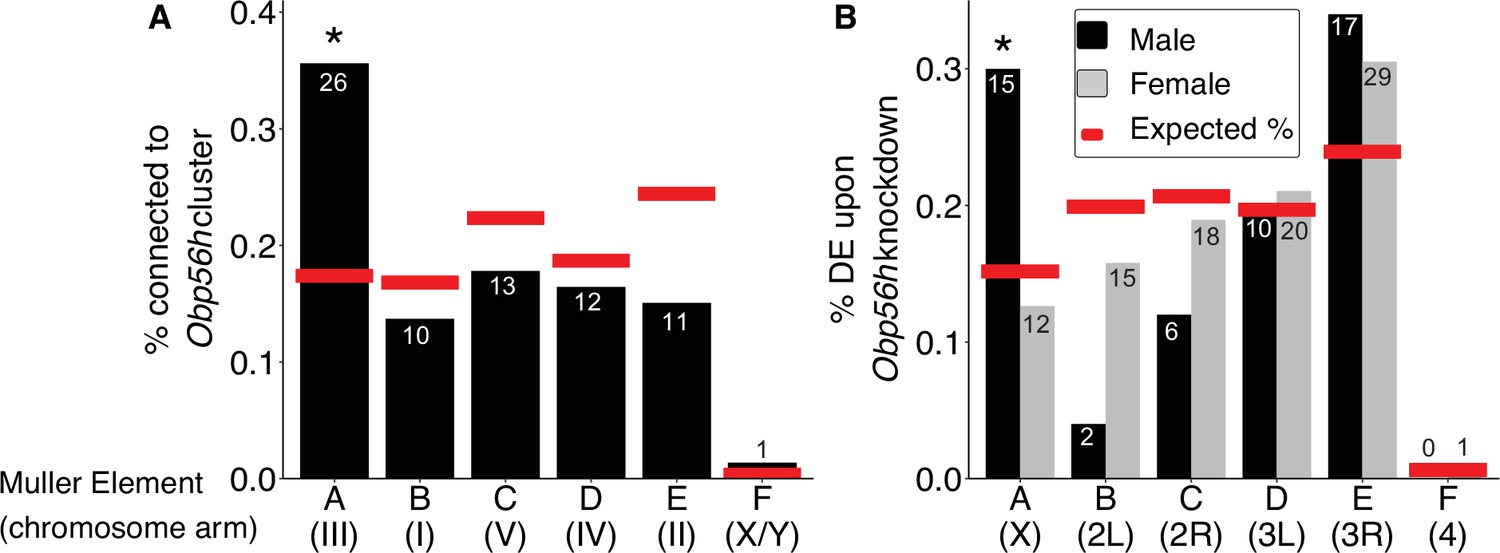
Obp56h expression is correlated with the expression of genes on Muller Element A.
Percent of genes on each chromosome within (A) the top 100 genes with the strongest correlated co-expression to the Obp56h family in house fly, and (B) genes differentially expressed (DE) between Obp56h knockdown and control D. melanogaster (black bars: males, gray bars: females). Asterisks indicate a significant difference between observed (bars) and expected (red lines) counts of genes on each chromosome compared to all other chromosomes (Fisher’s exact test, p<0.05). Numbers within or above bars denote the observed number of genes on a given Muller Element.
Figure 4—figure supplement 1
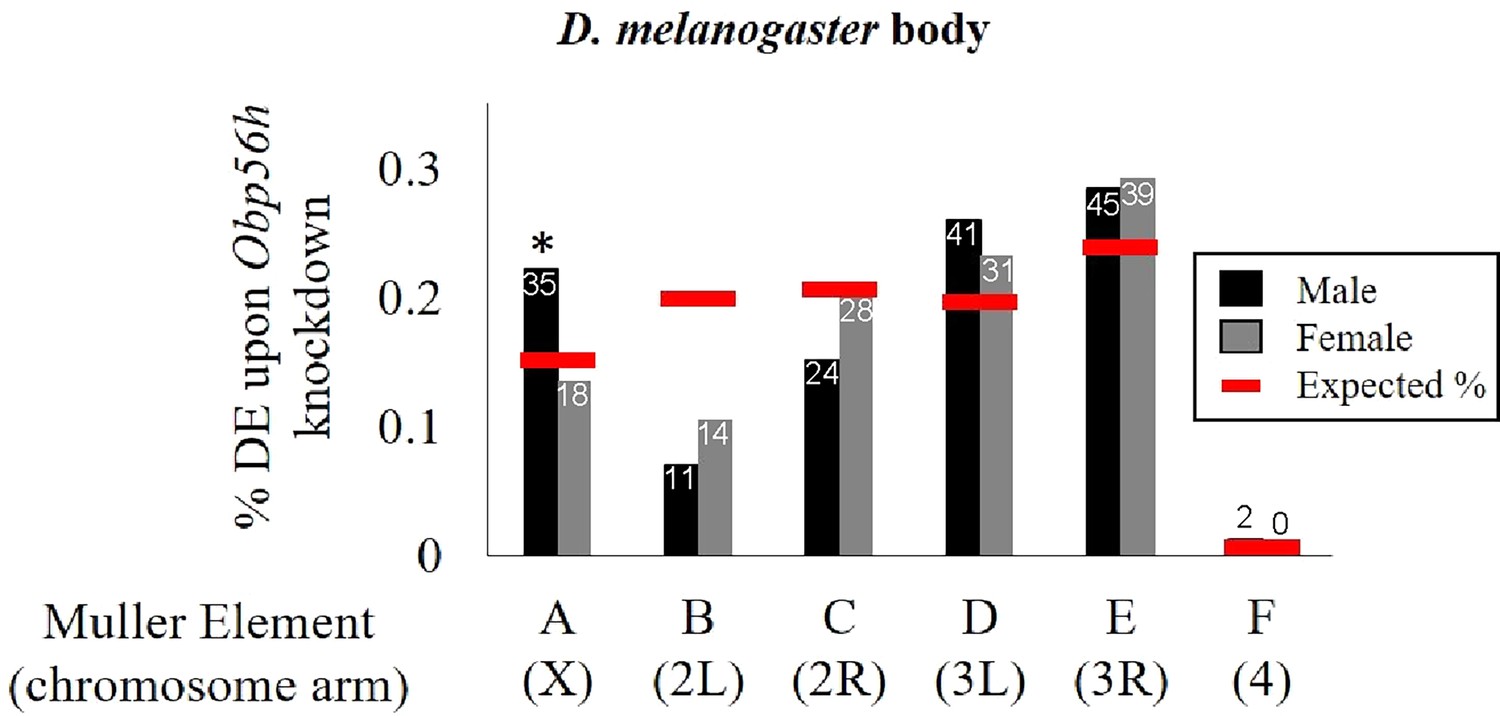
Proportions of genes on each chromosome that are differentially expressed in the body (head removed) between Obp56h knockdown and control D. melanogaster (black bars: males, gray bars: females).
Asterisks indicate a significant difference between observed (bars) and expected (red lines) counts of genes on each chromosome compared to all other chromosomes (Fisher’s exact test, p<0.05). Numbers within or above bars denote the observed number of differentially expressed genes on a given Muller Element.
Figure 4—figure supplement 2
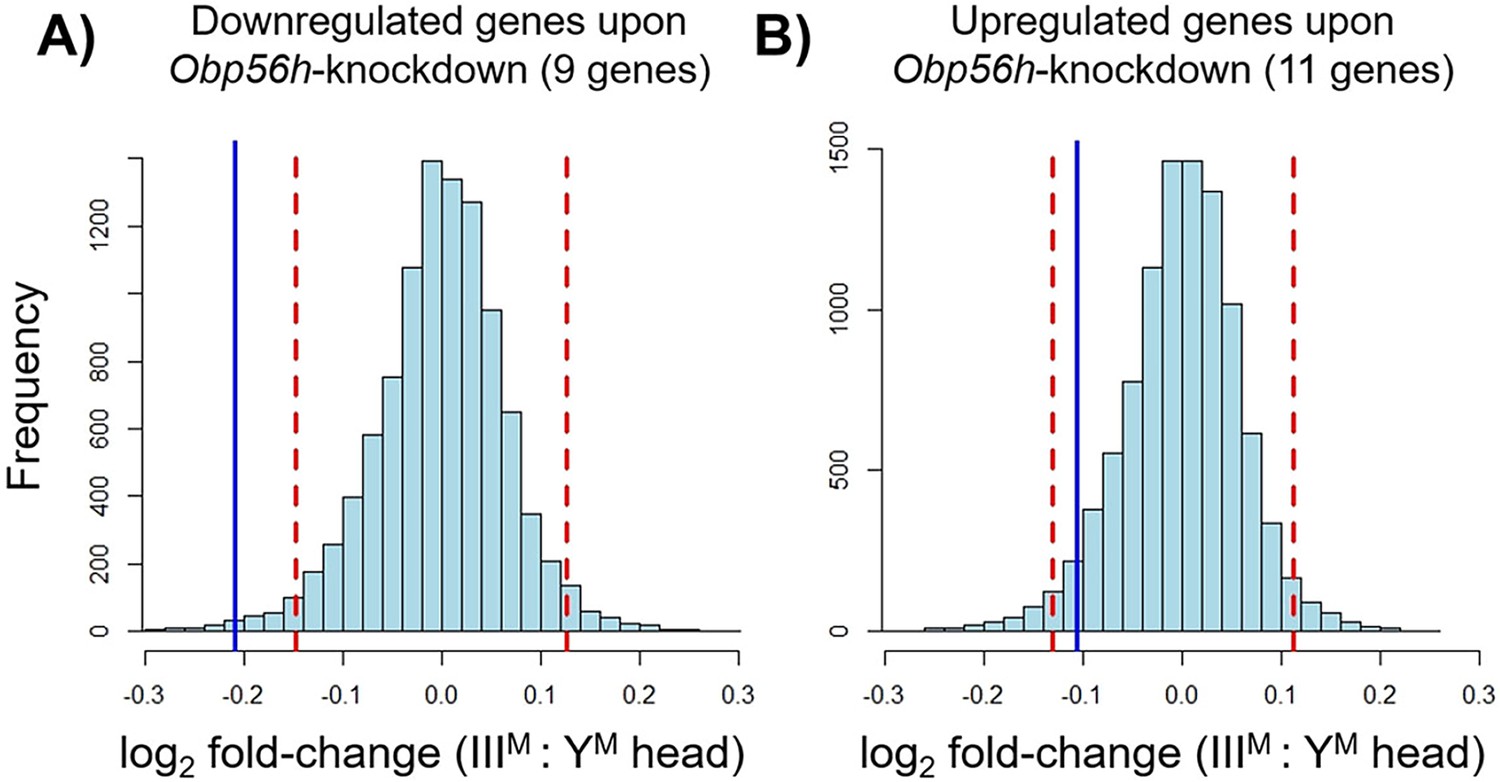
Differential expression between male house fly genotypes of genes that are differentially expressed upon Obp56h knockdown in D. melanogaster.
Positive values indicate higher expression in IIIM house fly males, and negative values indicate higher expression in YM males. The blue vertical line in each panel indicates the observed mean log2 fold-change for house fly transcripts of genes that are downregulated (A, 9 genes) or upregulated (B, 11 genes) upon Obp56h knockdown in D. melanogaster (Shorter et al., 2016). Histograms show the distributions of mean log2 fold-change values (A, for 9 randomly chosen genes; B, for 11 randomly chosen genes) drawn from a pool of all log2 fold-change differences in expression between IIIM and YM males. Histograms were generated from 10,000 replicate draws of random genes without replacement. Dashed red lines show the boundaries for the middle 95% of the distributions.
Figure 5
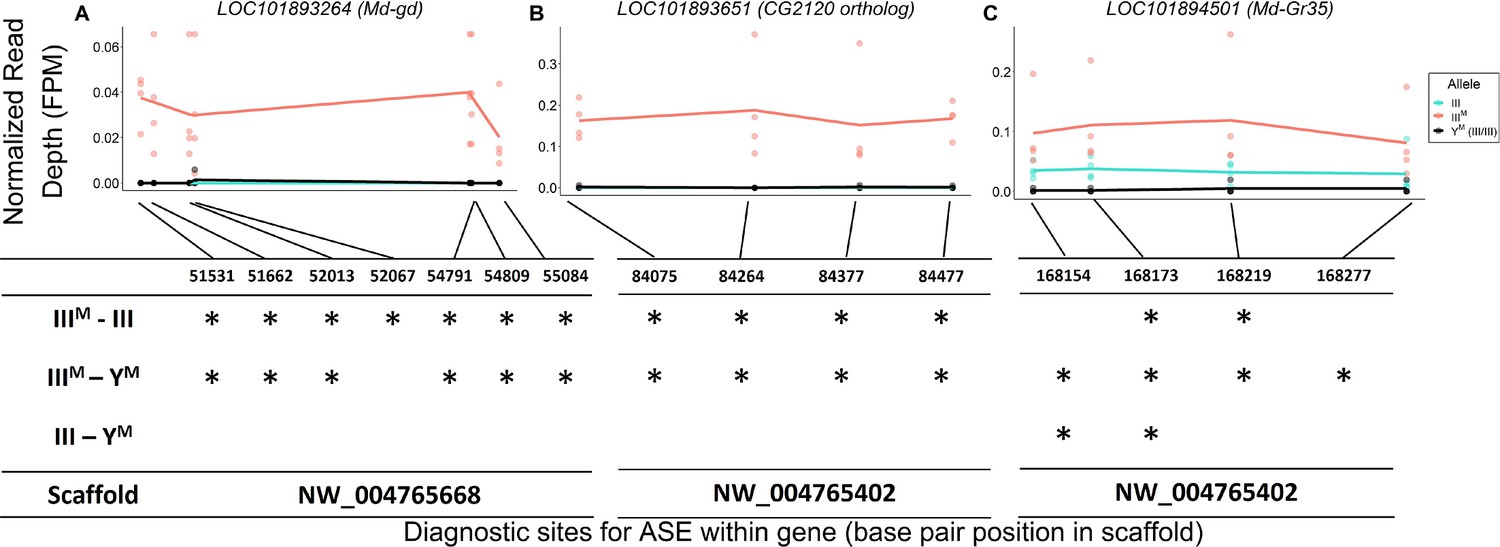
Evidence for IIIM-biased expression of hub genes on house fly chromosome III.
Allele-specific expression (ASE) in (A) LOC101893264 (Md-gd), (B) LOC101893651 (CG2120 ortholog), and (C) LOC101894501 (Md-Gr35).The x-axis depicts base pair positions (scaffold coordinates) of the informative single nucleotide polymorphisms (SNPs) that differ between IIIM and standard chromosome III alleles. The y-axis and data points depict the read depth of a given allele normalized by the total mapped reads for a given strain-by-experimental batch group combination (FPM = fragments per million). Lines depict mean read depths at each diagnostic site for III (turquoise) and IIIM (salmon) alleles in IIIM males, and mean read depths at each site for III alleles in YM males (black). Tables under each graph mark significant differences (*: p<0.05) in normalized read depths at each diagnostic site for each of three pairwise comparisons: IIIM allele vs. III allele in IIIM males (IIIM-III), IIIM allele in IIIM males vs. both III alleles in YM males (IIIM-YM), III allele in IIIM males vs. both III alleles in YM males (III-YM).
Figure 6 with 1 supplement
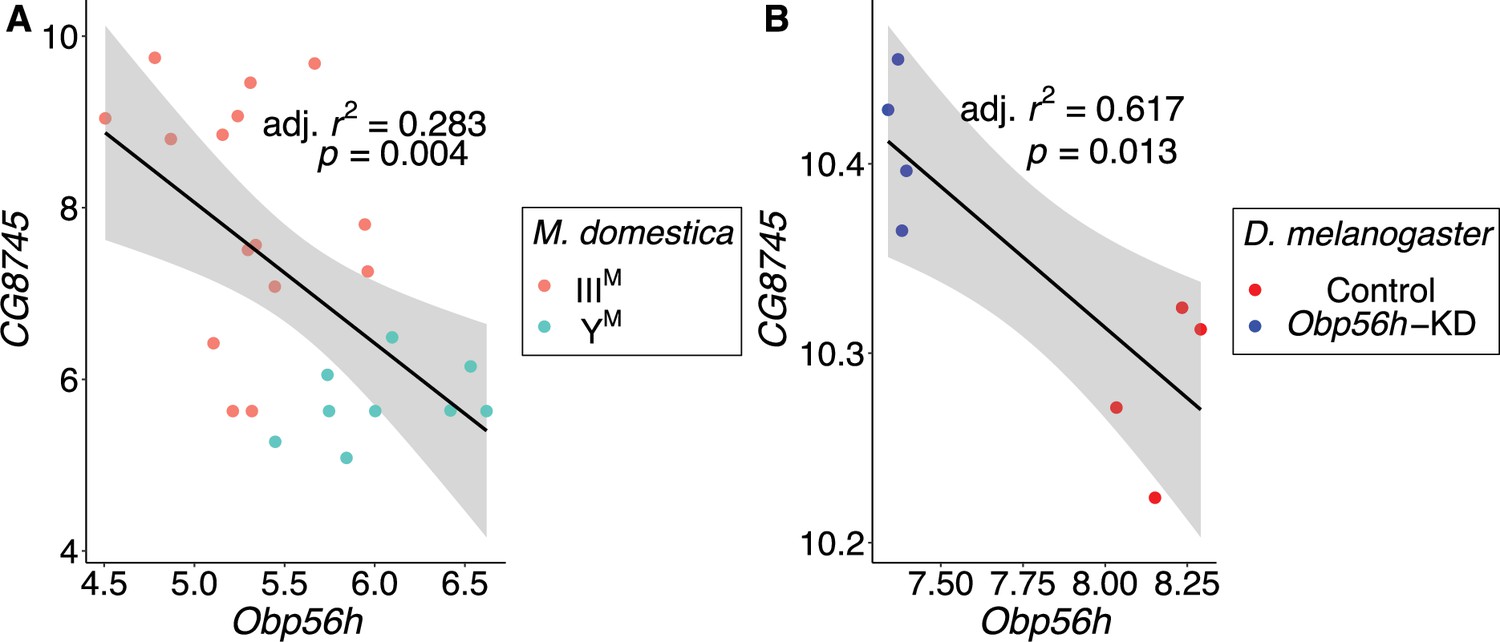
CG8745 and Obp56h expression are correlated in male head tissue of both M. domestica and D. melanogaster.
Correlations of gene expression between Obp56h (house fly LOC105261916) and CG8745 (LOC101887703) in (A) house fly male head tissue and (B) D. melanogaster male head tissue. Values for D. melanogaster are from count data as reported in Shorter et al., 2016. Linear regression models were used to determine 95% confidence intervals (shaded in gray) summarizing the effect of Obp56h expression on CG8745 expression in each species.
Figure 6—figure supplement 1
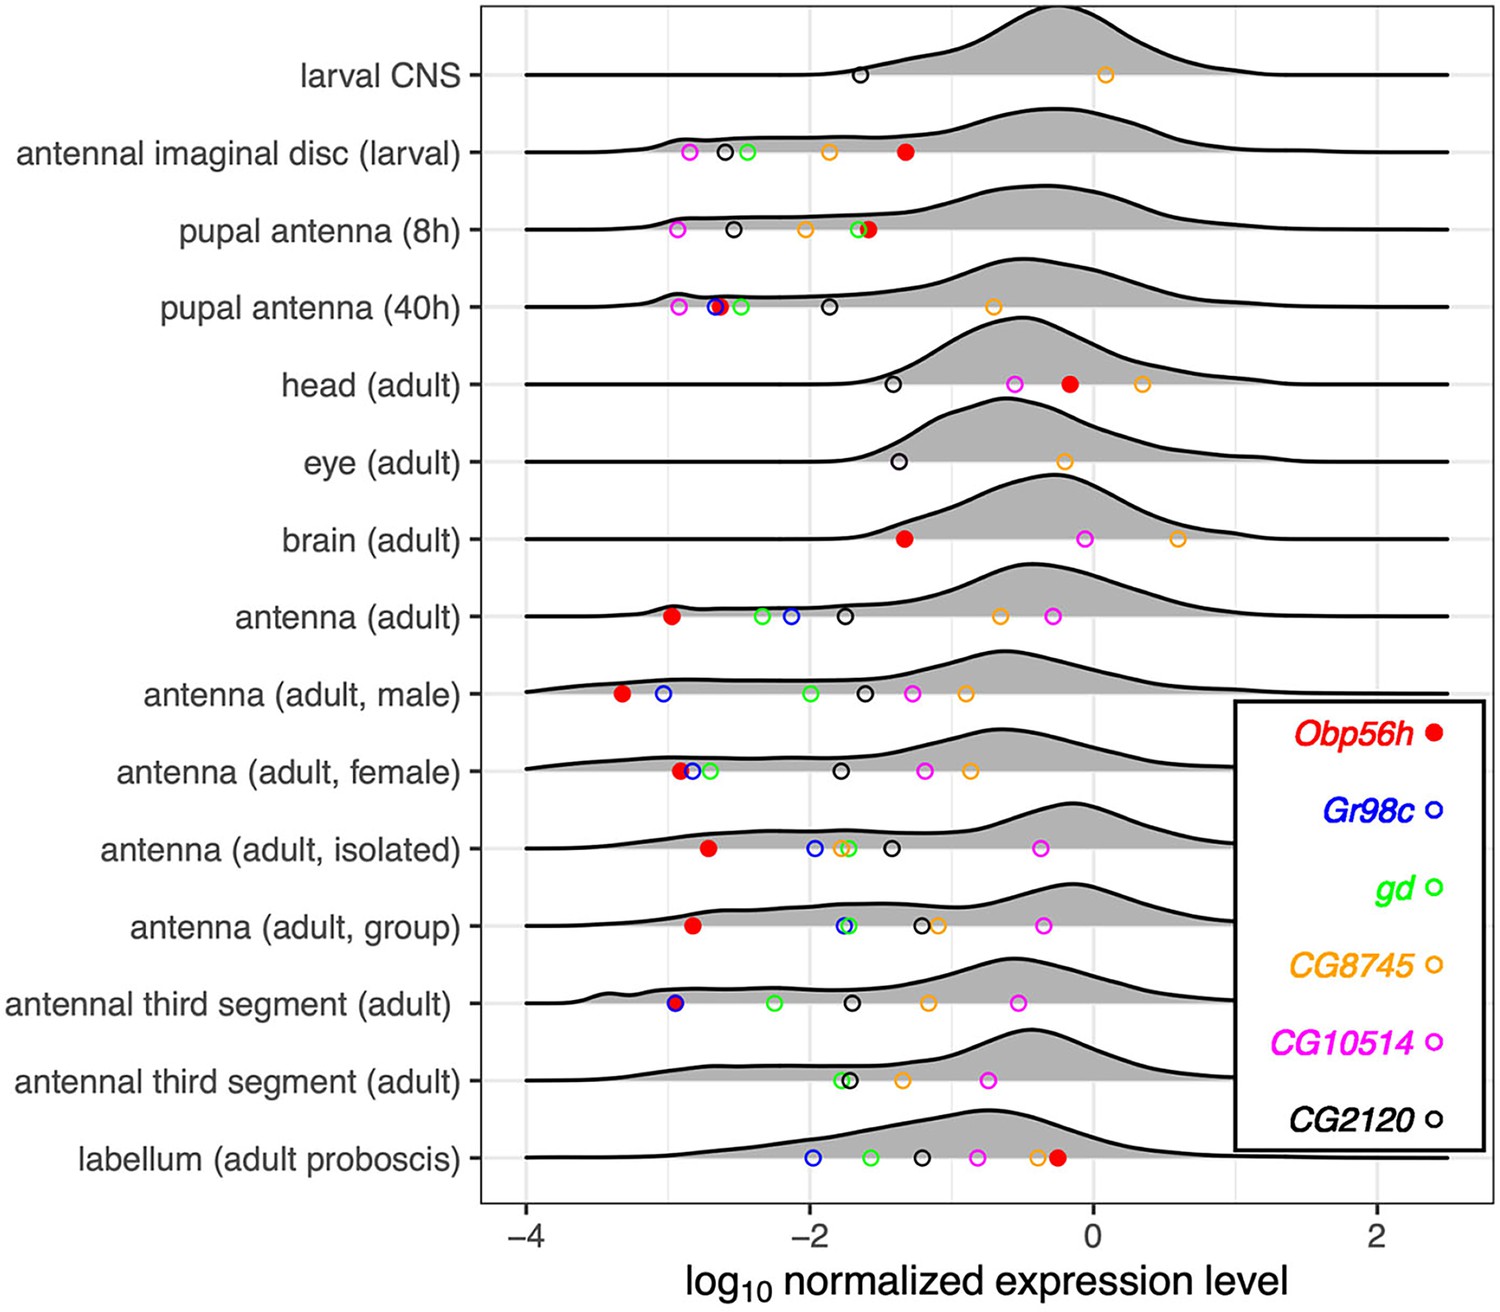
Expression levels in D. melanogaster head tissues of Obp56h and the hub genes in the co-expression network.
The distribution of log10 normalized expression levels for all genes above a minimum threshold in a given tissue sample are plotted as smoothed histograms. Normalized expression was calculated for each gene or transcript in a tissue sample by dividing by the mean expression level across all genes or transcripts in the tissue sample. Tissue samples include two larval samples (central nervous system [CNS] and antennal imaginal disc), two pupal samples (antennae at 8 hr post pupation and 40 hr post pupation), and 11 adult samples. The expression levels of individual genes are shown as colored circles on the x-axis of each histogram. If a colored circle is not shown for a tissue, the gene corresponding to that color was not detected as expressed in the tissue.
Figure 7
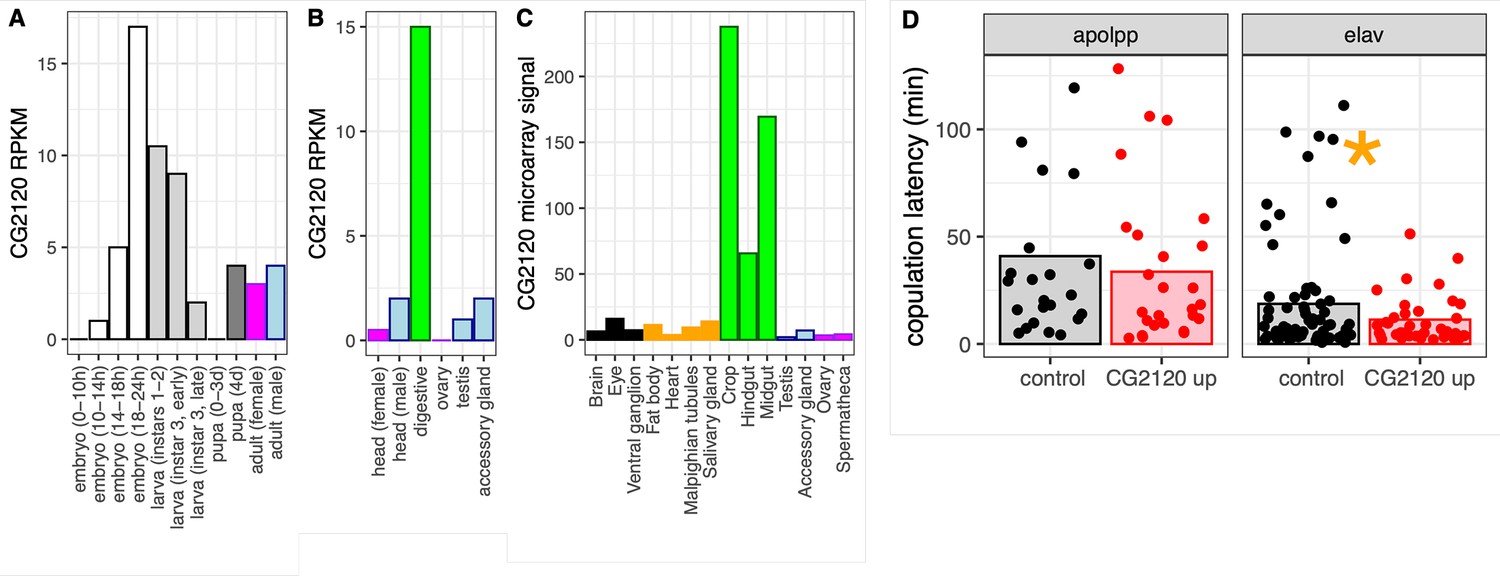
CG2120 is broadly expressed and affects copulation latency.
Expression levels of CG2120 are plotted using (A) RNA-seq data from developmental stages (Graveley et al., 2011), (B) RNA-seq data from adult tissues (Brown et al., 2014), or (C) microarray data from adult tissues (Chintapalli et al., 2007). Expression measurements are shown as reads per kilobase per million mapped reads (RPKM) values for RNA-seq data and signal intensity for microarray data (Öztürk-Çolak et al., 2024). Bars are colored based on tissue sample categories: embryo (white), larva (light gray), pupa (dark gray), adult female (magenta), adult male (light blue), neuronal (black), digestive tract (green), or other adult tissues (orange). (D) Copulation latency in control male D. melanogaster and males in which CG2120 was upregulated (CG2120 up) in fat body cells (using an apolpp Gal4 driver) or neurons (elav driver). Each dot is a single male for which copulation latency was measured. Vertical bars show the estimated effect of male genotype (control or upregulated) from a linear model in which male genotype is a fixed effect and female strain and batch are random effects. The asterisk indicates a significant difference (p<0.05) between control and CG2120 upregulated for a specific tissue driver.
Figure 8
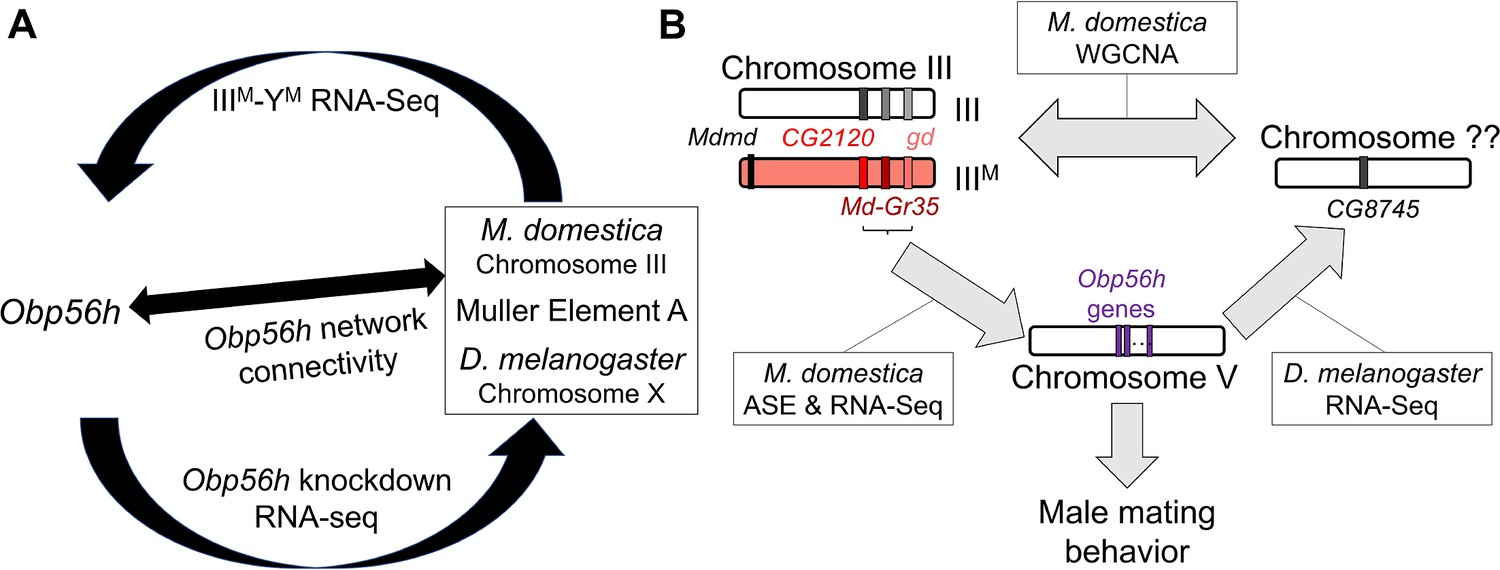
Hypothesized relationships between Obp56h expression, proto-Y chromosome genotype, and male mating behavior based on house fly and D. melanogaster gene expression data.
(A) Summary of evidence for an evolutionarily conserved trans regulatory loop between Obp56h and Muller element A (house fly chromosome III and D. melanogaster X chromosome). Our hypothesis is based on differential expression between IIIM vs. YM male house flies, Obp56h knockdown vs. control D. melanogaster, and network connectivity of Obp56h family gene expression within house fly. (B) Summary of candidate genes implicated in conserved trans regulatory loop. Three of the top five hub genes of module A are located on house fly chromosome III, are negatively correlated with Obp56h expression, and exhibit either allele-specific expression (ASE) or show signs of monoallelic gene expression biased toward the IIIM allele. Similar correlations between expression measures of Obp56h and CG8745 (LOC101887703) in D. melanogaster and house fly male head tissue suggest that Obp56h regulates CG8745, which is the primary hub gene in the weighted gene co-expression network analysis (WGCNA) module that is differentially expressed between IIIM and YM male house flies. Shared correlations between Obp56h expression and copulation latency in both house fly and D. melanogaster also suggest that Obp56h regulates male fly mating behavior.
Additional files
-
Supplementary file 1
Supplementary tables (1A–1H) described throughout main text.
- https://cdn.elifesciences.org/articles/90349/elife-90349-supp1-v1.xlsx
-
MDAR checklist
- https://cdn.elifesciences.org/articles/90349/elife-90349-mdarchecklist1-v1.docx
Download links
A two-part list of links to download the article, or parts of the article, in various formats.
Downloads (link to download the article as PDF)
Open citations (links to open the citations from this article in various online reference manager services)
Cite this article (links to download the citations from this article in formats compatible with various reference manager tools)
Trans regulation of an odorant binding protein by a proto-Y chromosome affects male courtship in house fly
eLife 13:e90349.
https://doi.org/10.7554/eLife.90349


