A novel machine learning algorithm selects proteome signature to specifically identify cancer exosomes
- Department of Cancer Biology, University of Texas MD Anderson Cancer Center, United States
- Department of Bioengineering, Rice University, United States
- Department of Molecular and Cellular Biology, Baylor College of Medicine, United States
Figures
Figure 1
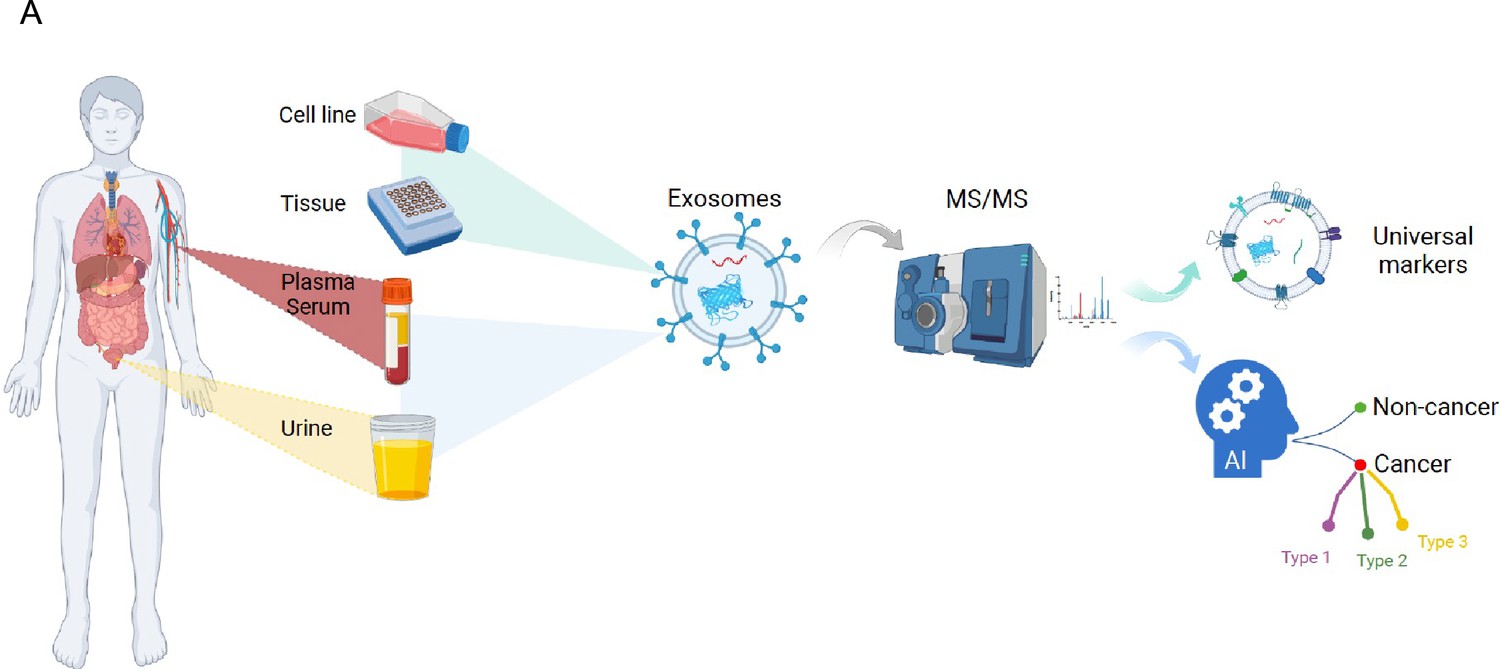
Overview of the study.
Figure 2
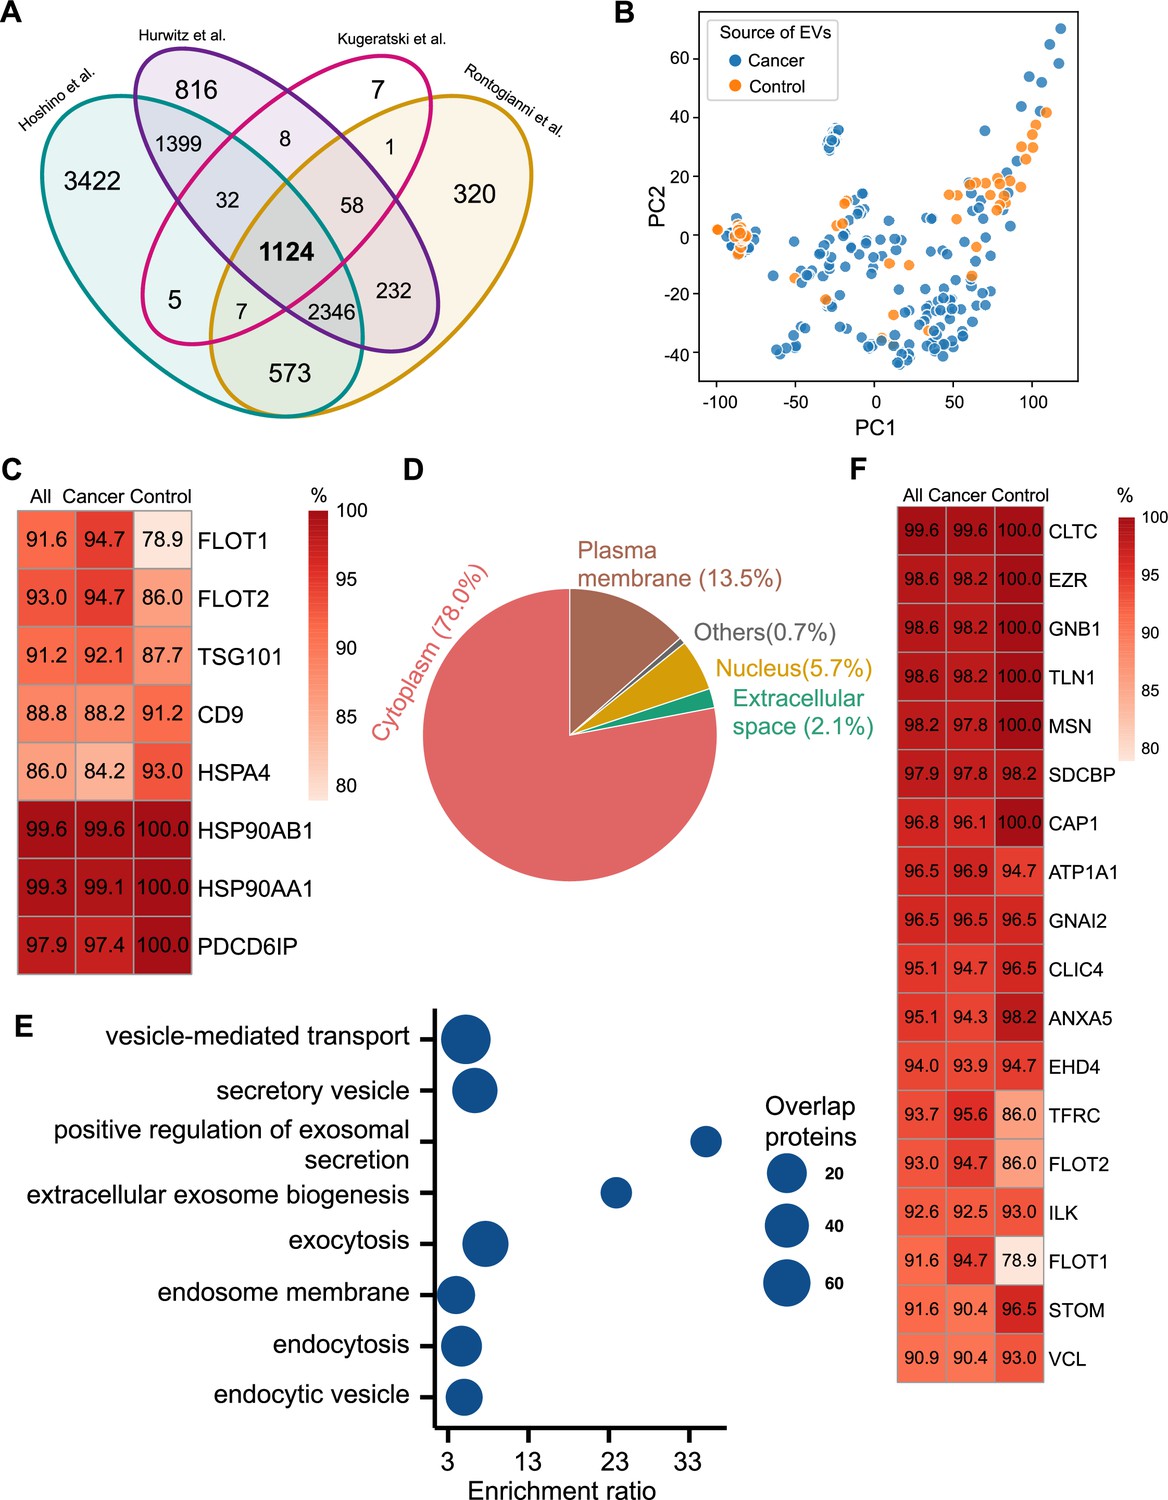
Proteomic characterization of exosomes derived from 285 cell lines from four studies.
(A) Overlapped proteins from four different studies of cell-line-derived exosomes. (B) PCA plot of cancer and control cell line-derived exosomes. (C) Positivity for eight commonly used exosomal protein biomarkers in various cell lines. The percentage of samples expressing each protein is shown in the boxes. Darker red indicates a higher percentage. (D) Annotation of the proteins detected in more than 90% of all samples. (E) GO and KEGG pathway enrichment analysis of the proteins detected in more than 90% of all samples. (F) Plasma membrane proteins detected in more than 90% of all samples.
-
Figure 2—source data 1
Related to Figure 2A.
- https://cdn.elifesciences.org/articles/90390/elife-90390-fig2-data1-v1.csv
-
Figure 2—source data 2
Related to Figure 2B.
- https://cdn.elifesciences.org/articles/90390/elife-90390-fig2-data2-v1.csv
-
Figure 2—source data 3
Related to Figure 2C and F.
- https://cdn.elifesciences.org/articles/90390/elife-90390-fig2-data3-v1.csv
-
Figure 2—source data 4
Related to Figure 2D.
- https://cdn.elifesciences.org/articles/90390/elife-90390-fig2-data4-v1.csv
-
Figure 2—source data 5
Related to Figure 2E.
- https://cdn.elifesciences.org/articles/90390/elife-90390-fig2-data5-v1.csv
Figure 3
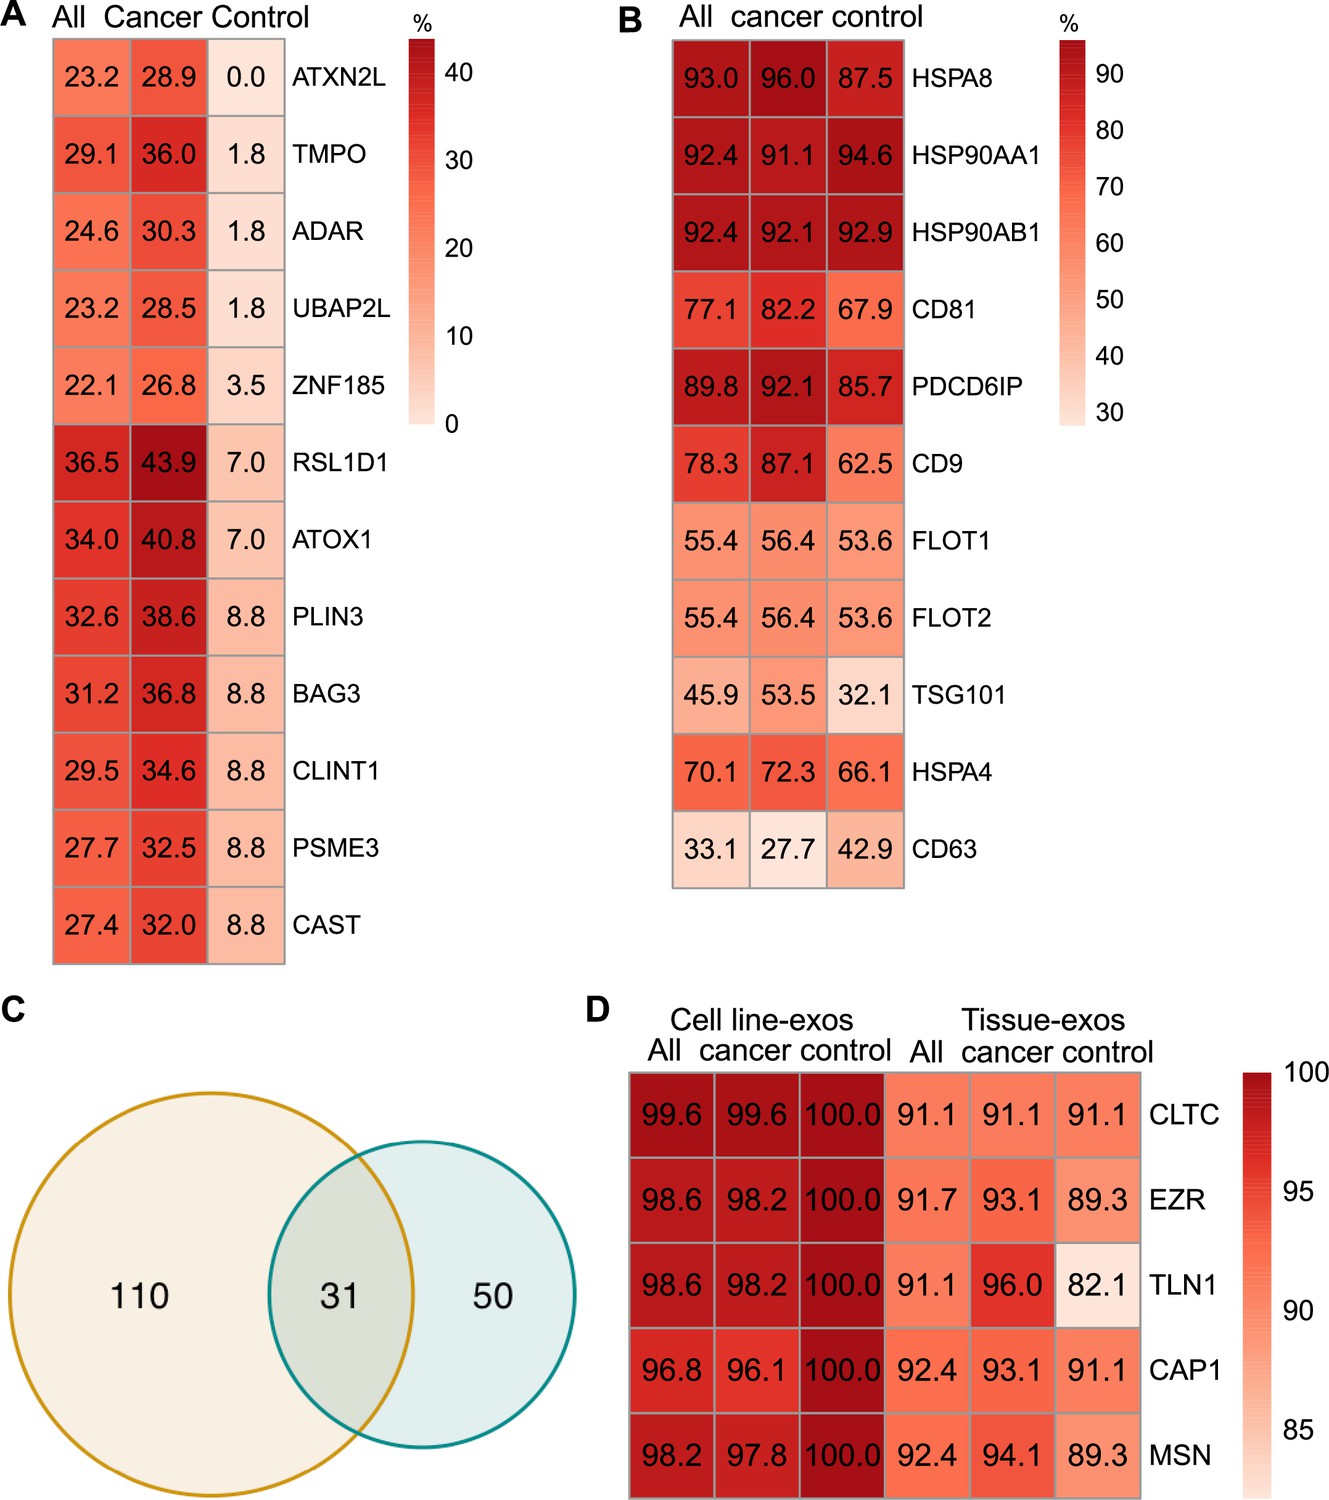
Proteomic characterization of exosomes derived from cell lines and tissues.
(A) Proteins detected at higher frequency in cancer cell line-derived exosomes. (B) Positivity for 11 commonly used exosomal protein biomarkers in various tissues. (C) Overlapping proteins (>90% frequency) between cell line- and tissue-derived exosomes. (D) Positivity of five plasma membrane proteins detected in more than 90% of both cell line- and tissue-derived exosomes.
-
Figure 3—source data 1
Related to Figure 3A, B and D.
- https://cdn.elifesciences.org/articles/90390/elife-90390-fig3-data1-v1.csv
-
Figure 3—source data 2
Related to Figure 3C.
- https://cdn.elifesciences.org/articles/90390/elife-90390-fig3-data2-v1.csv
Figure 4 with 1 supplement
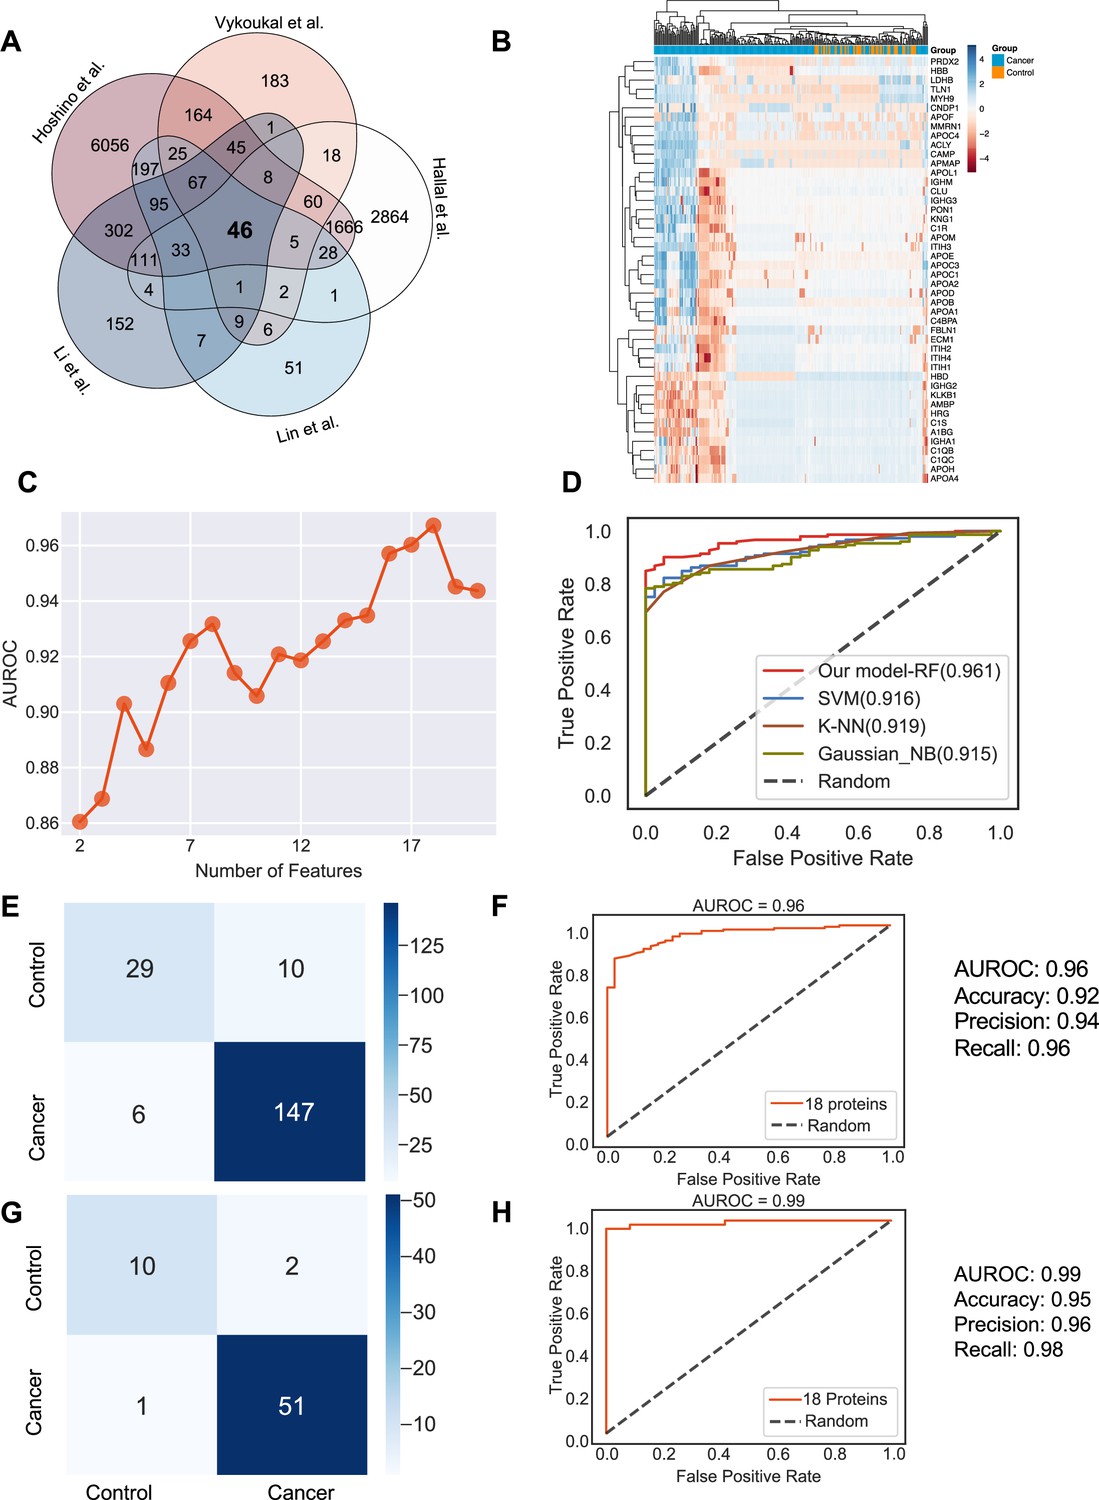
Identification of the signature proteins of plasma or serum-derived exosomes and the evaluation of random forest classifier.
(A) Overlapping exosome proteins detected in the plasma and serum of 205 cancer and 51 control samples from five studies. (B) Heat map of 46 overlapping exosome proteins in cancer and control plasma or serum samples. (C) AUROC score of the random forest classifier on including various numbers of protein features. (D) AUROC of different models in comparison. (E) Classification error matrix of the 75% training set using a random forest classifier for the 18 selected proteins. The number of samples is indicated in each box. (F) AUROC score of the random forest classifier trained using 75% of the dataset. Other metrics are indicated on right. (G) Classification error matrix of 25% testing set using a random forest classifier for the 18 selected proteins. The number of samples is indicated in each box. (H) AUROC score of the random forest classifier tested using 25% of the dataset. Other metrics are indicated on right.
-
Figure 4—source data 1
Related to Figure 4.
- https://cdn.elifesciences.org/articles/90390/elife-90390-fig4-data1-v1.csv
Figure 4—figure supplement 1
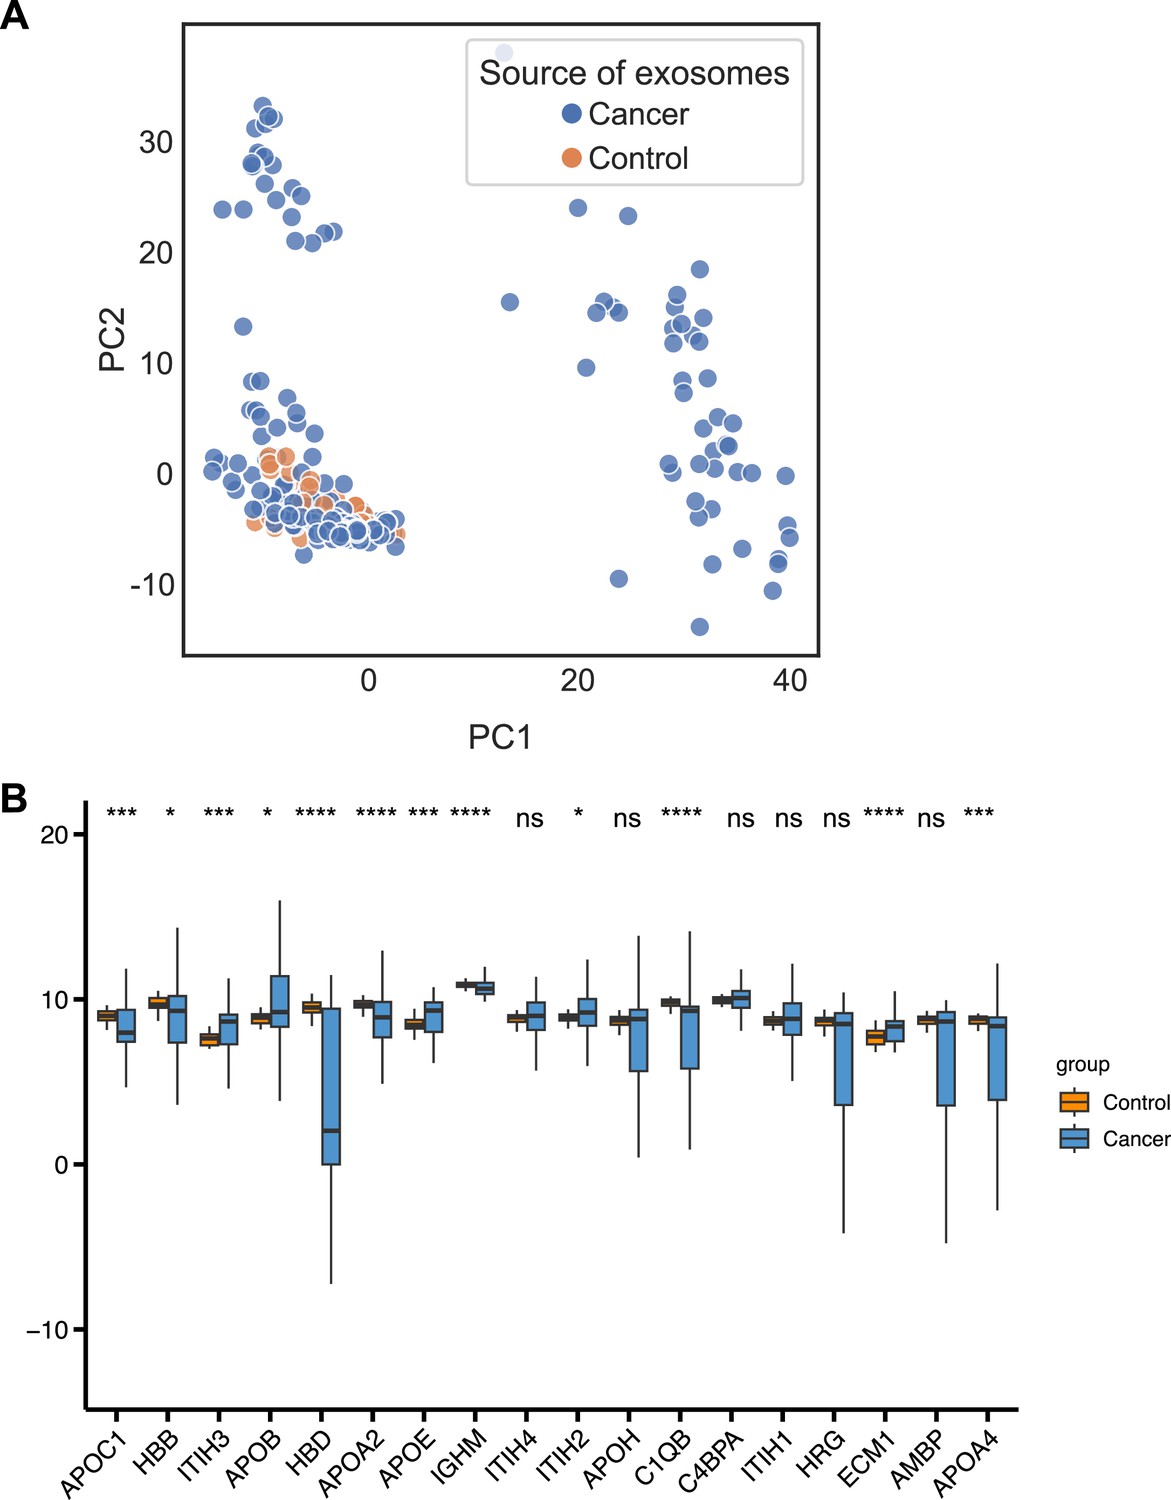
Machine learning models for plasma-derived exosomes.
(A) PCA plot of cancer and control plasma or serum-derived exosomes. (B) Protein abundance of 18 selected protein features in 205 cancer- and 51 control plasma or serum-derived exosomes. Significance was determined by the Wilcoxon rank-sum test. *p < 0.05, ***p < 0.001, ****p < 0.0001, ns: not significant.
Figure 5
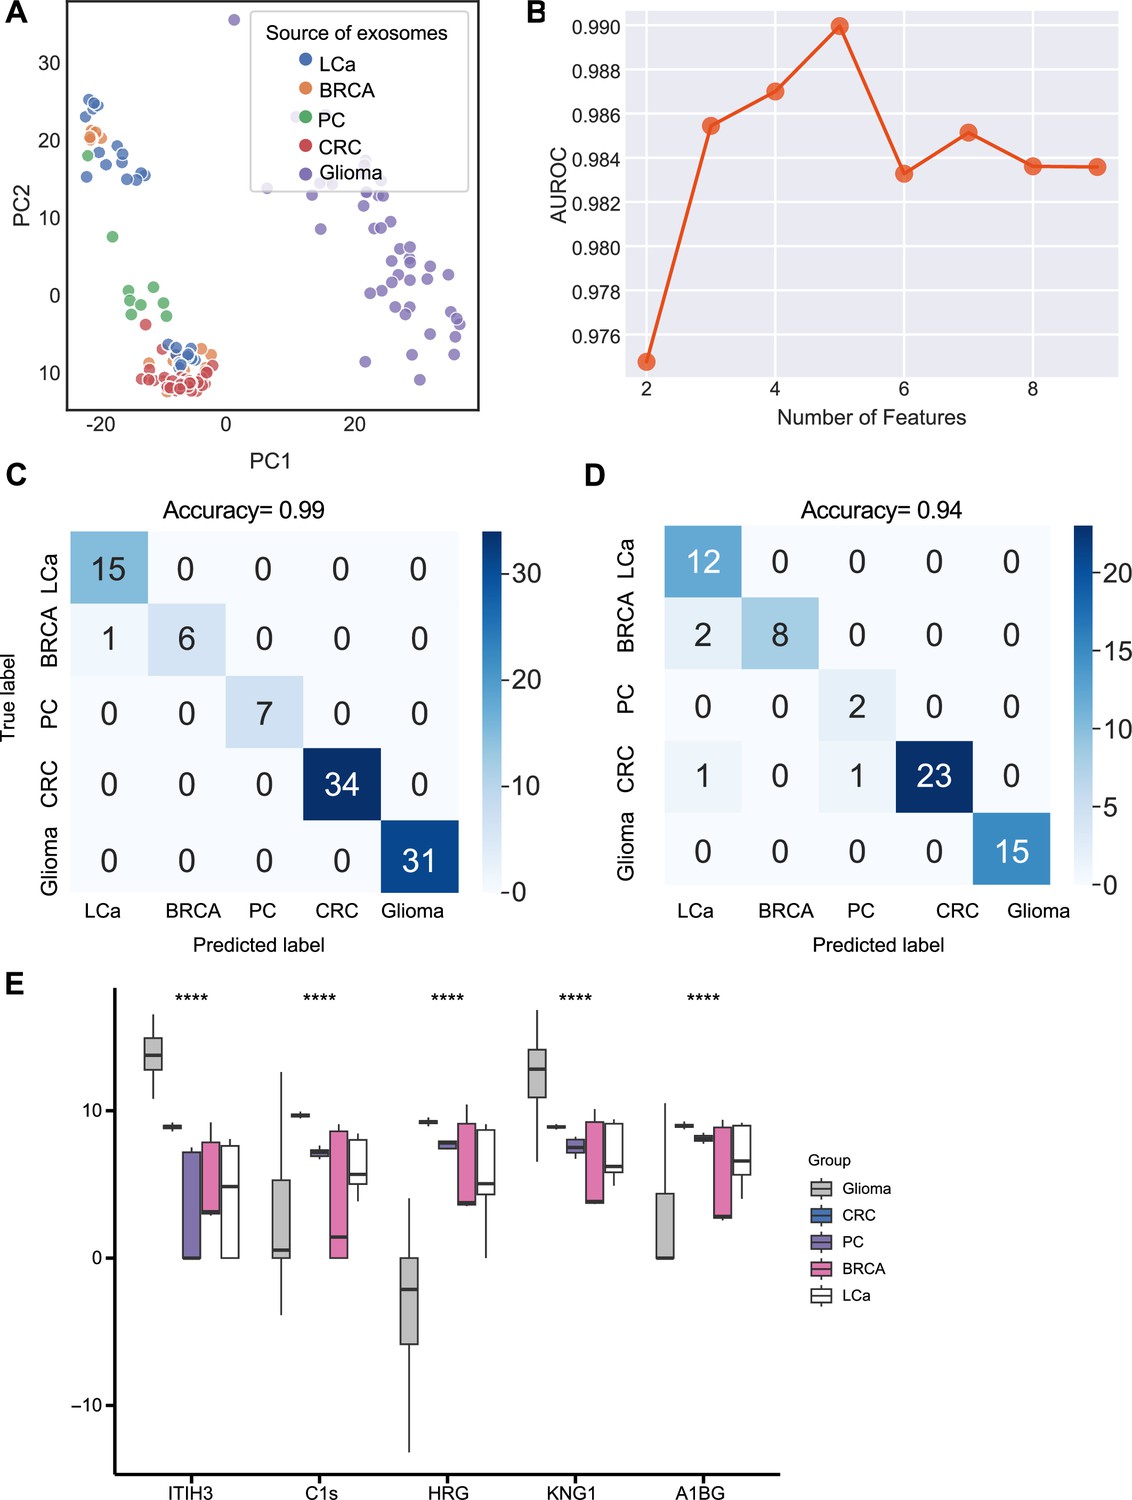
Identification of signature proteins expressed by plasma or serum-derived exosomes for classifying five common cancer types and evaluation of random forest classifier.
(A) PCA plot of plasma or serum-derived exosomes from five cancer types. (B) AUROC score of the random forest classifier by including various number of protein features. (C–D) Classification error matrix of a 60% training set and 40% testing set to classify the five cancer types using a random forest classifier for the five selected proteins. The number of samples is indicated in each box. (E) Protein abundance of five selected protein features in 158 samples across five cancer types. Significance was determined by the Kruskal-Wallis test. ****p < 0.0001.
-
Figure 5—source data 1
Related to Figure 5.
- https://cdn.elifesciences.org/articles/90390/elife-90390-fig5-data1-v1.csv
Figure 6
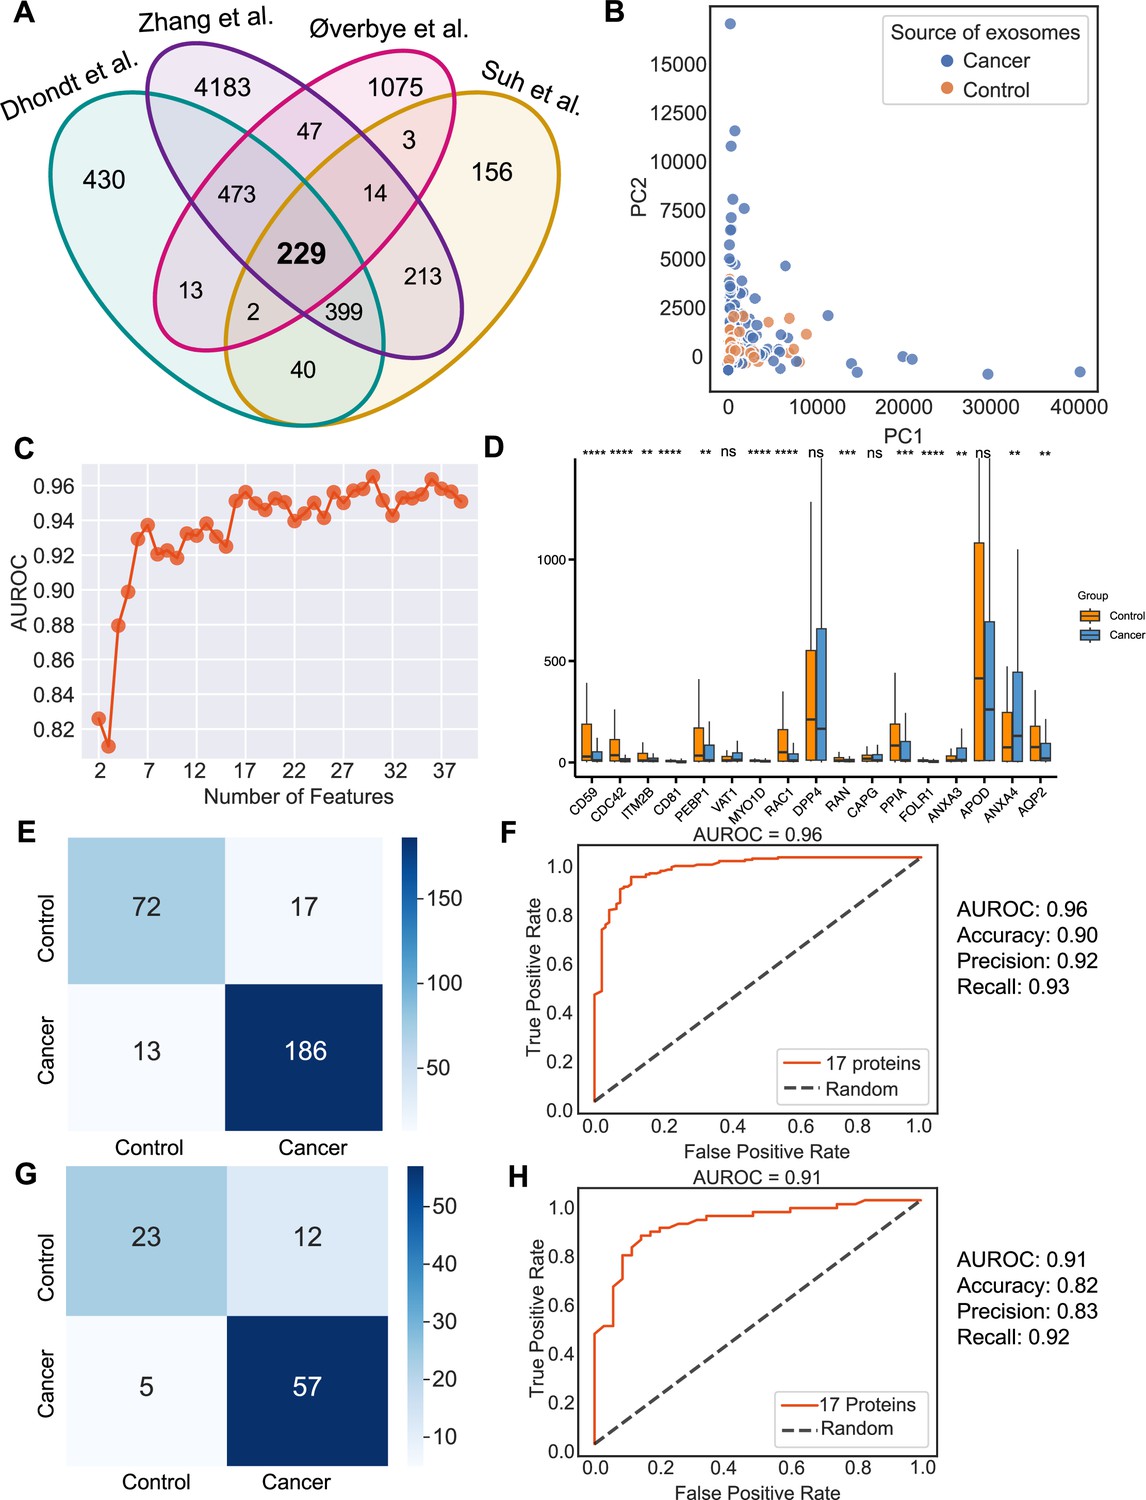
Identification of signature proteins expressed by urine-derived exosomes and evaluation of random forest classifier.
(A) Overlapping exosome proteins detected in the urine from 261 cancer and 124 control samples from four studies. (B) PCA plot of cancer and control urine-derived exosomes. (C) AUROC score of the random forest classifier by including a various number of protein features. (D) Protein abundance of 17 selected protein features in 261 cancer- and 124 control urine-derived exosomes. (E) Classification error matrix of 75% training set using a random forest classifier for the 17 selected proteins. The number of samples is indicated in each box. (F) AUROC score of the random forest classifier trained using 75% of the dataset. Other metrics are indicated on right. (G) Classification error matrix of 25% testing set using a random forest classifier for the 17 selected proteins. The number of samples is indicated in each box. (H) AUROC score of the random forest classifier tested using 25% of the dataset. Other metrics are indicated on the right. Significance was determined by the Wilcoxon rank-sum test. **p < 0.01, ***p < 0.001, ****p < 0.0001, ns: not significant.
-
Figure 6—source data 1
Related to Figure 6.
- https://cdn.elifesciences.org/articles/90390/elife-90390-fig6-data1-v1.csv
Additional files
-
Supplementary file 1
Detailed information on the public data included in this study.
- https://cdn.elifesciences.org/articles/90390/elife-90390-supp1-v1.xlsx
-
Supplementary file 2
Proteins detected in more than in 90% of all cell line-derived exosomes.
- https://cdn.elifesciences.org/articles/90390/elife-90390-supp2-v1.csv
-
MDAR checklist
- https://cdn.elifesciences.org/articles/90390/elife-90390-mdarchecklist1-v1.pdf
-
Source code 1
The code of the random forest model developed in the study.
- https://cdn.elifesciences.org/articles/90390/elife-90390-code1-v1.zip
Download links
A two-part list of links to download the article, or parts of the article, in various formats.
Downloads (link to download the article as PDF)
Open citations (links to open the citations from this article in various online reference manager services)
Cite this article (links to download the citations from this article in formats compatible with various reference manager tools)
A novel machine learning algorithm selects proteome signature to specifically identify cancer exosomes
eLife 12:RP90390.
https://doi.org/10.7554/eLife.90390.3


