Structural basis for kinase inhibition in the tripartite E. coli HipBST toxin–antitoxin system
- Department of Molecular Biology and Genetics, Aarhus University, Denmark
- Department of Biology, University of Copenhagen, Denmark
- Department of Chemistry and Interdisciplinary Nanoscience Centre (iNANO), Denmark
- Voldmestergade, Denmark
Figures
Figure 1 with 3 supplements
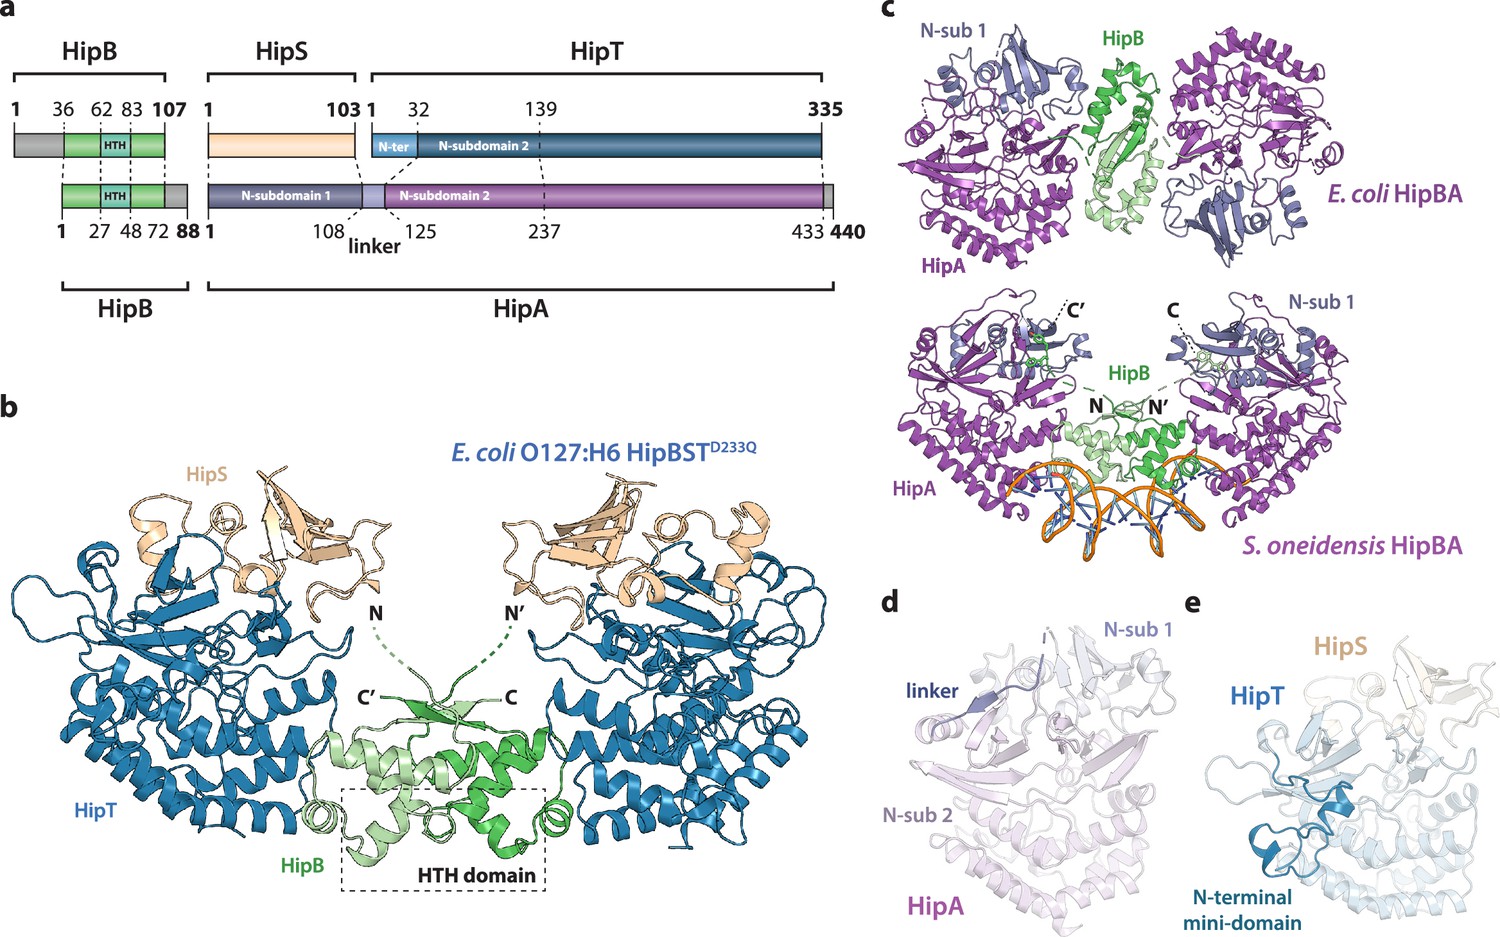
Crystal structure of the E. coli O127:H6 HipBST complex.
(a) Schematic representation of HipBST and HipBAEc showing corresponding proteins and domains (dashed lines) while grey areas represent regions missing in the crystal structures: E. coli O127:H6 HipBST, this work; E. coli HipBA, PDB: 2WIU (Evdokimov et al., 2009). HipS (beige) is structurally similar to the N-subdomain 1 of HipA (dark purple), HipT has an additional N-terminal mini-domain not found in HipA (light blue), and HipA has a short linker between the two N-subdomains (light purple). (b) Crystal structure of E. coli O127:H6 HipBSTD233Q reveals a hetero-hexameric complex with HipS (beige) tightly associated with HipT (blue) and connected to a similar heterodimer through dimerization of HipB (green), which also generates a DNA-binding helix-turn-helix motif (HTH, dashed box). (c) Top, crystal structure of the E. coli K-12 HipBA complex (PDB: 2WIU) shown as cartoon with HipA in purple and blue (N-terminal subdomain 1) and the HipB homodimer in two shades of green (Evdokimov et al., 2009); bottom, the structure of S. oneidensis HipBA (PDB: 4PU3, HipA purple/blue, HipB green) bound to DNA (orange backbone, blue bases) (Wen et al., 2014). (d) The linker (dark purple) between N-subdomains 1 (N-sub 1) and 2 (N-sub 2) physically linking the two domains in HipAEc. (e) The N-terminal mini-domain of HipT (blue), which is absent from HipA.
Figure 1—figure supplement 1

Sequence alignment with consensus elements of HipBST, HipBAEc and HipBASo.
(a).Alignment of E. coli O127:H6 HipB with HipB from E. coli K-12 HipBA and HipB from S. oneidensis HipBA. The secondary structure motifs observed in E. coli O127:H6 HipB is shown above the sequences, except for α1*, which is missing from the crystal structures but predicted by both JPred4 (Drozdetskiy et al., 2015) and AlphaFold2 (Jumper et al., 2021). (b) Alignment of E. coli O127:H6 HipS with the N-subdomain 1 from both E. coli K-12 HipA and S. oneidensis HipA. The position of the Gly-rich loop interacting helix (α3, ‘interacting helix’) and Glu63 and Trp65 of HipS are indicated. The secondary structure observed in E. coli O127:H6 HipS is shown above the sequences. (c) Alignment of E. coli O127:H6 HipT with the main kinase domains of E. coli K-12 HipA and S. oneidensis HipA. The position of the Gly-rich loop (residues 58–63), phosphorylation sites (Ser57 and Ser59), RxDR motif, catalytic motif (Asp210), and Mg2+-binding motif (Asp233), are indicated. The secondary structure observed in E. coli O127:H6 HipT is shown above the sequences.
Figure 1—figure supplement 2

Transcriptional regulation of the HipBST promoter of E. coli O127:H6.
All strains shown in this assay carried the reporter plasmid (pSVN141, pGH254::PhipBST-hipB'-lacZ, top drawing) with the hipBST promoter region and a 5′ fragment of the hipB gene (including 224 bp upstream of hipB plus the first 73 bp of the hipB orf) transcriptionally fused (indicated with a lightening symbol) to lacZ. The assay was made in strain E. coli TB28 harbouring the reporter plasmid and either empty pBAD33 vector or arabinose inducible combinations of hipB, hipS, and hipT in the context of the HipTD210Q inactive mutant. The strains were grown in liquid YT, diluted, and spotted onto YT agar plates containing 40 μg/ml X-gal (indicator turning blue upon lacZ expression) and 0.2% glucose (to repress hipB/S/TD233Q) or 0.2% arabinose (to induce hipB/S/TD233Q). Results are representative of two independent experiment and plasmid used were pSVN181 (pBAD33::hipB-S-TD233Q), pSVN182 (pBAD33::hipB-S), pSVN185 (pBAD33::hipB-TD233Q), pSVN188 (pBAD33::hipS-TD233Q), pSVN189 (pBAD33::hipB), pSVN190 (pBAD33::hipS), or pSVN193 (pBAD33::hipTD233Q).
-
Figure 1—figure supplement 2—source data 1
Original glucose and arabinose plates.
- https://cdn.elifesciences.org/articles/90400/elife-90400-fig1-figsupp2-data1-v1.zip
Figure 1—figure supplement 3

Structural homologue analysis of HipBST to HipBA.
(a) Structural alignment of S. oneidensis HipBA in complex with DNA (PDB: 4PU3) with E. coli O127:H6 HipBST (this study) (Wen et al., 2014). The close-up views highlight several positively charged residues in the area responsible for phosphate backbone interactions in S. oneidensis HipBA (left) and their counterparts in E. coli HipBST (right). (b) Structural alignment of the E. coli O127:H6 HipST heterodimer with E. coli K-12 HipA (top) and S. oneidensis HipA (bottom). Protein domains and chains are indicated with labels in corresponding colours. (c) APBS electrostatics of HipBST (left) and HipBASo in complex with DNA. The positive groove on the HipB-dimer is consistent between the two homologues. (d) Close-up of the active site of E. coli K-12 HipA in the ATP-bound state (left), the same site in the Ser150 phosphorylated state (middle) and the corresponding region in HipT D233Q (right).
Figure 2 with 1 supplement
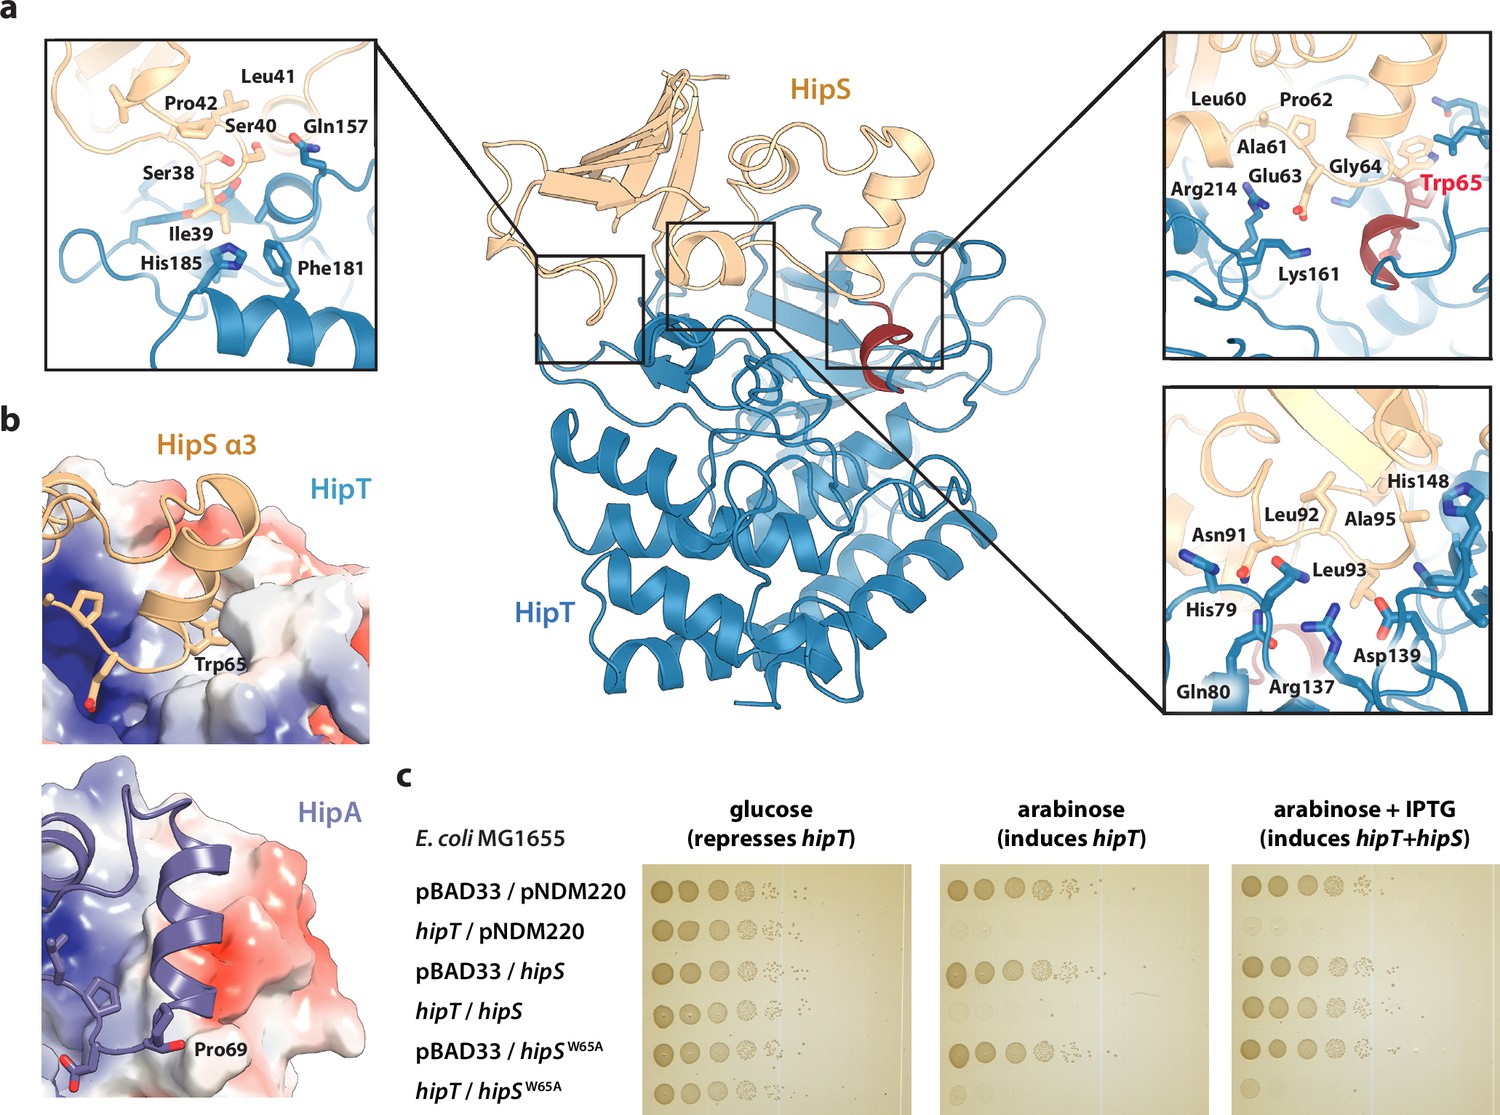
Trp65 is essential for the function of HipS as antitoxin.
(a) Overview and detailed interactions between HipS (beige) and HipT (blue) at the three main areas of interaction with relevant residues indicated. The Gly-rich loop, including Trp65, is shown in red. (b) Top, HipS Trp65 (beige) is located in a hydrophobic pocket on the surface of HipT (coloured by surface electrostatics with APBS); bottom, this region is structurally different in E. coli HipA (purple and surface electrostatics shown, PDB: 3TPD) (Schumacher et al., 2012). (c) E. coli MG1655 harbouring empty pBAD33 vector (pBAD33) or pSVN1 (pBAD33::hipT) in combination with empty pNDM220 vector (pNDM220), pSVN109 (pNDM220::hipS), or pSVN178 (pNDM220::hipSW65A), as indicated. Plates contained 0.2% glucose (to repress hipT), 0.2% arabinose (to induce hipT), or 0.2% arabinose plus 200 µM isopropyl-D-1 thio-galactopyranoside (IPTG) (to induce hipS, or hipSW65A). The experiments shown are representative of at least three independent repetitions.
-
Figure 2—source data 1
Original plates.
- https://cdn.elifesciences.org/articles/90400/elife-90400-fig2-data1-v1.zip
Figure 2—figure supplement 1

Sequence and function of E. coli HipS.
(a) Sequence alignment of E. coli O127:H6 HipS and selected orthologues with the N-subdomain 1 of E. coli K-12 HipA (bottom). The secondary structure observed for E. coli O127:H6 HipS is shown above the alignment. Fully conserved residues are in white text on a dark orange background, partially conserved residues in orange text, regions that interact with HipT are shown on a light grey background, and Trp65 that intercalates in HipT is shown on a blue background. (b) Growth curves (OD600) of E. coli MG1655 grown in YT medium and harbouring empty pBAD33 vector (pBAD33) or pSVN1 (pBAD33::hipT, ‘hipT’), in combination with empty pNDM220 vector (pNDM220), pSVN109 (pNDM220::hipS, ‘hipS’), or pSVN178 (pNDM220::hipSW65A, hipSW65A) as indicated. At the indicated times, 0.2% arabinose was added to induce hipT (ara) and 200 µM isopropyl-D-1 thio-galactopyranoside (IPTG) to induce hipS or hipSW65A (IPTG). The data points represent mean values of results from at least three independent experiments, and error bars show standard deviations (hidden when small).
Figure 3 with 1 supplement
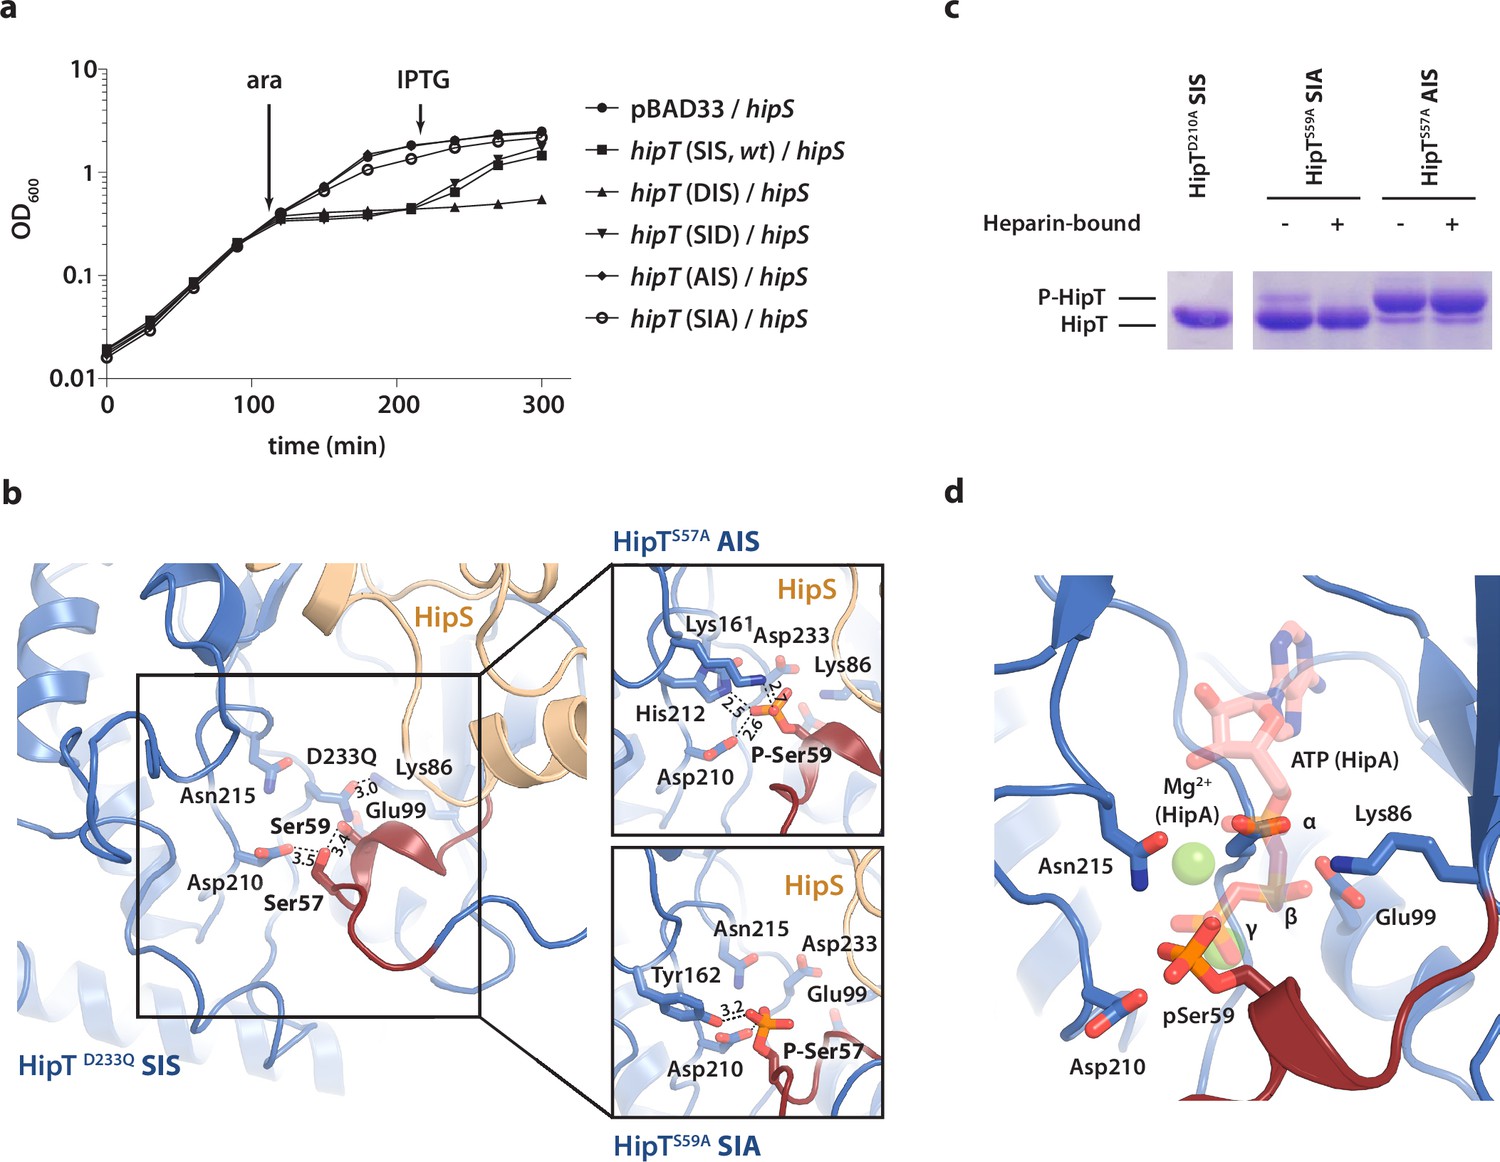
The phosphoserine positions in HipT have distinct functional roles.
(a) Growth curves of E. coli MG1655 harbouring arabinose-inducible, single auto-phosphorylation variants of HipT; pBAD33::hipT (SIS, wt), pBAD33::hipTS57D (DIS), pBAD33::hipTS59D (SID), pBAD33::hipTS57A (AIS), pBAD33::hipTS59A (SIA), or the empty pBAD33 vector, co-transformed with an isopropyl-D-1 thio-galactopyranoside (IPTG)-inducible construct of HipS; pNDM220::hipS, with expression induced at the indicated time points (ara/IPTG). The curves show mean OD600 values from at least two independent experiments with error bars indicating standard deviations (hidden when small). (b) Overview of the HipT kinase active site in the D233Q mutant as well as for HipTS57A (AIS, top) and HipTS59A (SIA, bottom). The phosphate groups on Ser57 (in HipTS59A) and Ser59 (in HipTS57A) are shown in orange and interacting nearby residues are highlighted. Numbers indicate distances in Å. (c) HipT variants from purified HipBST complex before (−) and after (+) a Heparin-column purification step aiming to separate complexes based on the phosphorylation state, visualized on a Phos-tag gel, which separates proteins based on phosphorylation state, and stained by Coomassie Blue. The locations of phosphorylated (P-HipT) and unphosphorylated (HipT) protein species are indicated. The gels are representative of two independent experiments. (d) Close-up of the HipT S57A active site overlaid with ATP (salmon, semi-transparent) and two Mg2+ ions (green, semi-transparent) from the structure of HipA:ATP (PDB: 3DNT) (Schumacher et al., 2009). Relevant active site residues are shown as sticks and the Gly-rich loop is shown in dark red with pSer59 indicated.
-
Figure 3—source data 1
SDS-PAGE.
- https://cdn.elifesciences.org/articles/90400/elife-90400-fig3-data1-v1.zip
Figure 3—figure supplement 1
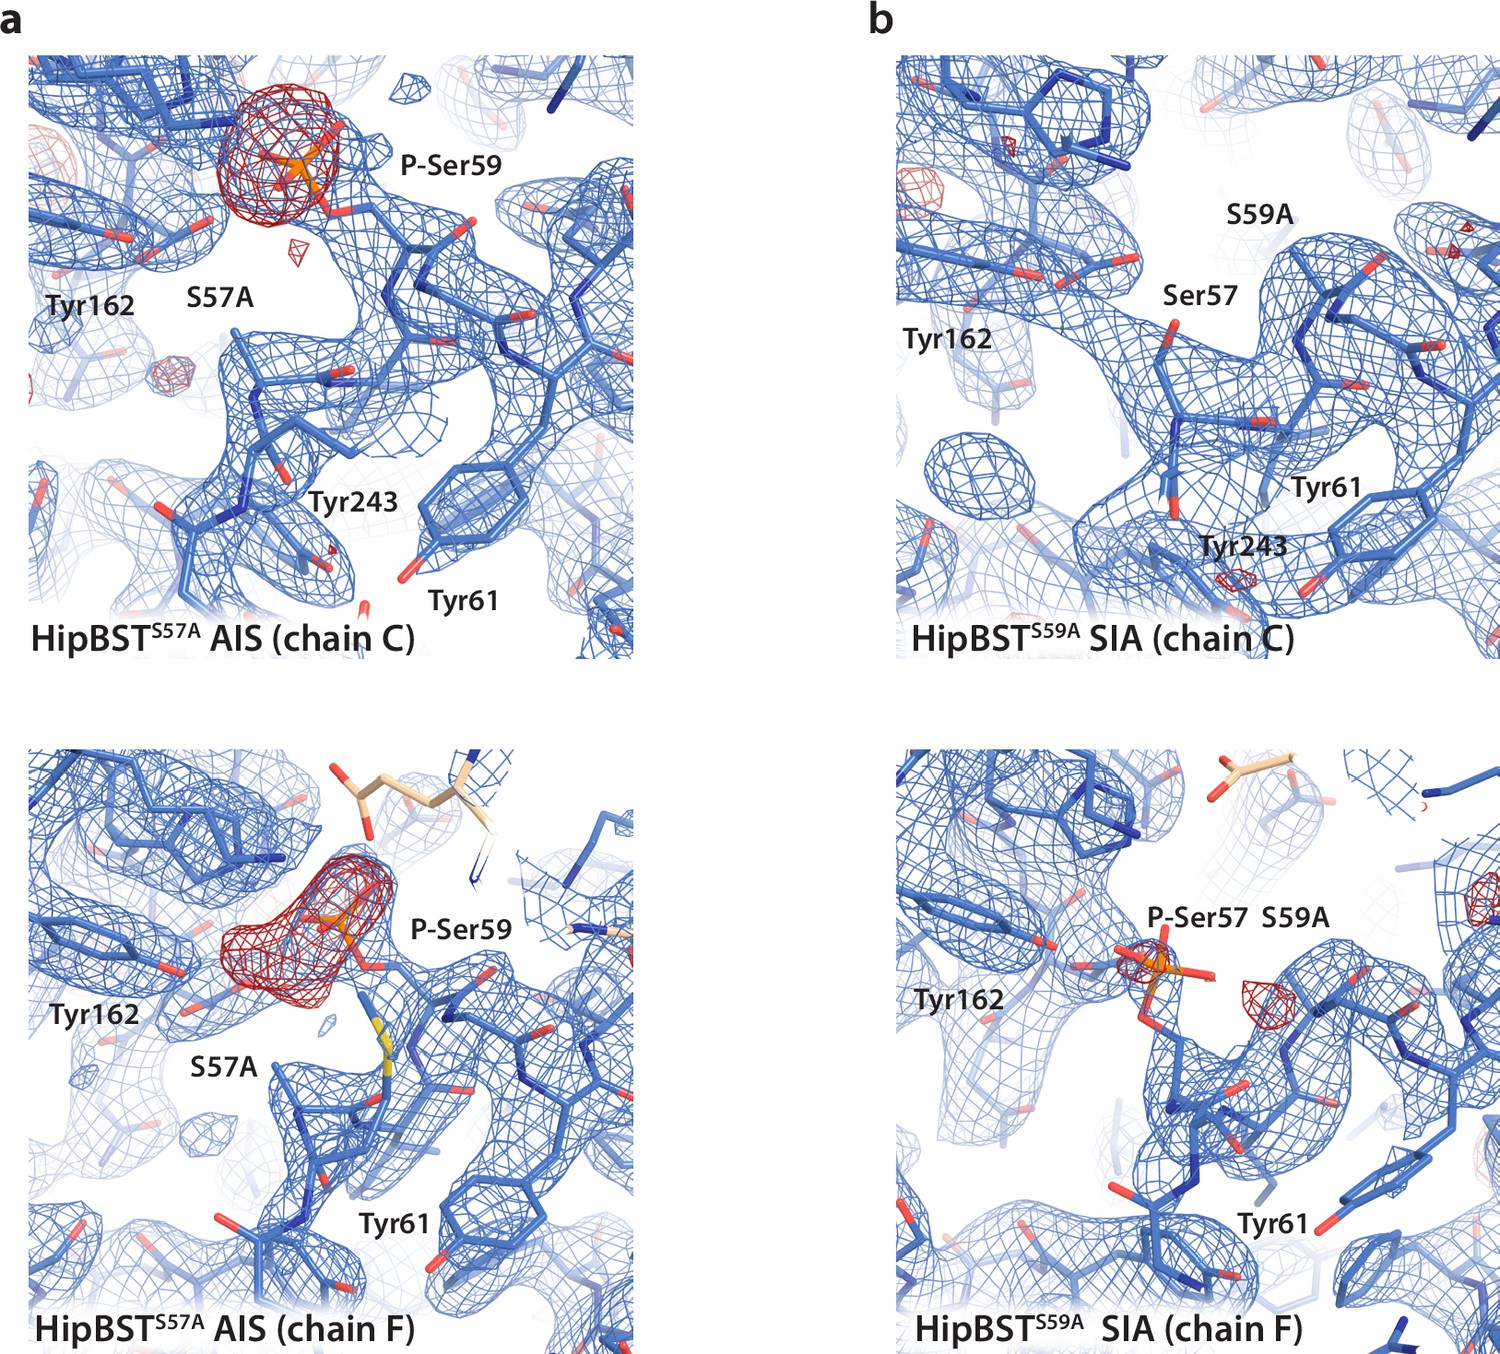
Electron density surrounding the phosphoserine sites of HipT before and after modelling.
(a) Electron density maps for the HipBSTS57A structure showing the active sites of HipT in both copies in the asymmetric unit (ASU) (chain C, top and chain F, bottom). In both cases, the 2Fo–Fc map (blue) contoured at 1.2 σ calculated after modelling of the phosphoserine residues is shown overlaid with the Fo–Fc difference map (red) calculated before modelling and contoured at 2.6 σ. (b) Same views and maps (including contour levels) for the HipBSTS59A structure.
Figure 4 with 1 supplement
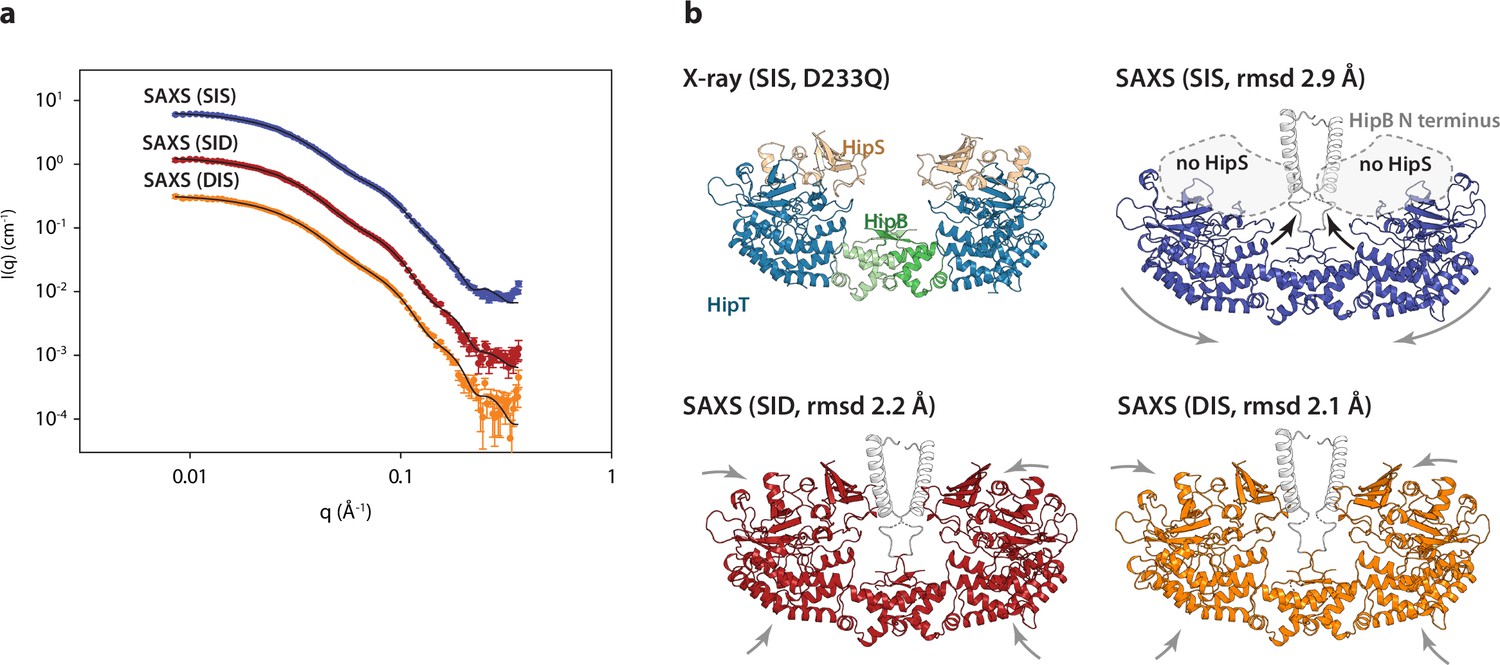
The HipBST complex is dynamic in solution.
(a) Experimental small-angle X-ray scattering (SAXS) curves (measured X-ray intensity as a function of q, the modulus of the scattering vector) measured for HipBST in the context of HipT D210Q and the variants SIS (blue), SID (red), and DIS (orange). The black curves are the fits of the models based on the crystal structure after rigid-body refinement and inclusion of a structure factor to account for oligomerization of the complexes. (b) Structure models of HipBST (for SID, red, and DIS, orange) or HipBT (SIS, blue) as fit to the SAXS scattering data. For each model (SIS, SID, and DIS), the root mean square deviation (rmsd) to the crystal structure is indicated while arrows indicate gross domain movements. Top left, the crystal structure of the HipBST D233Q for reference.
Figure 4—figure supplement 1

Small-angle X-ray scattering (SAXS) analysis of HipBST variants.
(a) Sodium dodecyl sulfate–polyacrylamide gel electrophoresis (SDS–PAGE) gels with purified samples of HipBST (D210A, SIS), HipBST (D210A, DIS), and HipBST (D210A, SID) showing that the HipS band is missing in the SIS purification (left). (b) Guinier plots giving radii of gyration of 54.9 ± 0.3 Å (DIS), 55.1 ± 0.3 Å (SID), and 54.0 ± 0.2 Å (SIS). (c) Indirect Fourier transformations giving radii of gyration of 57.7 ± 0.4 Å (DIS), 57.9 ± 0.3 Å (SID), and 57.5 ± 0.3 Å (SIS). (d) Pair distance distribution function. (e) Normalized Kratky plot using the values of and from the Guinier fit for normalization.
-
Figure 4—figure supplement 1—source data 1
SDS-PAGE.
- https://cdn.elifesciences.org/articles/90400/elife-90400-fig4-figsupp1-data1-v1.zip
Figure 5
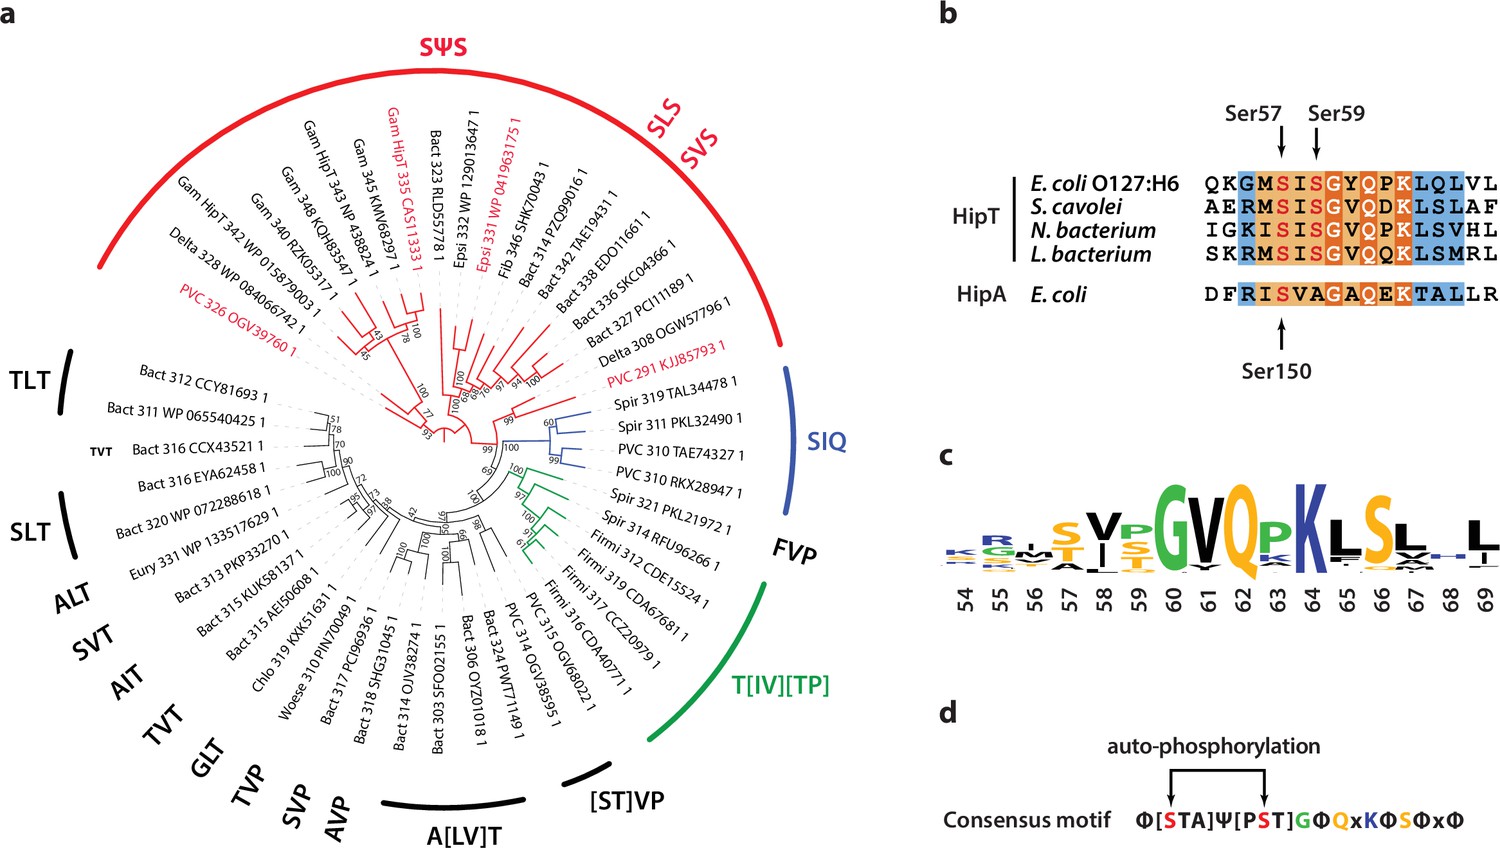
Phylogenetic analysis of HipT.
(a) Phylogenetic guide tree of 48 HipT orthologues with sequences motifs (potential phosphorylation sites) indicated on the side. The SΨS group (red) is by far the largest group followed by the T[IV][TP] group (green), and SIQ group (blue). Sequences used in the alignment in (b) are shown with red letters and the numbers on the tree branches indicate bootstrap confidence levels. (b) Sequences of the Gly-rich loop (orange background), including the potential phosphorylation sites for selected HipT orthologues compared to HipA from E. coli K-12. Known phosphorylation sites in E. coli O127:H6 HipT (top) and E. coli K-12 HipA (bottom) are indicated with arrows and conserved sequence motifs with bold white text. (c) Sequence logo for the Gly-rich loop derived from all 48 HipT sequences. (d) Consensus motif for the HipT Gly-rich loop with known phosphorylation sites in red.Φ indicates a hydrophobic residue, while Ψ are aliphatic residues.
Figure 6 with 1 supplement
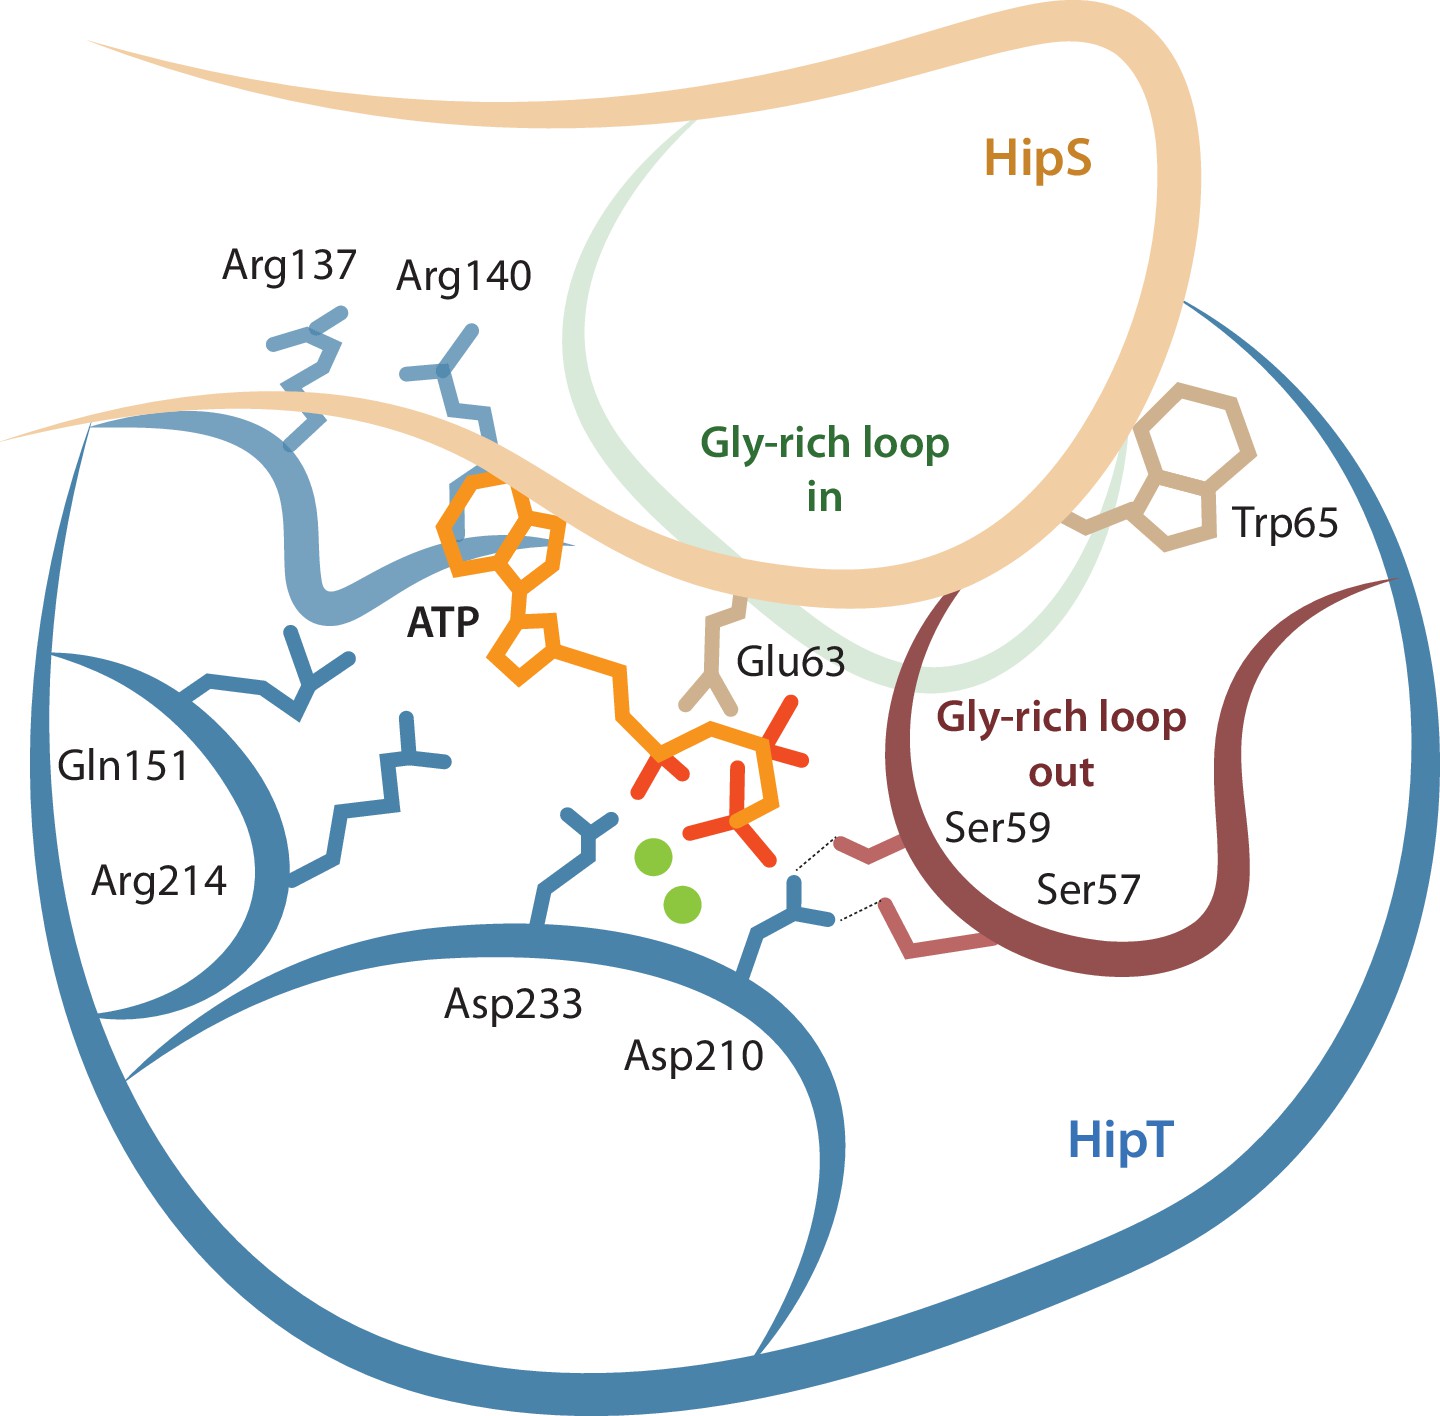
Model for the active site network of HipT of the HipBST system.
Schematical overview of HipT showing the interactions found in this study. HipT (blue) with the observed outward conformation of the Gly-rich loop (red), and the predicted inward conformation (green). Important residues highlighted are Ser57, Ser59, Asp210, and Asp233 of HipT, and Trp65 of HipS (beige). Shown is also the position of an ATP molecule (orange) together with two Mg-ions (green spheres) based loosely on PDB: 7WCF. The two sites homologous to the sites found in HipT from L. pneumophila to interact with the phosphoserine positions (R137/R140 and Q151/R214 in HipTEc) are also show since they potentially offer a stabilizing role.
Figure 6—figure supplement 1

Structural comparison between HipSTEc and HipSTLp.
(a) Structure of the HipST heterodimer from the HipBSTD233Q complex showing two distinct regions, the N-terminal minidomain (grey), which is ordered in this structure and the target-binding regions comprised of several loops (zoomed view) (Gerdes et al., 2021). (b) The crystal structure of HipSTLp (PDB: 7VKB) (Zhen et al., 2022) does not have a visible N-terminal domain when HipS is bound, and the loops forming the target-binding region are different (zoomed view). (c) The N-terminal domain of HipTLp (grey) is resolved when HipS is not present.
Additional files
-
Supplementary file 1
(a) Crystallographic data statistics. Crystallographic data collection (upper part) and refinement (lower part) statistics for the HipBSTD233Q, HipBSTS57A, and HipBSTS59A structures. *Numbers in parentheses refer to the outermost resolution shell. (b) Bacterial strains and plasmids. List of bacterial strains and plasmids either prepared as part of this work or with the given reference. SD, Shine-Dalgarno sequence. (c) Oligonucleotides and primers. List of oligonucleotides and primers used in this work, 5′–3′ sequences.
- https://cdn.elifesciences.org/articles/90400/elife-90400-supp1-v1.docx
-
MDAR checklist
- https://cdn.elifesciences.org/articles/90400/elife-90400-mdarchecklist1-v1.pdf
Download links
A two-part list of links to download the article, or parts of the article, in various formats.
Downloads (link to download the article as PDF)
Open citations (links to open the citations from this article in various online reference manager services)
Cite this article (links to download the citations from this article in formats compatible with various reference manager tools)
Structural basis for kinase inhibition in the tripartite E. coli HipBST toxin–antitoxin system
eLife 12:RP90400.
https://doi.org/10.7554/eLife.90400.3


