Baited reconstruction with 2D template matching for high-resolution structure determination in vitro and in vivo without template bias
- RNA Therapeutics Institute, University of Massachusetts Chan Medical School, United States
- Department of Molecular and Cell Biology, University of California Berkeley, United States
- Center for Computational Biology, University of California Berkeley, United States
- Howard Hughes Medical Institute, United States
Figures
Figure 1 with 1 supplement
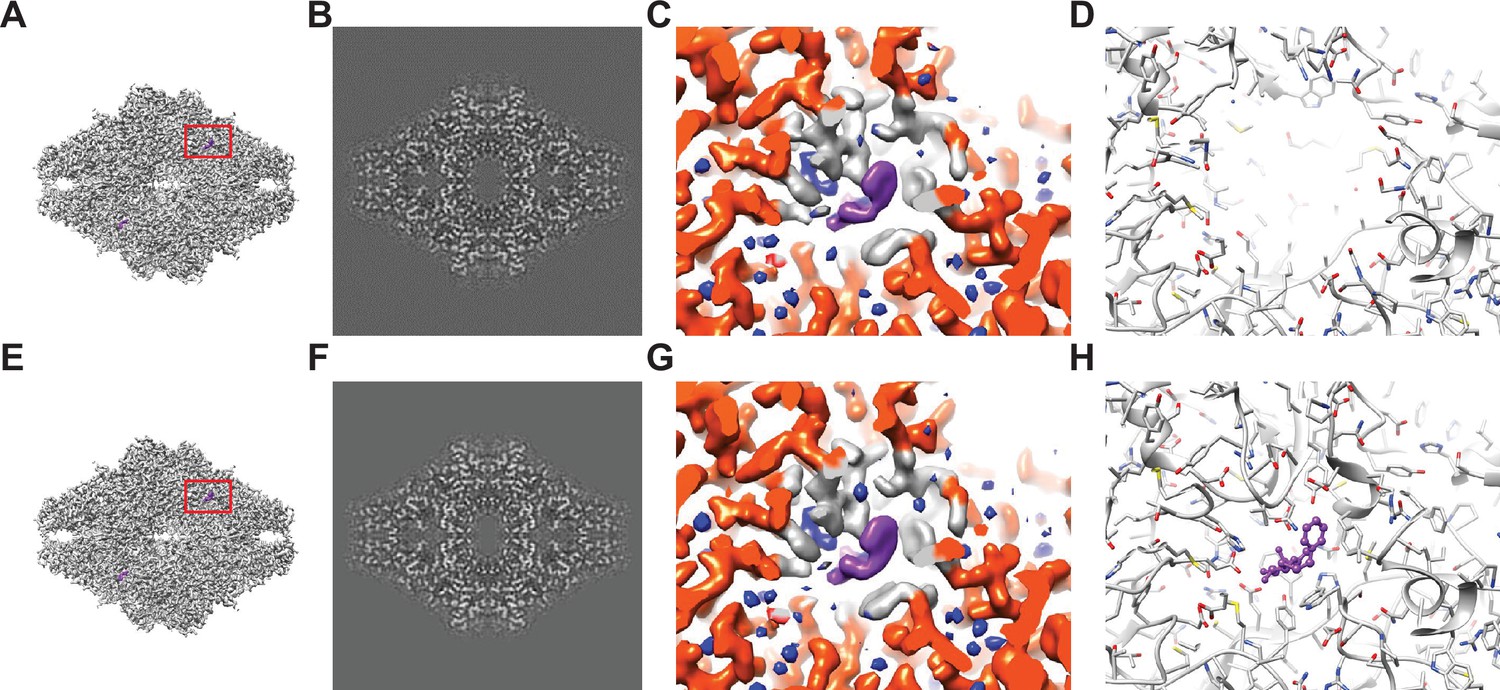
Baited reconstruction for visualization of β-galactosidase (Bgal) ligand binding pocket at high resolution.
(A) Reconstruction of Bgal from 2DTM coordinates using images from a previously published dataset (Saur et al., 2020) using a Bgal crystal structure (PDB: 1DP0) (Juers et al., 2000) as a template, with a 10 Å sphere around the phenylethyl β-D-thiogalactopyranoside (PETG) ligand omitted. (B) A 2D slice through the reconstruction in (A) including the region deleted from the density shows no obvious discontinuity in the density. (C) A view of the density in (A) indicated with a red box, with regions within 1.8 Å of the template model highlighted in red. Gray indicates density of Bgal outside of the template, purple indicates density consistent with the position of PETG, and blue indicates additional density that likely represent water molecules. (D) A stick diagram showing the locations of the atoms in the template used for template matching. (E) Published density from Saur et al., 2020 aligned and scaled as in (A). (F) As in (B), showing a region of the published density in (E). (G) As in (C), showing the same region of the published density in (E). (H) As in (D), showing all atoms annotated in the crystal structure, including those omitted before generating the 2DTM template.
Figure 1—figure supplement 1
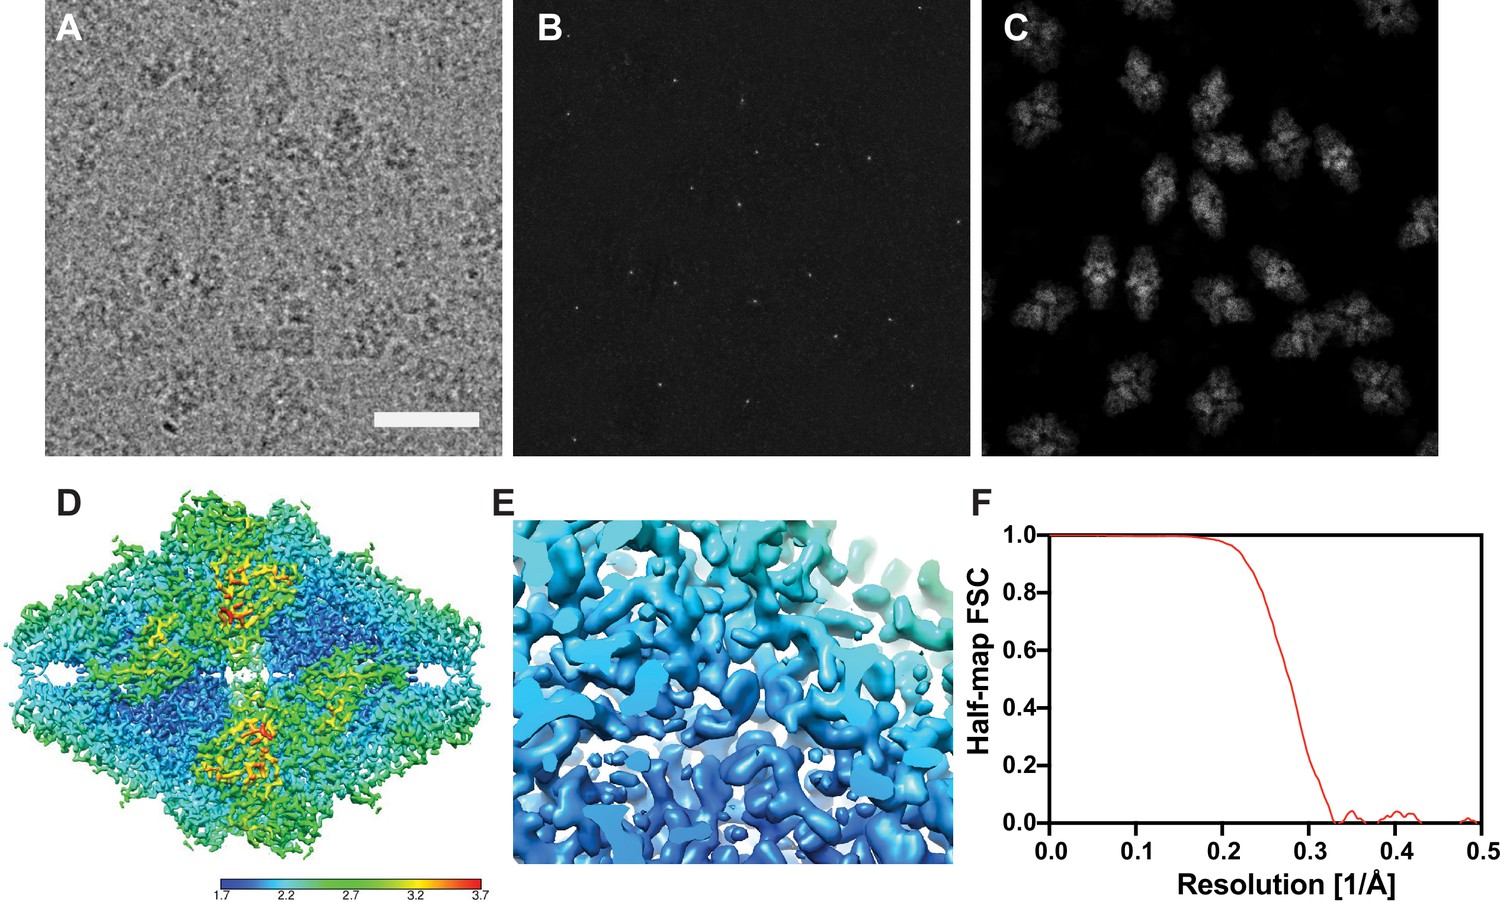
Results from a 2D template matching search of an image of Bgal with bound PETG using an apo structure of Bgal as a template.
(A) Example micrograph from Saur et al., 2020. Scale bar indicates 200 Å. (B) Maximum intensity projection showing the maximum 2DTM SNR at each pixel after a 2DTM search of the image in (A). (C) 2D projections indicating the best matching 2D templates of β-galactosidase (Bgal) in the image in (A). (D) Estimated local resolution of the reconstruction in Figure 1A, as indicated by the color key. (E) Region of the reconstruction in (D) shown in Figure 1B. (F) Fourier shell correlation (FSC) evaluated between the half-maps as a function of spatial frequency.
Figure 2 with 2 supplements
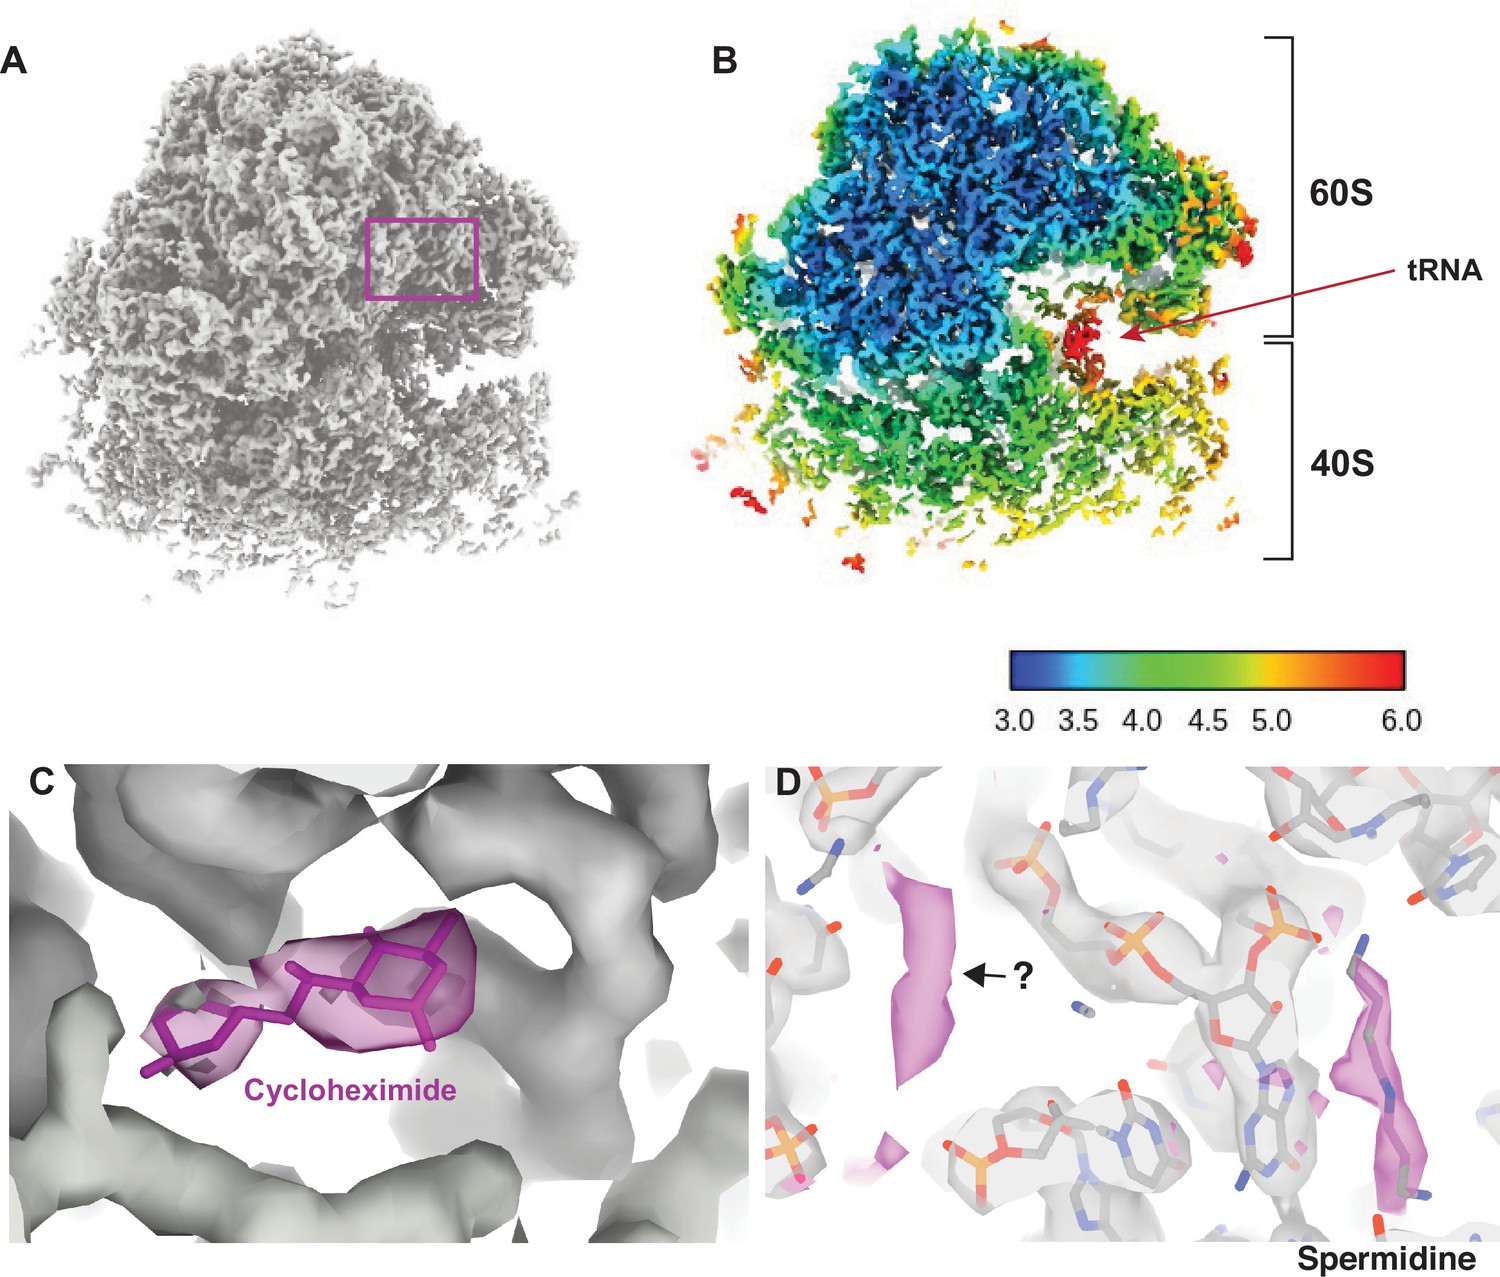
Visualizing drugs and small molecules bound to the ribosome in vivo.
(A) A reconstruction of the ribosome from 2DTM coordinates identified in the cytoplasm of FIB-milled S. cerevisiae cell sections showing clear density for both the 60S (part of the template) and the 40S (outside of the template). (B) A slice of the reconstruction in (A), indicating the local resolution using the indicated color coding. The arrow indicates the P-site tRNA. (C) Regions of the density >3 Å from the template model are indicated in pink. The crystal structure PDB: 4U3U was aligned with the template model and the position of cycloheximide (CHX) was not altered. (D) As in C, showing density corresponding to a spermidine (PDB: 7R81) and unaccounted for density outside of the template (black arrow), which may also represent a polyamide.
Figure 2—figure supplement 1
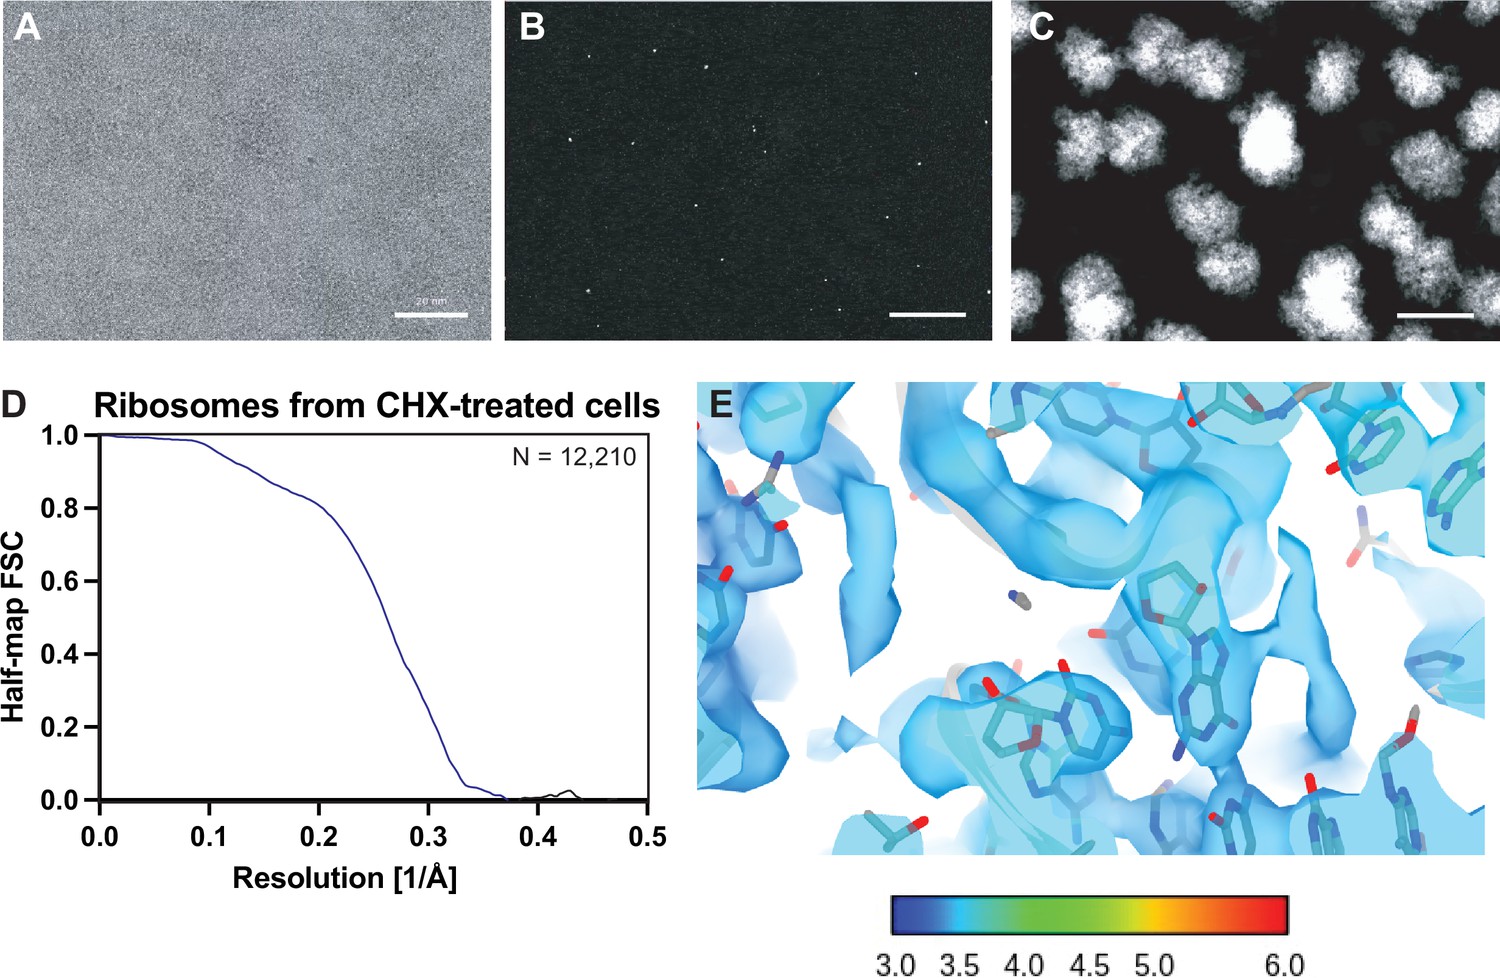
Results from a 2D template matching search of a yeast lamella using the yeast 60S ribosomal subunit as a template.
(A) Area of an example micrograph showing the yeast cytoplasm from Lucas and Grigorieff, 2023. Scale bar indicates 200 Å. (B) Maximum intensity projection showing the highest 2DTM SNR at each pixel after a 2DTM search of the image in (A) with a large ribosomal subunit (LSU) template. (C) 2D projections indicating the best matching 2D templates in the image in (A). (D) Plot showing the Fourier shell correlation (FSC) of the two half-maps of the reconstruction shown in Figure 2. (E) Density showing the region of the map in Figure 2D color coded by the local density.
Figure 2—figure supplement 2

Cycloheximide stalls the ribosome in a non-rotated PRE translocation state in vivo.
(A) Local resolution filtered map shown in Figure 2, only showing features outside of the template shows density consistent with A/A and P/P tRNAs. (B) The same region of the map rotated to show weak density in the polypeptide exit tunnel consistent with the nascent polypeptide attached to the A-site tRNA, consistent with the non-rotated PRE translocation state.
Figure 3
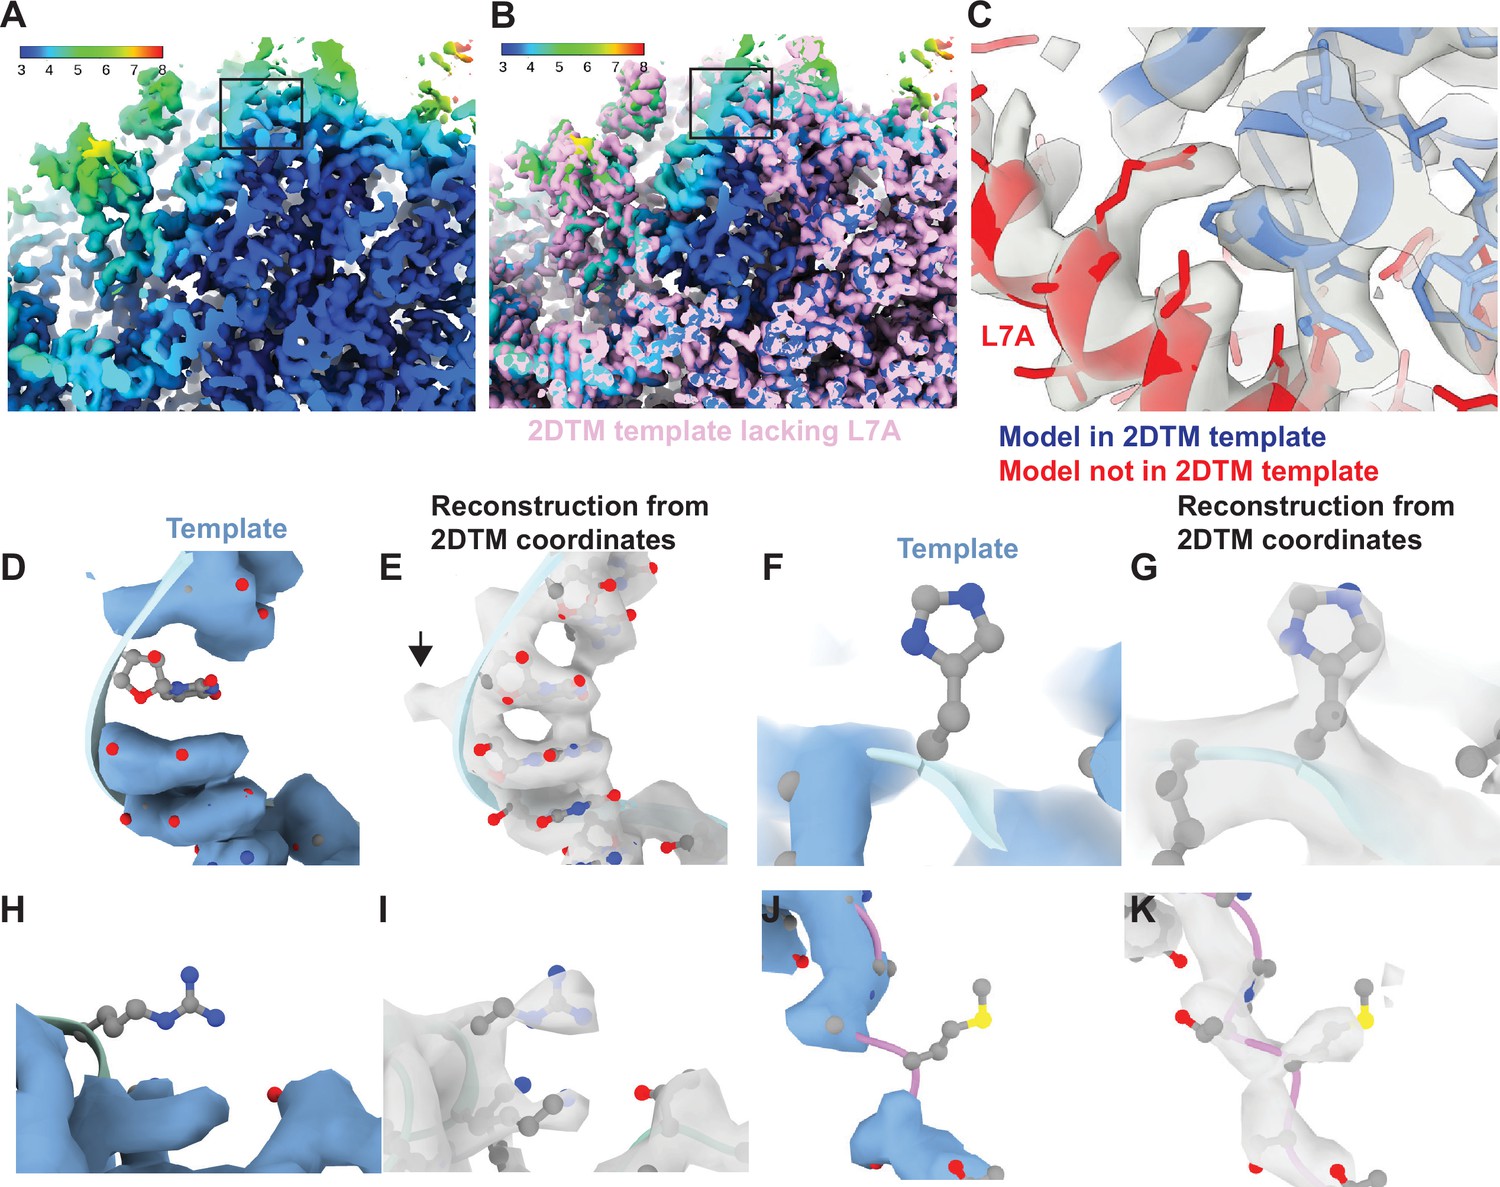
Baited reconstruction reveals high-resolution features in vivo without template bias.
(A) Slice of a reconstruction using 2DTM coordinates identified with a template lacking the protein L7A. Color coding indicates the local resolution as indicated in the key. (B) As in (A), pink indicates the 2DTM template used to identify the targets used in the reconstruction. (C) The model PDB: 6Q8Y is shown in the density. Red corresponds to the protein L7A, which was omitted from the template used to identify targets for the reconstruction. Blue corresponds to model features that were present in the template. (D) Single nucleotide omit template and (E) reconstruction showing emergence of density outside of the template, including a phosphate bulge, black arrow. Single amino acid omit templates lacking Phe (F), Arg (H), or Ser (J) and density (G, I, K), respectively, showing emergence of features consistent with each amino acid.
Figure 4 with 1 supplement
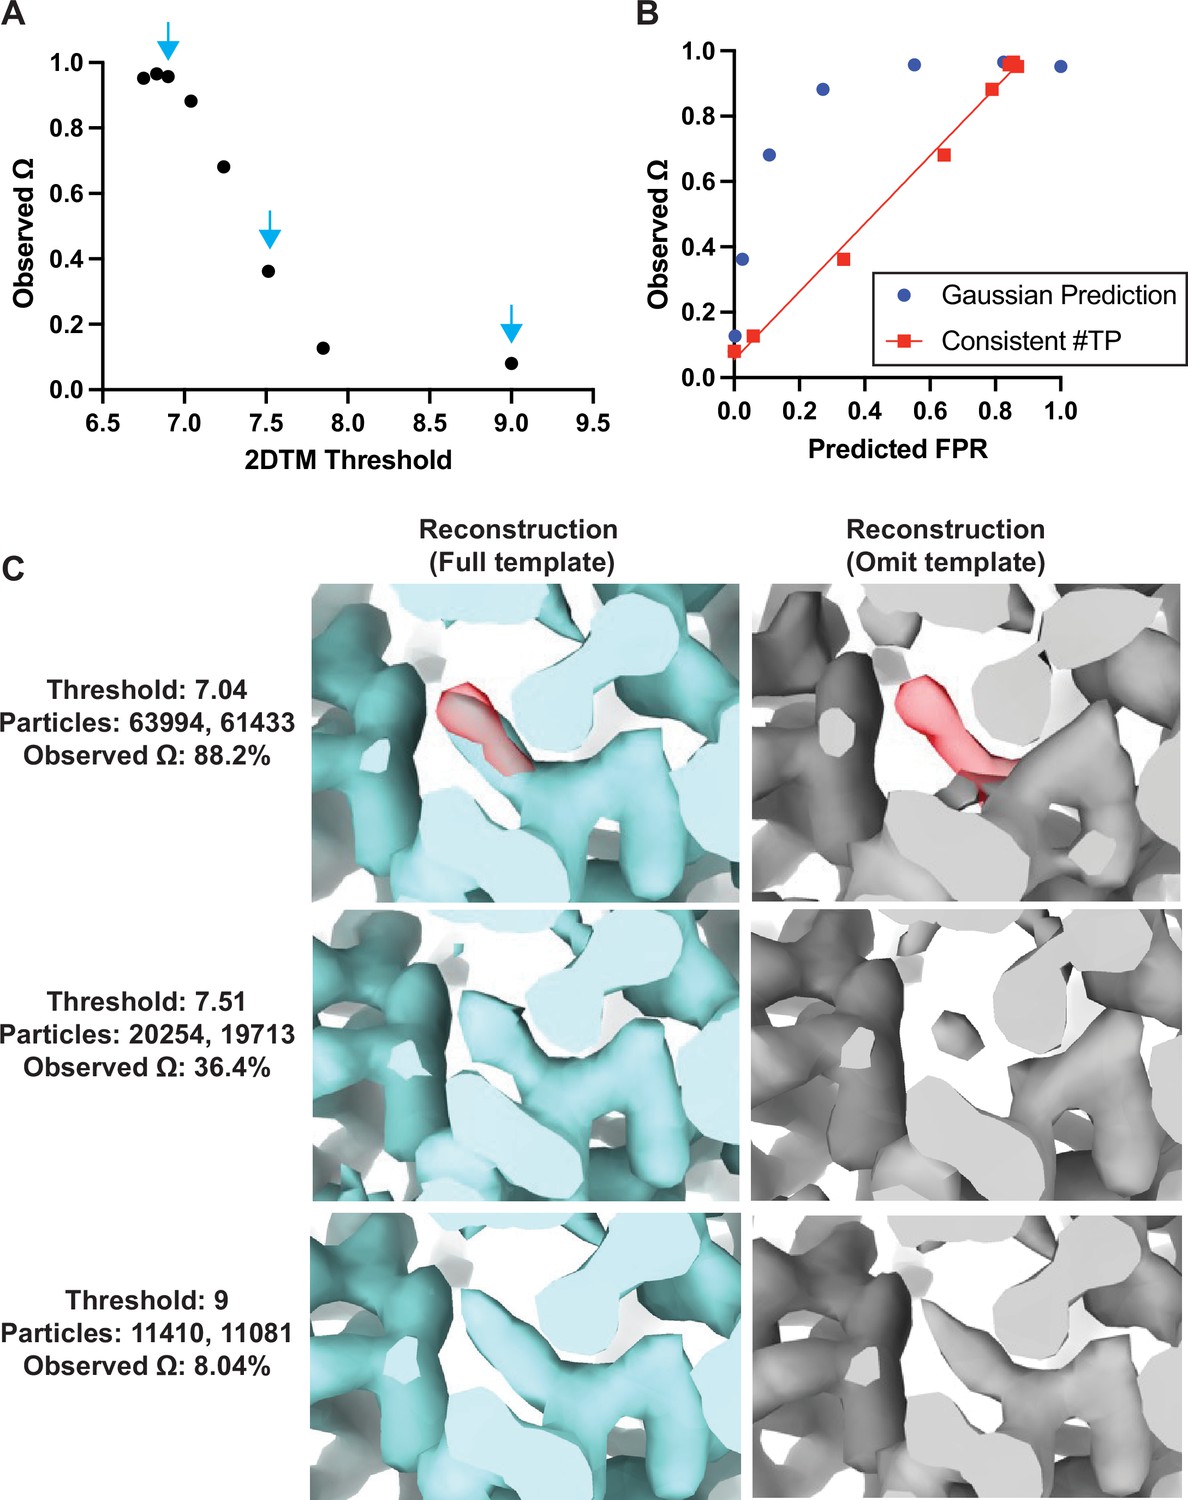
Baited reconstruction provides a quantitative metric for template bias.
(A) Observed template bias () calculated using the cisTEM program measure_template_bias as a function of the 2DTM SNR threshold used to select targets from images of yeast lamellae. Blue arrows indicate the reconstructions shown in C. (B) Plot showing a comparison of the predicted false positive rate and the observed . The plotted straight line indicates the best fit linear function . (C) Images showing the same region of maps resulting from reconstruction using targets identified with the indicated template at the indicated 2DTM SNR threshold. Red indicates the location of the omitted residue in the omit template.
Figure 4—figure supplement 1

Plot showing the average relative number of large ribosomal subunits (LSUs) detected in seven images of ~150 nm thick lamellae using templates generated from subsections of the LSU of the indicated molecular mass.
The x-intercept indicates the smallest particle that was detectable on average, which in this case is 300 kDa.
Tables
Table 1
Preparation and simulation of the 3D templates used in this study.
| Template name | PDB | PDB modified? | Resolution of PDB map(Å) | PDB B-factor scaling | Additional B-factor applied (Å2) | Pixel size(Å) | Box size(pixels) |
|---|---|---|---|---|---|---|---|
| Bgal | 1DP0 | 10 Å sphere around Asp 102 deleted. HETATOMs excluded | 1.7 | 0 | 50 | 0.672 | 512 |
| LSU | 6Q8Y | Only atomic coordinates corresponding to the LSU included. HETATOMs excluded | 3.1 | 0 | 30 | 1.06 | 384 |
| LSU () | 6Q8Y | Only atomic coordinates corresponding to the LSU included. Atomic coordinates corresponding to L7A excluded. HETATOMs excluded | 3.1 | 0 | 30 | 1.06 | 384 |
Additional files
Download links
A two-part list of links to download the article, or parts of the article, in various formats.
Downloads (link to download the article as PDF)
Open citations (links to open the citations from this article in various online reference manager services)
Cite this article (links to download the citations from this article in formats compatible with various reference manager tools)
Baited reconstruction with 2D template matching for high-resolution structure determination in vitro and in vivo without template bias
eLife 12:RP90486.
https://doi.org/10.7554/eLife.90486.3


