Heat stress-induced activation of MAPK pathway attenuates Atf1-dependent epigenetic inheritance of heterochromatin in fission yeast
- State Key Laboratory of Cellular Stress Biology, School of Life Sciences, Faculty of Medicine and Life Sciences, Xiamen University, China
Figures
Figure 1 with 2 supplements
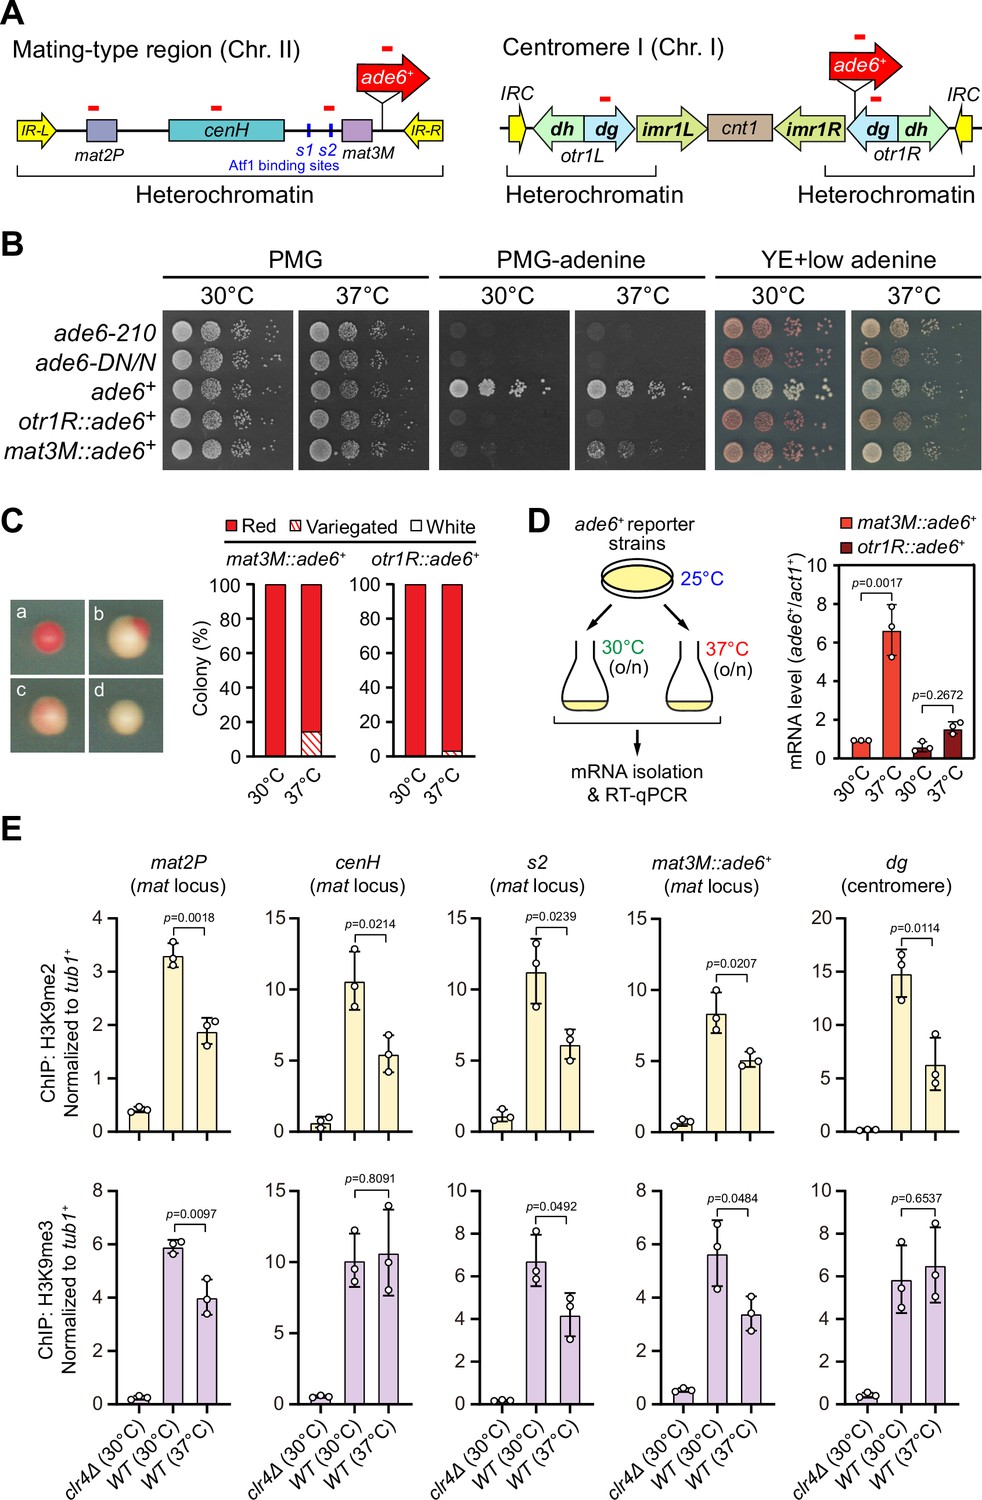
Heat stress leads to gene silencing defects at the mating-type region.
(A) Schematic of an ade6+ reporter gene inserted into mating-type region and pericentromeric region. Primer positions for RT-qPCR or ChIP analysis are indicated (red bars). cenH, a DNA element homologous to pericentromeric repeats; mat2-P and mat3-M, two silent cassettes used for mating-type switching; IR-L and IR-R, inverted repeats and boundary elements; s1 and s2, two Atf1 binding sites; cnt1, central core; imr1, innermost repeats; otr1, outermost repeats; dg and dh, tandem repeats in otr; IRC, inverted repeats and boundary elements. (B) Expression of the ade6+ reporter monitored by serial dilution spot assay at 30°C and 37°C. The media used were nonselective PMG, selective PMG without adenine, and YE5S with low concentration of adenine. (C) Expression of the ade6+ reporter monitored by colony color assay. (Left) Representative colonies of ade6+ reporter fully repressed (red), partially repressed (variegated), and completely expressed (white) on low adenine medium. (Right) Variegated colonies were quantified at 30°C and 37°C. n>500 colonies counted for each sample. (D) RT-qPCR analyses of ade6+ reporter. (Left) Schematic depicting the experimental flow of culturing and mRNA extraction. (Right) The relative ade6+ mRNA level was quantified with a ratio between mat3M::ade6+ and act1+ in 30°C samples being set as 1.00. Error bars indicate mean ± standard deviation of three independent experiments. Two-tailed unpaired t-test was used to derive p-values. (E) ChIP-qPCR analyses of H3K9me2/3 levels at heterochromatic loci. Relative enrichment of H3K9me2/3 was normalized to that of a tub1+ fragment. Error bars represent standard deviation of three experiments. Two-tailed unpaired t-test was used to derive p-values.
-
Figure 1—source data 1
Raw data of colony color assay, RT-qPCR, H3K9me2/3 ChIP.
- https://cdn.elifesciences.org/articles/90525/elife-90525-fig1-data1-v2.xls
Figure 1—figure supplement 1
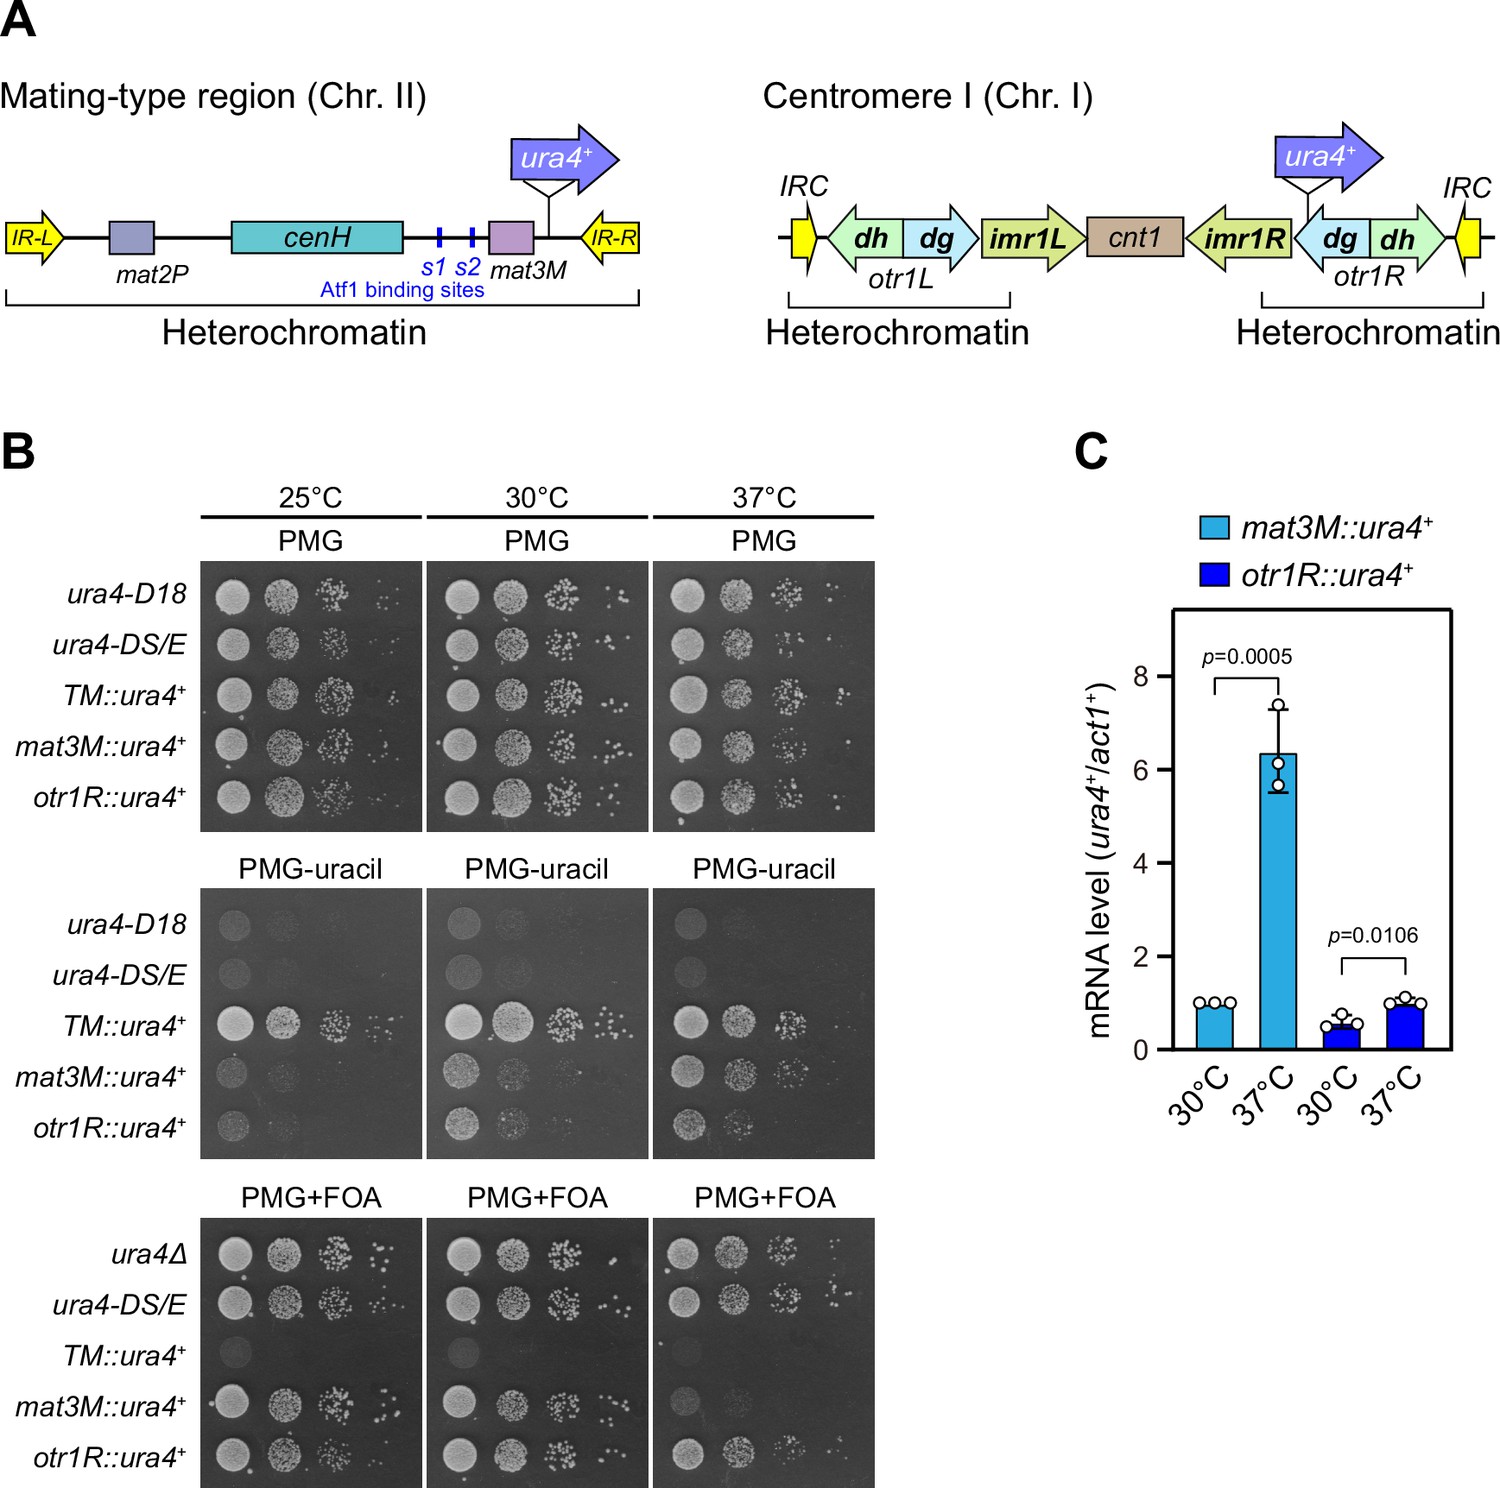
Heat stress leads to defective silencing of reporter ura4+ at the mating-type region.
(A) Schematic of an ura4+ reporter gene inserted into the mating-type region and pericentromeric region. cenH, a DNA element homologous to pericentromeric repeats; mat2-P and mat3-M, two silent cassettes used for mating-type switching; IR-L and IR-R, inverted repeats and boundary elements; s1 and s2, two Atf1 binding sites; cnt1, central core; imr1, innermost repeats; otr1, outermost repeats; dg and dh, tandem repeats in otr; IRC, inverted repeats and boundary elements. (B) Expression of the ura4+ reporter was monitored by serial dilution spot assay at indicated temperatures. The media used were nonselective PMG5S and selective PMG without uracil or containing 0.15% FOA. ura4-D18, complete deletion version of ura4+ gene; ura4-DS/E, truncated version of ura4+ gene; TM::ura4+, ura4+ gene inserted at a random site within euchromatin region in the genome. (C) RT-qPCR analyses of ura4+ reporters. The relative ura4+ mRNA level was quantified with a ratio between mat3M::ura4+ and act1+ in 30°C samples being set as 1.00. Error bars indicate mean ± standard deviation of three independent experiments. Two-tailed unpaired t-test was used to derive p-values.
-
Figure 1—figure supplement 1—source data 1
Raw data of RT-qPCR.
- https://cdn.elifesciences.org/articles/90525/elife-90525-fig1-figsupp1-data1-v2.xls
Figure 1—figure supplement 2
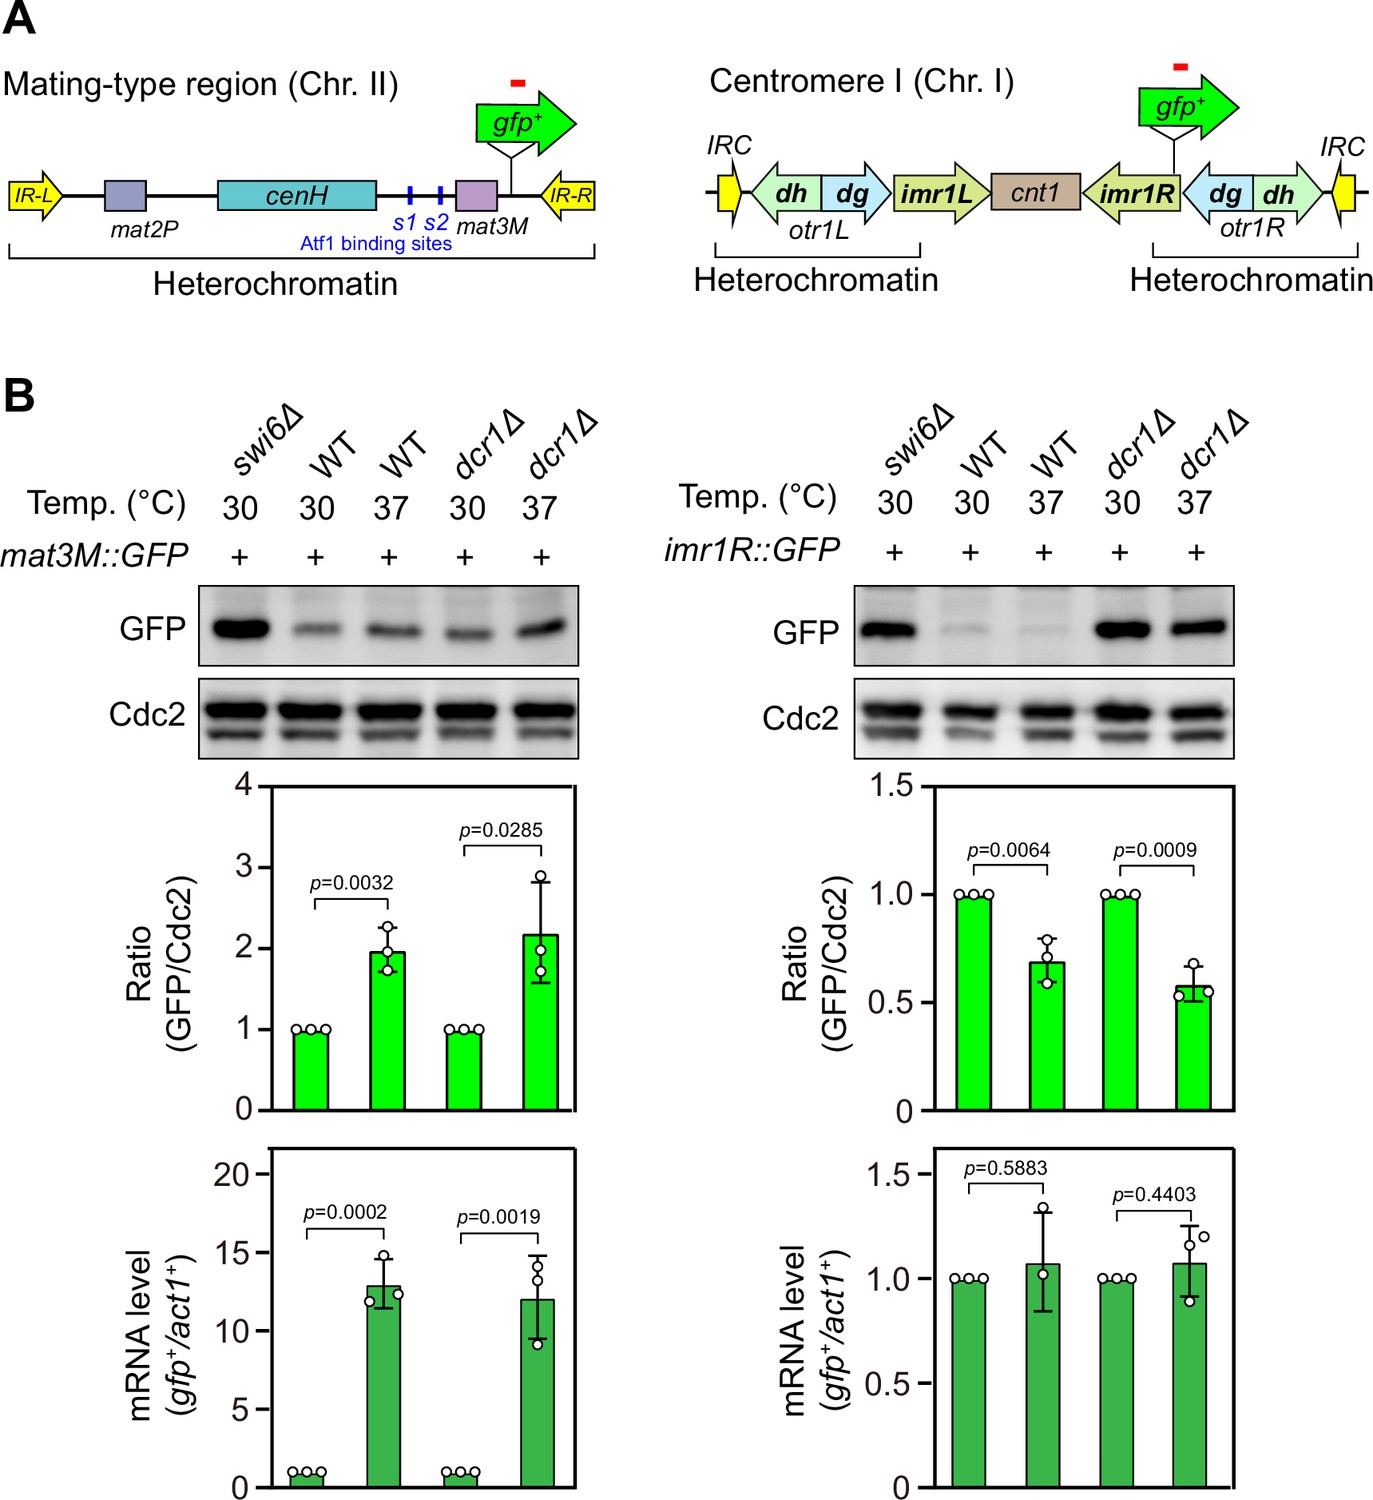
Heat stress leads to defective silencing of gfp+ reporter gene at the mating-type region.
(A) Schematic of a gfp+ reporter gene inserted into the mating-type region (mat3M) and pericentromeric region (imr1R). (B) Western blotting and RT-qPCR analyses were used to measure expression of the gfp+ reporter. (Upper) Western blotting analyses of the protein level of GFP in wild type, dcr1Δ and swi6Δ cells at 30°C and 37°C. (Middle) Quantitative analyses of the protein level of GFP in wild type and dcr1Δ cells at 30°C and 37°C. (Lower) RT-qPCR analyses of gfp+ reporter in wild type and dcr1Δ cells at 30°C and 37°C. For quantifications, the relative protein or mRNA levels were quantified with a ratio between GFP and Cdc2 or between transcripts of gfp+ and act1+ in 30°C samples being set as 1.00, respectively. Error bars indicate mean ± standard deviation of three independent experiments. Two-tailed unpaired t-test was used to derive p-values.
-
Figure 1—figure supplement 2—source data 1
Raw data of GFP level measurement, RT-qPCR.
- https://cdn.elifesciences.org/articles/90525/elife-90525-fig1-figsupp2-data1-v2.xlsx
-
Figure 1—figure supplement 2—source data 2
Full raw unedited blot (mat3M-GFP) for Figure 1—figure supplement 2B.
- https://cdn.elifesciences.org/articles/90525/elife-90525-fig1-figsupp2-data2-v2.zip
-
Figure 1—figure supplement 2—source data 3
Full raw unedited blot (Cdc2) for Figure 1—figure supplement 2B.
- https://cdn.elifesciences.org/articles/90525/elife-90525-fig1-figsupp2-data3-v2.zip
-
Figure 1—figure supplement 2—source data 4
Full raw unedited blot (imr1R-GFP) for Figure 1—figure supplement 2B.
- https://cdn.elifesciences.org/articles/90525/elife-90525-fig1-figsupp2-data4-v2.zip
-
Figure 1—figure supplement 2—source data 5
Full raw unedited blot (Cdc2) for Figure 1—figure supplement 2B.
- https://cdn.elifesciences.org/articles/90525/elife-90525-fig1-figsupp2-data5-v2.zip
-
Figure 1—figure supplement 2—source data 6
Uncropped blots for Figure 1—figure supplement 2.
- https://cdn.elifesciences.org/articles/90525/elife-90525-fig1-figsupp2-data6-v2.pdf
Figure 2 with 1 supplement
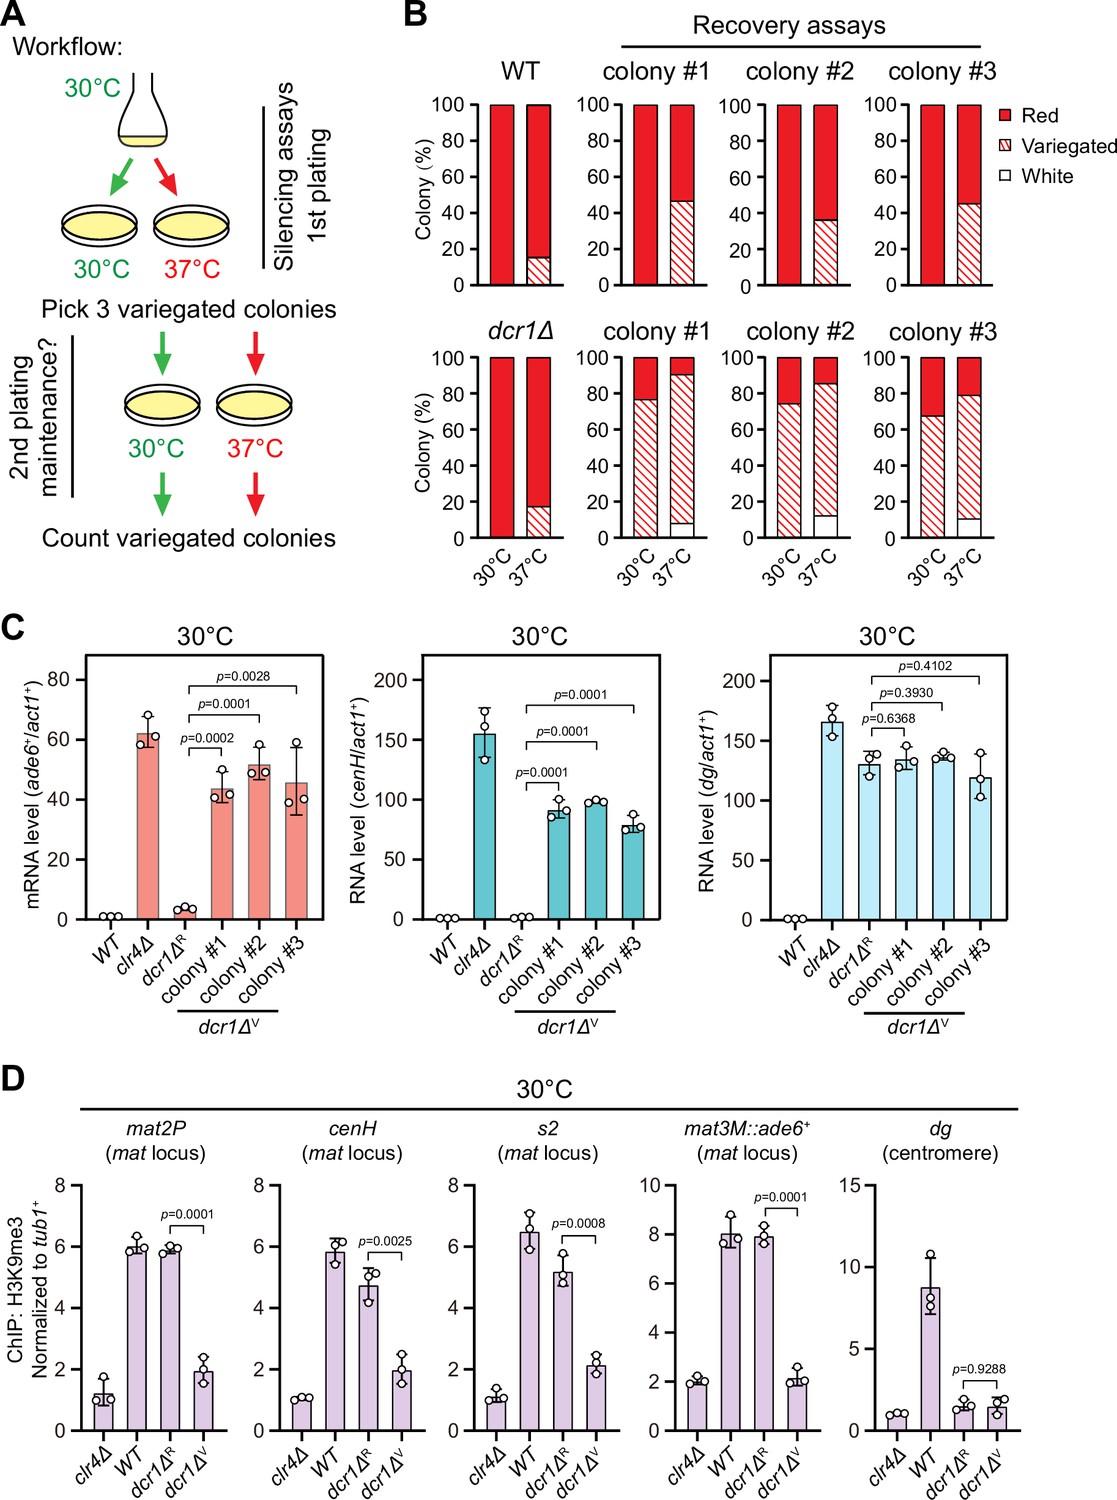
Heat stress compromises reestablishment of a stable epigenetic state of heterochromatin at the mating-type region.
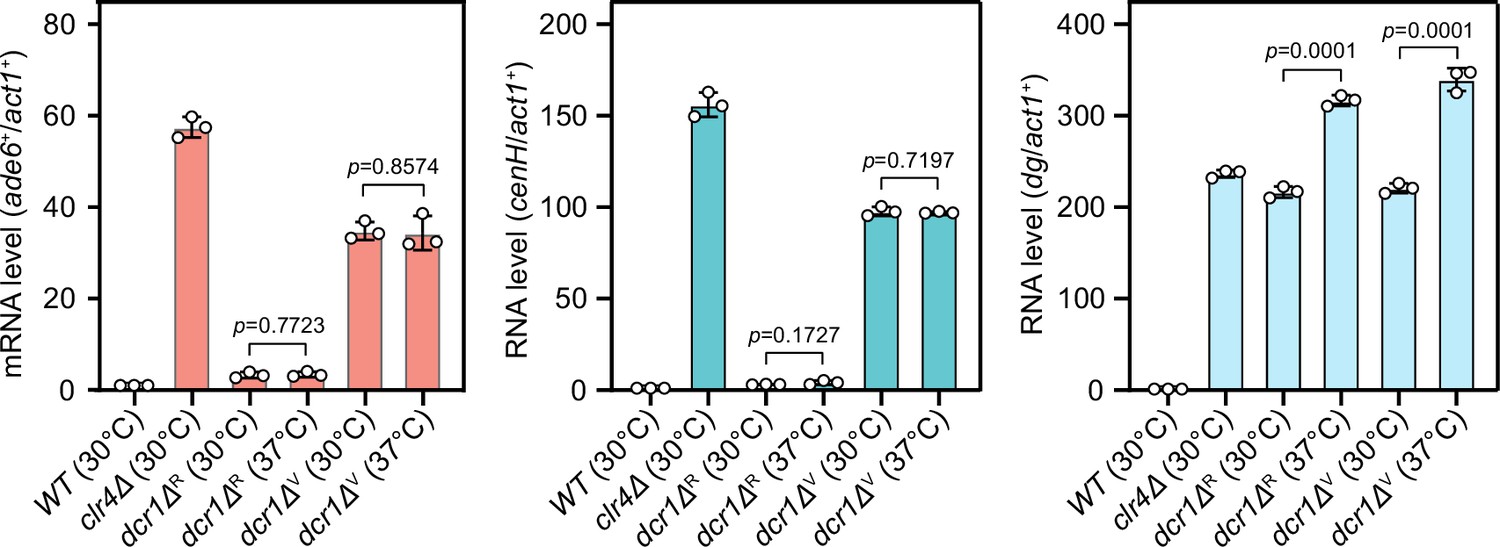
(A) Workflow of gene silencing recovery assays. First plating: strains were plated on low adenine medium at 30°C and 37°C. Second plating: three variegated colonies (mat3M::ade6+ was partially repressed) from low adenine plates at 37°C were collected, resuspended in water, and then directly re-plated on low adenine medium and grown at 30°C or 37°C. Variegated colonies were counted to assess the gene silencing defect. (B) Quantified results of mat3M::ade6+ gene silencing recovery assays. Variegated colonies on low adenine medium from first plating and second plating were counted. n>500 colonies counted for each sample. (C) RT-qPCR analyses of mat3M::ade6+ reporter, cenH and dg transcripts. dcr1ΔR and dcr1ΔV denote red colonies and variegated colonies respectively when dcr1Δ cells were grown on low adenine plate at 37°C. Three variegated colonies were picked and re-plated on low adenine medium and grown at 30°C. The relative transcript level was quantified with a ratio between respective transcript and act1+ in 30°C wild type samples being set as 1.00. Error bars indicate mean ± standard deviation of three independent experiments. Two-tailed unpaired t-test was used to derive p-values. (D) ChIP-qPCR analyses of H3K9me3 levels at heterochromatic loci. Samples were collected as in (C). Relative enrichment of H3K9me3 was normalized to that of a tub1+ fragment. Error bars represent standard deviation of three experiments. Two-tailed unpaired t-test was used to derive p-values.
-
Figure 2—source data 1
Raw data of colony color assay, RT-qPCR, H3K9me3 ChIP.
- https://cdn.elifesciences.org/articles/90525/elife-90525-fig2-data1-v2.xls
Figure 2—figure supplement 1
Comparison of expression of mat3M::ade6+ reporter, cenH and dg in dcr1Δ background at 30°C and 37°C after heat stress.
RT-qPCR analyses of mat3M::ade6+ reporter, cenH and dg transcripts. dcr1ΔR and dcr1ΔV indicate red colonies and variegated colonies respectively when dcr1Δ cells were grown on low adenine plate at 37°C. Variegated colonies were picked and re-plated on low adenine medium and grown at 30°C or 37°C. The relative transcript level was quantified with a ratio between respective transcript and act1+ in 30°C wild type samples being set as 1.00. Error bars indicate mean ± standard deviation of three independent experiments. Two-tailed unpaired t-test was used to derive p-values.
-
Figure 2—figure supplement 1—source data 1
Raw data of RT-qPCR.
- https://cdn.elifesciences.org/articles/90525/elife-90525-fig2-figsupp1-data1-v2.xls
Figure 3 with 2 supplements
Heat stress-induced defective heterochromatic maintenance at the mating-type region can be rescued by non-phosphorylatable Atf1(10A/I).
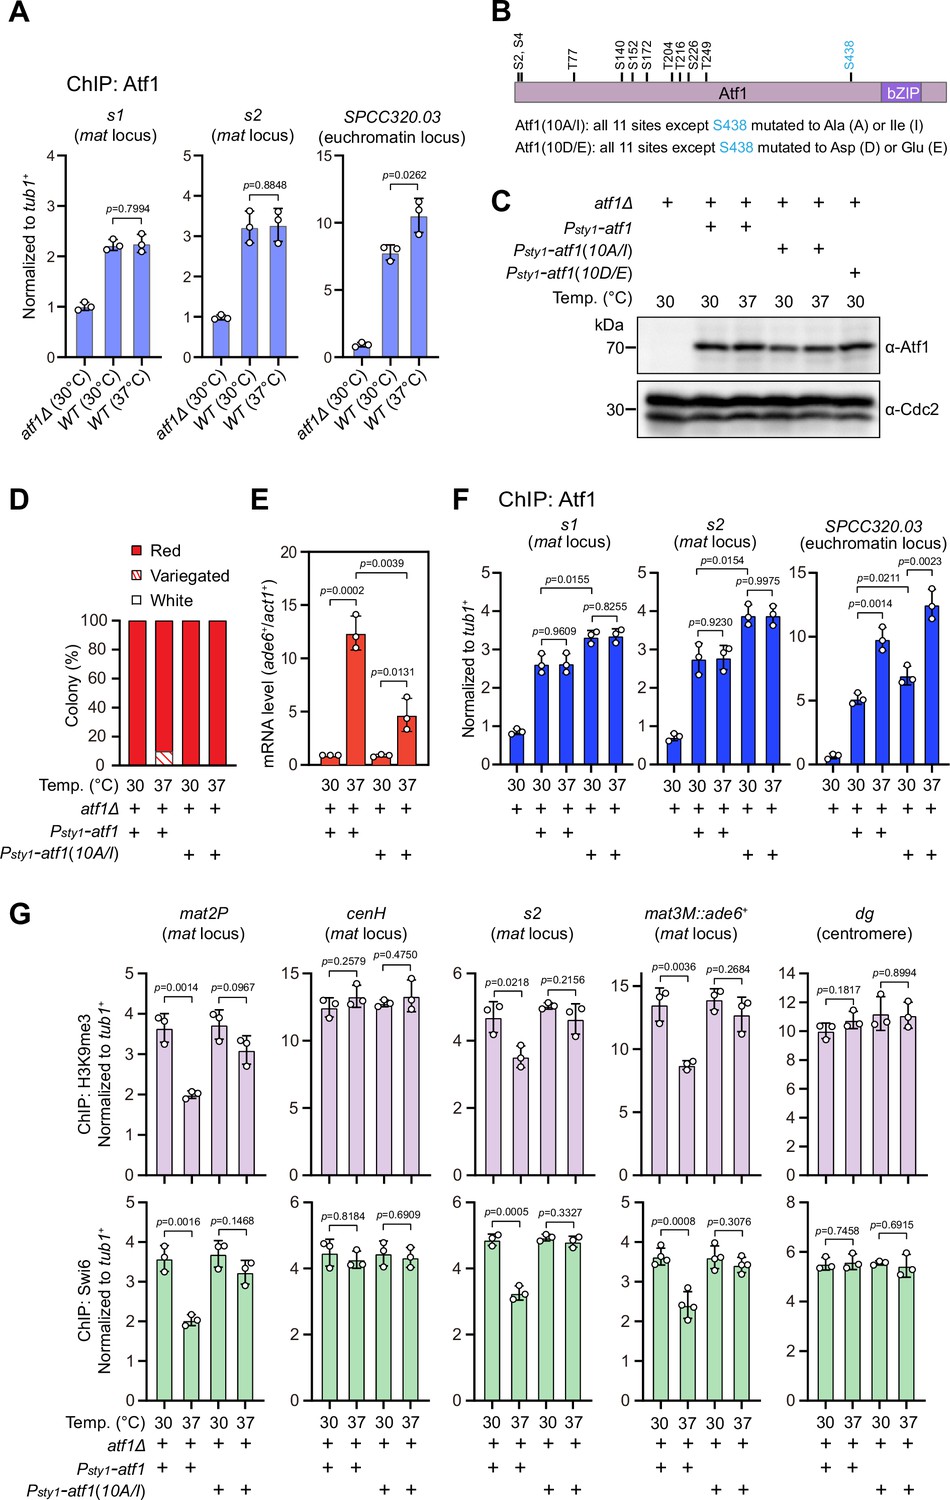
(A) ChIP-qPCR analyses of Atf1 levels at two Atf1 binding sites (s1, s2) within mating-type region and an euchromatic target of Atf1 (SPCC320.03). Relative enrichment of Atf1 is normalized to that of a tub1+ fragment. Error bars represent standard deviation of three experiments. Two-tailed unpaired t-test was used to derive p-values. (B) Schematic depiction of the Atf1 protein with the substitutions of the 10 putative phosphorylation sites to alanines or isoleucines (10A/I), or aspartic acids or glutamic acids (10D/E) indicated. (C) Western blotting analyses of the protein level of Atf1 in atf1Δ background cells expressing HA-Atf1, HA-Atf1(10A/I), or HA-Atf1(10D/E) under the control of sty1+ promoter. (D) Expression of the mat3M::ade6+ reporter monitored by colony color assay in atf1Δ cells expressing Psty1-HA-atf1 or Psty1-HA-atf1(10A/I) as in Figure 1C. n>500 colonies counted for each sample. (E) RT-qPCR analyses of the mat3M::ade6+ reporter in atf1Δ cells expressing Psty1-HA-atf1 or Psty1-HA-atf1(10A/I). (F) ChIP-qPCR analyses of Atf1 levels at two Atf1 binding sites within mating-type region and an euchromatic target of Atf1 (SPCC320.03) in atf1Δ cells expressing Psty1-HA-atf1 or Psty1-HA-atf1(10A/I). (G) ChIP-qPCR analyses of H3K9me3 and Swi6 levels at heterochromatic loci in atf1Δ cells expressing Psty1-HA-atf1 or Psty1-HA-atf1(10A/I).
-
Figure 3—source data 1
Raw data of colony color assay, RT-qPCR, Atf1/Swi6/H3K9me3 ChIP.
- https://cdn.elifesciences.org/articles/90525/elife-90525-fig3-data1-v2.xlsx
-
Figure 3—source data 2
Full raw unedited blot (Atf1) for Figure 3C.
- https://cdn.elifesciences.org/articles/90525/elife-90525-fig3-data2-v2.zip
-
Figure 3—source data 3
Full raw unedited blot (Cdc2) for Figure 3C.
- https://cdn.elifesciences.org/articles/90525/elife-90525-fig3-data3-v2.zip
-
Figure 3—source data 4
Uncropped blots for Figure 3C.
- https://cdn.elifesciences.org/articles/90525/elife-90525-fig3-data4-v2.pdf
Figure 3—figure supplement 1
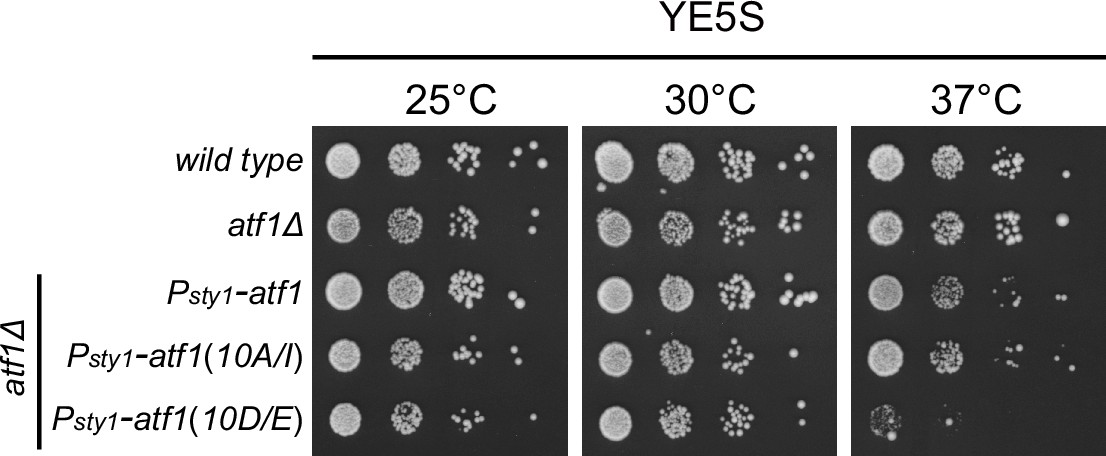
Expression of Atf1(10D/E) under the control of sty1 promoter (Psty1) leads to lethality at 37°C.
Yeast strains with indicated genotypes were first grown in liquid YES at 25°C, then spotted onto YES plates. Plates were incubated at indicated temperatures for >3 days.
Figure 3—figure supplement 2
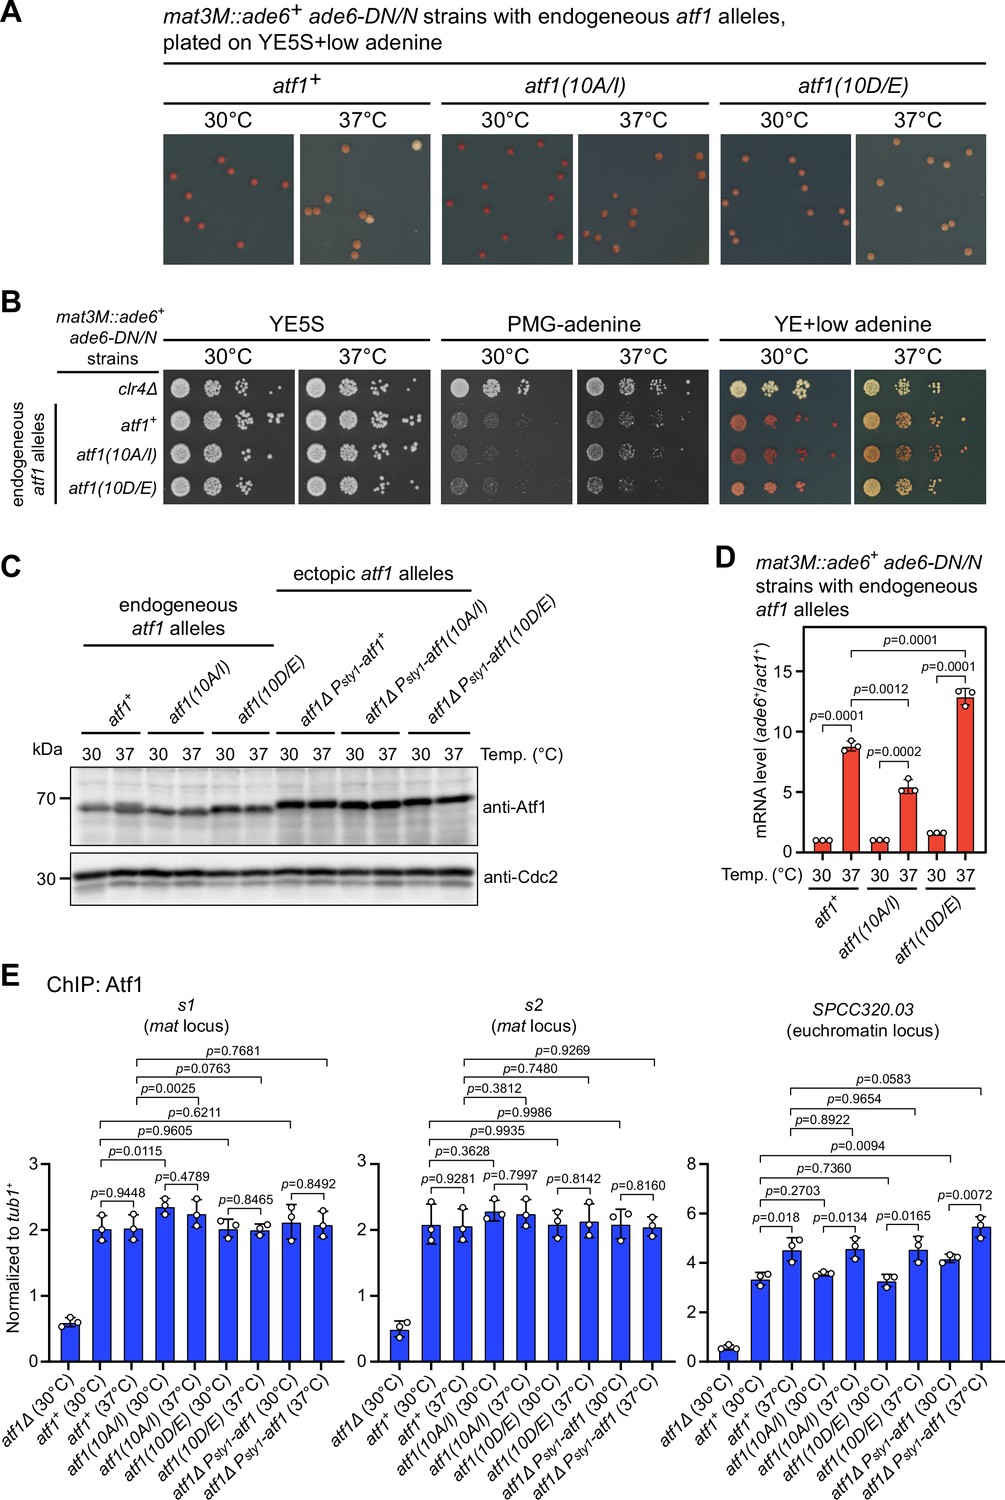
Atf1 phosphorylation mutants Atf1(10A/I) and Atf1(10D/E) expressed under the endogeneous atf1 promoter enhance or reduce mat3M::ade6+ silencing respectively.
(A and B) Expression of the ade6+ reporter in strains with endogeneous atf1 alleles monitored by colony color assay (A) and serial dilution spot assay (B) at 30°C and 37°C. (C) Comparison of the protein levels of Atf1 detected by western blotting in strains with endogeneous and ectopic atf1 mutant alleles driven by Patf1 or Psty1 promoter respectively. (D) RT-qPCR analyses of the mat3M::ade6+ reporter in Patf1-atf1(10A/I) and Patf1-atf1(10D/E) cells. Note that the mRNA levels of ade6+ were reduced in atf1(10A/I) mutant and elevated in atf1(10D/E) mutant compared to wild type when being grown at 37°C. (E) ChIP-qPCR analyses of Atf1 enrichment at two Atf1 binding sites within mat locus and an euchromatic target of Atf1 (SPCC320.03) in strains with endogeneous atf1 alleles. Strain expressing ectopic Psty1-HA-atf1 serves as a control.
-
Figure 3—figure supplement 2—source data 1
Full raw unedited blots (Atf1 and Cdc2) for Figure 3—figure supplement 2C.
- https://cdn.elifesciences.org/articles/90525/elife-90525-fig3-figsupp2-data1-v2.zip
-
Figure 3—figure supplement 2—source data 2
Uncropped blots for Figure 3—figure supplement 2.
- https://cdn.elifesciences.org/articles/90525/elife-90525-fig3-figsupp2-data2-v2.pdf
-
Figure 3—figure supplement 2—source data 3
Raw data of RT-qPCR, Atf1 ChIP.
- https://cdn.elifesciences.org/articles/90525/elife-90525-fig3-figsupp2-data3-v2.xls
Figure 4 with 2 supplements
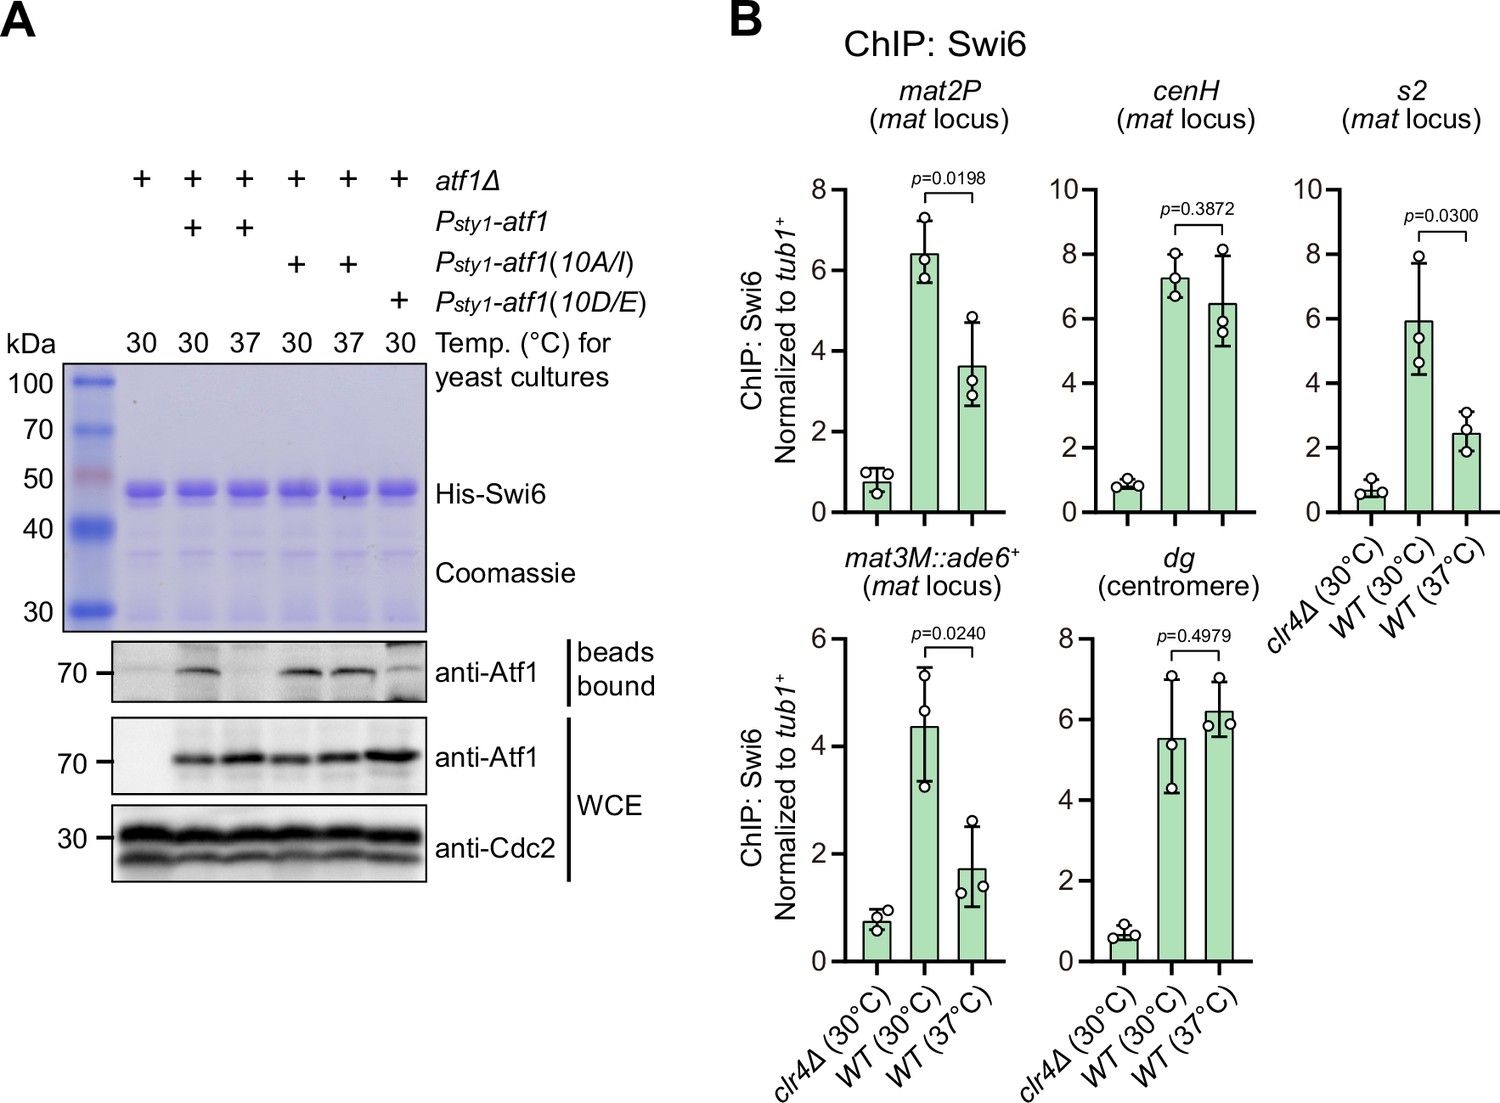
Phosphorylation of Atf1 impairs its interaction with Swi6HP1.
(A) Binding affinity between Atf1 and Swi6HP1 is maintained for non-phosphorylatable Atf1(10A/I) at 37°C, but disrupted for phosphomimetic Atf1(10D/E) even at 30°C. Yeast lysates from atf1Δ cells expressing Psty1-HA-atf1, Psty1-HA-atf1(10A/I), or Psty1-HA-atf1(10D/E) grown at either 30°C or 37°C were incubated with bacteria-expressed 6His-Swi6 in in vitro pull-down assays. Bound and total Atf1 were detected by immunoblotting with Cdc2 used as a loading control. Results are representative of three independent experiments. (B) ChIP-qPCR analyses of Swi6 levels at heterochromatic loci. Relative enrichment of Swi6 was normalized to that of a tub1+ fragment. Error bars represent standard deviation of three experiments. Two-tailed unpaired t-test was used to derive p-values.
-
Figure 4—source data 1
Raw data of Swi6 ChIP.
- https://cdn.elifesciences.org/articles/90525/elife-90525-fig4-data1-v2.xlsx
-
Figure 4—source data 2
Full raw unedited Coomassie gel (His-Swi6) for Figure 4A.
- https://cdn.elifesciences.org/articles/90525/elife-90525-fig4-data2-v2.zip
-
Figure 4—source data 3
Full raw unedited blot (bead bound-Atf1) for Figure 4A.
- https://cdn.elifesciences.org/articles/90525/elife-90525-fig4-data3-v2.zip
-
Figure 4—source data 4
Full raw unedited blot (WCE-Atf1) for Figure 4A.
- https://cdn.elifesciences.org/articles/90525/elife-90525-fig4-data4-v2.zip
-
Figure 4—source data 5
Full raw unedited blot (WCE-Cdc2) for Figure 4A.
- https://cdn.elifesciences.org/articles/90525/elife-90525-fig4-data5-v2.zip
-
Figure 4—source data 6
Uncropped blots for Figure 4A.
- https://cdn.elifesciences.org/articles/90525/elife-90525-fig4-data6-v2.pdf
Figure 4—figure supplement 1
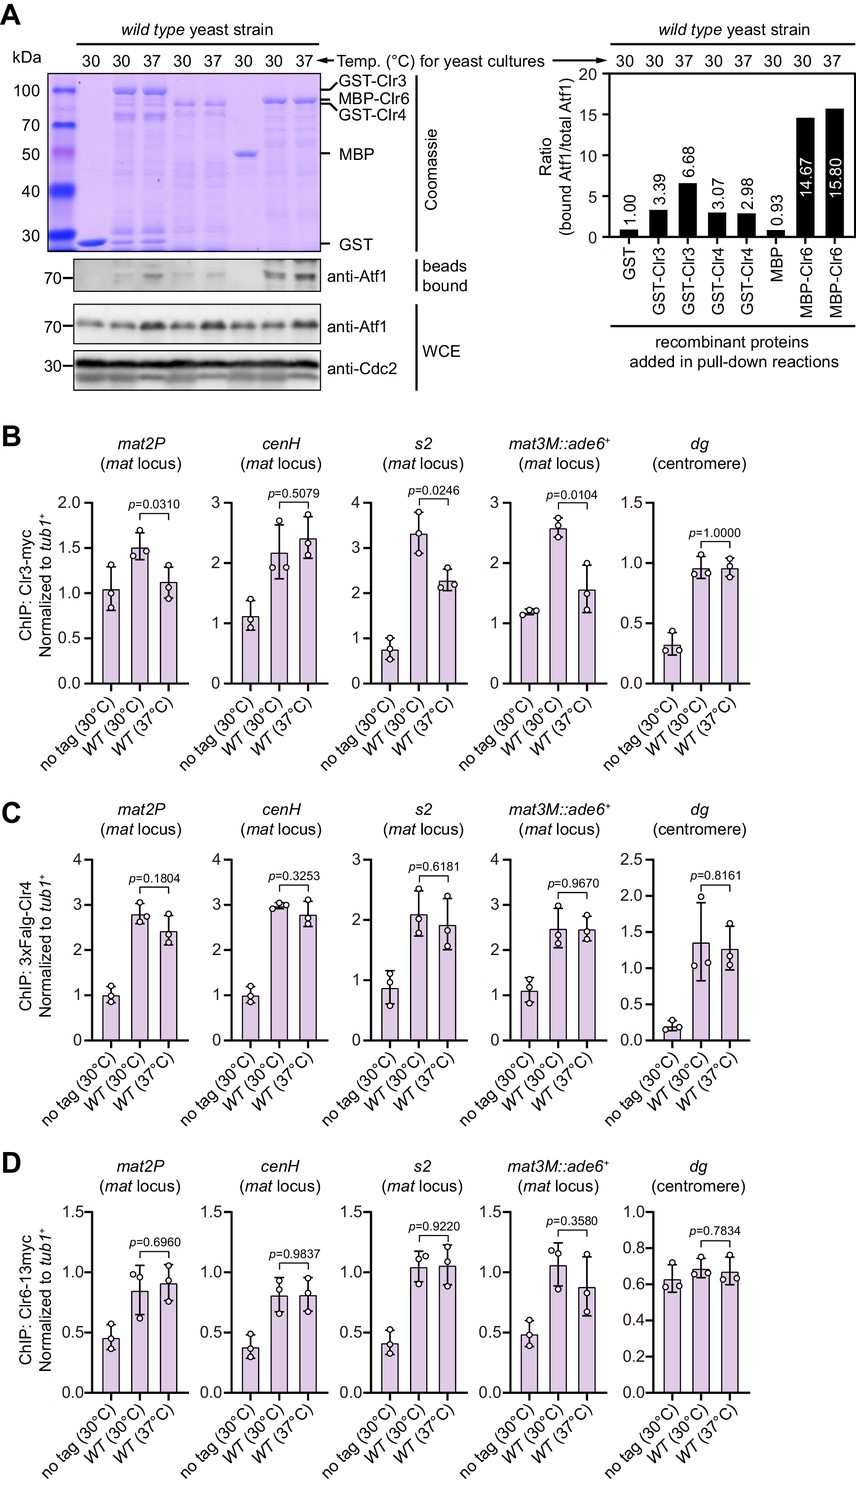
In vitro binding assay of association between Clr3, Clr4, or Clr6 and Atf1, and ChIP-qPCR analyses of their enrichment at different heterochromatic regions under heat stress.
(A) In vitro binding assays for binding affinity between Atf1 and Atf1-associated heterochromatin factors Clr3, Clr4, or Clr6. Cell lysates prepared from wild type yeast strain grown at either 30°C or 37°C were incubated with bacteria-expressed GST-Clr3, GST-Clr4, or MBP-Clr6. (Left) Bound and total Atf1 were detected by immunoblotting with Cdc2 used as a loading control. Results are representative of three independent experiments. (Right) The relative binding affinity between Atf1 and Clr3, Clr4, or Clr6 was quantified with a ratio between GST and Atf1 from a 30°C culture being set as 1.00. (B–D) ChIP-qPCR analyses of Clr3 (B), Clr4 (C), or Clr6 (D) levels at representative heterochromatic loci in wild type cells grown at 30°C and 37°C. Relative enrichment of Clr3, Clr4, or Clr6 was normalized to that of a tub1+ fragment. Error bars represent standard deviation of three experiments. Two-tailed unpaired t-test was used to derive p-values.
-
Figure 4—figure supplement 1—source data 1
Raw data of in vitro binding assay, Clr3/Clr4/Clr6 ChIP.
- https://cdn.elifesciences.org/articles/90525/elife-90525-fig4-figsupp1-data1-v2.xlsx
-
Figure 4—figure supplement 1—source data 2
Full raw unedited Coomassie gel for Figure 4—figure supplement 1A.
- https://cdn.elifesciences.org/articles/90525/elife-90525-fig4-figsupp1-data2-v2.zip
-
Figure 4—figure supplement 1—source data 3
Full raw unedited blot (bead bound-Atf1) for Figure 4—figure supplement 1A.
- https://cdn.elifesciences.org/articles/90525/elife-90525-fig4-figsupp1-data3-v2.zip
-
Figure 4—figure supplement 1—source data 4
Full raw unedited blot (WCE-Atf1) for Figure 4—figure supplement 1A.
- https://cdn.elifesciences.org/articles/90525/elife-90525-fig4-figsupp1-data4-v2.zip
-
Figure 4—figure supplement 1—source data 5
Full raw unedited blot (WCE-Cdc2) for Figure 4—figure supplement 1A.
- https://cdn.elifesciences.org/articles/90525/elife-90525-fig4-figsupp1-data5-v2.zip
-
Figure 4—figure supplement 1—source data 6
Uncropped blots for Figure 4—figure supplement 1A.
- https://cdn.elifesciences.org/articles/90525/elife-90525-fig4-figsupp1-data6-v2.pdf
Figure 4—figure supplement 2
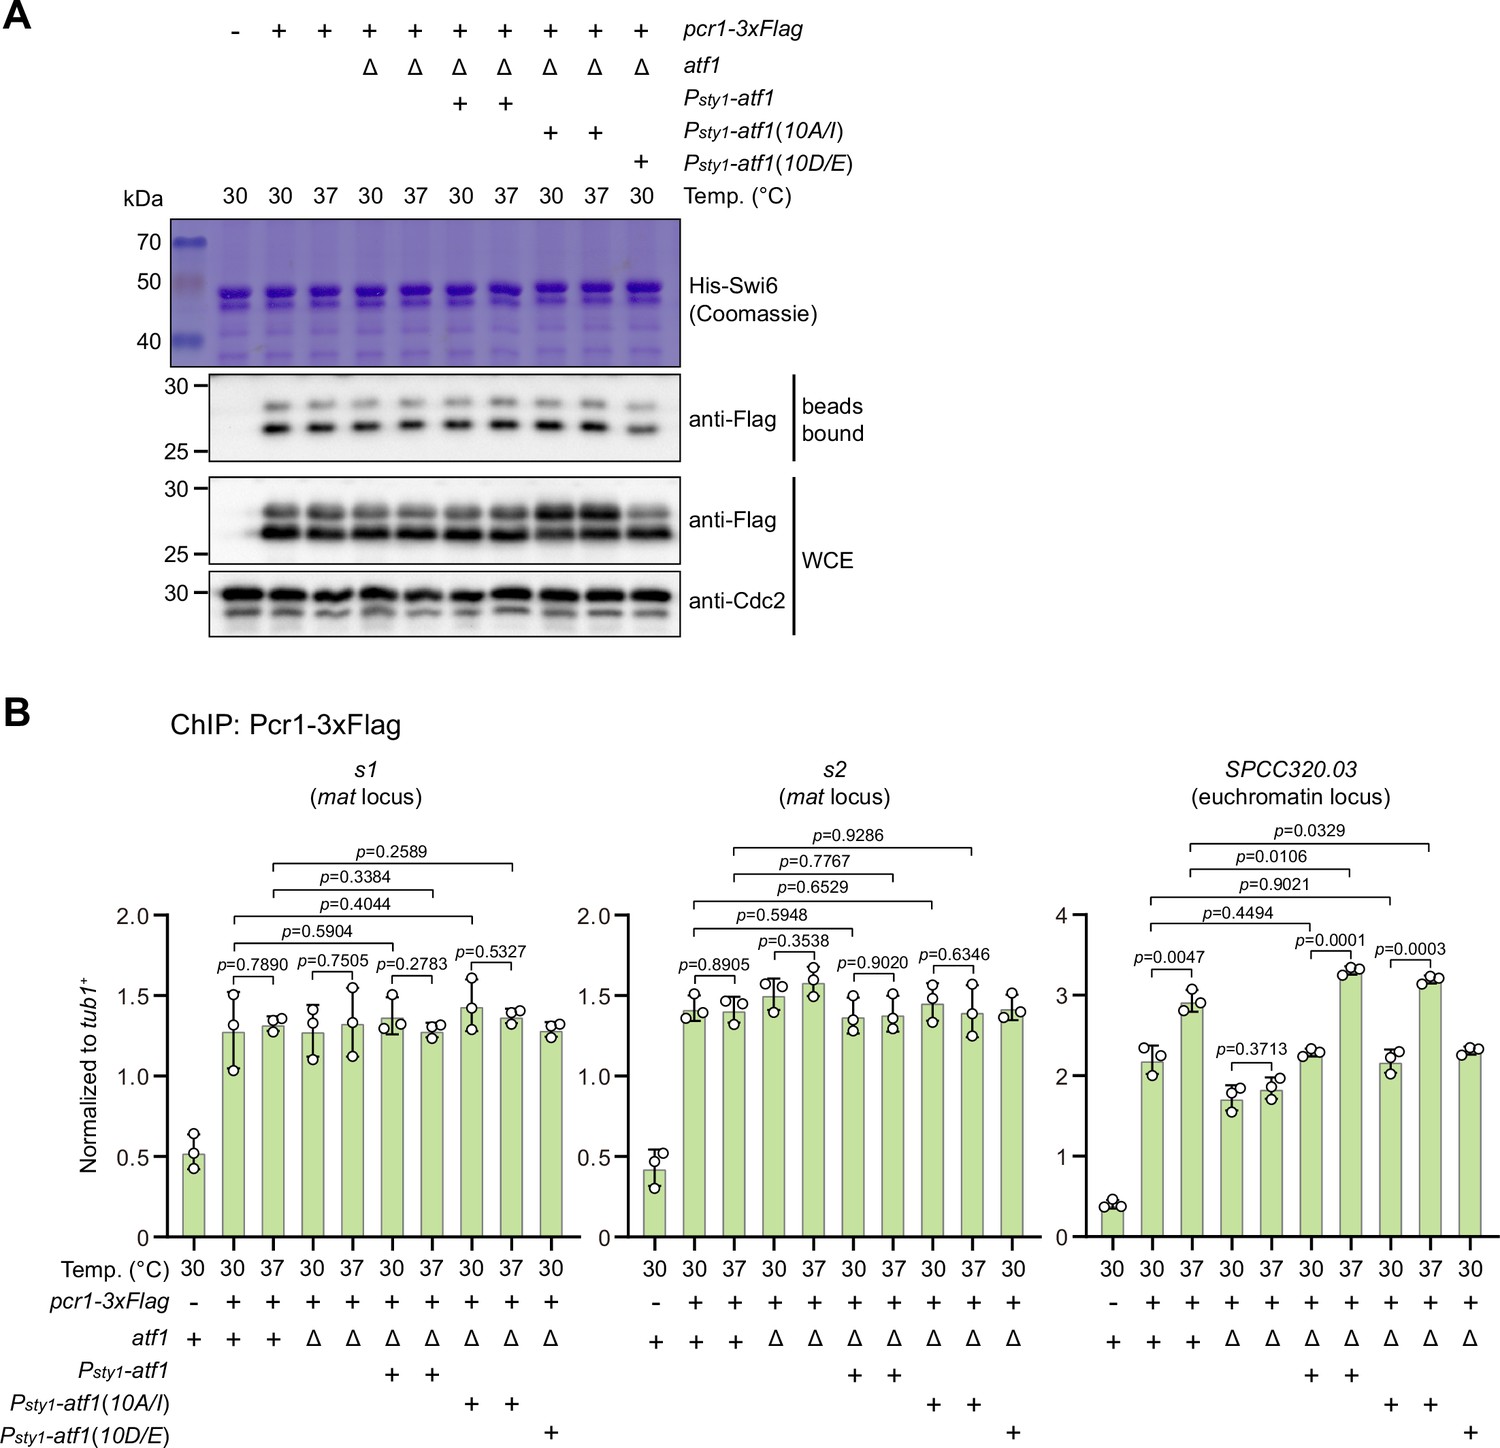
Phosphorylation status of Atf1 does not impair interaction between Pcr1 and Swi6HP1 and alter Pcr1 binding within mat locus.
(A) Binding affinity between Pcr1 and Swi6HP1 is maintained in both non-phosphorylatable Atf1(10A/I) and phosphomimetic Atf1(10D/E) mutants at 37°C. Yeast lysates from atf1Δ cells expressing Pcr1-3xFlag and Psty1-HA-atf1, Psty1-HA-atf1(10A/I), or Psty1-HA-atf1(10D/E) grown at either 30°C or 37°C were incubated with bacteria-expressed 6His-Swi6 in in vitro pull-down assays. Bound and total Pcr1 were detected by immunoblotting with Cdc2 used as a loading control. Results are representative of three independent experiments. Note that protein levels of Pcr1 are elevated in Psty1-HA-atf1(10A/I) mutant at both 30°C and 37°C. (B) ChIP-qPCR analyses of Pcr1 enrichment at two binding sites within mat locus and an euchromatic target of Atf1 (SPCC320.03) in strains with ectopic Psty1-HA-atf1, Psty1-HA-atf1(10A/I), or Psty1-HA-atf1(10D/E) alleles. Error bars represent standard deviation of three experiments. Two-tailed unpaired t-test was used to derive p-values.
-
Figure 4—figure supplement 2—source data 1
Full raw unedited gel (Coomassie) for Figure 4—figure supplement 2A.
- https://cdn.elifesciences.org/articles/90525/elife-90525-fig4-figsupp2-data1-v2.zip
-
Figure 4—figure supplement 2—source data 2
Full raw unedited blot (bead bound-Pcr1x3Flag) for Figure 4—figure supplement 2A.
- https://cdn.elifesciences.org/articles/90525/elife-90525-fig4-figsupp2-data2-v2.zip
-
Figure 4—figure supplement 2—source data 3
Full raw unedited blot (WCE-Pcr1x3Flag) for Figure 4—figure supplement 2A.
- https://cdn.elifesciences.org/articles/90525/elife-90525-fig4-figsupp2-data3-v2.zip
-
Figure 4—figure supplement 2—source data 4
Full raw unedited blot (WCE-Cdc2) for Figure 4—figure supplement 2A.
- https://cdn.elifesciences.org/articles/90525/elife-90525-fig4-figsupp2-data4-v2.zip
-
Figure 4—figure supplement 2—source data 5
Uncropped gel and blots for Figure 4—figure supplement 2A.
- https://cdn.elifesciences.org/articles/90525/elife-90525-fig4-figsupp2-data5-v2.pdf
-
Figure 4—figure supplement 2—source data 6
Raw data of Pcr1-3xFlag ChIP.
- https://cdn.elifesciences.org/articles/90525/elife-90525-fig4-figsupp2-data6-v2.xls
Figure 5 with 2 supplements
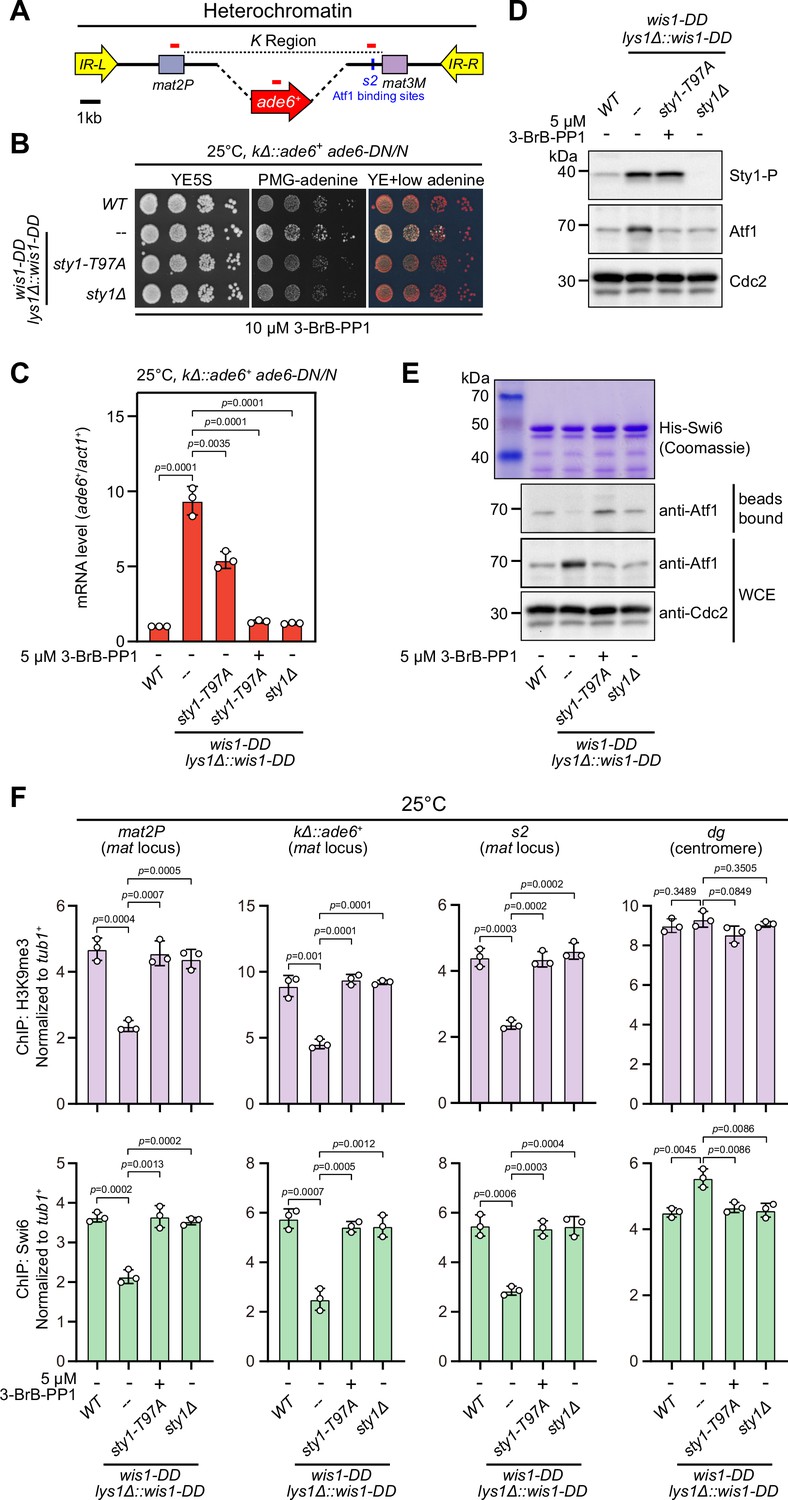
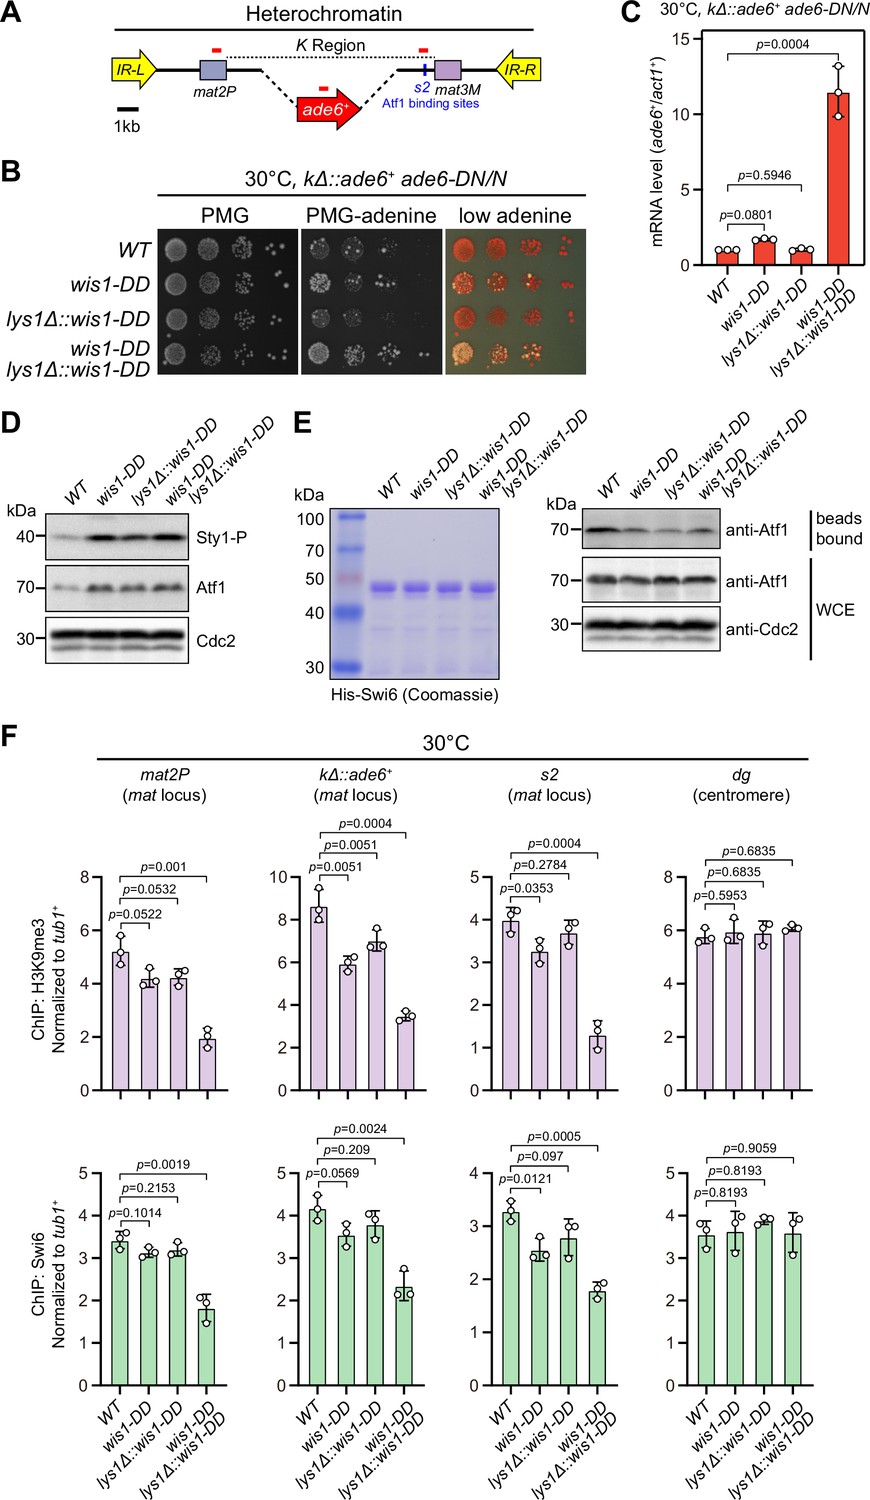
Constitutive activation of mitogen-activated protein kinase (MAPK) signaling pathway leads to Sty1 kinase-dependent defective epigenetic maintenance of heterochromatin at the mating-type region.
(A) Schematic of the mating-type region in kΔ::ade6+ strain. A 7.5 kb DNA sequence (K region) between mat2P and mat3M locus was replaced with ade6+ reporter. Primer positions for RT-qPCR or ChIP analysis are indicated (red bars). (B) Expression of the kΔ::ade6+ reporter monitored by serial dilution spot assay at 25°C as in Figure 1B. Constitutive activation of one of the MAPK signaling pathways was achieved by expressing wis1-DD (wis1-S469D;T473D) mutant at endogenous locus and ectopically at lys1+ (lys1Δ::wis1-DD) simultaneously. Note that plates were incubated at 25°C because sty1Δ mutant is temperature-sensitive. (C) RT-qPCR analyses of the kΔ::ade6+ reporter. (D) Western blotting analyses of the phosphorylated Sty1 (Sty1-P) and the total protein of Atf1. (E) Binding affinity between Atf1 and Swi6HP1 was detected by in vitro pull-down assays as in Figure 4A. Yeast lysates were prepared from wild type or wis1-DD cells grown at 25°C. Results are representative of three independent experiments. (F) ChIP-qPCR analyses of H3K9me3 and Swi6 levels at heterochromatic loci in wild type and wis1-DD cells grown at 25°C. Note that sty1-T97A was inhibited with 5 µM or 10 µM 3-BrB-PP1 when cells were grown in liquid cultures or plates respectively.
-
Figure 5—source data 1
Raw data of RT-qPCR, Swi6/H3K9me3 ChIP.
- https://cdn.elifesciences.org/articles/90525/elife-90525-fig5-data1-v2.xls
-
Figure 5—source data 2
Full raw unedited blots (Sty1-P, Atf1, and Cdc2) for Figure 5D.
- https://cdn.elifesciences.org/articles/90525/elife-90525-fig5-data2-v2.zip
-
Figure 5—source data 3
Uncropped blots for Figure 5D.
- https://cdn.elifesciences.org/articles/90525/elife-90525-fig5-data3-v2.pdf
-
Figure 5—source data 4
Full raw unedited Coomassie gel for Figure 5E.
- https://cdn.elifesciences.org/articles/90525/elife-90525-fig5-data4-v2.zip
-
Figure 5—source data 5
Full raw unedited blot (bead bound-Atf1) for Figure 5E.
- https://cdn.elifesciences.org/articles/90525/elife-90525-fig5-data5-v2.zip
-
Figure 5—source data 6
Full raw unedited blot (WCE-Atf1) for Figure 5E.
- https://cdn.elifesciences.org/articles/90525/elife-90525-fig5-data6-v2.zip
-
Figure 5—source data 7
Full raw unedited blot (WCE-Cdc2) for Figure 5E.
- https://cdn.elifesciences.org/articles/90525/elife-90525-fig5-data7-v2.zip
-
Figure 5—source data 8
Uncropped gel and blots for Figure 5E.
- https://cdn.elifesciences.org/articles/90525/elife-90525-fig5-data8-v2.pdf
Figure 5—figure supplement 1
Constitutive activation of mitogen-activated protein kinase (MAPK) signaling pathway leads to defective epigenetic maintenance of heterochromatin at the mating-type region.
(A) Schematic of the mating-type region in kΔ::ade6+ strain. A 7.5 kb DNA sequence (K region) between mat2P and mat3M locus was replaced with ade6+ reporter. Primer positions for RT-qPCR or ChIP analysis are indicated (red bars). (B) Expression of the kΔ::ade6+ reporter monitored by serial dilution spot assay at 30°C as in Figure 1B. Constitutive activation of one of the MAPK signaling pathways was achieved by expressing wis1-DD (wis1-S469D;T473D) mutant at either endogenous locus or ectopically at lys1+ (lys1Δ::wis1-DD) or simultaneously at both loci. (C) RT-qPCR analyses of the kΔ::ade6+ reporter. (D) Western blotting analyses of the phosphorylated Sty1 (Sty1-P) and the total protein of Atf1. (E) Binding affinity between Atf1 and Swi6HP1 was detected by in vitro pull-down assays as in Figure 4A. Yeast lysates were prepared from wild type or wis1-DD cells grown at 30°C. Results are representative of three independent experiments. (F) ChIP-qPCR analyses of H3K9me3 and Swi6 levels at heterochromatic loci in wild type and wis1-DD cells grown at 30°C.
-
Figure 5—figure supplement 1—source data 1
Raw data of RT-qPCR, Swi6/H3K9me3 ChIP.
- https://cdn.elifesciences.org/articles/90525/elife-90525-fig5-figsupp1-data1-v2.xls
-
Figure 5—figure supplement 1—source data 2
Full raw unedited blot (Sty1-P) for Figure 5—figure supplement 1D.
- https://cdn.elifesciences.org/articles/90525/elife-90525-fig5-figsupp1-data2-v2.zip
-
Figure 5—figure supplement 1—source data 3
Full raw unedited blot (Atf1) for Figure 5—figure supplement 1D.
- https://cdn.elifesciences.org/articles/90525/elife-90525-fig5-figsupp1-data3-v2.zip
-
Figure 5—figure supplement 1—source data 4
Full raw unedited blot (Cdc2) for Figure 5—figure supplement 1D.
- https://cdn.elifesciences.org/articles/90525/elife-90525-fig5-figsupp1-data4-v2.zip
-
Figure 5—figure supplement 1—source data 5
Uncropped blots for Figure 5—figure supplement 1D.
- https://cdn.elifesciences.org/articles/90525/elife-90525-fig5-figsupp1-data5-v2.pdf
-
Figure 5—figure supplement 1—source data 6
Full raw unedited gel (Coomassie) for Figure 5—figure supplement 1E.
- https://cdn.elifesciences.org/articles/90525/elife-90525-fig5-figsupp1-data6-v2.zip
-
Figure 5—figure supplement 1—source data 7
Full raw unedited blot (beads bound-Atf1) for Figure 5—figure supplement 1E.
- https://cdn.elifesciences.org/articles/90525/elife-90525-fig5-figsupp1-data7-v2.zip
-
Figure 5—figure supplement 1—source data 8
Full raw unedited blot (WCE-Atf1 and Cdc2) for Figure 5—figure supplement 1E.
- https://cdn.elifesciences.org/articles/90525/elife-90525-fig5-figsupp1-data8-v2.zip
-
Figure 5—figure supplement 1—source data 9
Uncropped gel and blots for Figure 5—figure supplement 1E.
- https://cdn.elifesciences.org/articles/90525/elife-90525-fig5-figsupp1-data9-v2.pdf
Figure 5—figure supplement 2
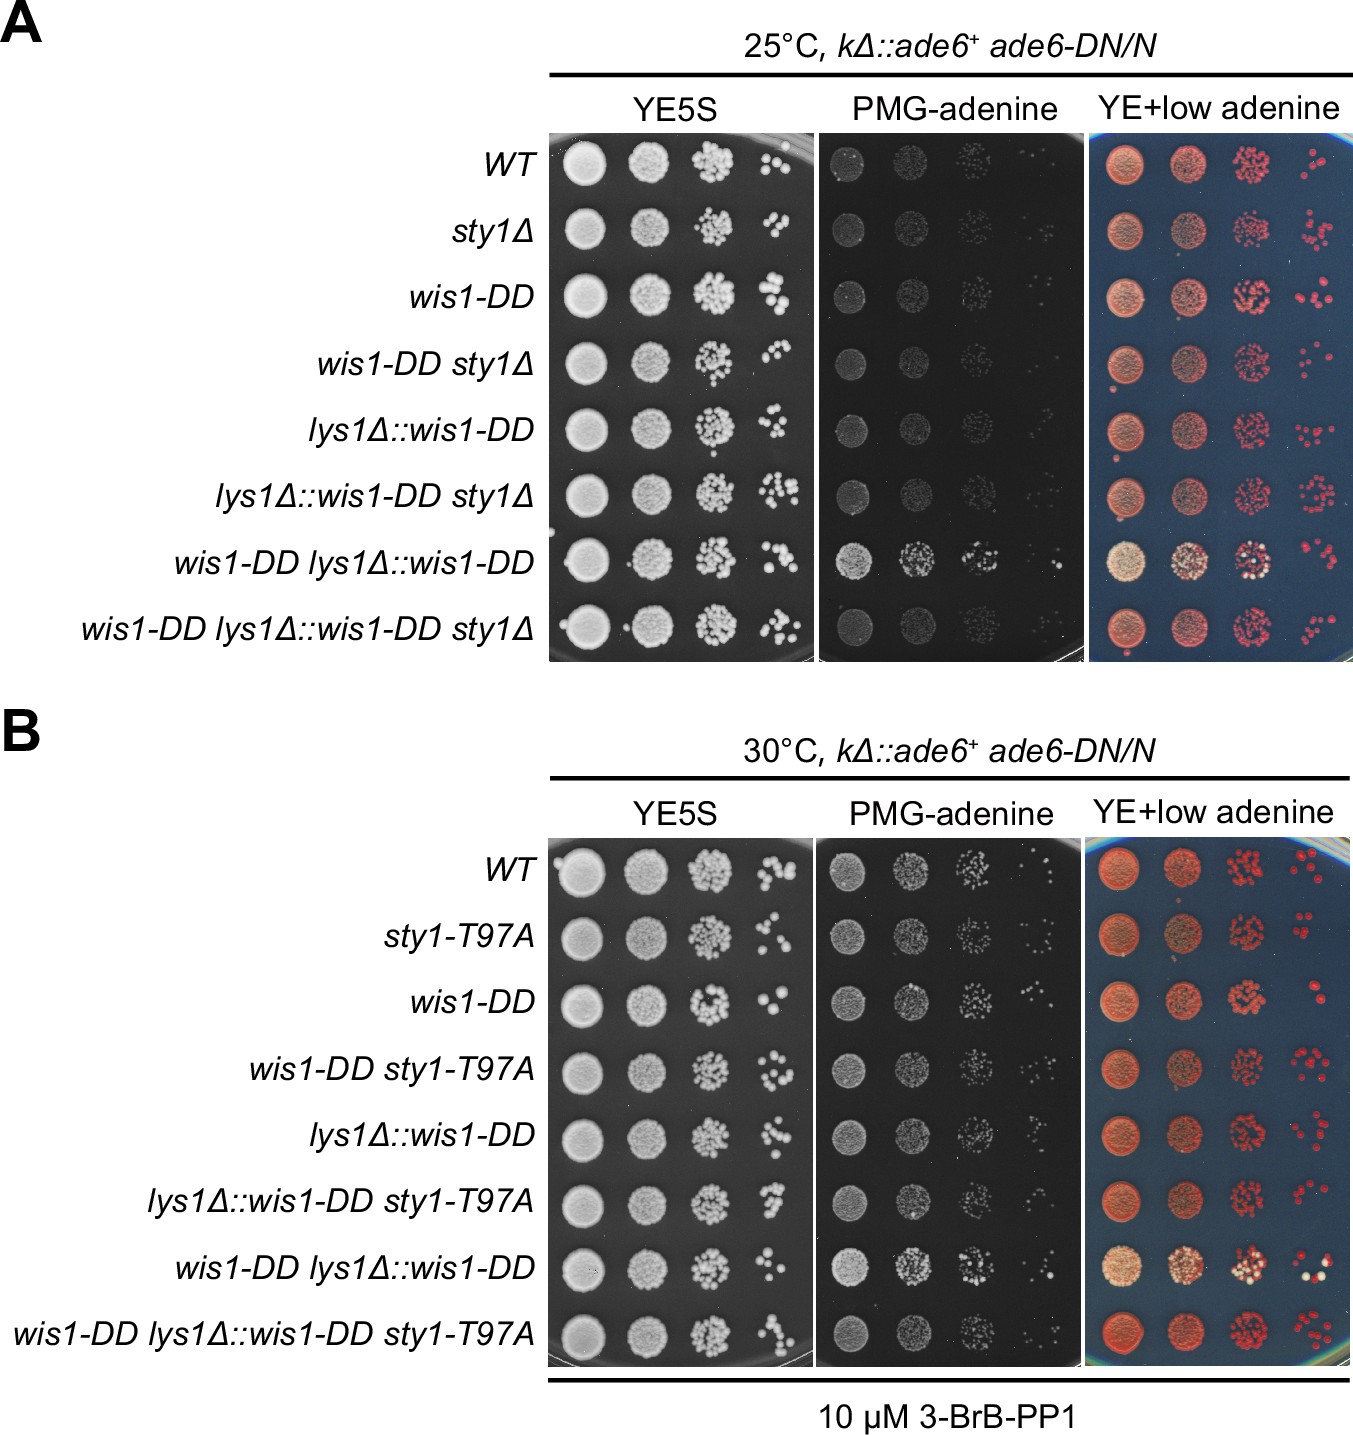
Serial dilution spot assay of expression of the kΔ::ade6+ reporter in wis1-DD sty1Δ and wis1-DD sty1-T97A mutants.
Yeast strains with indicated genotypes were first grown in YE5S at 25°C, then spotted onto plates. Plates were incubated at 25°C for wis1-DD sty1Δ mutants due to temperature sensitivity of sty1Δ (A) or 30°C for wis1-DD sty1-T97A mutants (B). sty1-T97A was inhibited with 10 µM 3-BrB-PP1 added in plates.
Figure 6 with 3 supplements
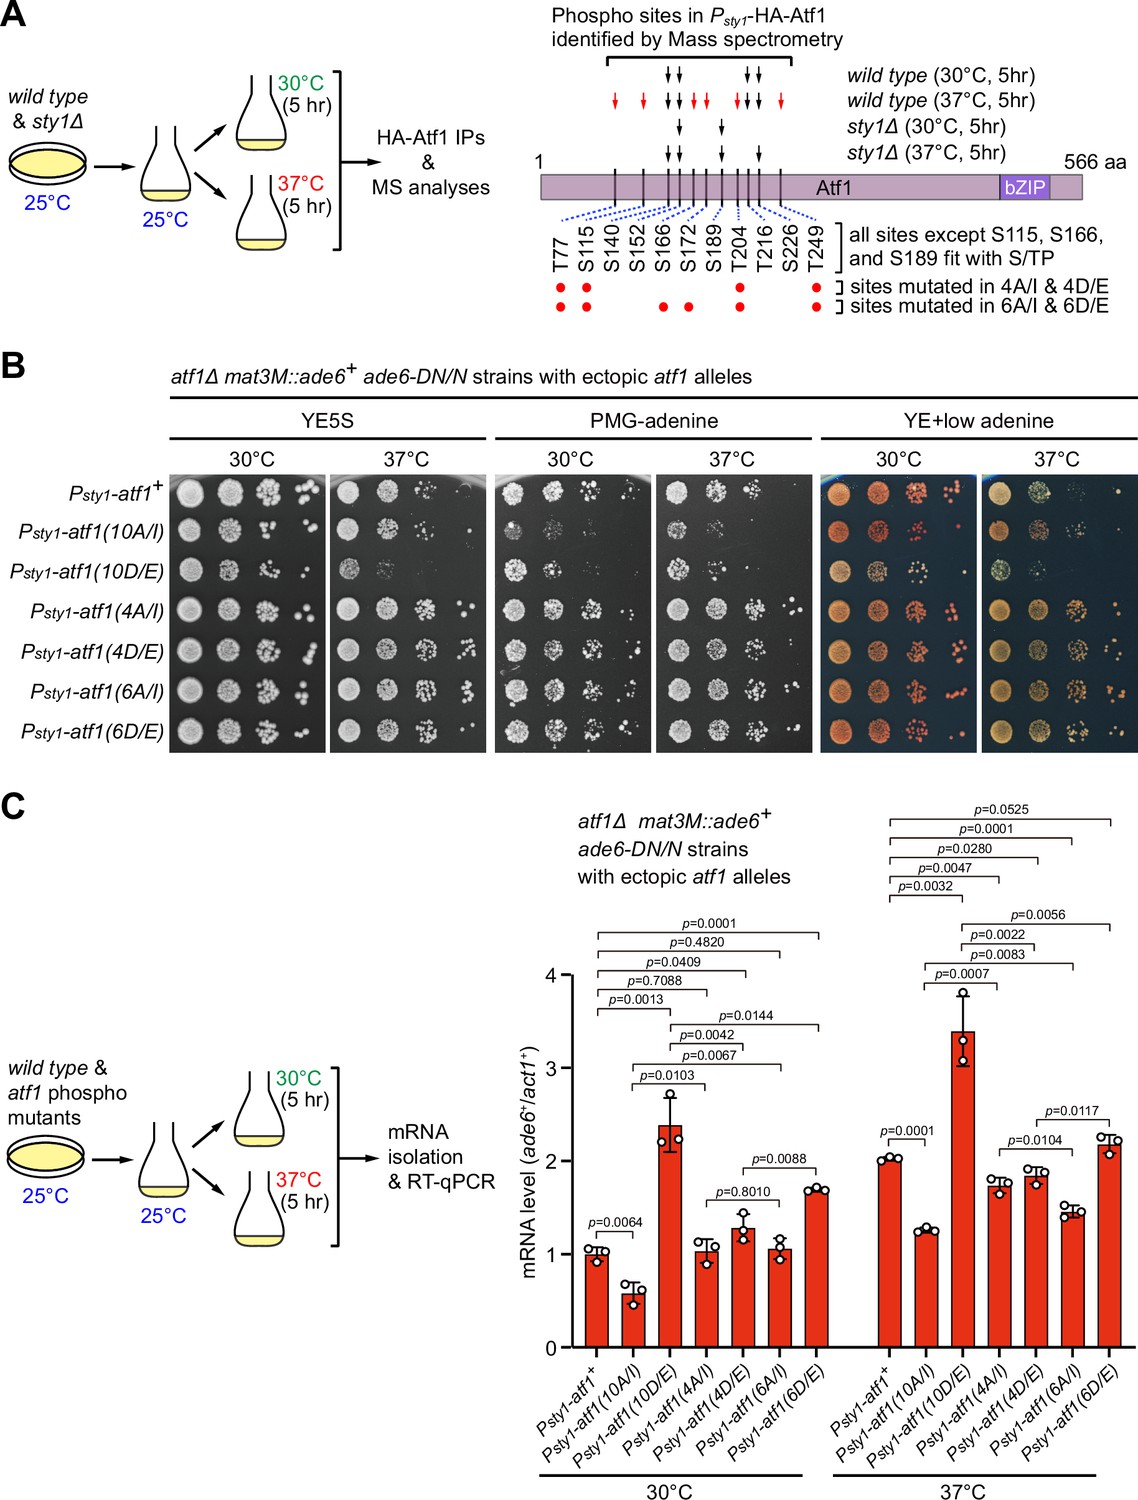
Identification of major Sty1-dependent phosphorylation sites in Atf1 upon heat stress.
(A) (Left) Schematic depicting the experimental flow of the purification of HA-Atf1 for mass spectrometry (MS) identification of phosphorylation sites. (Right) Summary of MS-identified Atf1 phosphorylation sites in vivo in Psty1-HA-atf1 cells. Arrows indicate detected phosphorylated residues and red arrows denote sites specifically enriched in wild type cells grown at 37°C. (B) Expression of the mat3M::ade6+ reporter monitored by serial dilution spot assay in atf1Δ cells expressing Atf1 phospho mutants under Psty1 promoter. (C) RT-qPCR analyses of the mat3M::ade6+ reporter in atf1Δ cells expressing Atf1 phospho mutants under Psty1 promoter. (Left) Schematic depicting the experimental flow of culturing and mRNA extraction.
-
Figure 6—source data 1
Raw data of RT-qPCR.
- https://cdn.elifesciences.org/articles/90525/elife-90525-fig6-data1-v2.xls
Figure 6—figure supplement 1
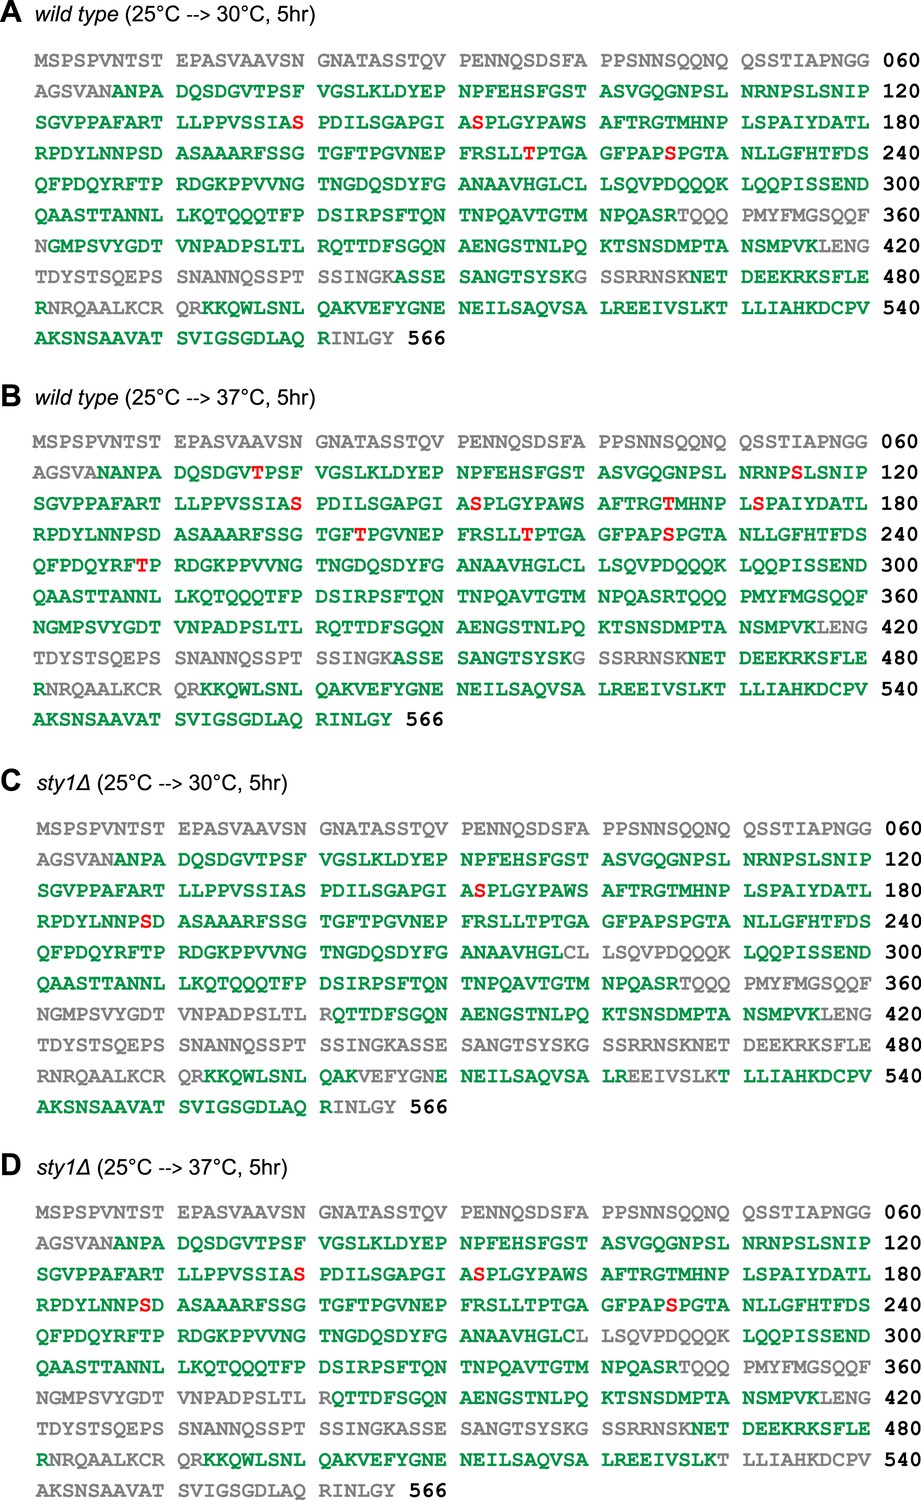
Identification of Atf1 residues phosphorylated by Sty1 in vivo.
HA-Atf1 was purified by immunoprecipitation from wild type or sty1Δ cells grown at 30°C or 37°C for 5 hr, followed by SDS-PAGE and mass spectrometry. (A–D) Atf1 sequences retrieved from four purifications in indicated strains cultured at different temperatures with peptide sequence coverage (green), phosphorylated serine or threonine (red). Sequences not covered after mass spectrometry analysis are in gray.
Figure 6—figure supplement 2
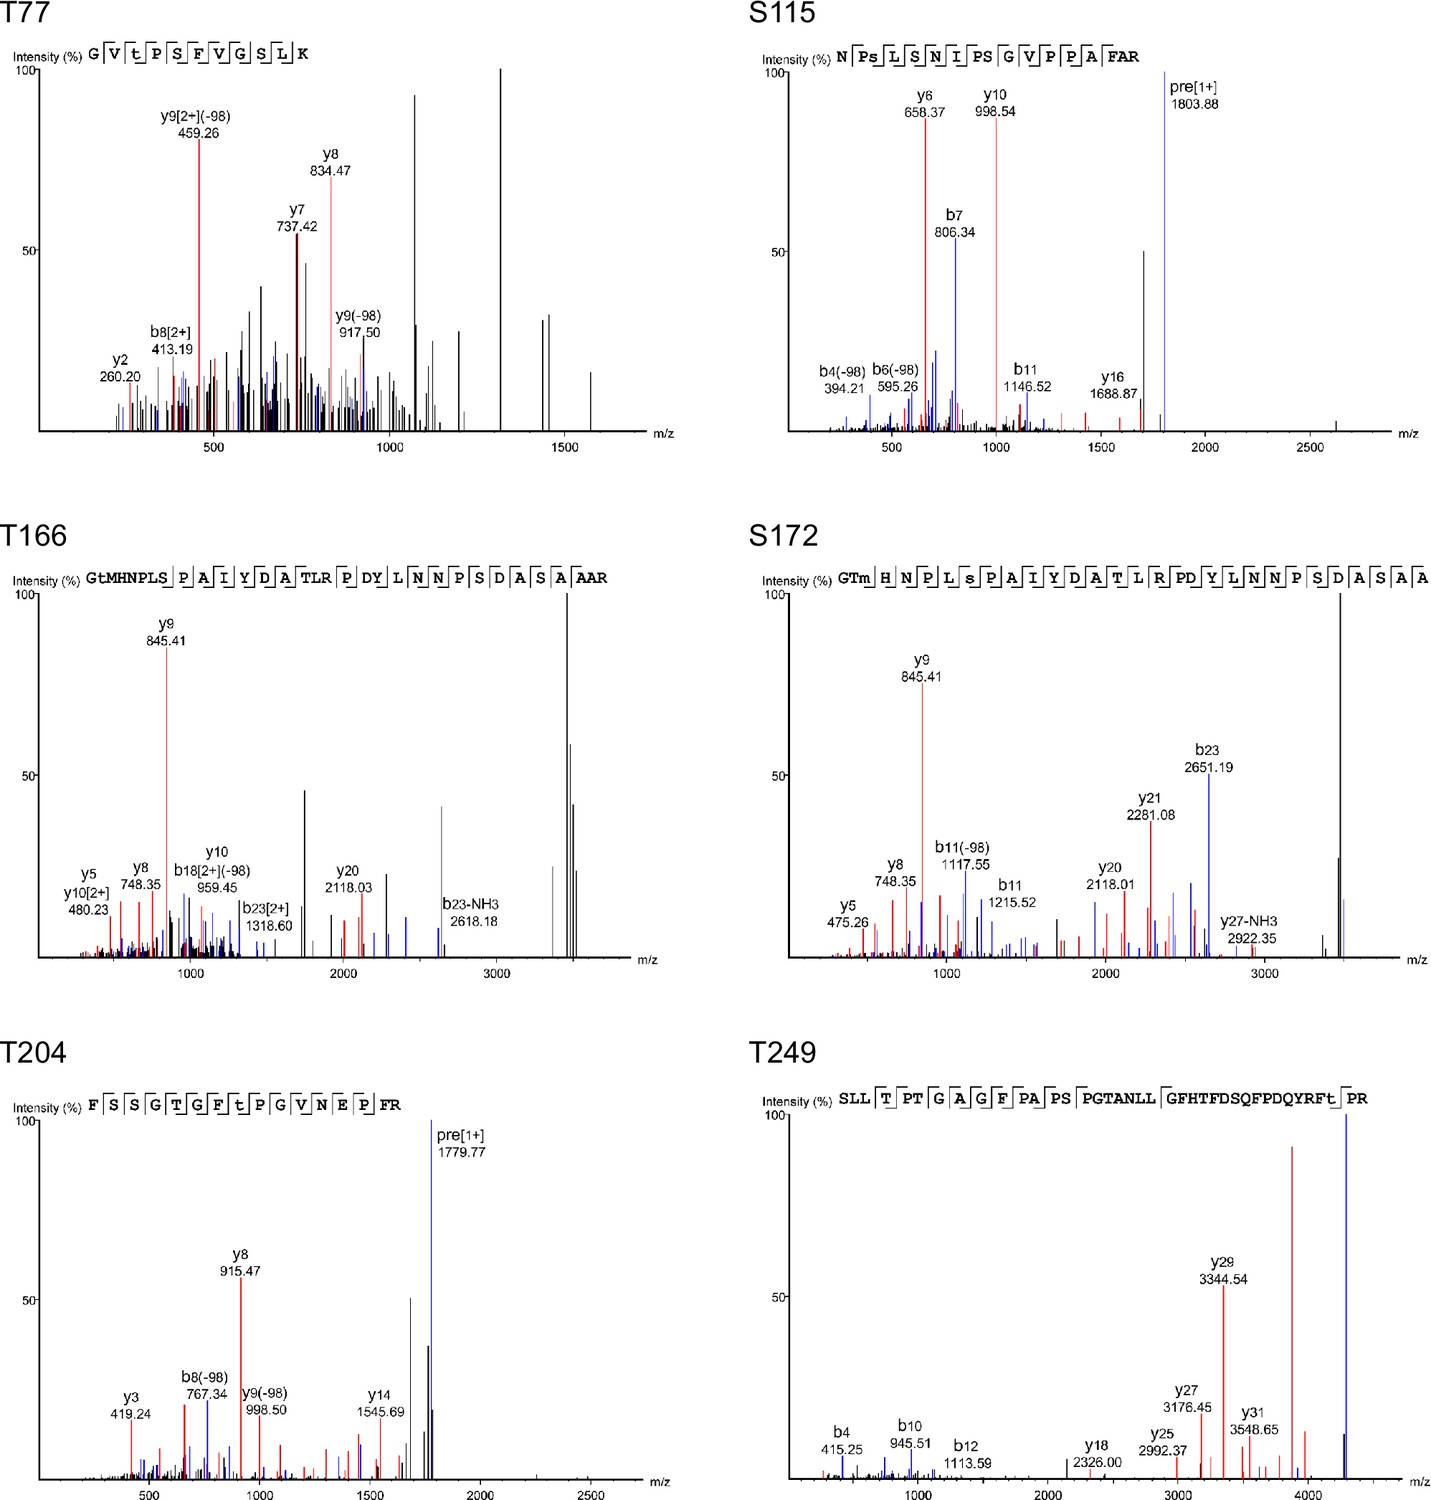
Mass spectrometry (MS) spectra from mass spectrometric analyses of Atf1.
Examples of spectra for six Atf1 phosphorylation sites (T77, S115, S166, S172, T204, and T249) identified from HA-Atf1 purified from wild type cells grown at 37°C for 5 hr.
Figure 6—figure supplement 3
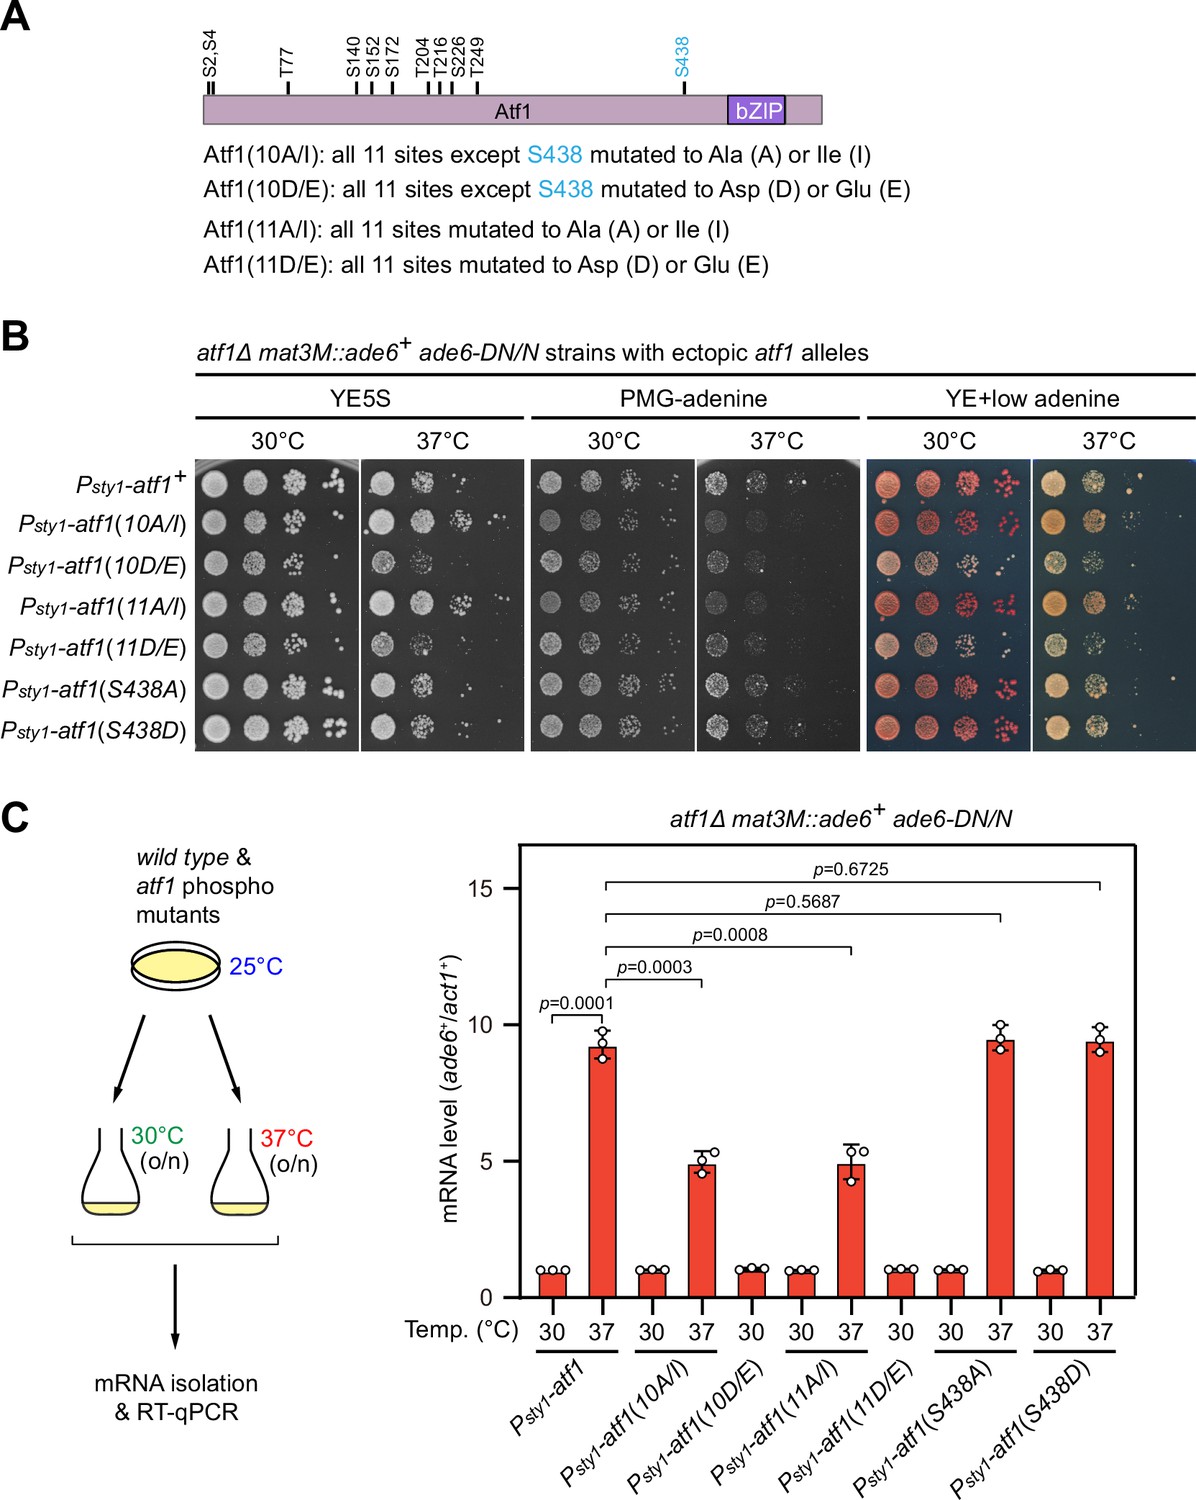
Phosphorylation of Ser438 in Atf1 is not involved in heat stress-induced defective heterochromatic maintenance at the mating-type region.
(A) Schematic depiction of the Atf1 protein with 11 putative mitogen-activated protein kinase (MAPK) phosphorylation sites (S/TP) indicated. (B) Expression of the mat3M::ade6+ reporter in indicated strains monitored by serial dilution spot assay at 30°C and 37°C. The media used were nonselective YE5S, selective PMG without adenine, and YE with low concentration of adenine. Serines and threonines were mutated to alanines or isoleucines (A/I) as non-phosphorylatable residues, or aspartic acids or glutamic acids (D/E) as phosphomimetic ones. (C) RT-qPCR analyses of mat3M::ade6+ reporter. The relative ade6+ mRNA level was quantified with a ratio between mat3M::ade6+ and act1+ in Psty1-HA-atf1(WT) 30°C samples being set as 1.00. Error bars indicate mean ± standard deviation of three independent experiments. Two-tailed unpaired t-test was used to derive p-values.
-
Figure 6—figure supplement 3—source data 1
Raw data of RT-qPCR.
- https://cdn.elifesciences.org/articles/90525/elife-90525-fig6-figsupp3-data1-v2.xls
Figure 7
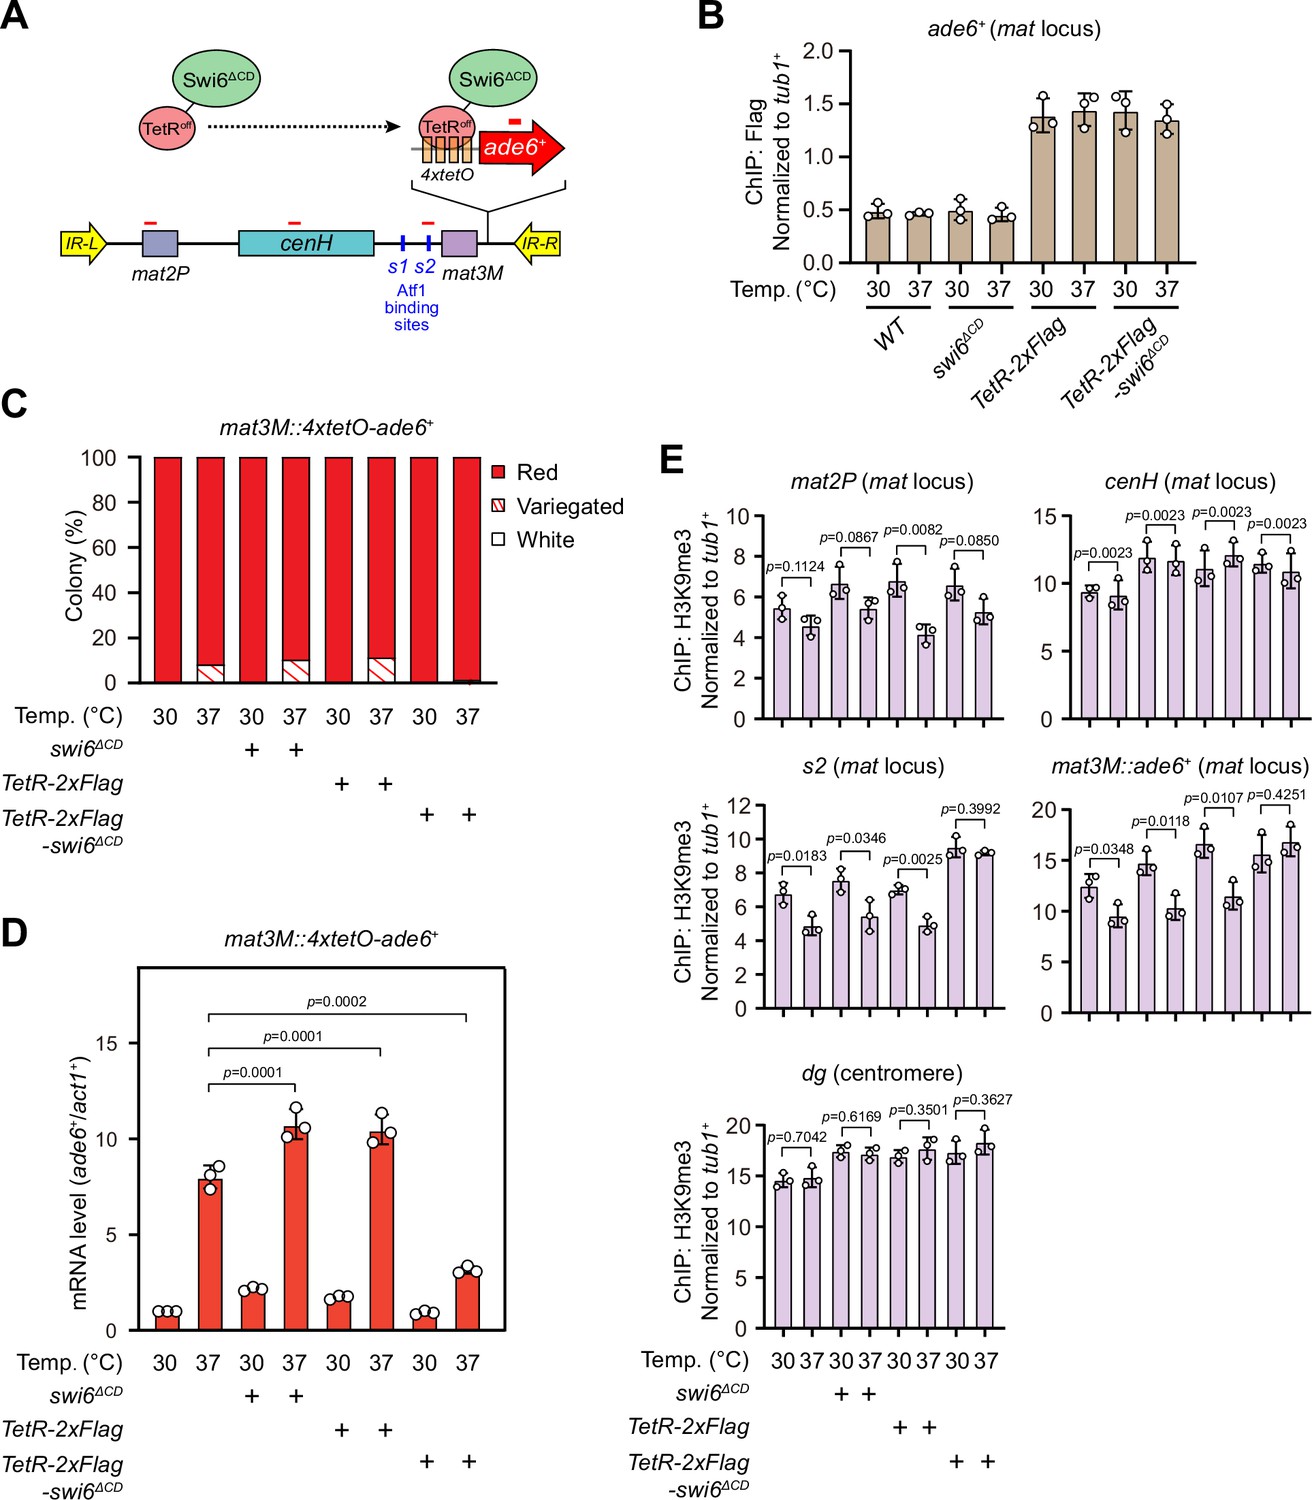
Tethering Swi6 HP1 to the mat3M-flanking site rescues heat stress-induced defective epigenetic maintenance of heterochromatin at the mat locus.
(A) Schematic of tethering Swi6HP1 to the mat locus. A sequence containing four tetracycline operators located upstream of ade6+ reporter gene (4xtetO-ade6+) was inserted next to mat3M locus, and Swi6 lacking CD domain was fused with TetRoff (TetRoff-Swi6ΔCD) and a 2xFlag tag. Primer positions for RT-qPCR or chromatin immunoprecipitation (ChIP) analysis are indicated (red bars). (B) ChIP-qPCR analyses of Flag-tagged TetRoff-Swi6ΔCD at 4xtetO-ade6+locus. Relative enrichment of TetRoff-Swi6ΔCD was normalized to that of a tub1+ fragment. Error bars represent standard deviation of three experiments. (C) Expression of the mat3M::4xtetO-ade6+ reporter monitored by colony color assay. n>500 colonies counted for each sample. (D) RT-qPCR analyses of the mat3M::4xtetO-ade6+ reporter. (E) ChIP-qPCR analyses of H3K9me3 levels at heterochromatic loci in Swi6HP1-tethered cells.
-
Figure 7—source data 1
Raw data of colony color assay, RT-qPCR, TetR-Flag/H3K9me3 ChIP.
- https://cdn.elifesciences.org/articles/90525/elife-90525-fig7-data1-v2.xlsx
Figure 8
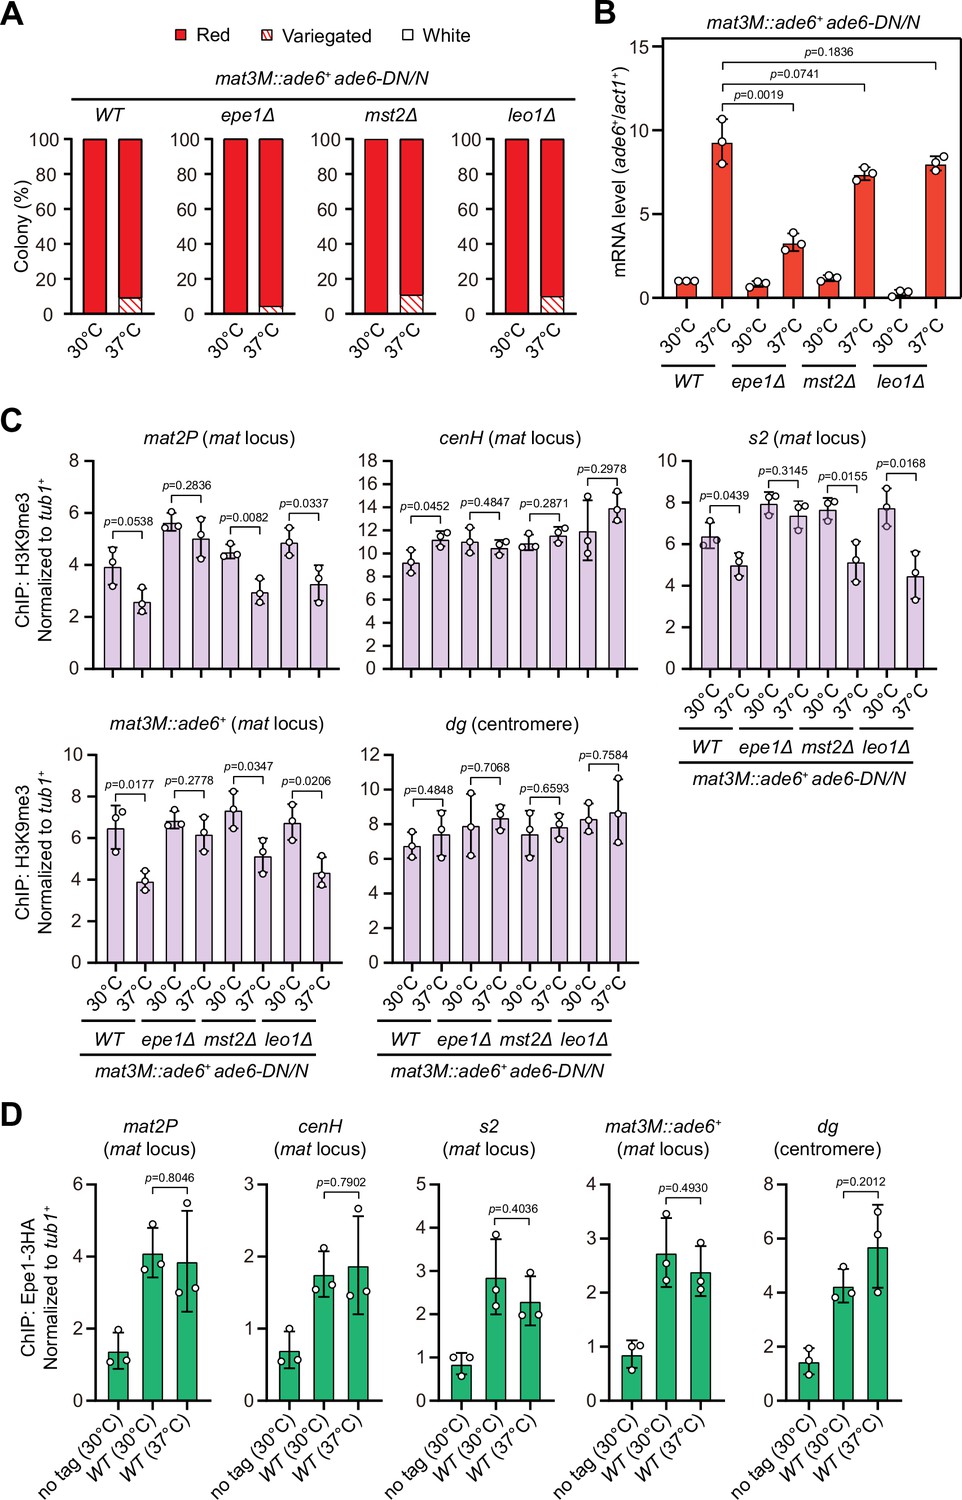
Deletion of anti-silencing factor Epe1 rescues heat stress-induced defective epigenetic maintenance of heterochromatin at mating-type region.
(A) Expression of the mat3M::ade6+ reporter monitored by colony color assay in epe1Δ, mst2Δ, or leo1Δ cells. n>500 colonies counted for each sample. (B) RT-qPCR analyses of the mat3M::ade6+ reporter in epe1Δ, mst2Δ, or leo1Δ cells. (C) ChIP-qPCR analyses of H3K9me3 levels at heterochromatic loci in epe1Δ, mst2Δ, or leo1Δ cells. (D) ChIP-qPCR analyses of Epe1 levels at heterochromatic loci in wild type cells grown at 30°C or 37°C. Relative enrichment of Epe1-3HA was normalized to that of a tub1+ fragment. Error bars represent standard deviation of three experiments. Two-tailed unpaired t-test was used to derive p-values.
-
Figure 8—source data 1
Raw data of colony color assay, RT-qPCR, H3K9me3/Epe1-3HA ChIP.
- https://cdn.elifesciences.org/articles/90525/elife-90525-fig8-data1-v2.xls
Figure 9
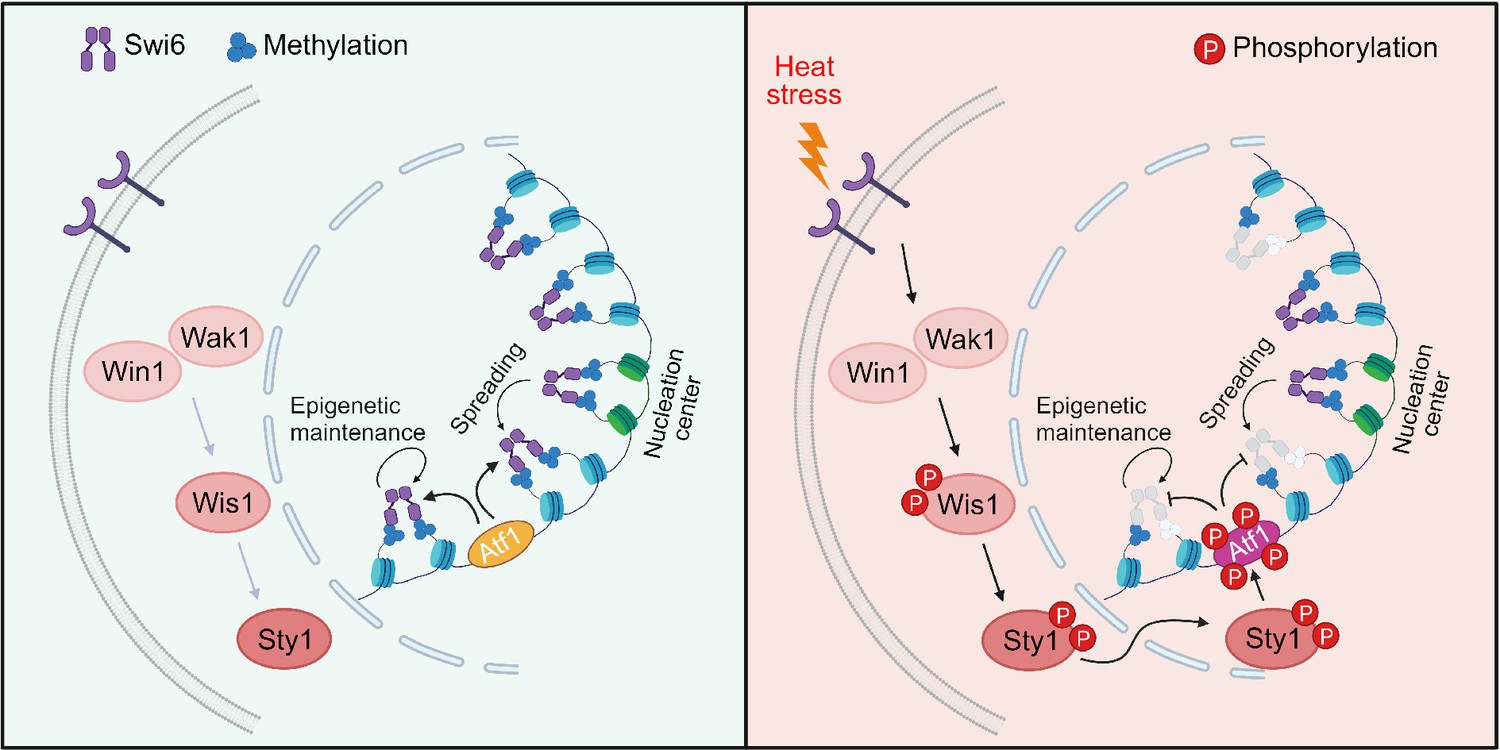
Proposed model for how heat-induced and mitogen-activated protein kinase (MAPK)-dependent Atf1 phosphorylation provokes epigenetic changes at the mat locus in fission yeast.
Atf1 plays a dominating role in heterochromatin spreading and integrity maintenance at mat locus at normal temperature, but MAPK-mediated Atf1 phosphorylation compromises its binding affinity to Swi6HP1, therefore attenuates heterochromatin stability under heat stress.
Additional files
-
Supplementary file 1
Yeast strains and primers for qPCR used in this study.
(a) Yeast strains used in this study. (b) Primers used for RT-qPCR and qPCR.
- https://cdn.elifesciences.org/articles/90525/elife-90525-supp1-v2.doc
-
MDAR checklist
- https://cdn.elifesciences.org/articles/90525/elife-90525-mdarchecklist1-v2.pdf
Download links
A two-part list of links to download the article, or parts of the article, in various formats.
Downloads (link to download the article as PDF)
Open citations (links to open the citations from this article in various online reference manager services)
Cite this article (links to download the citations from this article in formats compatible with various reference manager tools)
Heat stress-induced activation of MAPK pathway attenuates Atf1-dependent epigenetic inheritance of heterochromatin in fission yeast
eLife 13:e90525.
https://doi.org/10.7554/eLife.90525


