The positioning mechanics of microtubule asters in Drosophila embryo explants
- Instituto Gulbenkian de Ciência, Fundação Calouste Gulbenkian, Portugal
- Mechanobiology Institute and Department of Biological Sciences, National University of Singapore, Singapore
- Institute of Molecular and Cellular Biology, A*Star, Proteos, Singapore
- Centre for Mechanochemical Cell Biology, Warwick Medical School, University of Warwick, United Kingdom
Figures
Figure 1 with 1 supplement
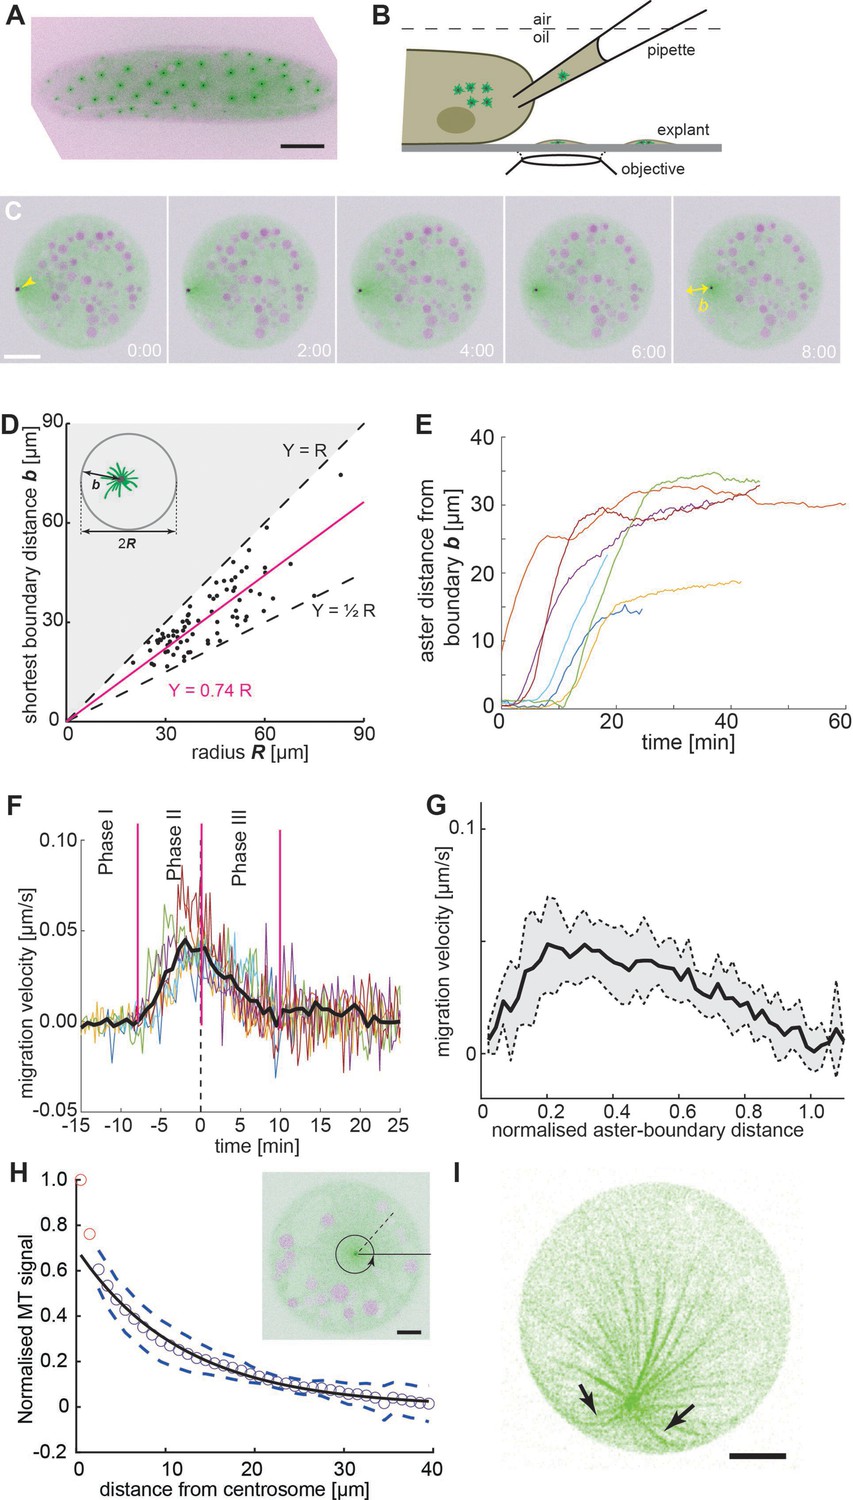
Embryo explant assay enables the kinematic study of individual asters.
(A) Maximum intensity Z-projection of a gnu mutant embryo expressing RFP::β-Tubulin (green) and Spd2::GFP (black dots). Scale bar, 50 µm. (B) Schematic of cytosol extraction from a gnu mutant Drosophila embryo and ex vivo explant formation (de-Carvalho et al., 2018). (C) Maximum intensity Z-projections of a single aster (arrowhead) moving away from the boundary of an explant produced from gnu mutant embryos expressing RFP::β-Tubulin (green) and Spd2::GFP (black dot). Yolk spheres are visible in magenta due to their auto-fluorescence. In the last frame, the shortest distance b from the explant boundary is marked with a yellow double arrow. Scale bar, 20 µm. (D) Scatter plot of shortest distance b to explant boundary as a function of the radius R in explants containing one aster (n = 54). The magenta line represents a linear regression. Black dashed lines represent half and full radius distance (the geometric constraint in the system). (E) Trajectories of aster distance to the explant boundary from independent experiments. (F) Migration velocity as a function of time, where t = 0 is defined as the time when the aster lies midway between the explant edge and the final position of the aster. Solid line represents average over all measurements (n = 7). (G) Average migration velocity of single asters away from the explant boundary (n = 7). Distance normalized by the final, steady-state distance for each aster. (H) Normalized intensity of astral microtubules as schematically outlines in the inset. The black line is a mono-exponential fit to the data excluding the first two data points (red), representing the centrosome, and the dashed lines mark ±1 standard deviation (SD). The decay length is 11.8 ± 0.5 µm (mean ± standard error of the mean [SEM]), and the intensity drops to background level at ~40 µm. Inset: Single Z-plane image of an explant from a gnu mutant embryo expressing RFP::β-Tubulin (green) and Spd2::GFP (black dot), containing a single aster. The dashed black line and the circular arrow represent the radial maximum intensity projection of the microtubule signal from the centrosome toward the periphery aiming at measuring aster size. Scale bar, 10 µm. (I) Maximum intensity Z-projection of a 3D image stack of a small explant containing one aster that exemplifies microtubule buckling and splay near the explant boundary (arrows). Scale bar, 5 µm.
Figure 1—figure supplement 1

Average microtubule signal intensity (black line, inferred from RFP::β-Tubulin signal) along the shortest distance from the centrosome to explant boundary, normalized by the maximum intensity within each experiment.
Gray traces are individual experiments (n = 7). The closest explant boundary is on the left of the x-axis. The graphs show the signal when the aster is 5 µm (top) or 20 µm (bottom) away the boundary.
Figure 2
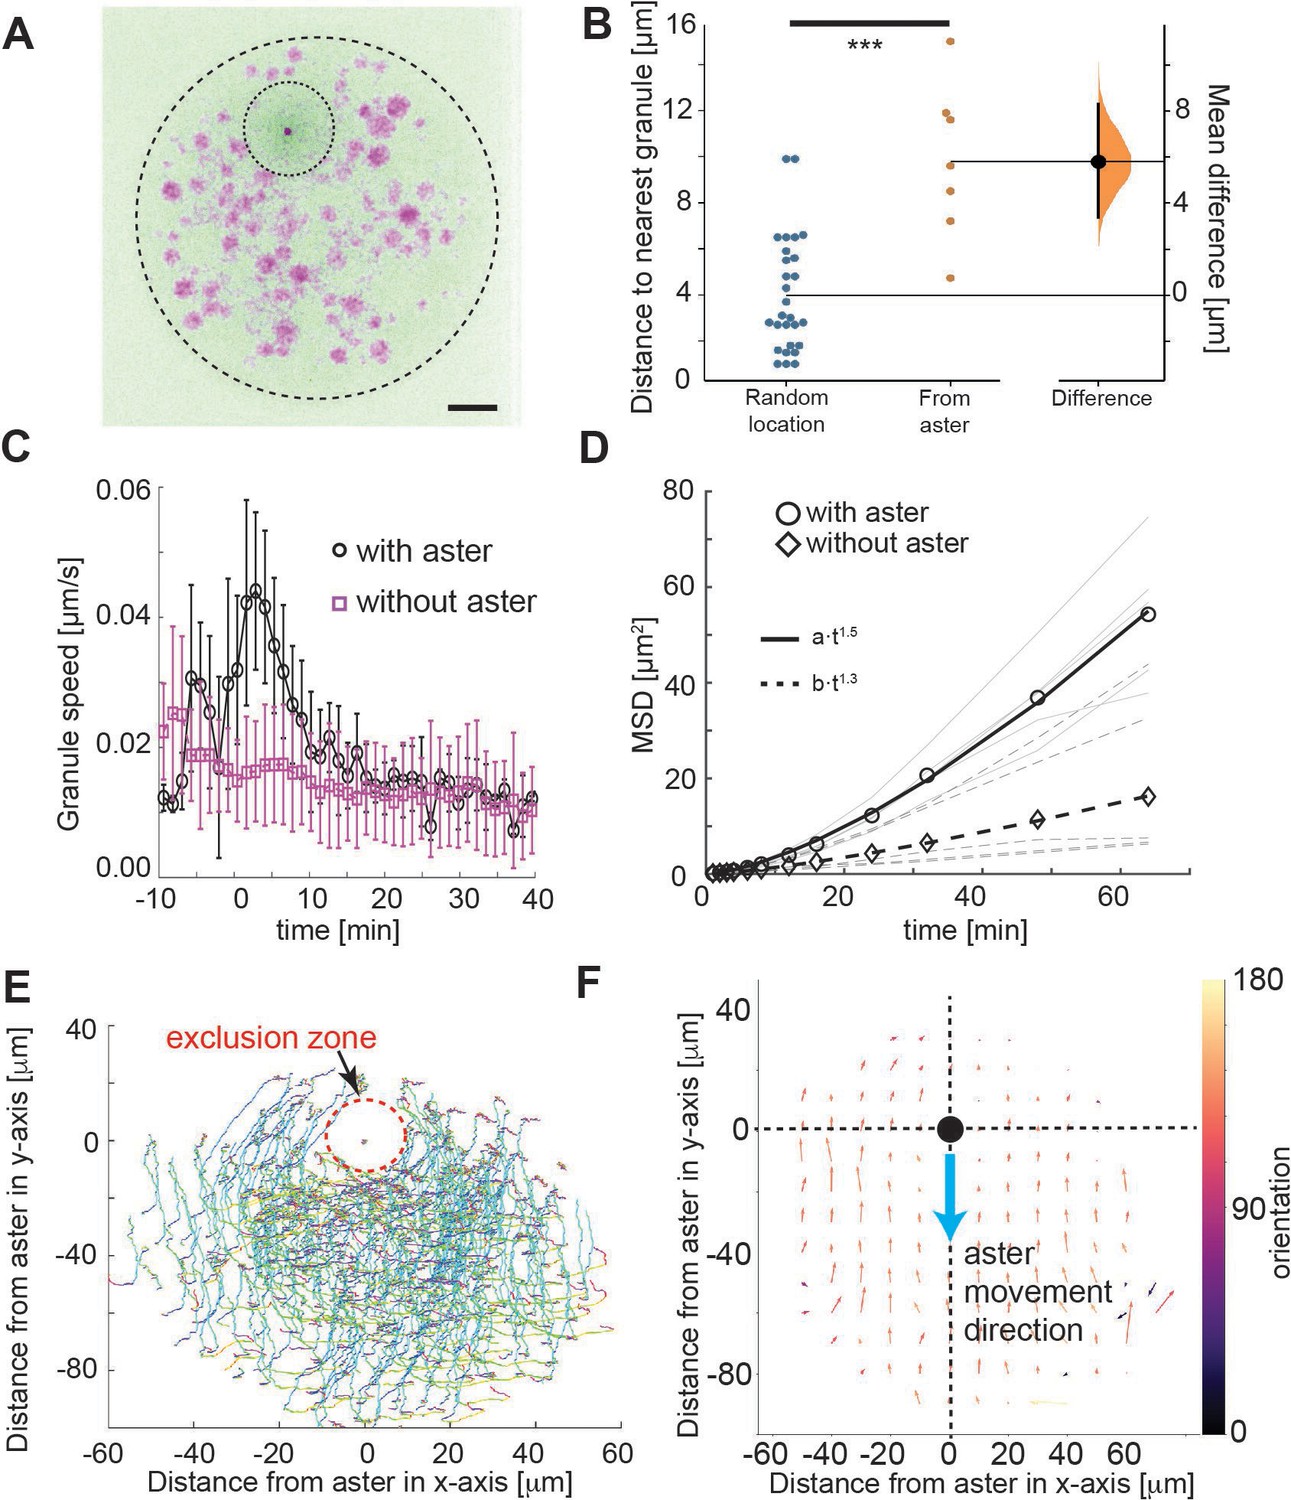
Tracking of yolk granules suggests particle displacement by repulsion.
(A) Maximum intensity Z-projections of a single aster in an explant produced from a gnu mutant embryo expressing RFP::β-Tubulin (green) and Spd2::GFP (dark dot). Yolk spheres are visible in magenta due to auto-fluorescence. The dashed circle represents the explant boundary, the dotted circle highlights the droplet exclusion zone where the aster is located (B) Measured minimum distance between aster center (orange) or randomly generated location (blue) and nearest yolk granules when the aster was 15 μm from the boundary (Methods). ***p < 10−3 Mann–Witney test (n = 7 explants). Scale bar 10 μm (C) Measured yolk granule speed in the droplets with (black) and without (magenta) an aster present (n = 8 experiments, >100 granules tracked). Error bars denote standard deviation (SD). (D) Mean-squared displacement (MSD) plot of lipid droplets in the explants. Average droplet movement analyzed with (circles, solid line) and without (diamonds, dashed line) an aster present (corresponding gray and dashed gray lines show individual experiments). The continuous and the dashed line represent fits to respective models as described in the legend. (E, F) Velocity profile of granules relative to the coordinate system (origin) defined by the aster position, orientated such that the aster moves in the negative y-direction. (E) Shows individual granule tracks, color coded by time (light green start through to red at end). (F) Averaged granule movement over seven experiments, with the direction of aster movement highlighted by blue arrow. Granule movement orientation is color coded, and the length of arrows represents speed.
Figure 3 with 1 supplement
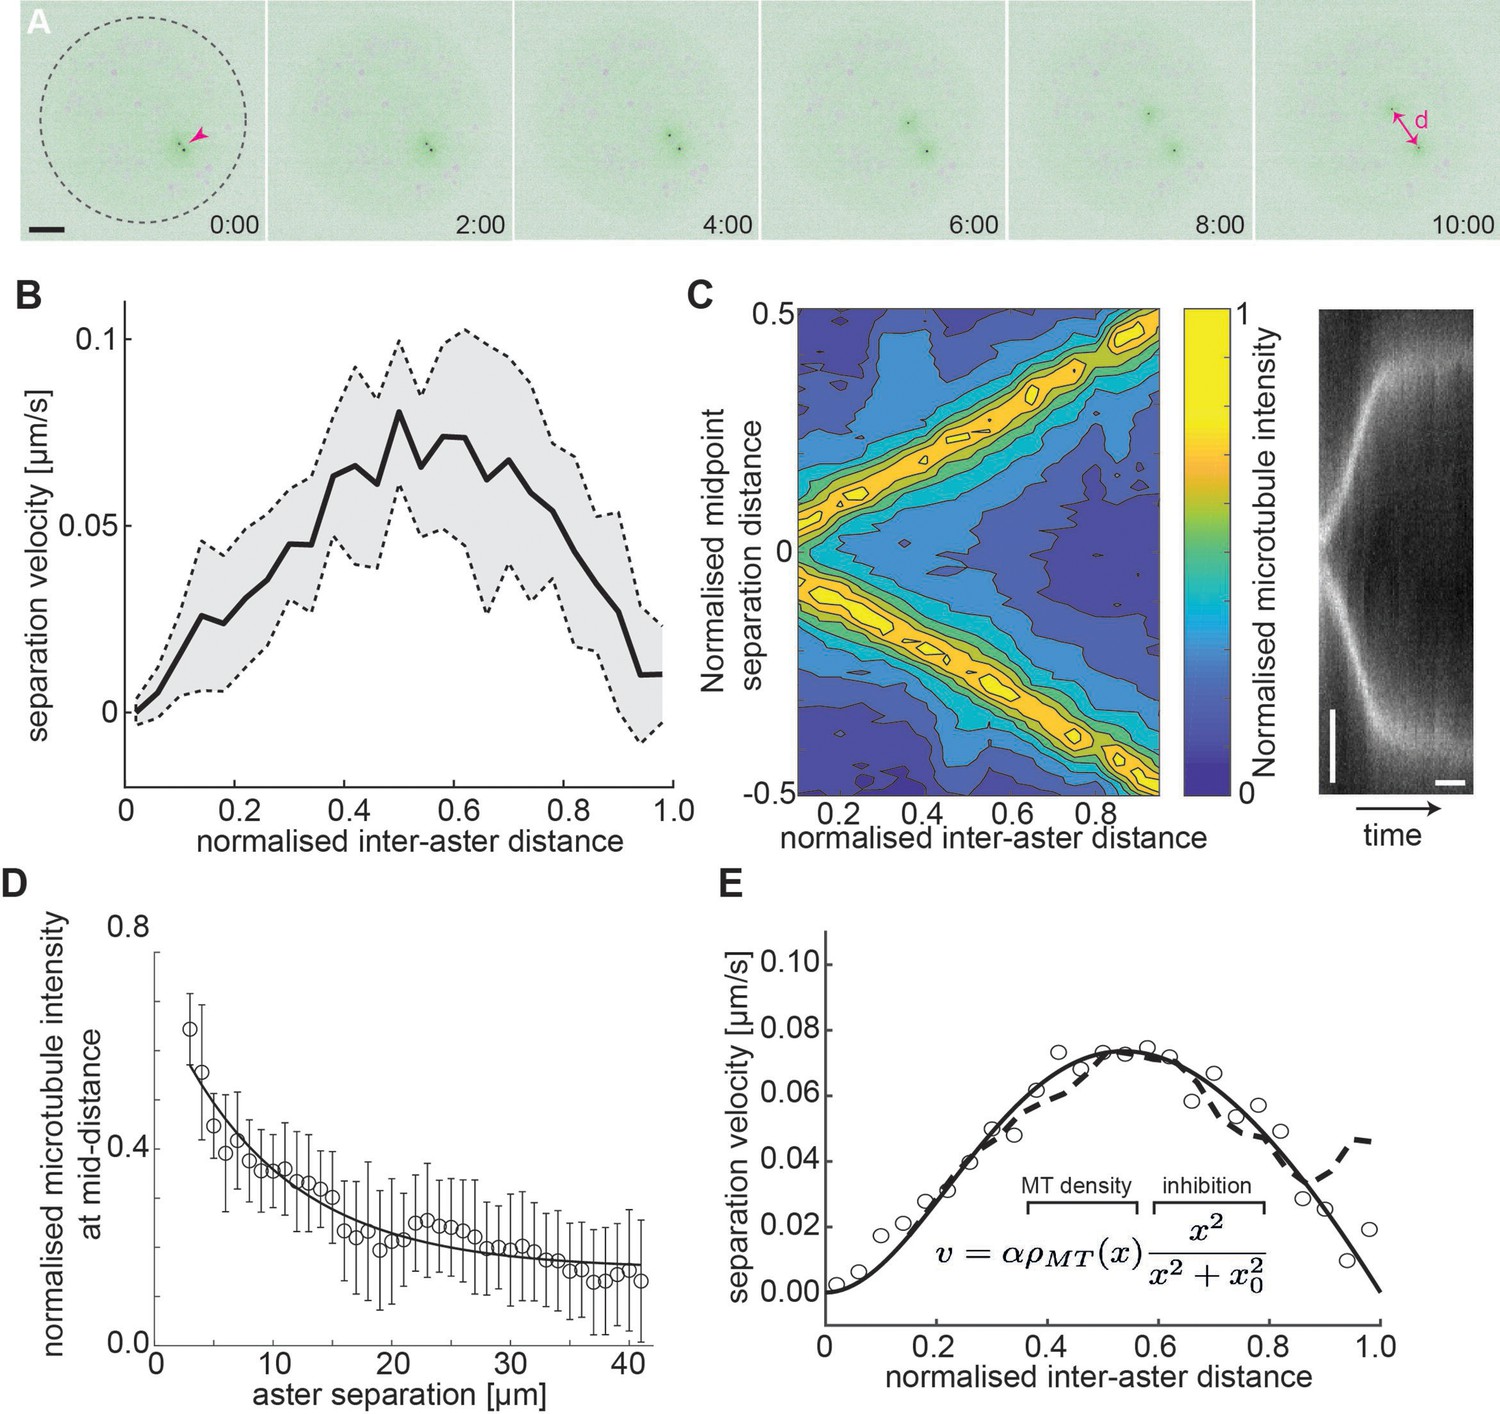
Aster–aster separation in explants depends on microtubule distribution and interactions.
(A) Maximum intensity Z-projections of two asters (arrowhead) separating in an explant produced from gnu mutant embryos expressing RFP::β-Tubulin (green) and Spd2::GFP (black dots). Yolk spheres are visible in magenta due to auto-fluorescence. In the last frame, the separation distance d is marked by a double arrow. The dashed circle represents the explant boundary. Scale bar, 20 µm. (B) Aster separation velocity as a function of normalized separation distance (n = 9). For each experiment, distance is normalized by the final, steady-state separation distance. (C) Left: Colormap of normalized microtubule density between two separating asters. Right: Kymograph of microtubule intensity between the asters during separation. Scale bars, 2 min (horizontal) 5 µm (vertical). (D) Normalized microtubule intensity at the midpoint perpendicular axis between asters in function of aster separation distance. Open markers denote average values and error bars the standard deviation. Solid line represents the fitting to exponential decay (n = 7). (E) Fitting to average separation velocity (circles) considering microtubule intensity and a short-range inhibition term (inefficient repulsion). Microtubule density was either fitted beforehand (solid line in D) or directly included (dashed line).
Figure 3—figure supplement 1
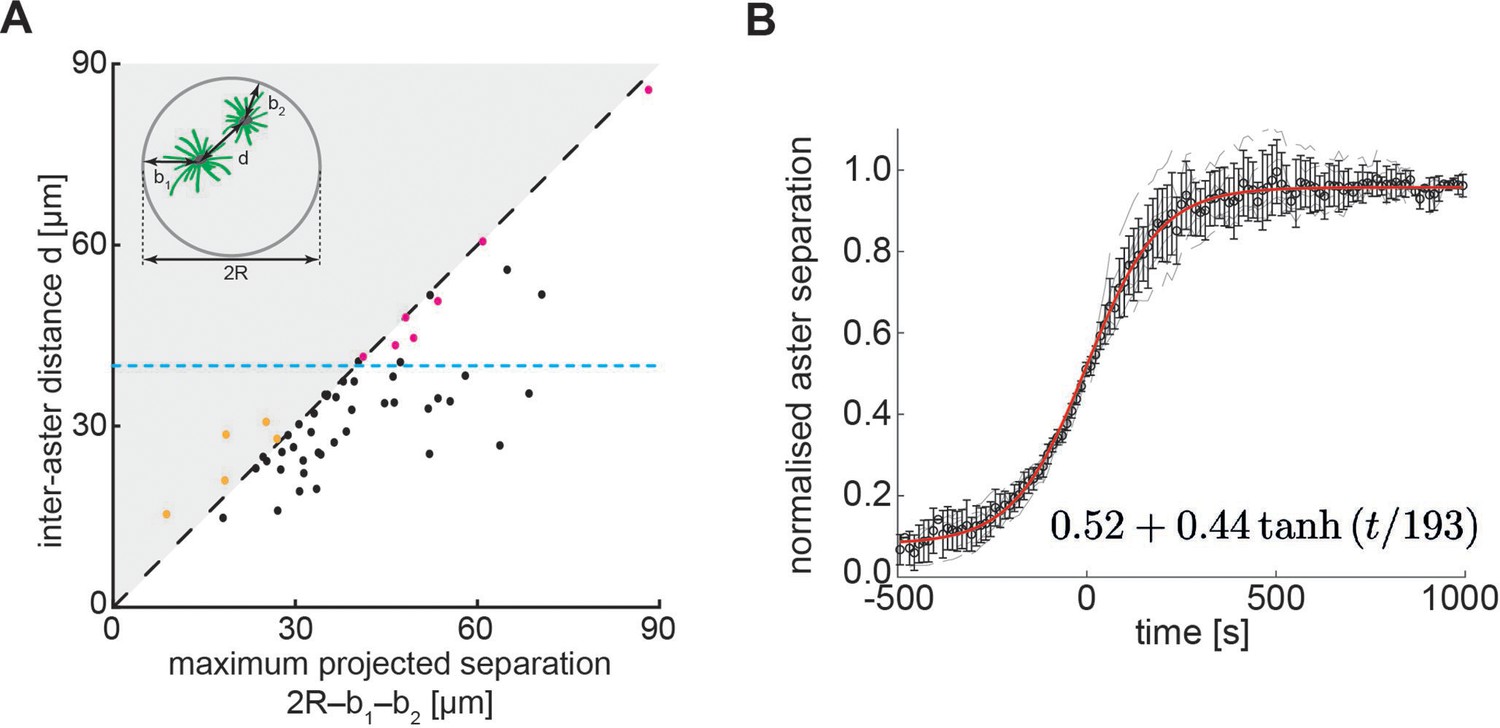
Inter-aster steady state distance and separation dynamics.
(A) Scatter plot of inter-aster distance (d, see inset) as a function of the maximum projected separation, calculated from the explant diameter (2R) and the boundary distance of each of the two asters, and (n = 54). The blue dashed line represents the estimated upper limit of the interaction distance between two asters (~45 µm). Red dots represent cases where the two asters were likely positioned far apart during explant generation. The yellow dots are cases of small explants where projection of the 3D volume leads to overestimation of and/or . (B) Separation distance between two asters, where distance is normalized to 1 at furthest separation in the movie. Time 0 defined by when the separation between the two asters has reached half the maximum extent (n = 9 explants). Error bars denote standard deviation (SD). Red line is fit to given equation in text, fitted using Matlab fit function.
Figure 4
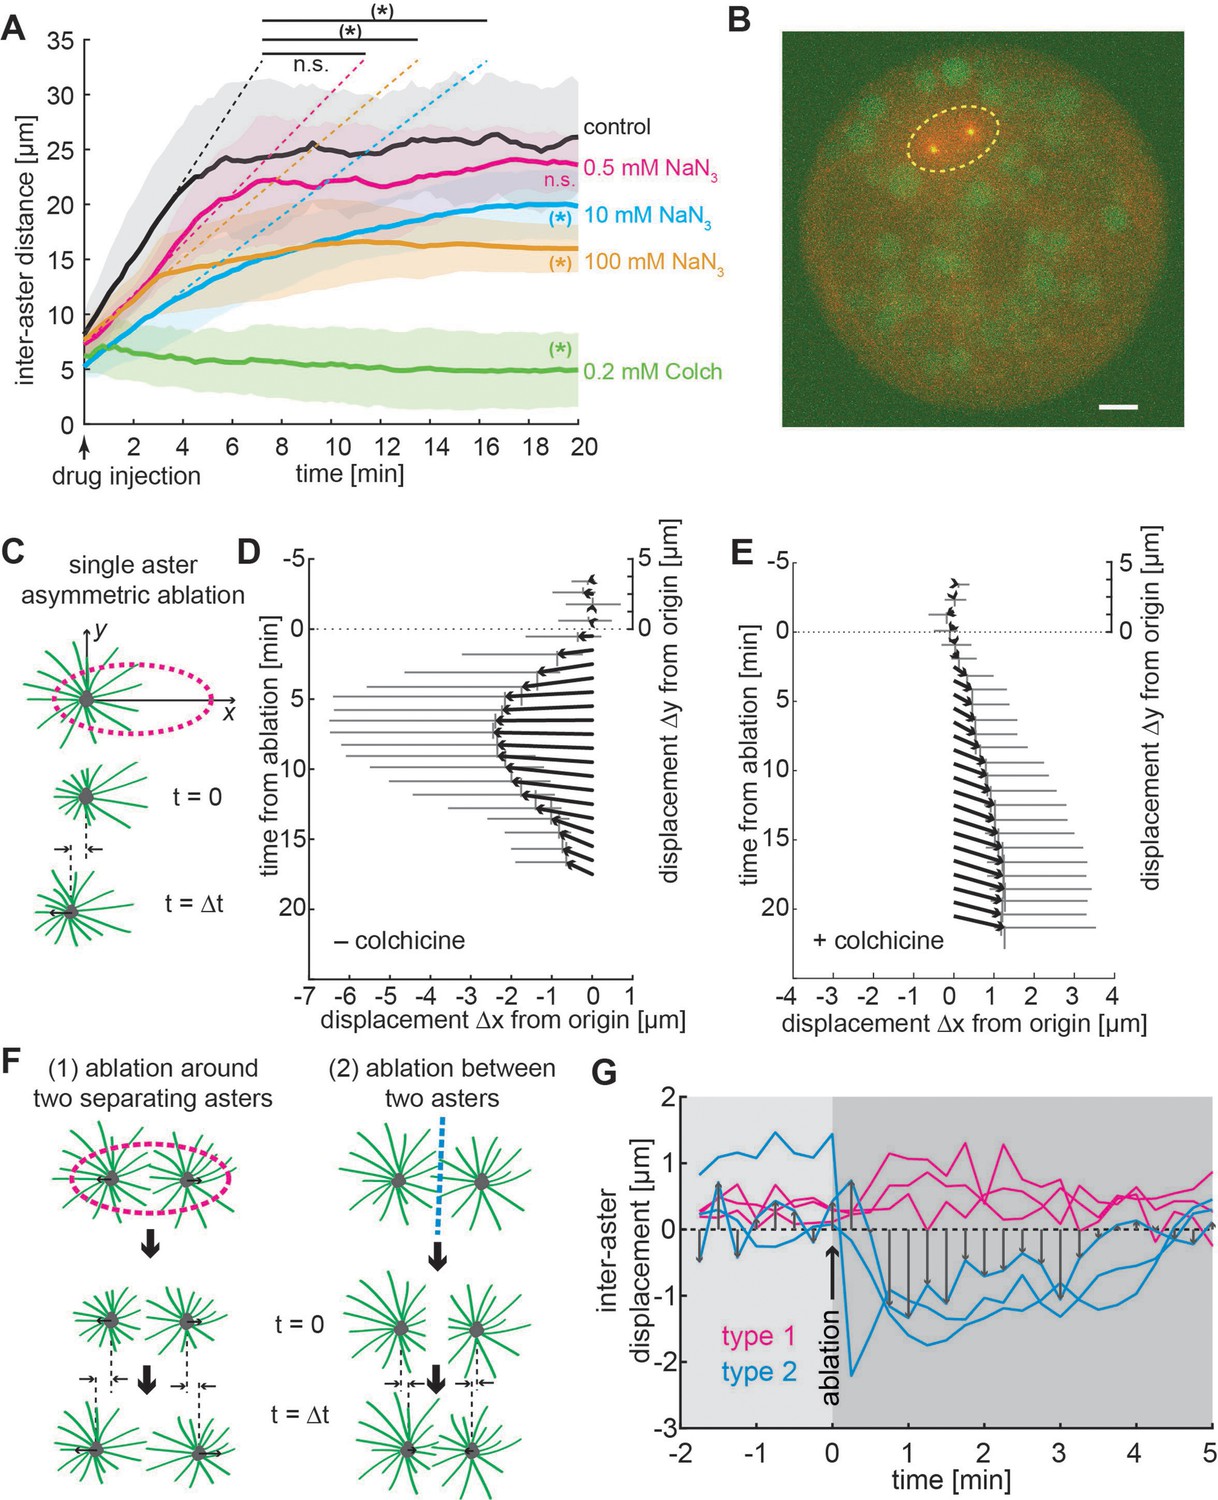
Aster positioning and separation is determined by a dominant microtubule-dependent pushing force.
(A) Aster separation dynamics upon injection of buffer (control, n = 3), 0.5 mM (n = 3), 10 mM (n = 4 ), 100 mM (n = 3) sodium azide, or 0.2 mM (n = 3) colchicine. The * symbol denotes significance at p < 0.05. Gray or colored areas around average curves denote ±1 standard deviation (SD). (B) Sample image of an explant containing a pair of separating asters during UV laser ablation (dashed ellipse) provoking an instantaneous change of aster geometry. Scale bar 10 μm. (C) Schematic of single aster eccentric circular UV laser ablation (magenta dashed line); this ablation aims at shortening astral microtubules on the left side of the aster. t = 0 min denotes ablation time. Aster displacement before and after eccentric circular ablation in explants unperturbed (D), n = 8 or treated with colchicine (E), n = 8. Arrows represent average displacement magnitude and direction, and vertical and horizontal gray bars denote ±1 SD of displacement in x and y, respectively. (F) Explants containing two asters were perturbed by (1) ellipse ablation around both asters during separation (peripheral ablation); (2) linear ablation between two asters (central ablation). (G) Change of inter-aster distance (displacement) upon laser ablation (time = 0) as described in (F). Upon peripheral ablation, separating asters maintained or slightly accelerated their separation movement, while central ablation caused movement inversion and asters approaching each other.
Figure 5
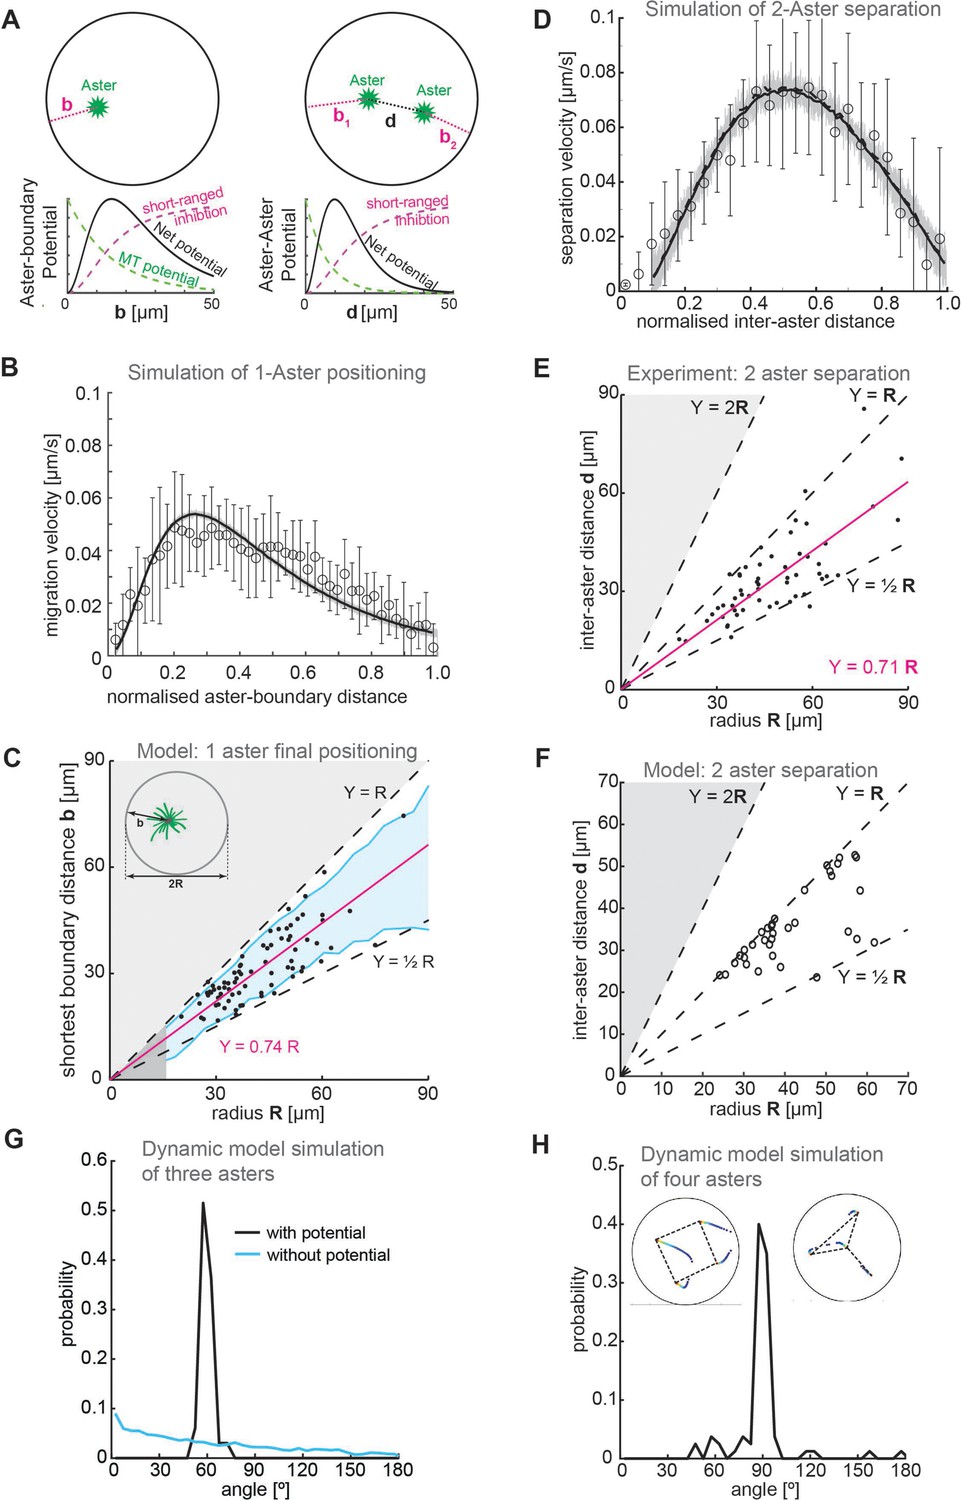
Model.
(A) Schematic of a 2D model of aster dynamics. Bottom graphs represent cartoons of the potentials between aster–boundary and aster–aster. (B) Fit of 2D model to the single aster velocity profile shown in Figure 1E. The average model fit (black curve) is calculated from 10 simulation runs (gray lines). Error bars are experimental error (n = 7). (C) 1D stochastic model of single aster dynamics (red line = mean, blue shaded region ±1 standard deviation [SD]), compared to experimentally observed distribution of aster position (black dots, Figure 1D). (D) As in (B) but for the two-aster scenario. (E) Scattered plot of inter-aster distance (d) as a function of the radius (R) of explants containing two asters (n = 54). Most measured data points fall between the dashed lines denoting the explant radius () and half of the radius (). The magenta line represents the linear regression. (F) 1D stochastic model of two-aster dynamics where black circles denote final aster positions from simulation. (G) Angle distribution from aster positions in a dynamic model simulation with three asters. The simulation evolved from initially random positions, and asters robustly moved toward a triangular configuration. The peak at 60° represents equal distances between the three asters. In the absence of a repulsion potential the regularity is lost (blue line). (H) Angle distribution from aster positions in a dynamic model simulation with four asters. The two insets show the temporal evolution of position and the final configuration marked with dashed lines. The majority of simulations (17/20) resulted in a regular square (top left inset) with 3/20 resulting in a ‘Y’ configuration (top right inset).
Videos
Video 1
Maximum intensity Z-projection from a 3D time-lapse movie of explants generated from gnu mutant embryos expressing RFP::β-Tubulin (magenta) and Spd2::GFP (green).
The left explant contains a single aster moving away from the explant boundary, the right explant contains two separating asters. The jiggling spheres are yolk droplets. Time in min:s, scale bar 10 µm. Frame rate is 4 frames/min.
Video 2
Maximum intensity Z-projection from a 3D time-lapse movie of explants generated from a gnu mutant embryo expressing RFP::β-Tubulin (magenta) and Spd2::GFP (green), containing two separating asters, after pulse injection of solutions: control with buffer (left), 10 mM sodium azide (middle), and 0.2 mM of colchicine (right).
Time in min:s, scale bar 10 µm. Frame rate is 4 frames/min.
Video 3
Maximum intensity Z-projection from a 3D time-lapse movie of explants generated from a gnu mutant embryo expressing RFP::β-Tubulin (magenta) and Spd2::GFP (green) containing a single aster.
The aster was allowed to equilibrate followed by an asymmetric elliptic ablation (yellow line at times 00:15 to 01:00) performed in control explants (no injection) and in explants supplemented with 0.2 mM of colchicine. Time in min:s, scale bar 10 µm. Frame rate is 4 frames/min.
Video 4
Maximum intensity Z-projection from a 3D time-lapse movie of an explant containing two separating asters from a gnu mutant embryo expressing RFP::β-Tubulin (magenta) and Spd2::GFP (green).
The elliptic ablation (yellow line from 00:15 to 00:45) was performed when asters were ~7 µm apart. Time in min:s, scale bar 10 µm. Frame rate is 4 frames/min.
Tables
Key resources table
| Reagent type (species) or resource | Designation | Source or reference | Identifiers | Additional information |
|---|---|---|---|---|
| Genetic reagent Drosophila melanogaster | w*; pUbq>RFP::β2-Tubulin; + | Gift from Yoshihiro Inoue (Inoue et al., 2004) | ||
| Genetic reagent D. melanogaster | w1118; pUbq>Spd2::GFP; + | Gift from M. Bettencourt-Dias (Nabais et al., 2021) | ||
| Genetic reagent D. melanogaster | gnu305 | Bloomington Drosophila Stock Center | Stock no. 3321 (discontinued), Bloomington | w*; +; gnu305/TM3 |
| Genetic reagent D. melanogaster | gnu3770A | Bloomington Drosophila Stock Center | Stock no. 38440 (discontinued), Bloomington | w*; +; gnuZ3-3770A/TM3 |
| Genetic reagent D. melanogaster | w1118; CyO/Sco; MKRS/TM6B | Bloomington Drosophila Stock Center | Stock no. 3703, Bloomington | |
| Genetic reagent D. melanogaster | w*; pUbq >Spd2::GFP, pUbq >RFP::β2-Tubulin; gnu305/gnuZ3-3770A | This study | See Materials and methods | |
| Chemical compound, drug | Halocarbon oil | Voltalef Oil 10 S, Arkema Inc | ||
| Chemical compound, drug | Colchicine | Sigma-Aldrich | CAS 64-86-8, product no. C9754 | ≥95% (HPLC), powder |
| Chemical compound, drug | NaN3 | Sigma-Aldrich | CAS 26628-22-8, product no. 71290 | Sodium Azide purum 99% |
| Software, algorithm | TrackmateJ | Schindelin et al., 2012; Tinevez et al., 2017 | ||
| Software, algorithm | Matlab | MathWorks Inc | RRID:SCR_001622 |
Additional files
Download links
A two-part list of links to download the article, or parts of the article, in various formats.
Downloads (link to download the article as PDF)
Open citations (links to open the citations from this article in various online reference manager services)
Cite this article (links to download the citations from this article in formats compatible with various reference manager tools)
The positioning mechanics of microtubule asters in Drosophila embryo explants
eLife 12:RP90541.
https://doi.org/10.7554/eLife.90541.3


