Combining array tomography with electron tomography provides insights into leakiness of the blood-brain barrier in mouse cortex
- Institute of Neuronal Cell Biology, Technical University Munich, Germany
- German Center for Neurodegenerative Diseases (DZNE), Germany
- Experimental Center, Faculty of Medicine Carl Gustav Carus, Technische Universität Dresden, Germany
- Institute for Stroke and Dementia Research (ISD), LMU University Hospital, LMU Munich, Germany
- Department of Neurosurgery, University of Munich Medical Center, Germany
- Department of Psychiatry and Psychotherapy, University Medicine Greifswald, Germany
- Laboratoire de Bioimagerie et Pathologies, Université de Strasbourg, France
- Munich Cluster of Systems Neurology (SyNergy), Germany
- Normandie University, UNICAEN, INSERM UMR-S U1237, Physiopathology and Imaging of 19 Neurological Disorders (PhIND), GIP Cyceron, Institute Blood and Brain, France
Figures
Figure 1
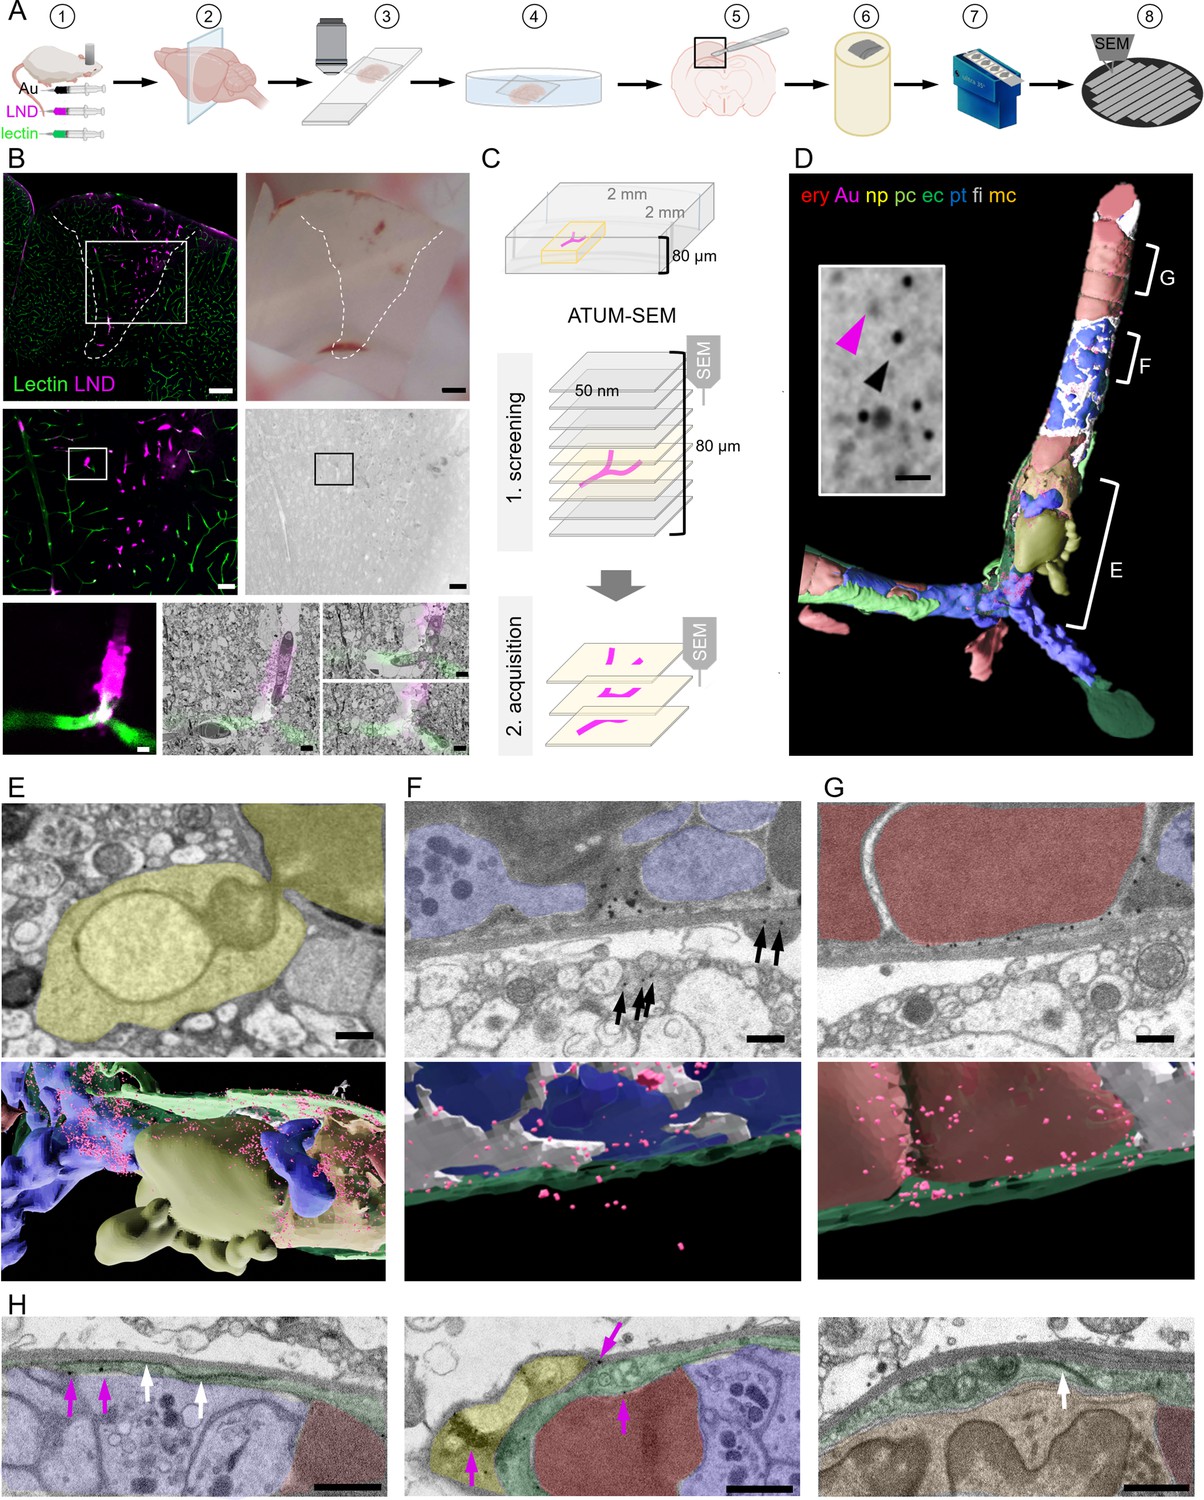
Correlative confocal microscopy and automated tape-collecting ultramicrotomy (ATUM)-scanning electron microscopy (SEM) reveal hallmarks of vascular occlusions and extravasation.
(A) Schematic drawing of the ATUM-SEM correlative light and electron microscopy (CLEM) workflow. Controlled cortical impact (middle) is followed by systemic injection of 30 nm diameter lipid nanodroplets (LNDs) (magenta) and 30 nm diameter colloidal gold nanoparticles (black). DyLight 649 lectin (green) was injected 5 min before perfusion (1). After fixation, coronal vibratome sections are generated (2) and positioned onto glass slides with only laying the cover slip on top of the section for confocal imaging (3). The vibratome section is recovered by immersion into the petri dish (4). The previously imaged region of interest is dissected (5) and processed for EM including embedding into resin and contrast enhancement (6). Serial ultramicrotomy and tape collection (7) is followed by wafer mounting and SEM imaging (8). (B) Top: Sum projection of a confocal tile scan (lectin, green; LNDs, magenta; left) and corresponding binocular image (right) of the dissected vibratome section. The lesion area is indicated by a dashed line. Scale bars 200 µm. Middle: Lesion area identified in the overview tile scan (box in top image) is relocated in the sum projection confocal image and in the serial section low resolution SEM (right). Scale bars 50 µm. The region of interest (ROI, box) is chosen in the confocal image and re-located in the sum projection SEM image. Bottom: Region of interest confocal image (left) and three single SEM micrographs overlaid with the correlated confocal images (right). Scale bars 5 µm. (C) Scheme of the ATUM-SEM strategy for CLEM. A blood vessel of interest (magenta) in an 80 µm thick vibratome section is relocated by screening serial ultrathin sections at low resolution. The target region is reimaged at high resolution (up to 5 × 5 × 50 nm). (D) The correlated region in (B) was segmented and reconstructed from the ultrastructural data. Endothelium (ec, dark green), LNDs and gold particles (Au, magenta), monocyte (mc, orange), neutrophil (np, yellow), platelet (pt, blue), fibrin (fi, gray), erythrocytes (ery, red), pericyte (pc, bright green) are shown. Inset: SEM image of vessel lumen filled with equally sized, putative LNDs (magenta arrowhead) and gold particles (black arrowhead) and bigger aggregates thereof. Scale bar 100 nm. (E–G) Segmented SEM image (top) and three-dimensional rendering thereof (bottom), showing (E) the extravasation site from of a neutrophil (yellow), (F) extraluminal gold particles (arrows) next to vessel lumen clotted with platelets (blue) and fibrin (gray) and (G) stalled erythrocytes (red) interspersed with colloidal gold particles. Scale bars 1 µm. (H) Endothelial morphologies from left to right: normal endothelium (dark green) with tight junction (white arrows) and gold particles (magenta arrows); thinned endothelium covered by a pericyte (bright green), swollen endothelium with mitochondria and tight junction. Immune cells (orange), erythrocytes (red), platelets (blue). Scale bars 1 µm.
Figure 2 with 6 supplements
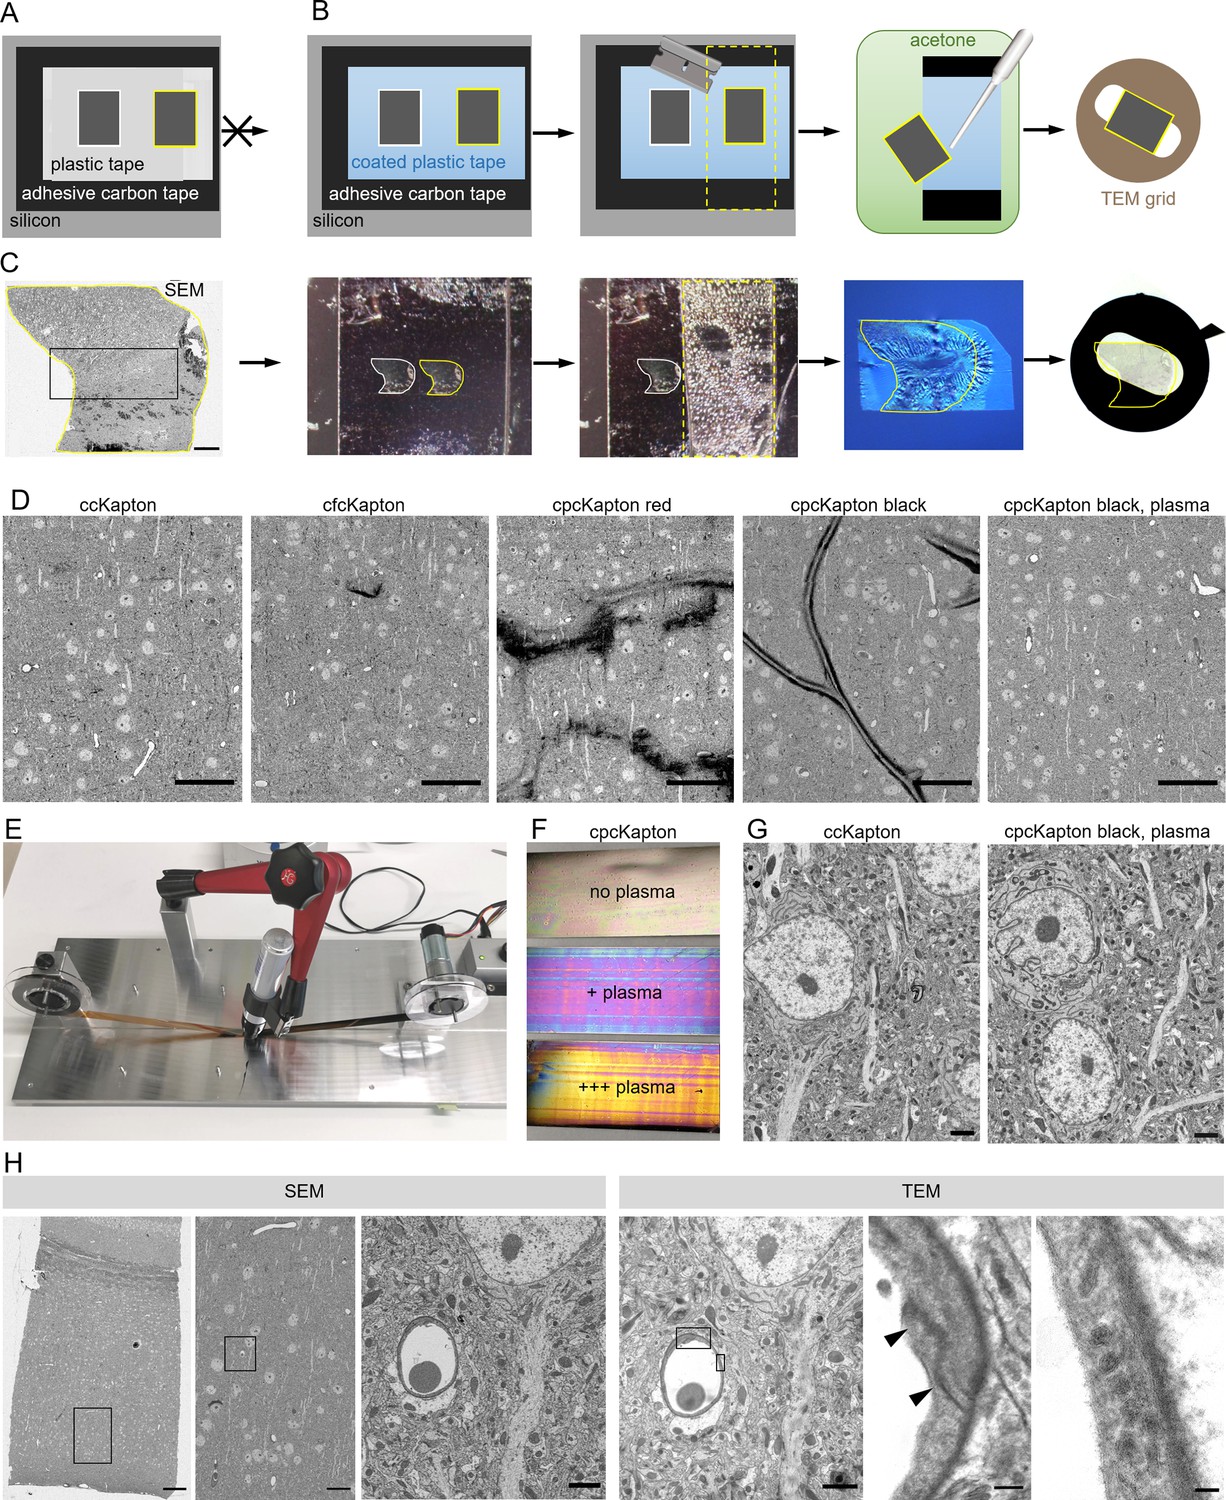
Principle of reversible section attachment on coated tape.
(A) Schematic showing that sections on ccKapton mounted on a silicon wafer cannot be recovered for transmission electron microscopy (TEM). (B) Schematics of section removal from cpcKapton or cfcKapton. From left to right: The adhesive tape around the selected section (yellow border) is excised by a razor blade (cutting line: yellow dashed lines) and detached from the wafer. The section is detached from the tape by acetone rinsing using a pipette. The section is collected from the acetone bath onto a TEM slot grid. (C) Detachment workflow of a particular selected section (yellow border). From left to right: scanning electron microscopy (SEM) overview image of a section (scale bar 200 nm); the imaged section mounted on the wafer; the section is removed together with the underlying adhesive tape (cutting line: yellow dashed lines); the section is floating on a water bath of a diamond knife after acetone treatment; slot grid with the section. (D) SEM images of mouse cortex specimens collected onto different Kapton tapes. From left to right: ccKapton; cfcKapton showing a charging artifact (arrow); cpcKapton red with major charging; cpcKapton black without plasma treatment showing section folds; cpcKapton black after intense plasma treatment. Scale bars 50 µm. (E) Photograph of the coating unit with a permanent pen and halfway labeled ccKapton. (F) Photograph of cpcKapton before discharging (top), after mild (middle) and extensive (bottom) plasma discharging. (G) Ultrastructural quality of a cortical tissue section on ccKapton (left) and cpcKapton after plasma treatment (right) imaged at 10 × 10 nm resolution. Scale bars 2 µm. (H) Recovery of an ultrathin section. From left to right: SEM overview image of cortex with corpus callosum (scale bar 100 µm). SEM medium resolution image thereof (scale bar 20 µm). SEM high-resolution image (10×10 nm) of a blood vessel cross-section (scale bar 2 µm). TEM image of the same section showing the selected blood vessel (scale bar 2 µm). High magnification image of a tight junction (arrowheads), scale bar 200 nm. High-magnification images of endothelial vesicles (scale bar 50 nm). Black boxes indicate location of the image to the right.
Figure 2—figure supplement 1
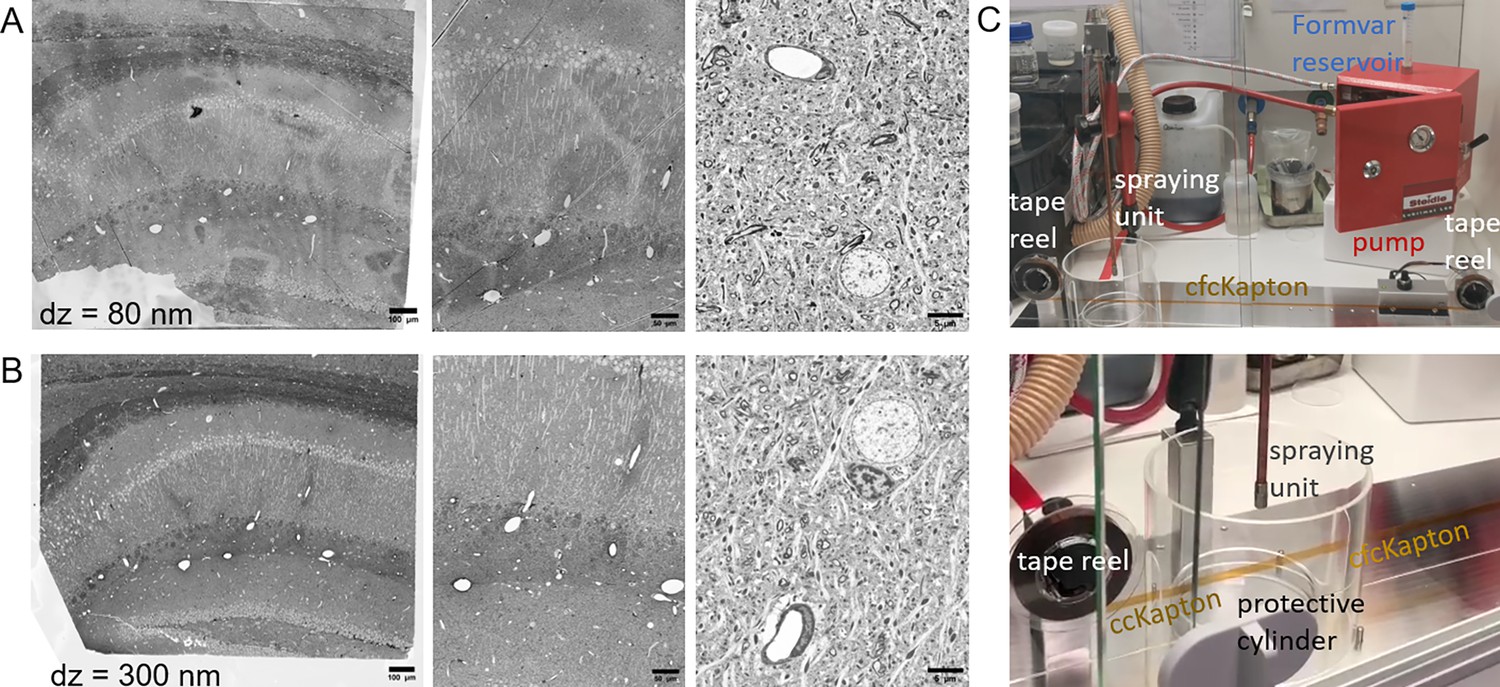
Formvar coating for reversible section collection.
Ultrathin (80 nm) (A) and semi-thin (300 nm) (B) sections imaged by scanning electron microscopy (SEM) (BSD detector, 8 kV (increase in magnification from left to right)). Irregular Formvar coating can be detected on the left and middle image of ultrathin sections (A), while the semi-thin sections in (B) do not show any Formvar-related background. High-resolution images of both ultra- and semi-thin sections (right images in A and B) are free of background. Scale bars 100 µm (left), 50 µm (middle), 5 µm (right). (C) Photos of the tape coating unit attached to a spraying unit (Lubrimat L60) for dispersion of Formvar onto the tape. The top image shows the red spraying unit with Formvar reservoir (Falcon tube) as well as the reel-to-reel system for movement of the ccKapton tape. The bottom photo shows that the spray nozzle dispersing the Formvar is surrounded by a Plexiglas cylinder that the tape can transverse.
Figure 2—figure supplement 2
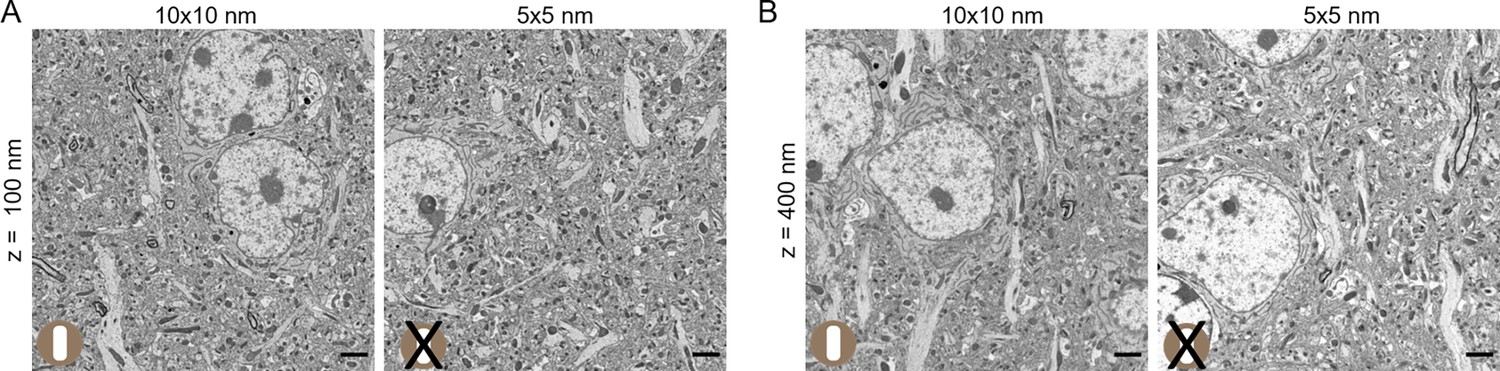
Optimizing scanning electron microscopy (SEM) imaging conditions for section detachment.
(A) Ultrathin (100 nm thick) and (B) Semi-thin (400 nm thick) sections imaged at 10 nm (left) and 5 nm (right) lateral resolution at 5 kV, 4 kV beam deceleration. Only sections imaged at 10 nm lateral resolution could be detached from cpcKapton after imaging, the ones imaged at 5 nm resolution were stuck to the tape. Scale bars 2 µm.
Figure 2—figure supplement 3
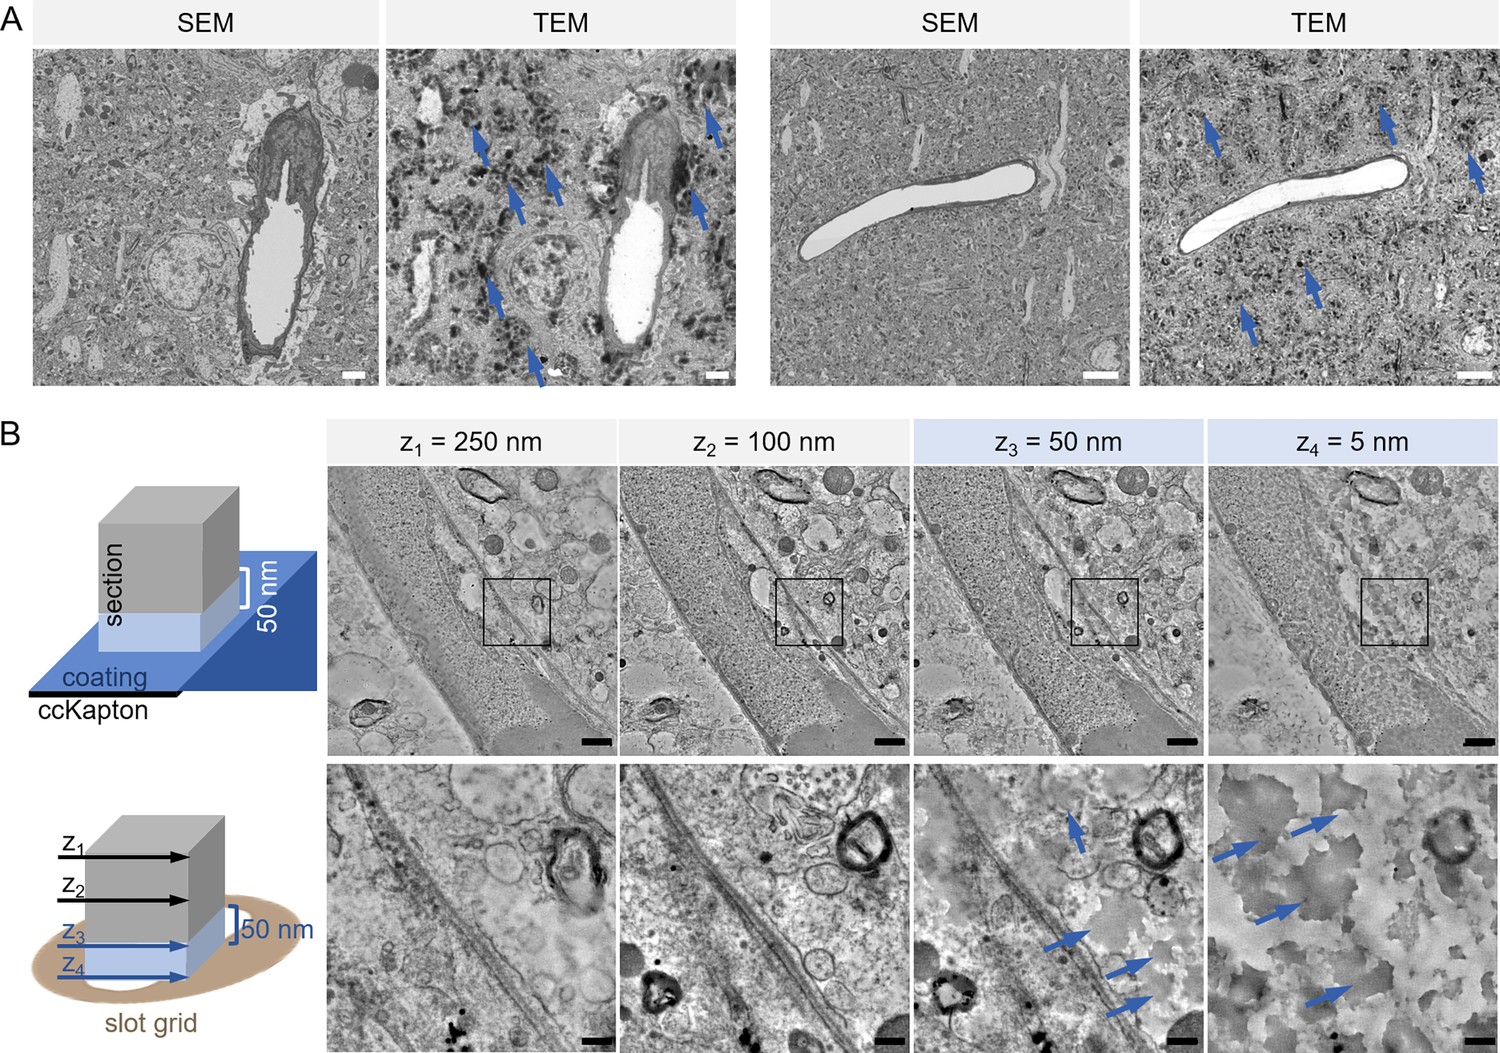
Contamination of section surface after detachment.
(A) Ultrathin sections imaged by scanning electron microscopy (SEM) (left) and transmission electron microscopy (TEM) (right). The TEM image shows contaminations (arrows). Scale bars 2 µm (left), 5 µm (right). (B) Schematic illustration of a section collected on either cpcKapton (permanent marker coat, blue) tape (top row) or on a slot grid (bottom row). The side of the section facing the coating is contaminated (light blue) up to a thickness of 50 nm while the rest of the section thickness (gray) does not show any dirt originating from the coating. Single TEM images of a tomographic reconstruction at different depths, indicated in the scheme (z1–z4) are shown. High-magnification images (bottom row) of the boxed regions (top row) reveal details of back projection artifacts due to the contamination. The left (z1, top image) and the middle left image (z2) show no artifacts; the middle right image (z3, 50 nm distance to the support) shows some gray spots (arrow), while the right image (z4, bottom section) appears ‘dirty’. Scale bars 1 µm (top row), 500 nm (bottom row).
Figure 2—figure supplement 4
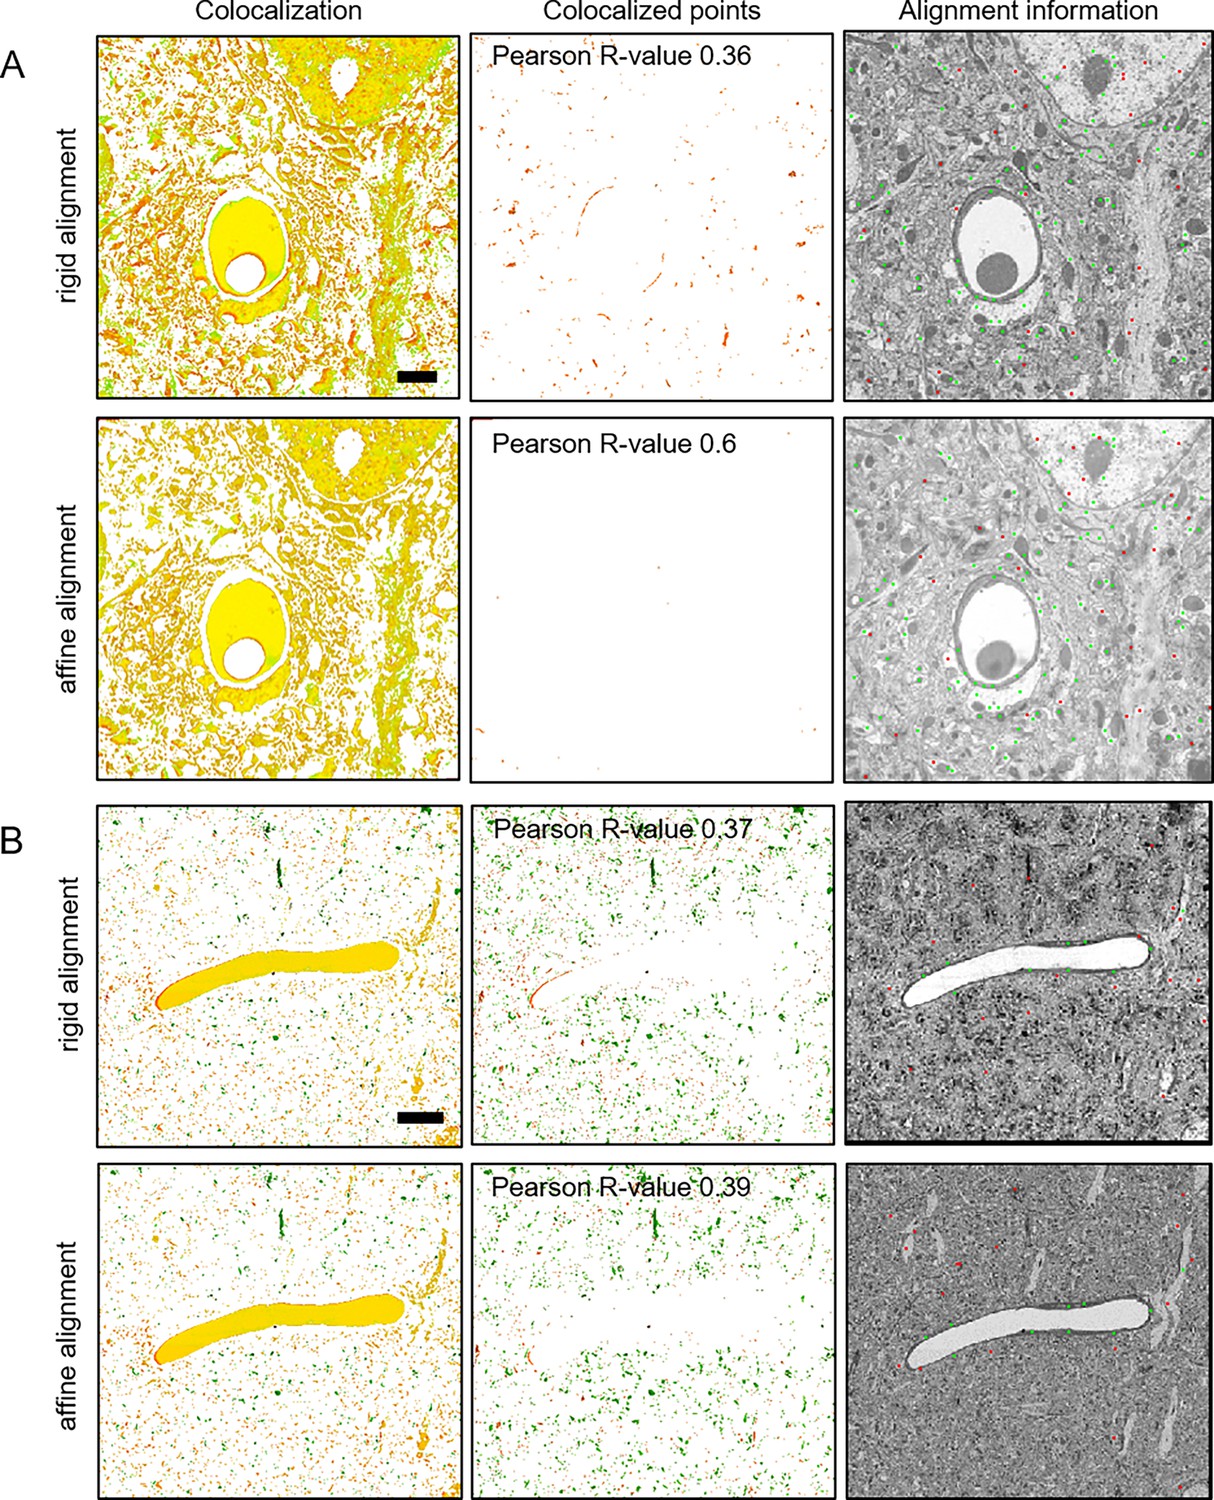
Estimation of distortion between scanning electron microscopy (SEM) and transmission electron microscopy (TEM) images.
Ultrathin section SEM and TEM images were compared after rigid (top) and affine (bottom) alignment to assess image distortion. We picked a clean example (A) and one region with some contamination (B). For both examples and alignment algorithms we calculated the Pearson coefficient between the SEM and TEM image. The images show the spatial distribution of colocalization (left, ImageJ ‘Colocalization Finder’) and mislocalization (middle, ImageJ ‘Colocalization Highlighter’). The right images are calculated from the transformation of rigid to affine alignment (ImageJ ‘Image Registration’ with SIFT’). Matching is indicated in green, diverging positions are shown in red (right column). Scale bars 2 µm (A), 10 µm (B).
Figure 2—figure supplement 5
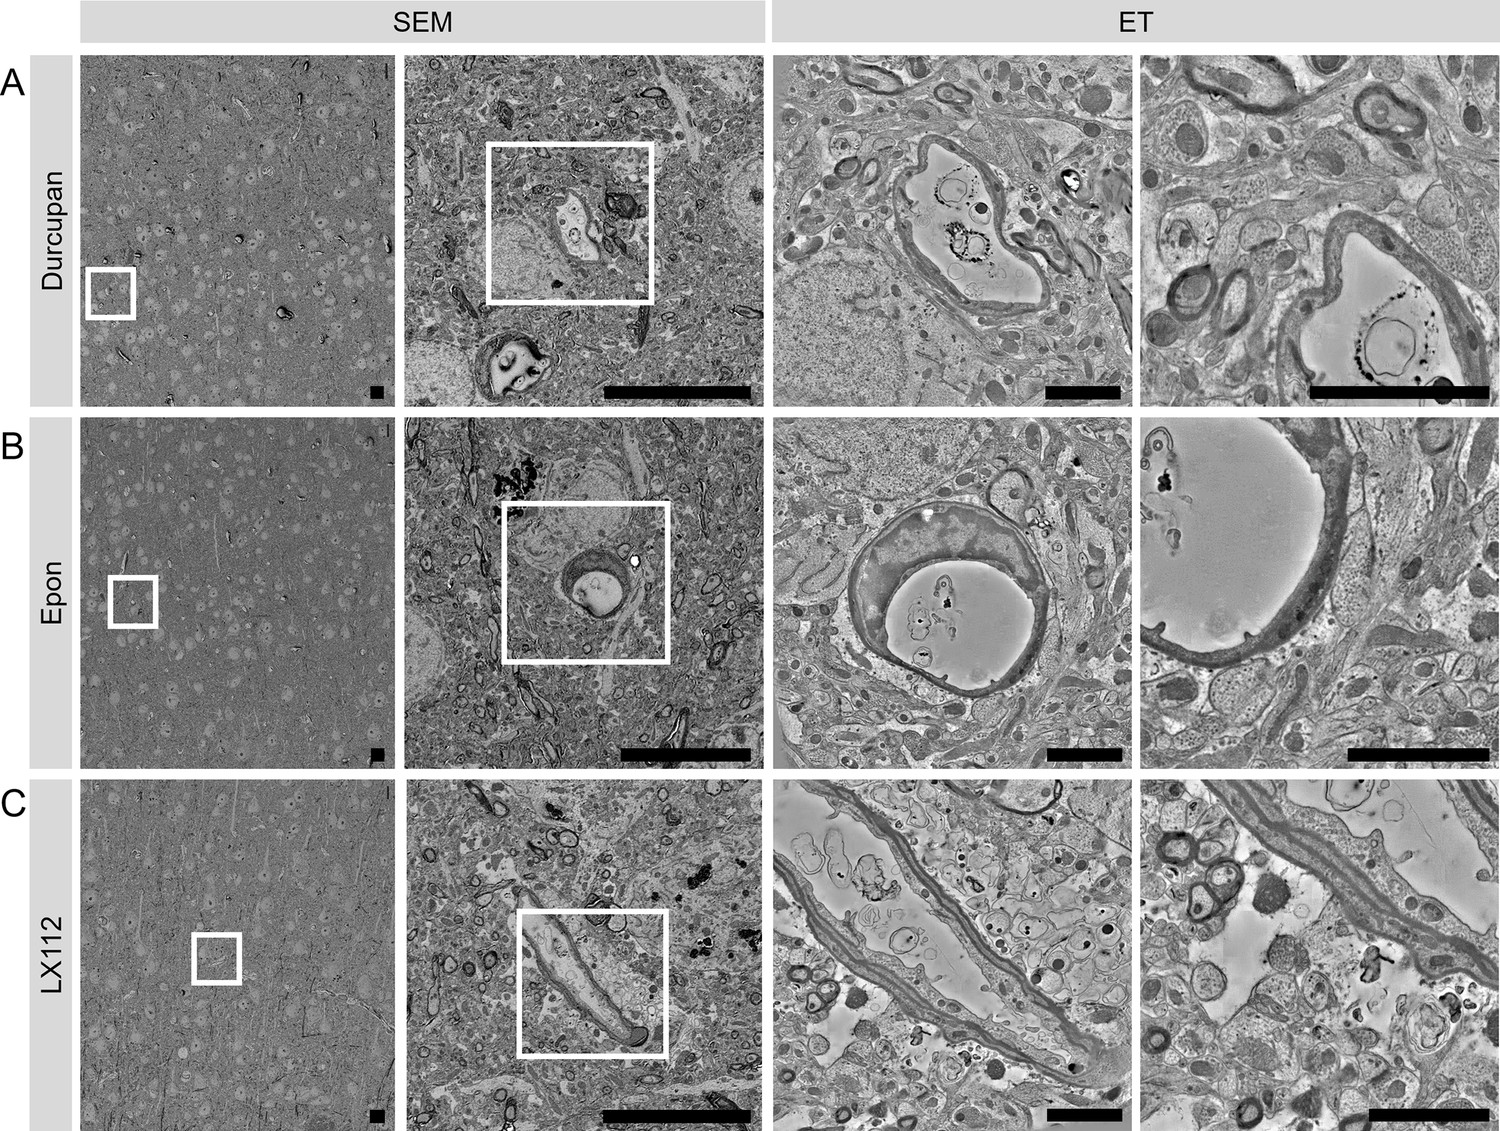
Resin test for section recovery.
Section recovery was possible for all tested resin formulations, Durcupan (A), Epon (B), and LX112 (C). The first two columns show scanning electron microscopy (SEM) images at increasing magnifications. The third and fourth columns show single tomographic slices after reconstruction at increasing magnifications. The white boxes indicate the position of the zoomed-in image to the right, respectively. Scale bars 10 µm (SEM) and 2 µm (electron tomography, ET).
Figure 2—figure supplement 6
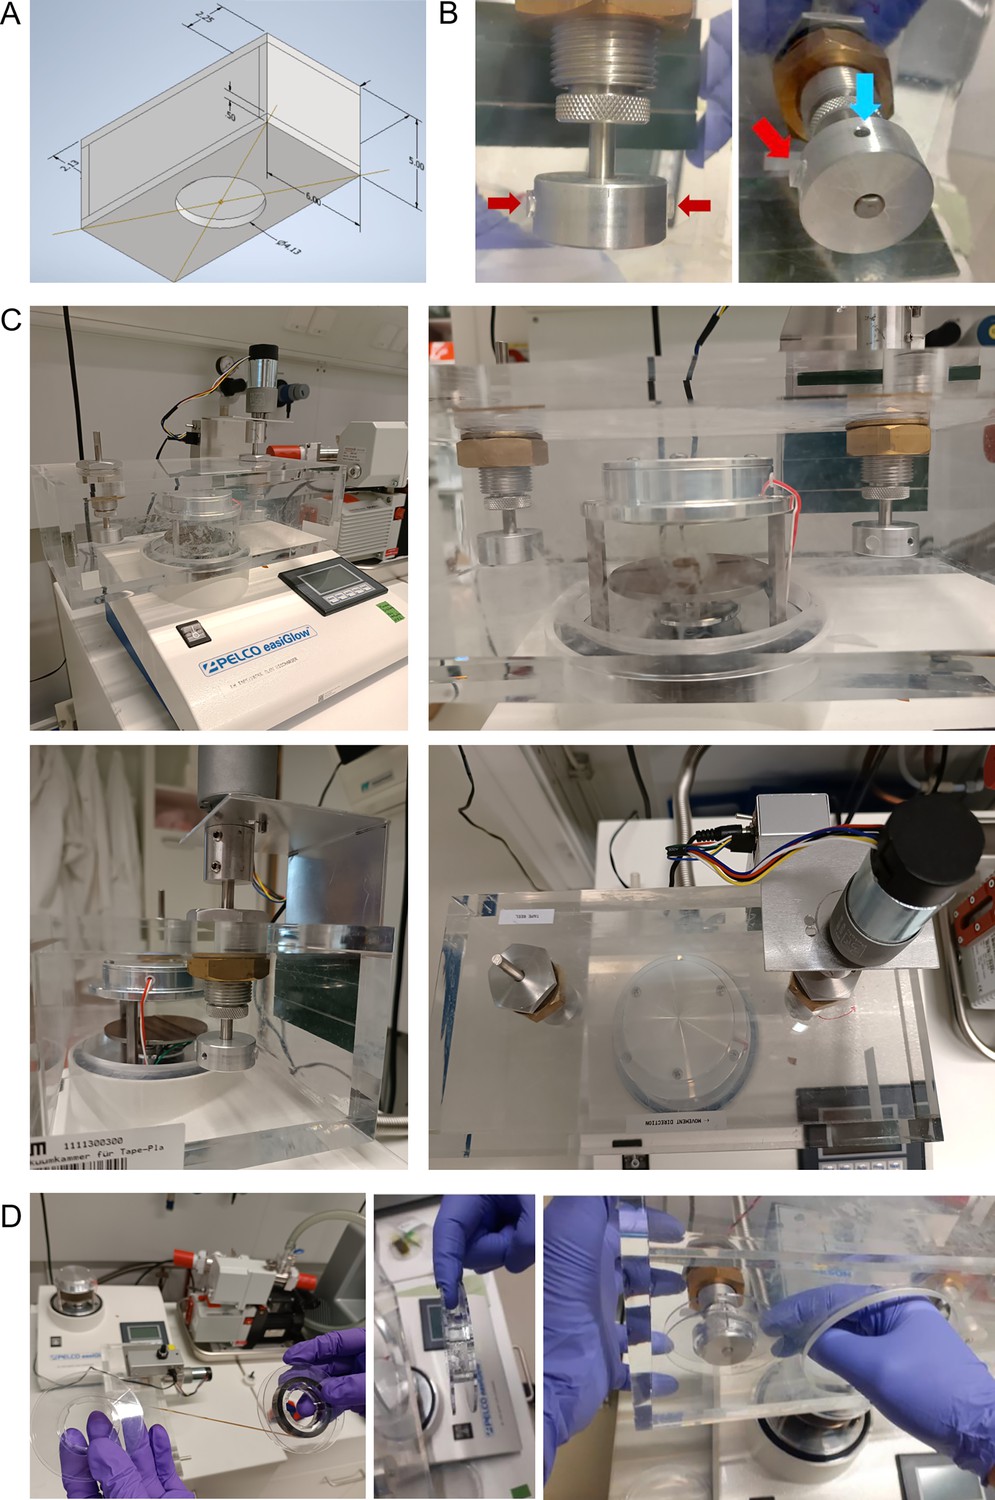
Tape plasma discharging unit construction and use.
(A) Schematics with dimensions of the vacuum chamber and with the dynamic O-ring shaft seals. (B) Photo of the spool holder design: Plastic burls (red arrow) that fit into the spool indentation and prevent spool slip off as well as tightening of the turning rod (blue arrow) are highlighted. (C) Photos of the discharging unit: Front (top row), side (bottom left), and top (bottom right) views showing the easiGlow plasma discharging unit with its custom-built chamber and the gear motor mounted directly onto the reel holder. (D) Photos demonstrating the insertion of the reel into the vacuum chamber. Tape reel orientation (left), reel fixation using a finger (middle), and mounting onto the spool holder (right) are shown.
Figure 3 with 3 supplements
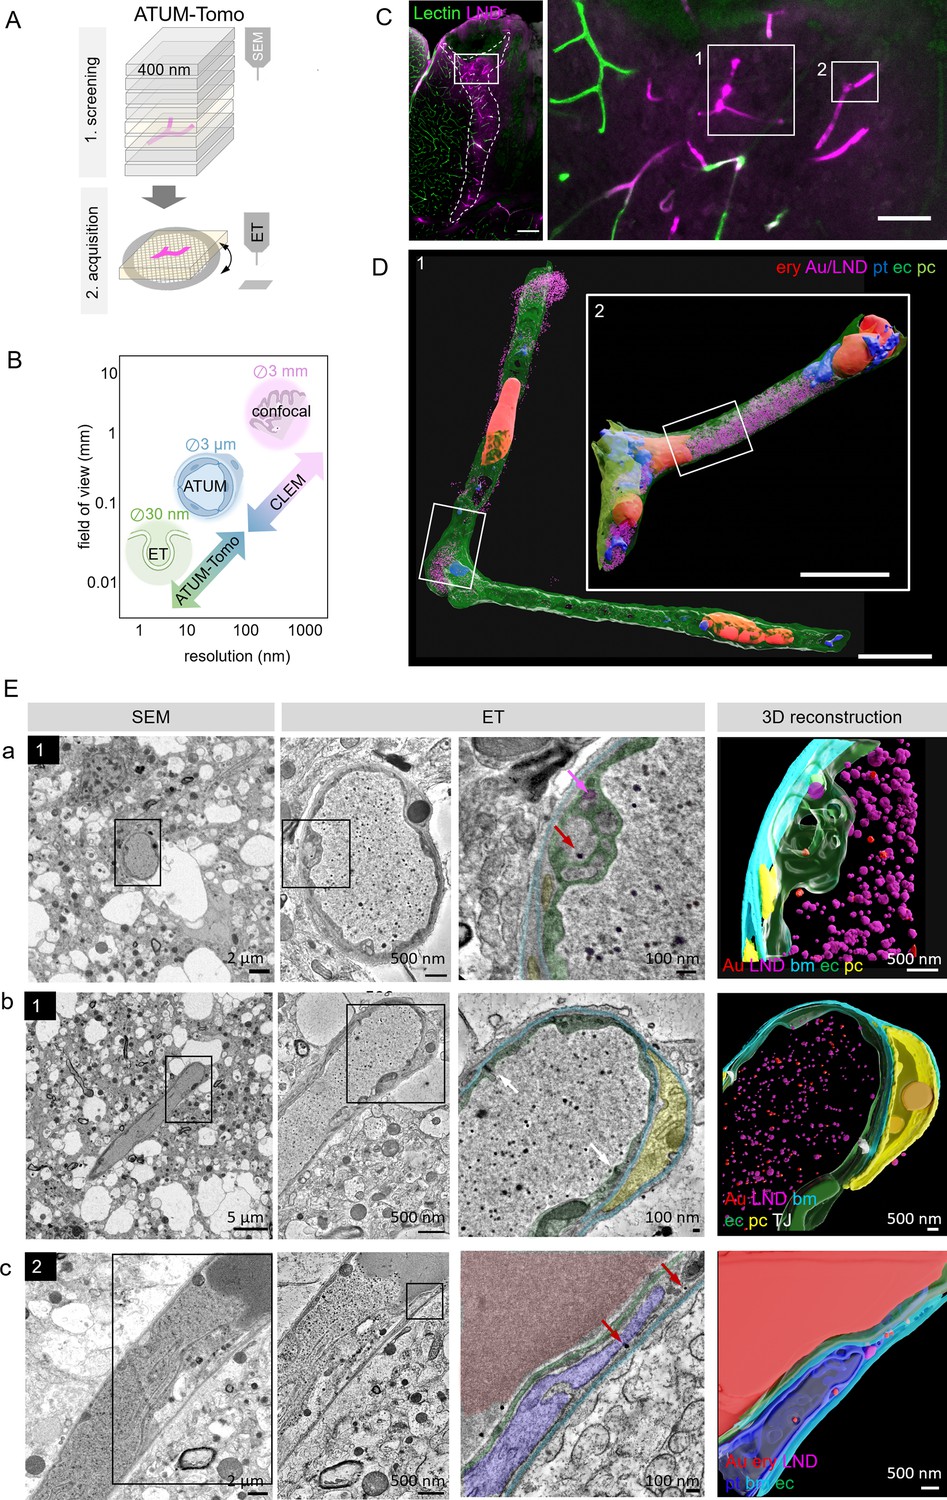
Correlative automated tape-collecting ultramicrotomy (ATUM)-Tomo of vascular occlusions.
(A) Schematic of the ATUM-Tomo workflow. Semi-thick sections are serially imaged by scanning electron microscopy (SEM). Targeted sections (yellow) bearing the site of interest (blood vessel, magenta) are selected for electron tomography (ET). (B) Schematic highlighting how ATUM-Tomo and correlative light and electron microscopy (CLEM)-ATUM-Tomo bridge scales in resolution and field of view. Transmission electron microscopy (TEM) tomography enables high-resolution imaging e.g., vesicular structures (diameter ~30 nm), ATUM can visualize the cellular composition and morphology (e.g. a neurovascular unit) and confocal provides a large field of view (e.g. highlighting a lesion site in cortex, 3 × 3 mm). (C) Confocal microscopy images of the traumatic brain injury lesion. Lectin (green), lipid nanodroplets (LNDs) (magenta). Numbered boxes indicate positions selected for SEM imaging. Scale bars 200 µm, 20 µm (D) Reconstruction of selected vessels as indicated in (C). Scale bar 10 µm. (E) Regions from the vessels 1 (a, b) and 2 (c) in (D) selected for ET. SEM image (first column), corresponding ET low- (second column) and high-magnification images with segmentation (third column) and three-dimensional reconstruction thereof (fourth column). (a) Example of particles in endothelial swellings (red arrow gold particle, magenta arrow LND). (b) Intact tight junctions (white arrow). (c) Endothelial disruption and gold particle localization in a platelet. Endothelium (green), pericyte (yellow), platelet (blue), basement membrane (cyan), LNDs (magenta), gold nanoparticles (red), tight junctions (white).
Figure 3—video 1
Rotation of the 3D model as shown in Figure 3Ea.
Figure 3—video 2
Rotation of the 3D model as shown in Figure 3Eb.
Figure 3—video 3
Rotation of the 3D model as shown in Figure 3Ec.
Figure 4 with 3 supplements
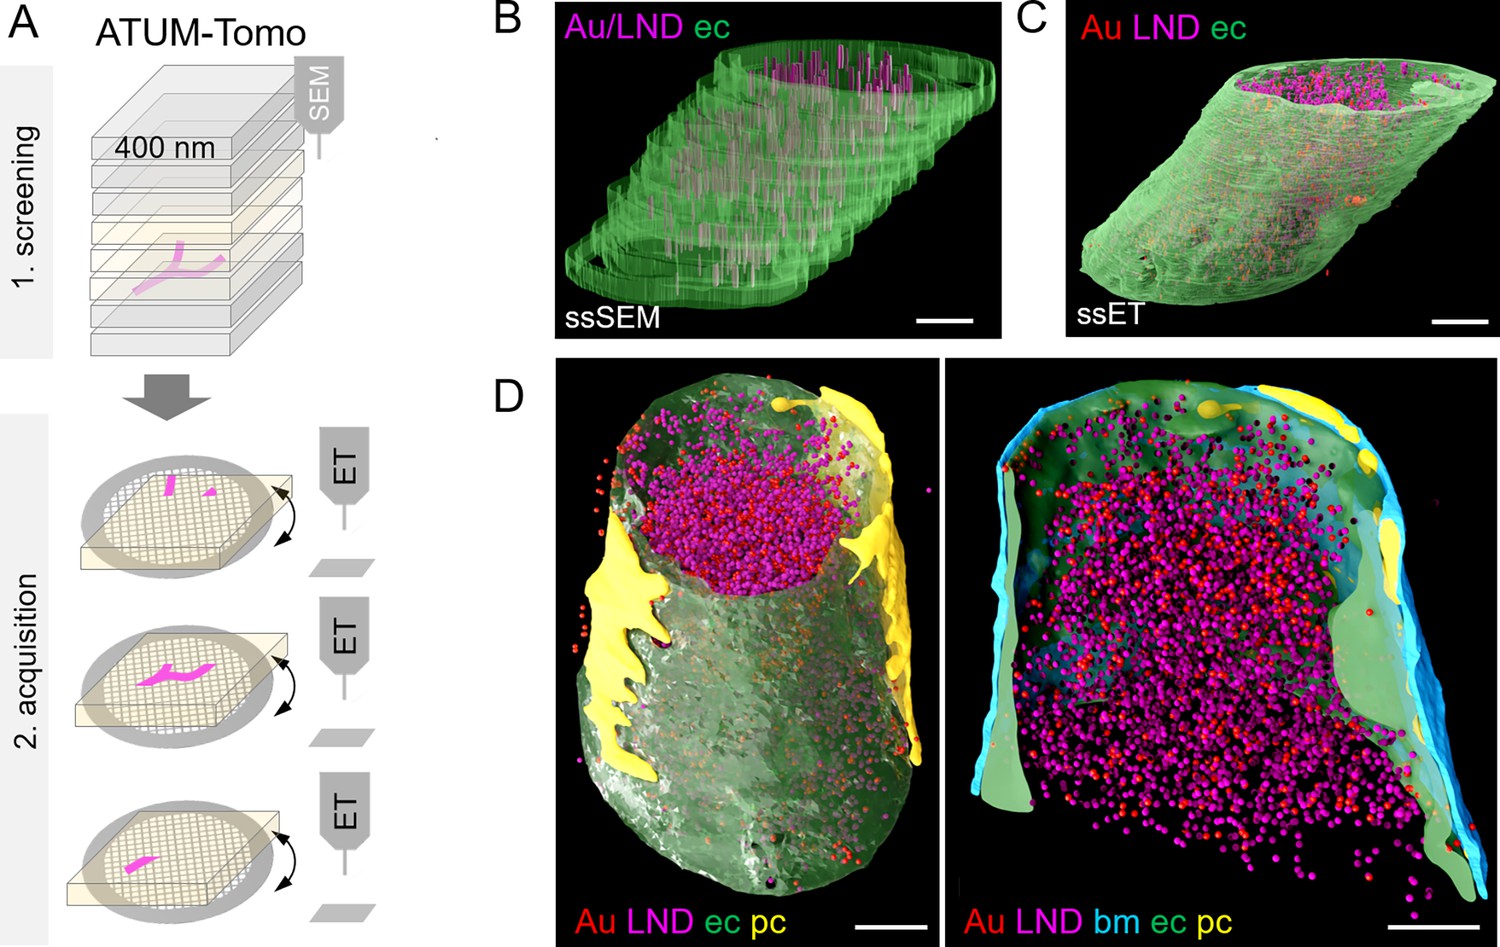
Correlative automated tape-collecting ultramicrotomy (ATUM)-Tomo with serial-section electron tomography (ET).
(A) Schematic of the ATUM-Tomo workflow. Semi-thick sections are serially imaged by scanning electron microscopy (SEM). Targeted sections (yellow) bearing the site of interest (blood vessel, magenta) are selected for serial section ET. Tomograms from consecutive ET volumes can be aligned. (B–D) The boxed region in Figure 3D (number 2) has been subjected to ET including nine consecutive sections. endothelium in green, pericyte in yellow, platelet in blue, basement membrane in cyan, lipid nanodroplets (LNDs) in magenta, gold nanoparticles in red. (B) Non-smoothed, raw reconstructions of nine consecutive SEM images. (C) Corresponding region of nine detached sections subjected to ET and reconstructed. (D) Side view (left) and longitudinal cut view (right) of the smoothed serial-section ET reconstruction. Scale bars 1 µm.
Figure 4—video 1
Rotation of the 3D model as shown in Figure 4B.
Figure 4—video 2
Rotation of the 3D model as shown in Figure 4C.
Figure 4—video 3
Rotation of the 3D model as shown in Figure 4D.
Additional files
Download links
A two-part list of links to download the article, or parts of the article, in various formats.
Downloads (link to download the article as PDF)
Open citations (links to open the citations from this article in various online reference manager services)
Cite this article (links to download the citations from this article in formats compatible with various reference manager tools)
Combining array tomography with electron tomography provides insights into leakiness of the blood-brain barrier in mouse cortex
eLife 12:RP90565.
https://doi.org/10.7554/eLife.90565.3


