A computational model predicts sex-specific responses to calcium channel blockers in mammalian mesenteric vascular smooth muscle
- Department of Physiology & Membrane Biology, University of California, Davis, United States
- Department of Mathematics, University of California, Davis, United States
- Center for Precision Medicine and Data Sciences, University of California, Davis, United States
Figures
Figure 1
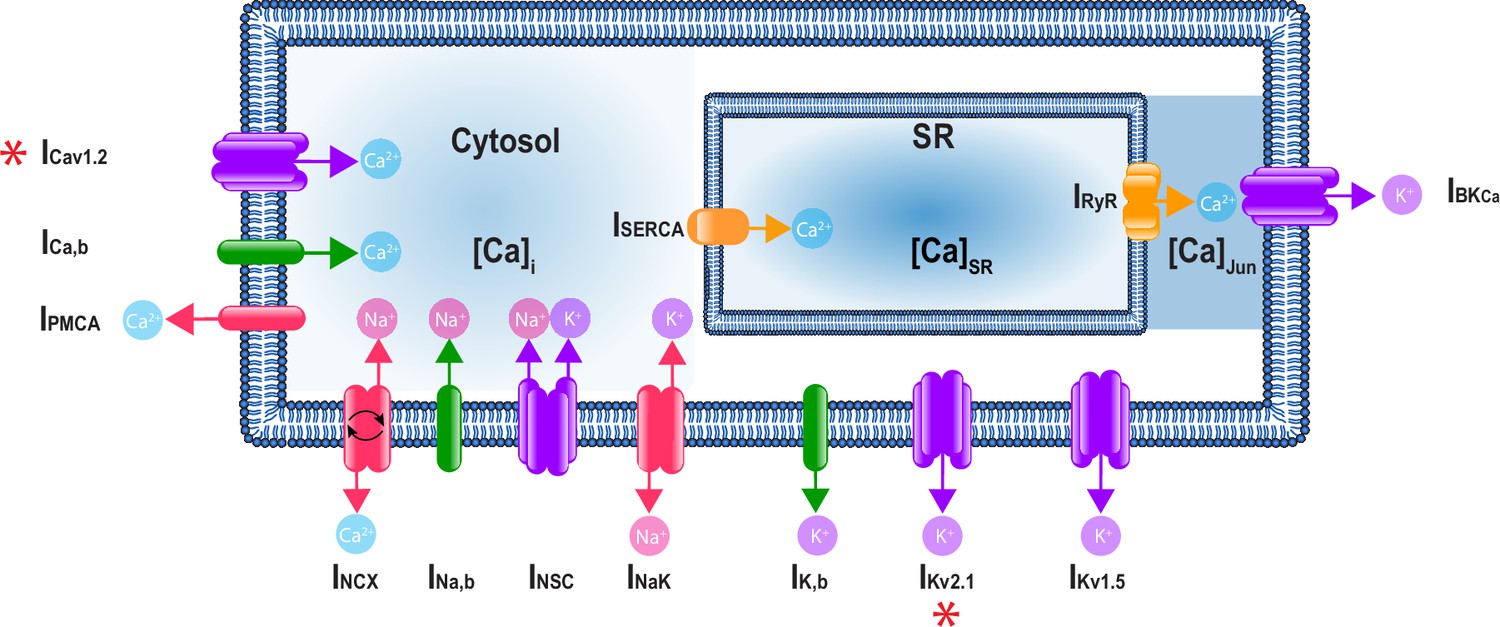
A schematic representation of the Hernandez–Hernandez model.
The components of the model include major ion channel currents shown in purple including the voltage-gated L-type calcium current (ICa), nonselective cation current (INSC), voltage-gated potassium currents (IKv1.5 and IKv2.1), and the large-conductance Ca2+-sensitive potassium current (IBKCa). Currents from pumps and transporters are shown in red including the sodium/potassium pump current (INaK), sodium/calcium exchanger current (INCX), and plasma membrane ATPase current (IPMCA). Leak currents are indicated in green including the sodium leak current (INa,b), potassium leak current (IK,b), and calcium leak current (ICa,b). In addition, two currents in the sarcoplasmic reticulum are shown in orange: the sarcoplasmic reticulum Ca-ATPase current (ISERCA) and ryanodine receptor current (IRyR). Calcium compartments comprise three discrete regions including cytosol ([Ca]i), sarcoplasmic reticulum ([Ca]SR), and the junctional region ([Ca]Jun). Red stars (*) indicate measured sex-specific differences in ionic currents.
Figure 2
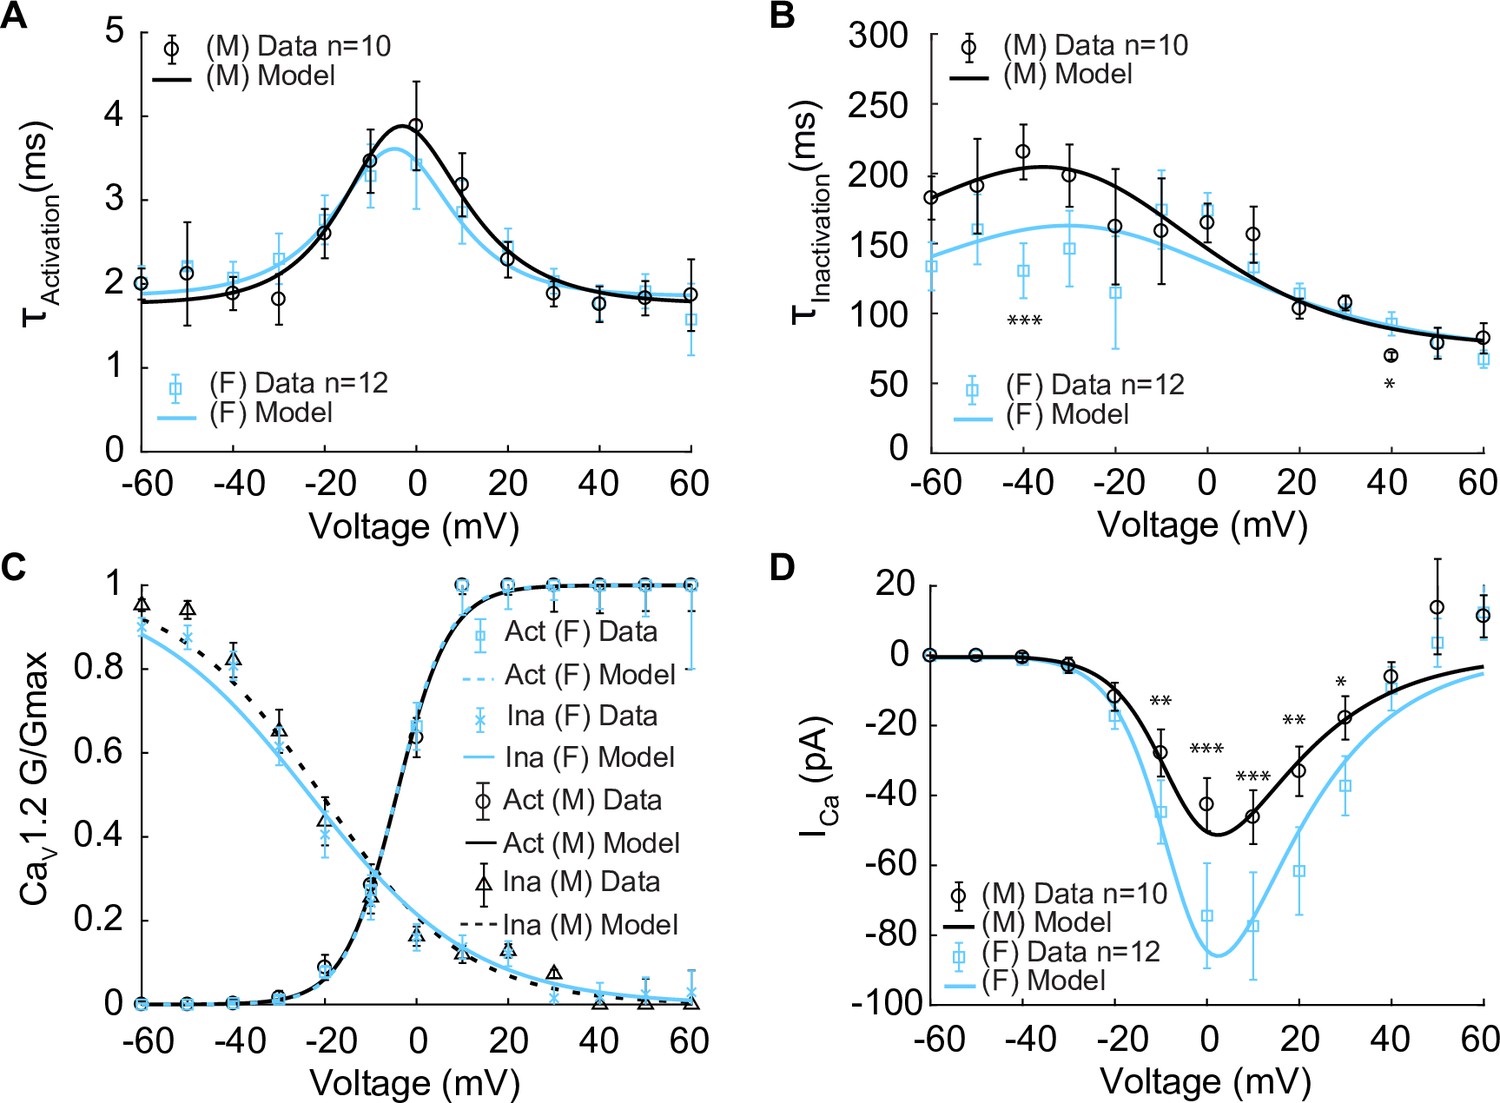
Experimentally measured and modeled L-type calcium currents (ICa) from male and female vascular smooth muscle (VSM) cells.
Properties of ICa are derived from measurements in male and female VSM cells isolated from the mouse mesenteric arteries following voltage-clamp steps from –60 to 60 mV in 10 mV steps from a –80 mV holding potential. Experimental data is shown in black circles for male (n=10) and blue squares for female (n=12). Model fits to experimental data are shown with black solid lines for male and blue solid lines for female. (A) Male and female time constants of ICa activation. (B) Male and female time constants of ICa inactivation. (C) Male and female voltage-dependent steady-state activation and inactivation of ICa. (D) Current–voltage (I–V) relationship of ICa from male and female VSM myocytes. *p<0.05, **p<0.01, ***p<0.001. Error bars indicate mean ± SEM.
Figure 3
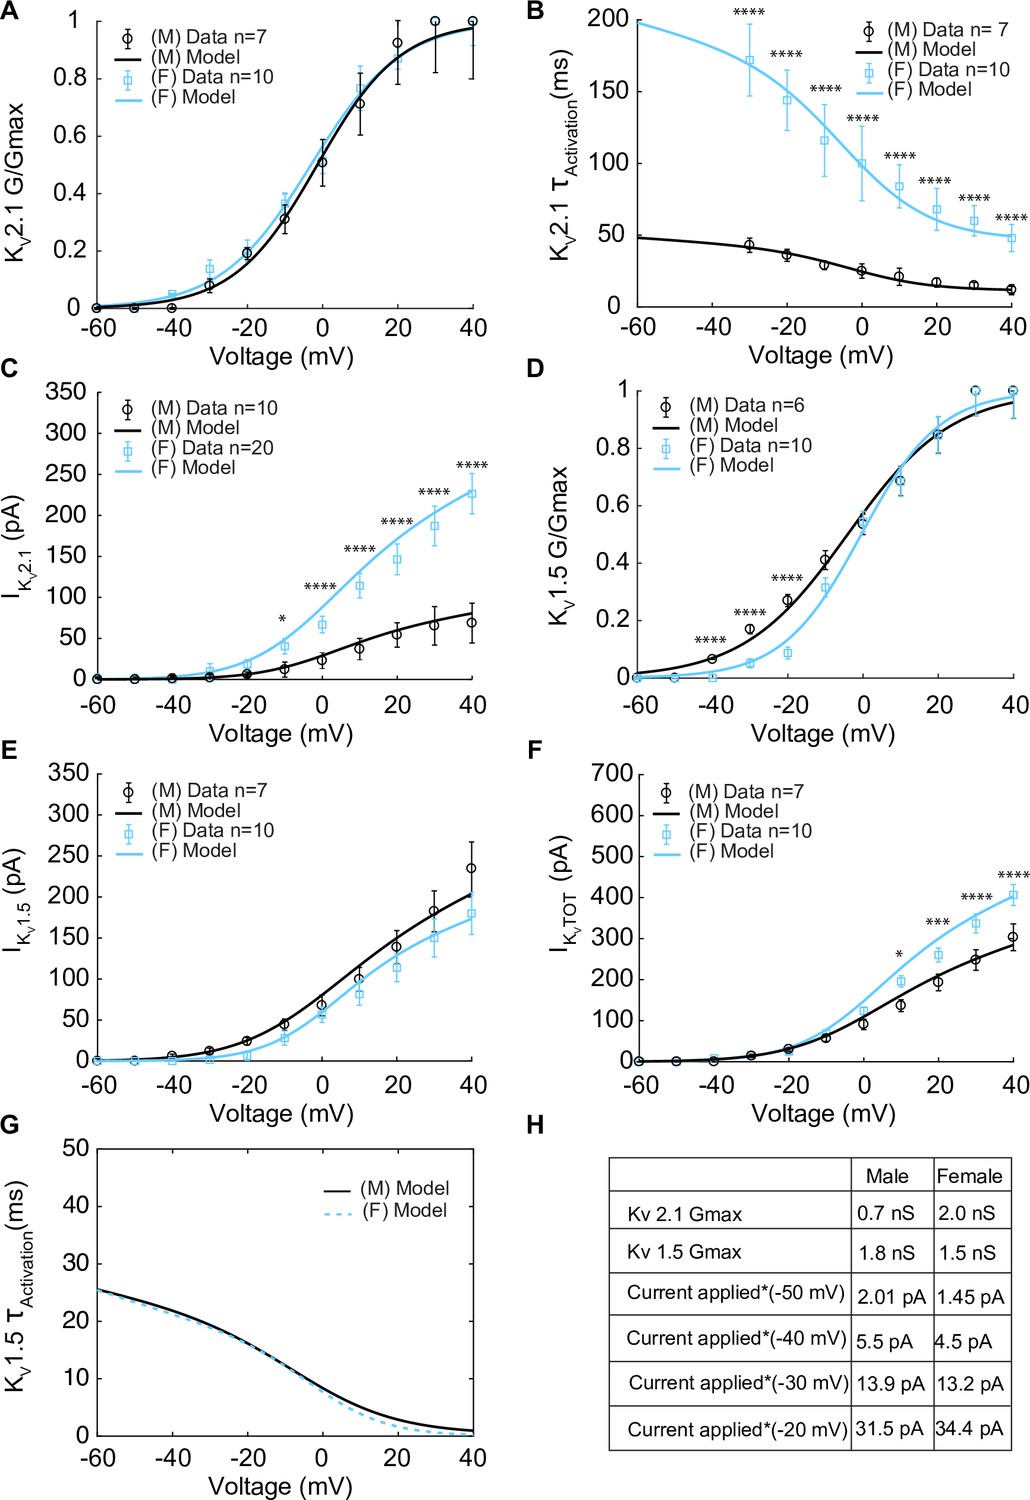
Experimentally measured and modeled potassium currents (IKvTOT) from male and female vascular smooth muscle cells.
The properties of IKv1.5 and IKv2.1 from experimental measurements in male and female vascular smooth muscle cells isolated from the mouse mesenteric arteries were recorded in response to voltage-clamp from –60 to 40 mV in 10 mV steps (holding potential –80 mV). Experimental data is shown as black circles for male and blue squares for female. Model fits to experimental data are shown with black solid lines for male and blue solid lines for female. (A) Male (n=7) and female (n=10) voltage-dependent steady-state activation of IKv2.1. (B) Male (n=7) and female (n=10) time constants of IKv2.1 activation. (C) Current–voltage (I–V) relationship of IKv2.1 from male (n=10) and female (n=20) myocytes. (D) Male (n=6) and female (n=10) voltage-dependent steady-state activation of IKv1.5. (E) Current–voltage (I–V) relationship of IKv1.5 from male (n=7) and female (n=10) myocytes. (F) Male (n=7) and female (n=10) total voltage-gated potassium current IKvTOT = IKv1.5 + IKv2.1. (G) Predicted male and female time constants of the IKv1.5 activation gate. (H) Table showing sex-specific differences in conductance and steady-state total potassium current–voltage dependence. *p<0.05, **p<0.01, ***p<0.001, ****p<0.0001. Data points without asterisks are not significant. Error bars indicate mean ± SEM.
Figure 4
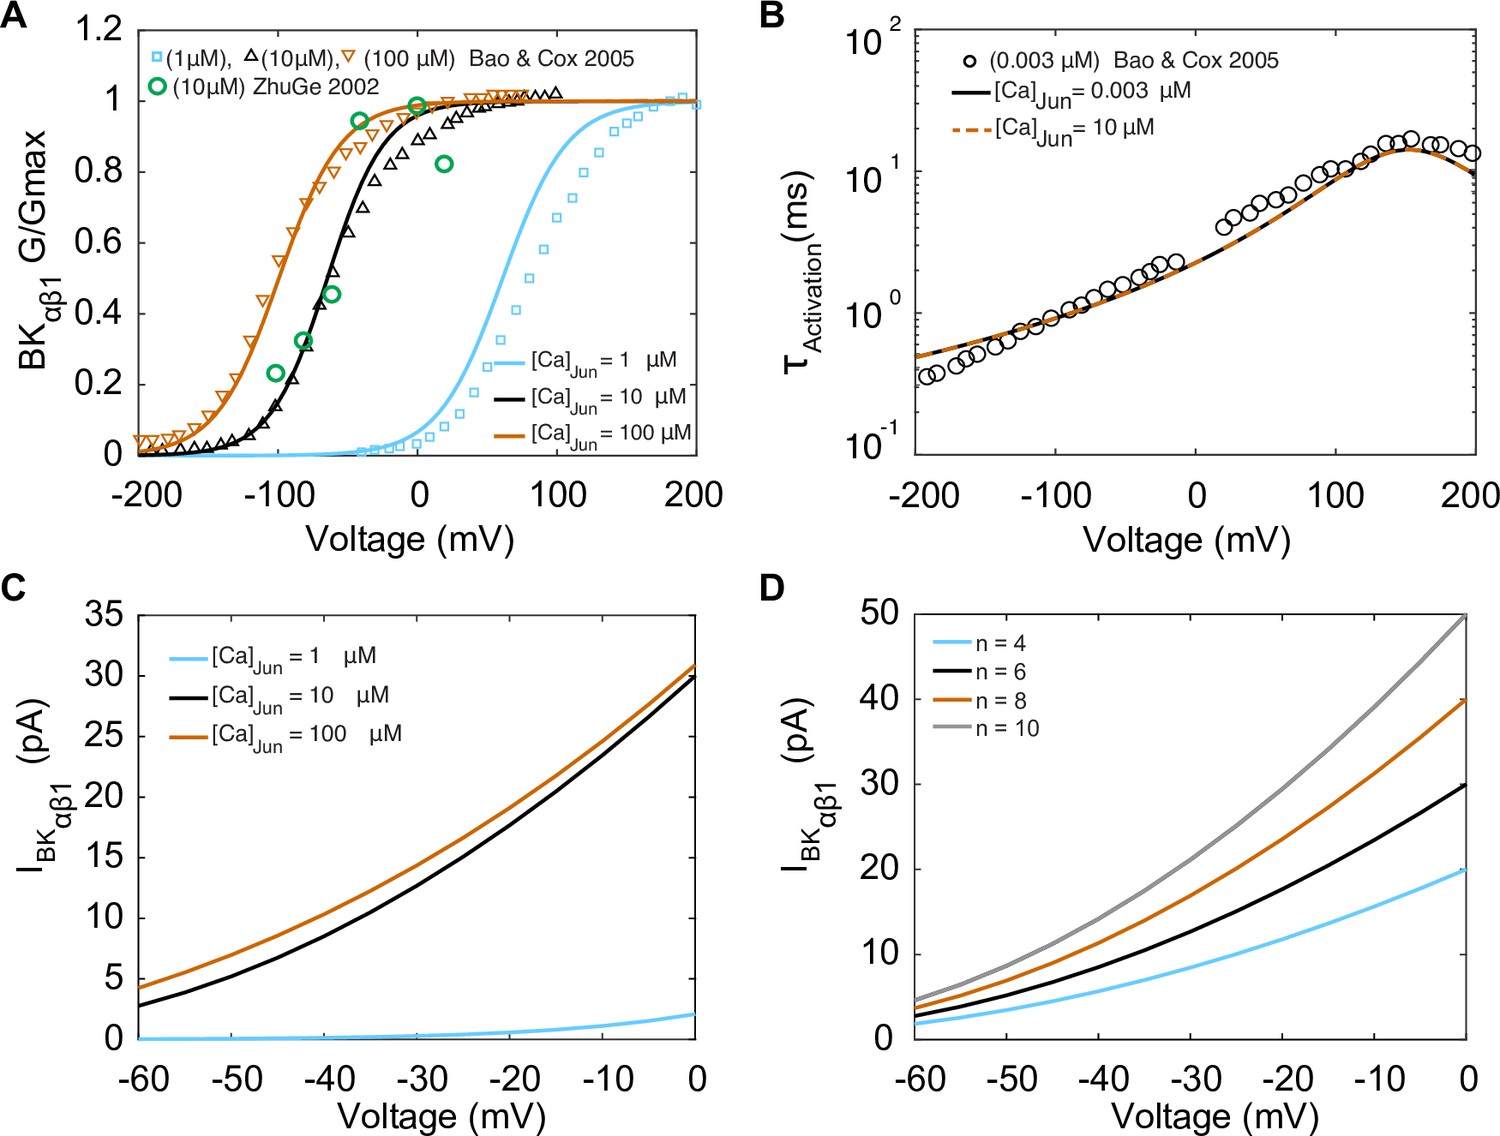
Experimentally measured and modeled large-conductance Ca2+-activated K+ currents (IBKαβ1).
The model was optimized to data from Bao and Cox, 2005. (A) Voltage-dependent activation of IBKαβ1 from experiments performed with three different [Ca]Jun concentrations (1 μM, 10 μM, and 100 μM) shown in green circles is the data from Zhuge et al., 2002. (B) Voltage-dependent activation time constants with [Ca]Jun = 0.003 μM and simulations [Ca]Jun = 10 μM. (C) Simulated I–V curve at different peak levels of [Ca]Jun levels. (D) Simulated I–V curve with different BKca average cluster sizes (N = 4,6, 8, and 10).
Figure 5
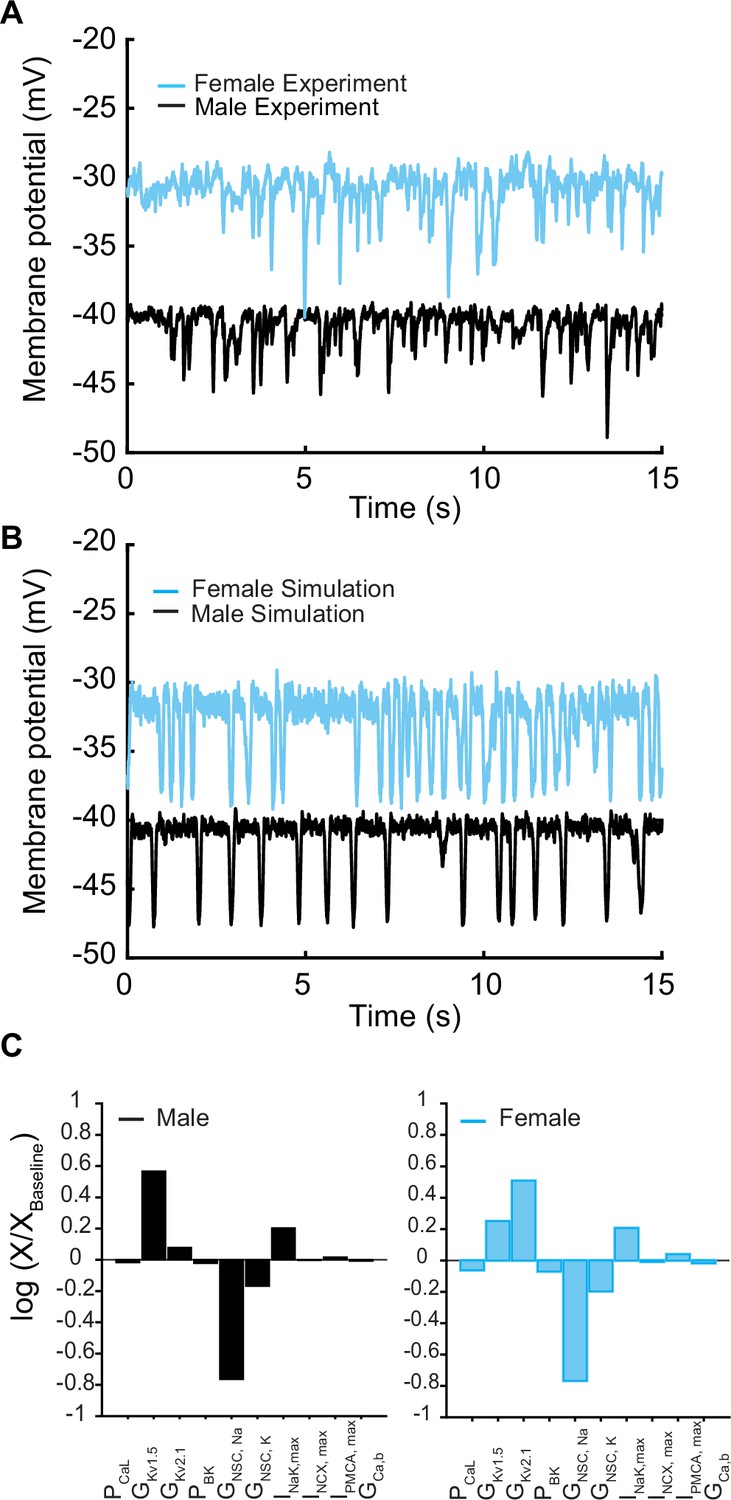
Membrane potential from experiments and simulations in male and female vascular smooth muscle myocytes.
(A) Whole-cell membrane potential recordings in male and female myocytes showing spontaneous repeat transient hyperpolarization of the membrane potential. (B) Simulated whole-cell membrane potential with physiological noise. (C) Comparison of sensitivity analysis performed around the baseline membrane potential in male and female models using multivariable regression.
Figure 6
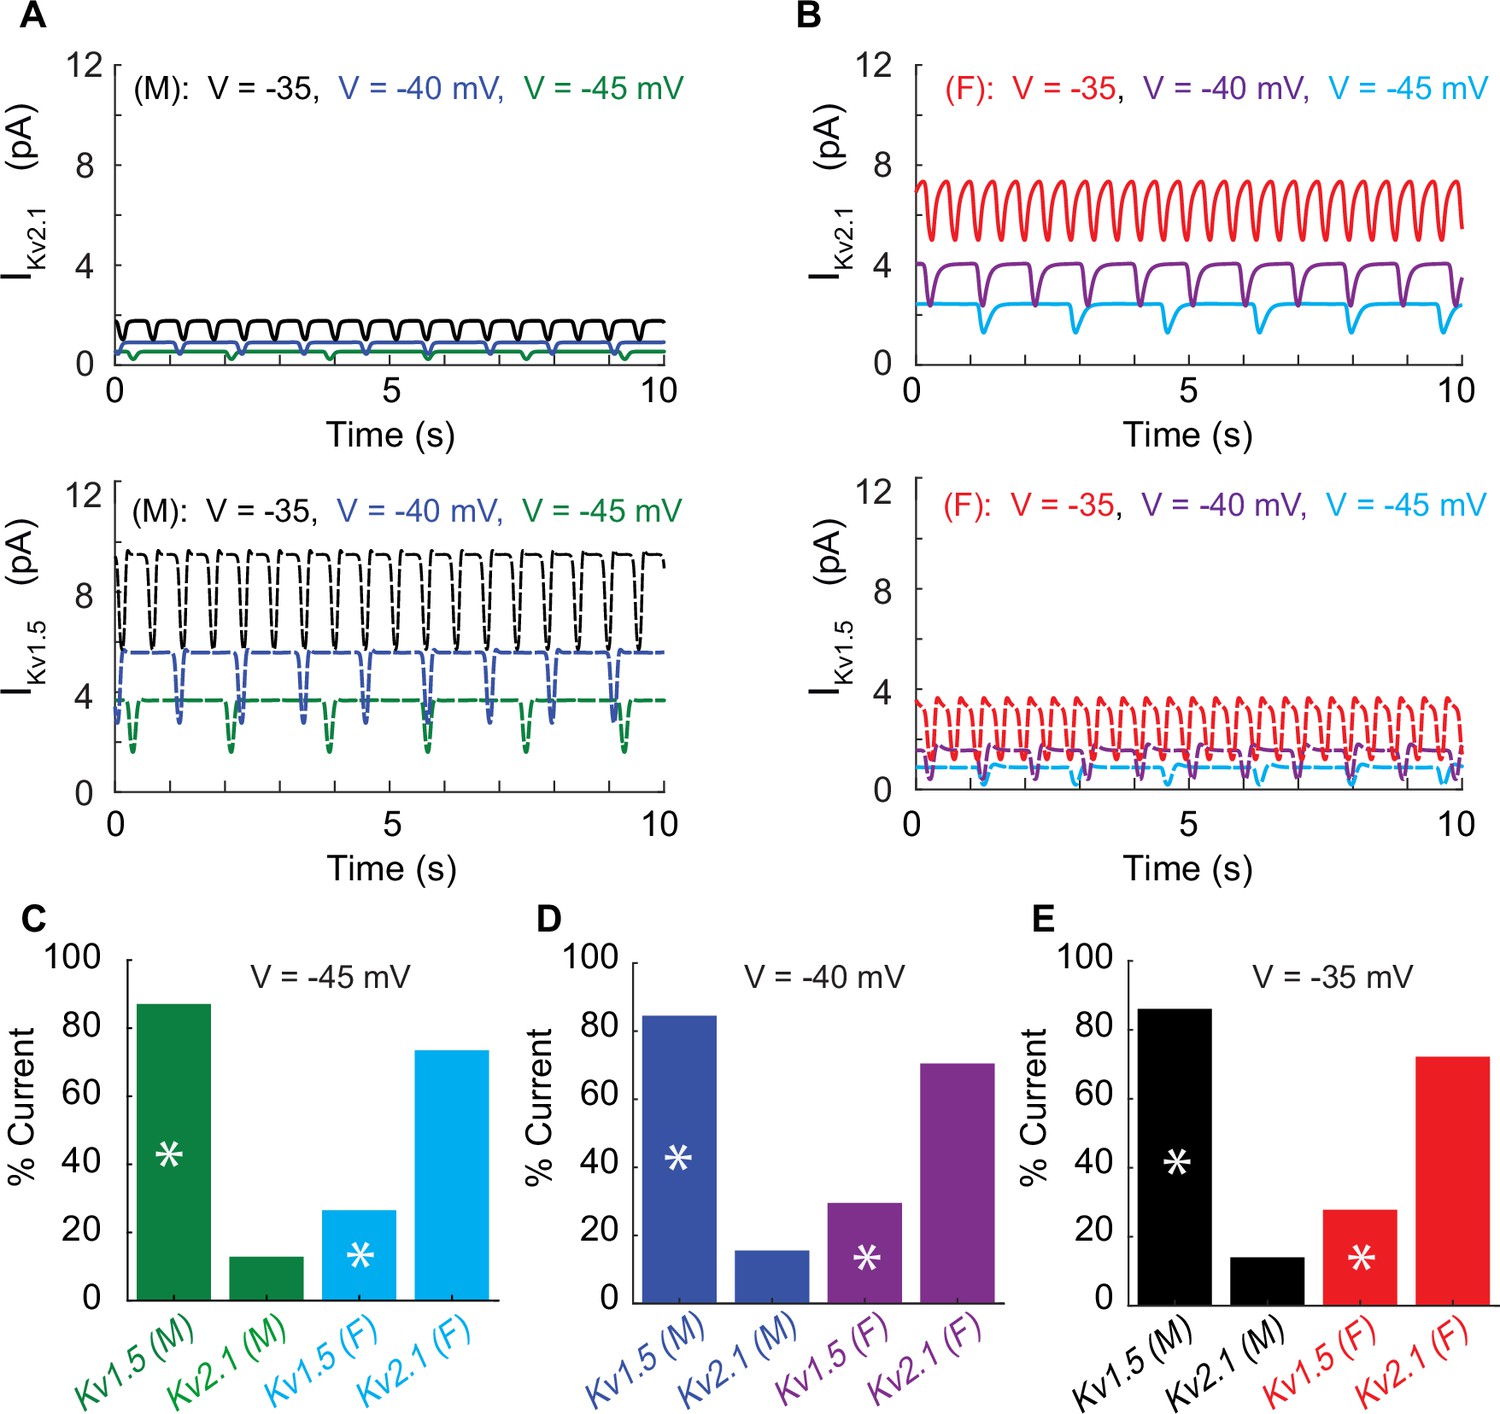
Differential effects of voltage-gated potassium current (IKVTOT) block in male and female myocytes.
(A) Simulated time course of male IKv2.1 (top panel, solid traces) and IKv1.5 (lower panel, dashed traces) at three different baseline membrane potentials (–45 mV green, –40 mV blue, and –35 mV black). (B) Simulated time course of female IKv2.1 (top panel solid traces) and IKv1.5 (lower panel, dashed traces) at three different baseline membrane potentials (–45 mV light blue, –40 mV purple, and –35 mV red). Current contribution to IKVTOT from KV1.5 (indicated by asterisks) and KV2.1 in male and female myocytes at a baseline membrane potential of –45 mV (C), –40 mV (D), and –35 mV (E).
Figure 7
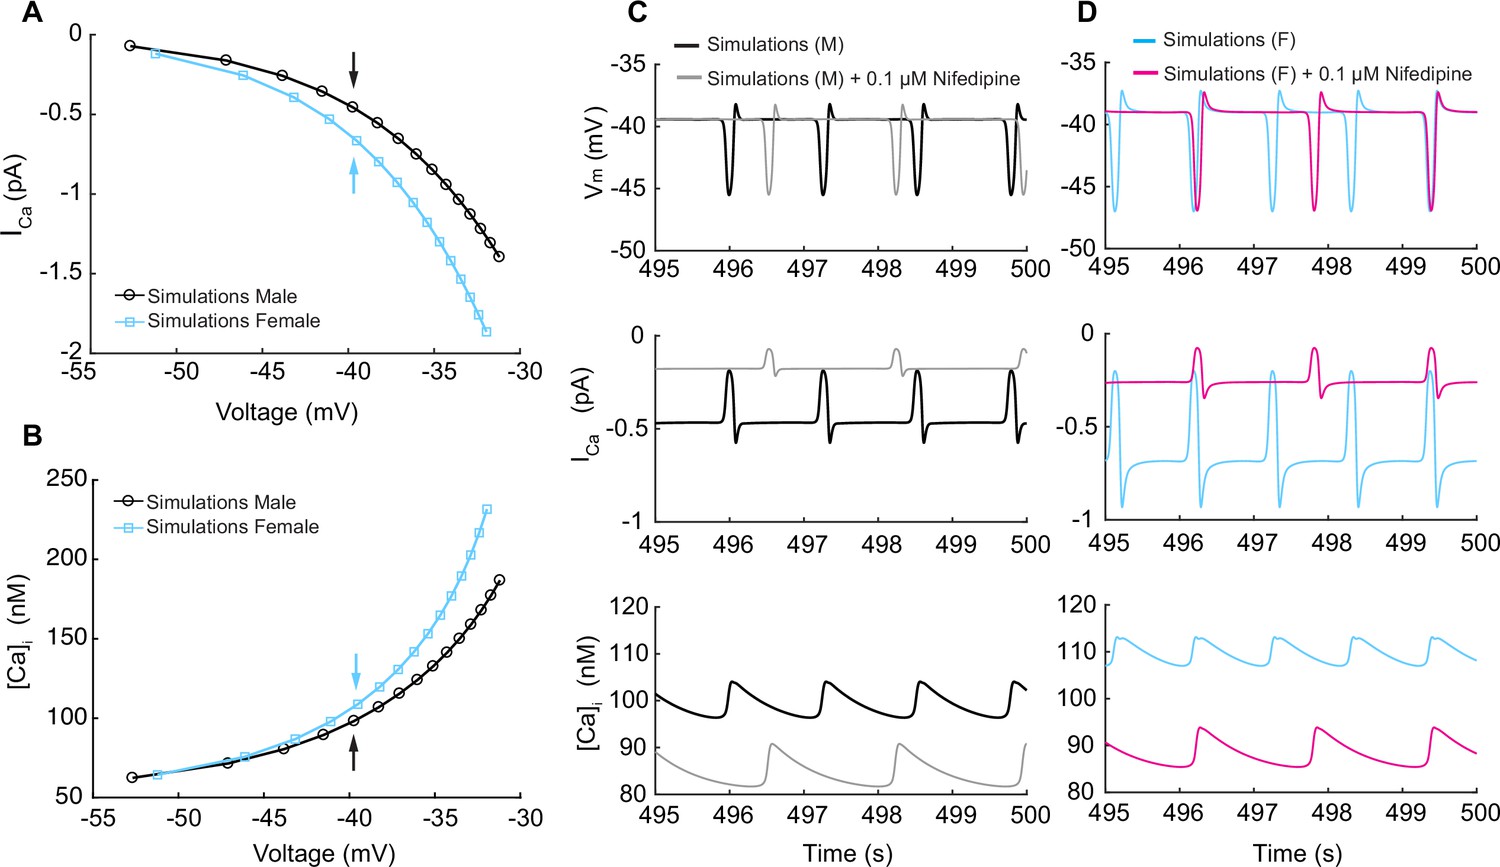
Simulated L-type calcium currents (ICa) and calcium influx in male and female vascular smooth muscle cells.
(A) Male and female whole-cell ICa membrane potential relationship. (B) Male and female intracellular calcium concentration in the cytosolic compartment at indicated membrane potential. (C) Time course of membrane potential in male vascular smooth muscle cells before (black) and after (gray) simulated nifedipine application (top panel). Corresponding time course of L-type calcium current ICa before (black) and after (gray) simulated nifedipine application (middle panel) and intracellular calcium [Ca2+]i concentration before (black) and after (gray) simulated nifedipine application (lower panel). (D) Time course of membrane potential in female vascular smooth muscle cells before (blue) and after (pink) simulated nifedipine application (top panel). Corresponding time course of L-type calcium current ICa before (blue) and after (pink) simulated nifedipine application (middle panel) and intracellular calcium [Ca2+]i concentration before (blue) and after (pink) simulated nifedipine application (lower panel).
Figure 8
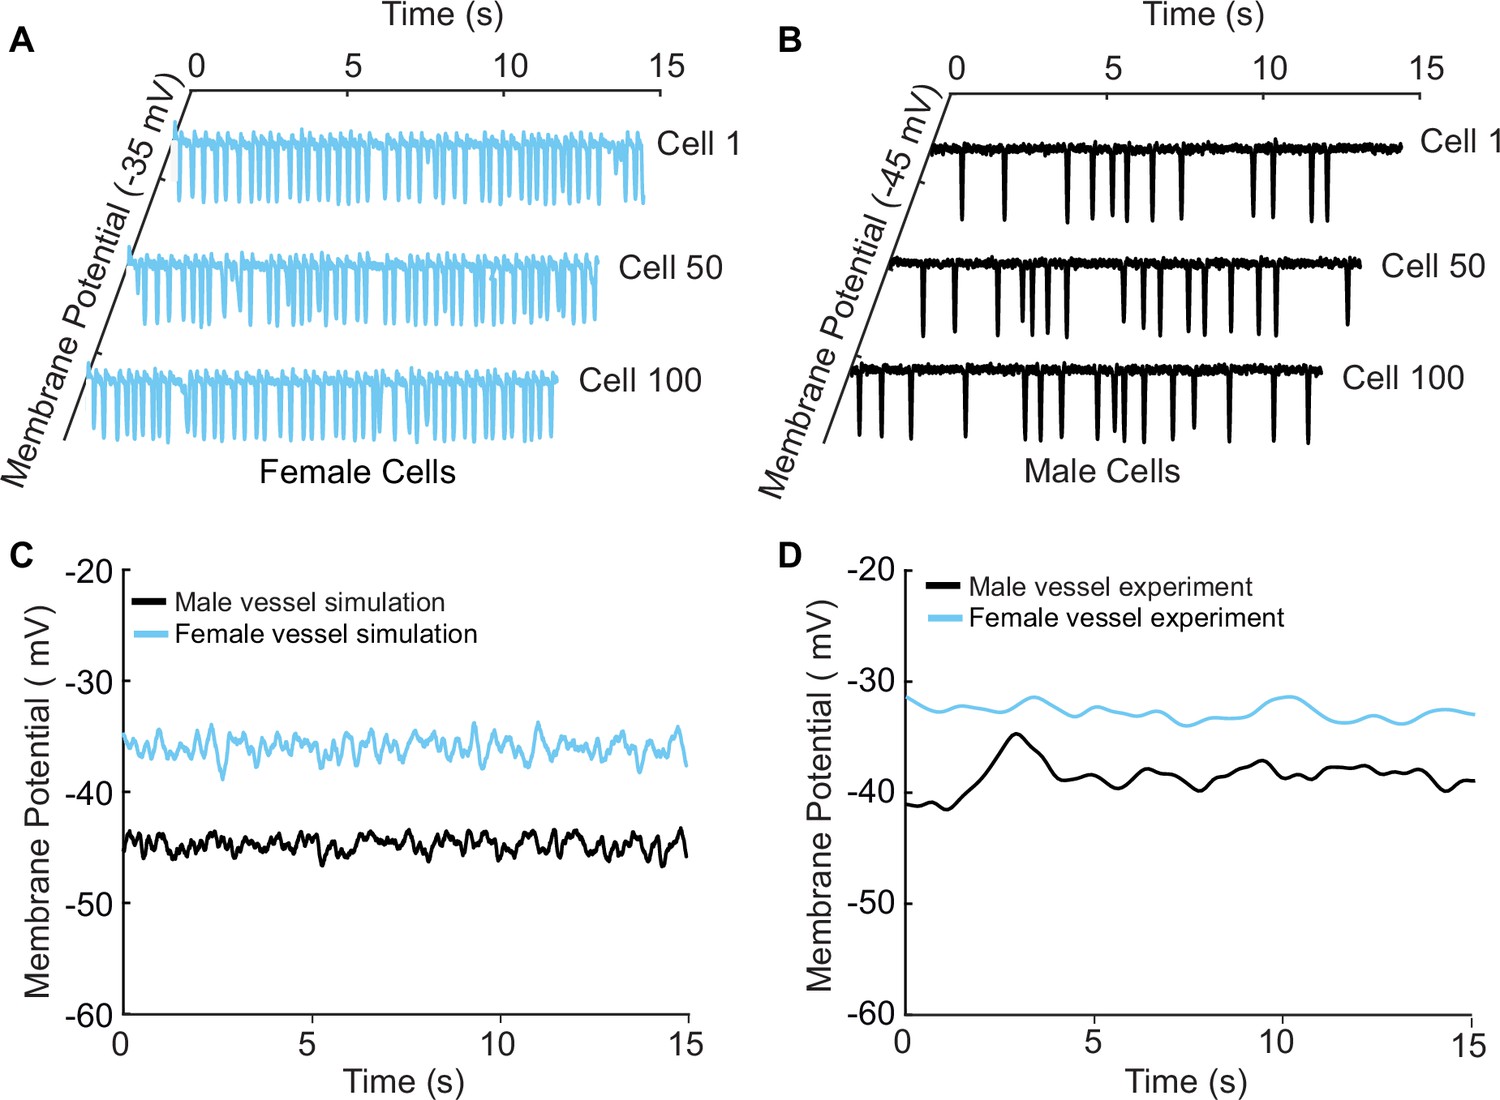
A one-dimensional tissue model representation of vascular smooth muscle cells connected in series.
(A) Uncoupled female vessel simulation showing cell 1, cell 50, and cell 100 at a baseline membrane potential of –35 mV. (B) Uncoupled male vessel simulations showing cell 1, cell 50, and cell 100 at a baseline membrane potential of –45 mV. (C) Composite female (blue trace) and male (black trace) membrane potential of 400 coupled smooth muscle cells connected with gap junctional resistance of 71.4 Ω cm2 in a one-dimensional tissue representation. (D) Sharp-electrode records of the membrane potential of smooth muscle in pressurized (80 mmHg) female and male arteries from O’Dwyer et al., 2020.
Figure 9
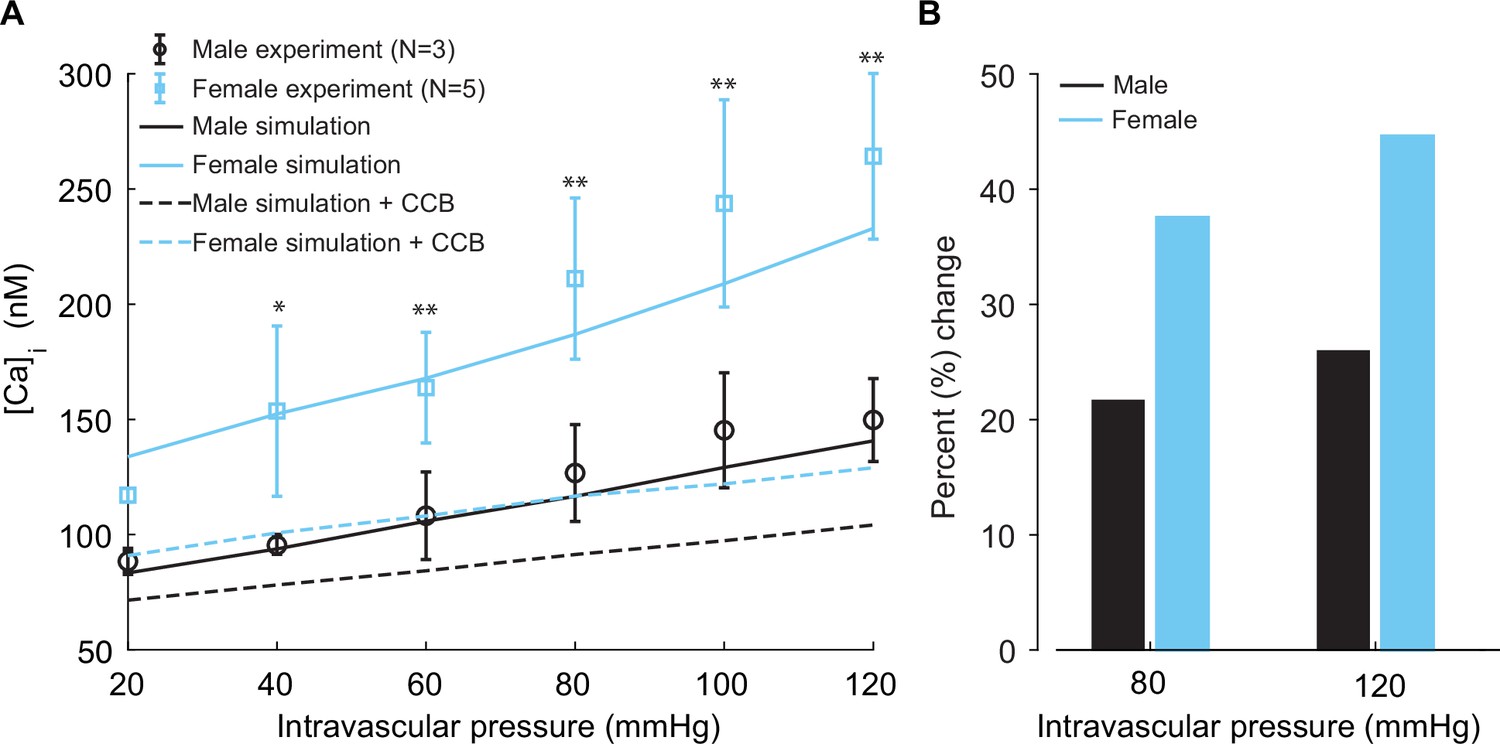
Experimentally measured and modeled intracellular calcium [Ca]i in male and female vessels and response to clinically used L-type Ca2+ channel blocker.
(A) Intracellular calcium [Ca]i in female (blue symbols, n=3) and male (black symbols, n=5) arteries at intravascular pressures ranging from 20 to 120 mmHg. Simulations showing [Ca]i in the idealized female and male vessels are shown with blue and black solid lines, respectively. Simulated [Ca]i after the application of clinically used L-type Ca2+ channel blocker nifedipine is shown with dashed lines for male (black) and female (blue). (B) Comparison of the percentage change of [Ca]i in male (black) and female (blue) after the application L-type Ca2+ channel blocker nifedipine at 80 mmHg and 120 mmHg. *p<0.05, **p<0.01.
Additional files
Download links
A two-part list of links to download the article, or parts of the article, in various formats.
Downloads (link to download the article as PDF)
Open citations (links to open the citations from this article in various online reference manager services)
Cite this article (links to download the citations from this article in formats compatible with various reference manager tools)
A computational model predicts sex-specific responses to calcium channel blockers in mammalian mesenteric vascular smooth muscle
eLife 12:RP90604.
https://doi.org/10.7554/eLife.90604.3


