A suite of selective pressures supports the maintenance of alleles of a Drosophila immune peptide
- Department of Molecular Biosciences, University of Kansas, United States
- Department of Entomology, Cornell University, United States
- Department of Ecology and Evolutionary Biology, University of Kansas, United States
Figures
Figure 1 with 2 supplements

Five-day survival post systemic infection.
Survival after systemic immunity challenge with the following bacteria: (A) P. rettgeri, (B) Staphylococcus succinus, (C) Enterococcus faecalis, (D) Lysinibacillus fusiformis Strain Juneja, (E) Lactococcus lactis, and (F) Serratia marcescens. Each graph represents the combined results of three different infection dates of at least 20 males of each genotype for each date (at least 60 total). Significance is relative to dptS69 (red line) using Cox proportional hazards regression model. *p<0.05, **p<0.01, ***p<0.001. Each sample n>60 per genotype.
Figure 1—figure supplement 1
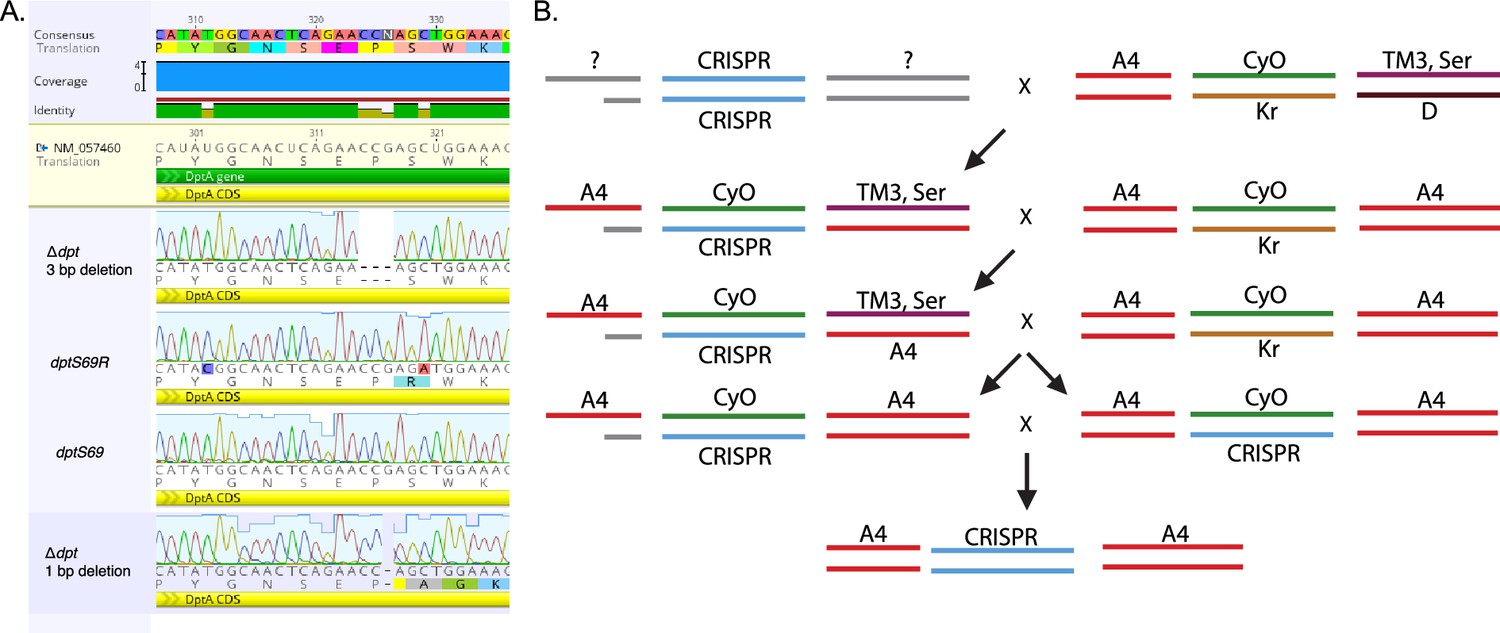
CRISPR/Cas9 genome editing of the dpt locus.
(A) Alignment of CRISPR/Cas9 genome-edited lines. CRISPR/Cas9 genome-edited lines aligned to consensus sequence. Genotype/line name is indicated on the left-hand side of the figure. (B) Crossing schematic for CRISPR cleanup. A modified Bloomington stock # 7198 was used for CRISPR injections. The line contained CyO/Kruppel balanced on the second chromosome, and serrate/Dichaete balanced on the third chromosome. Our version, 7198A4, was provided by Stuart Macdonald and has the DSPR (King et al., 2012) A4 line’s X chromosome instead of the w[*] from the original 7198.
Figure 1—figure supplement 2
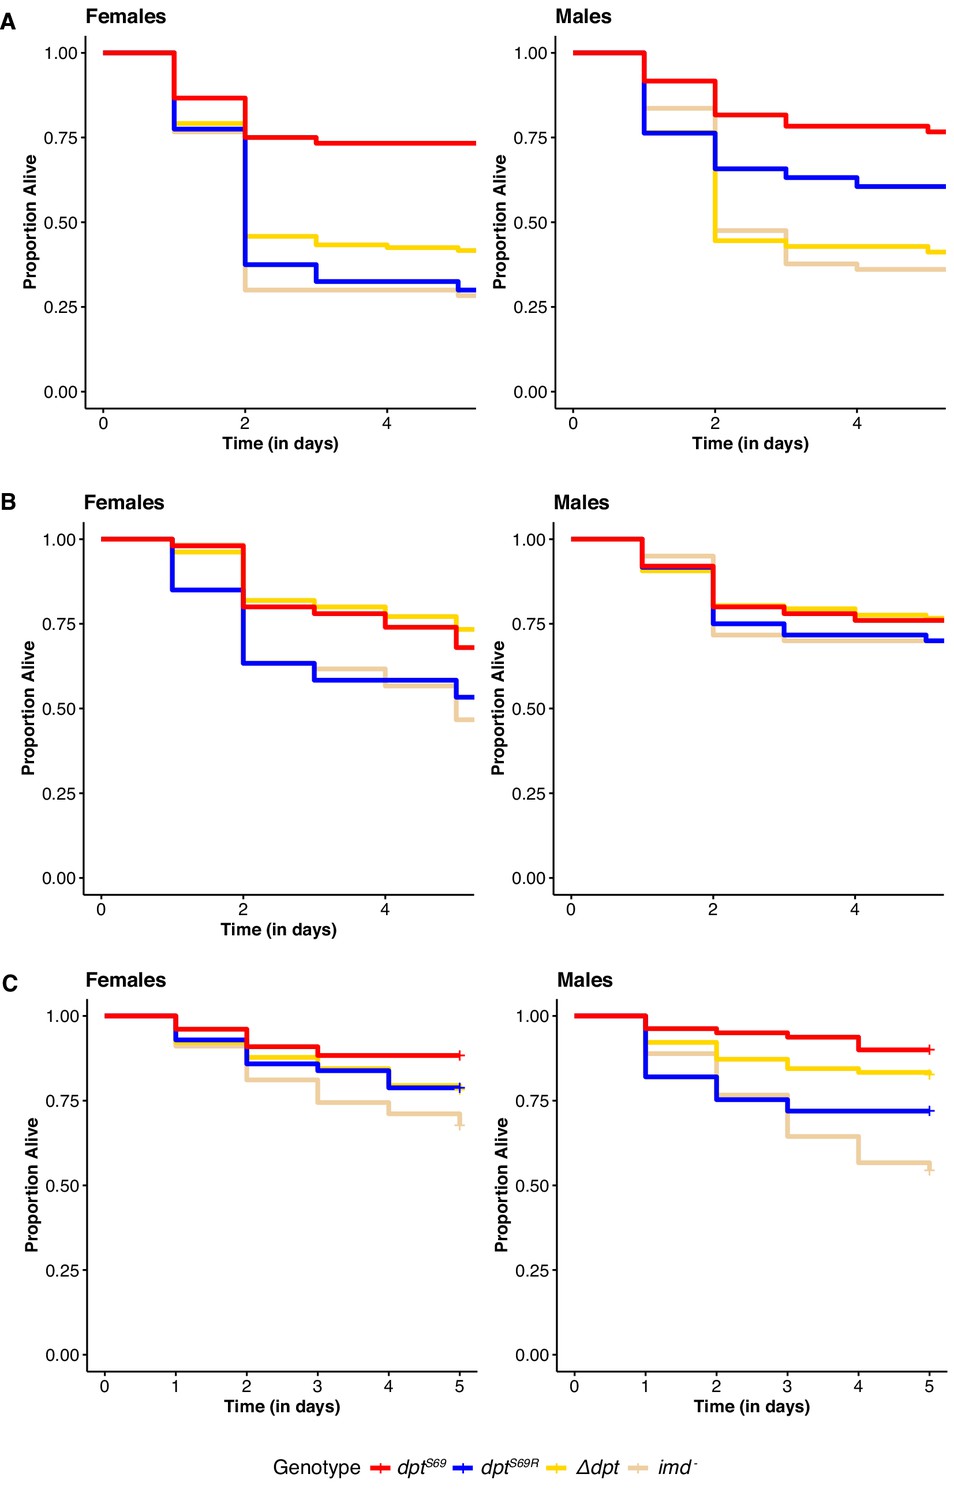
Male vs. female survival after systemic infection.
Systemic infections were repeated with females and males. (A) P. rettgeri and (B) E. faecalis are normal systemic infection bacteria in Drosophila. (C) L. plantarum was used to test differences in systemic based on sex based on the results from gnotobiotic longevity. Each sample n>60 per genotype.
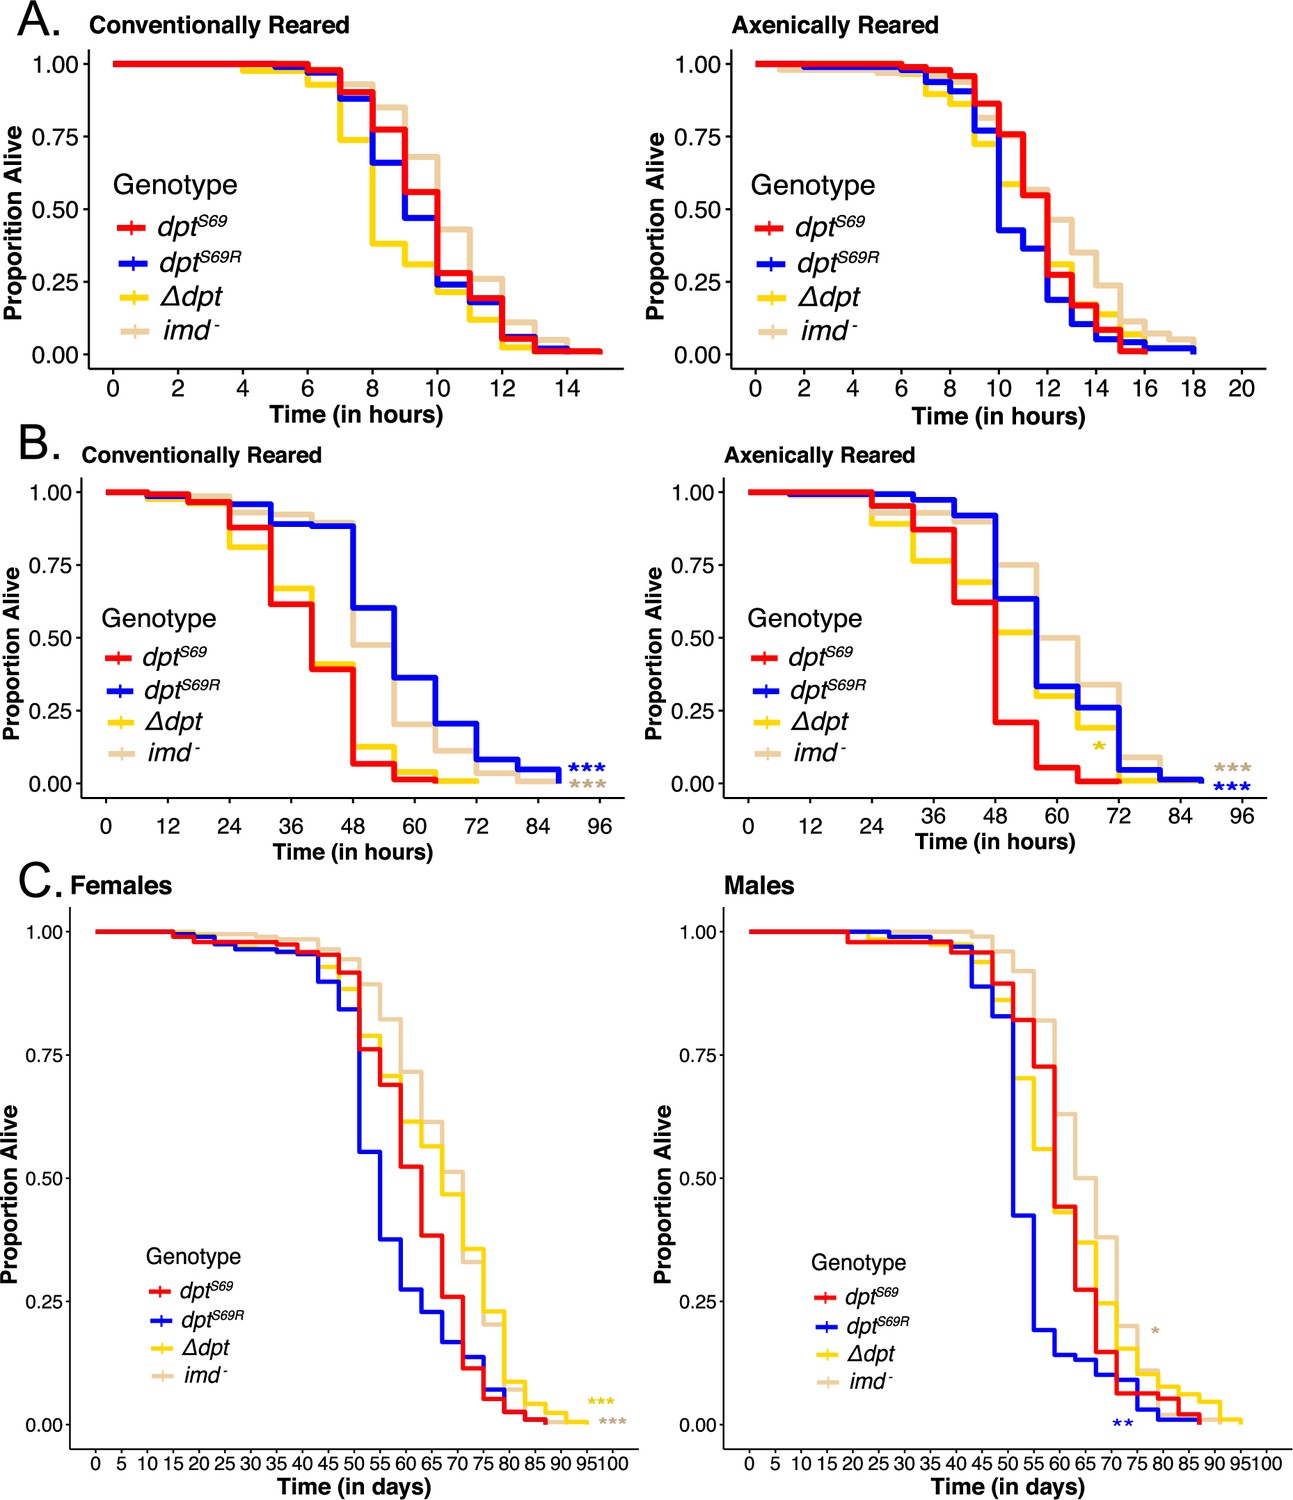
Figure 2 with 2 supplements
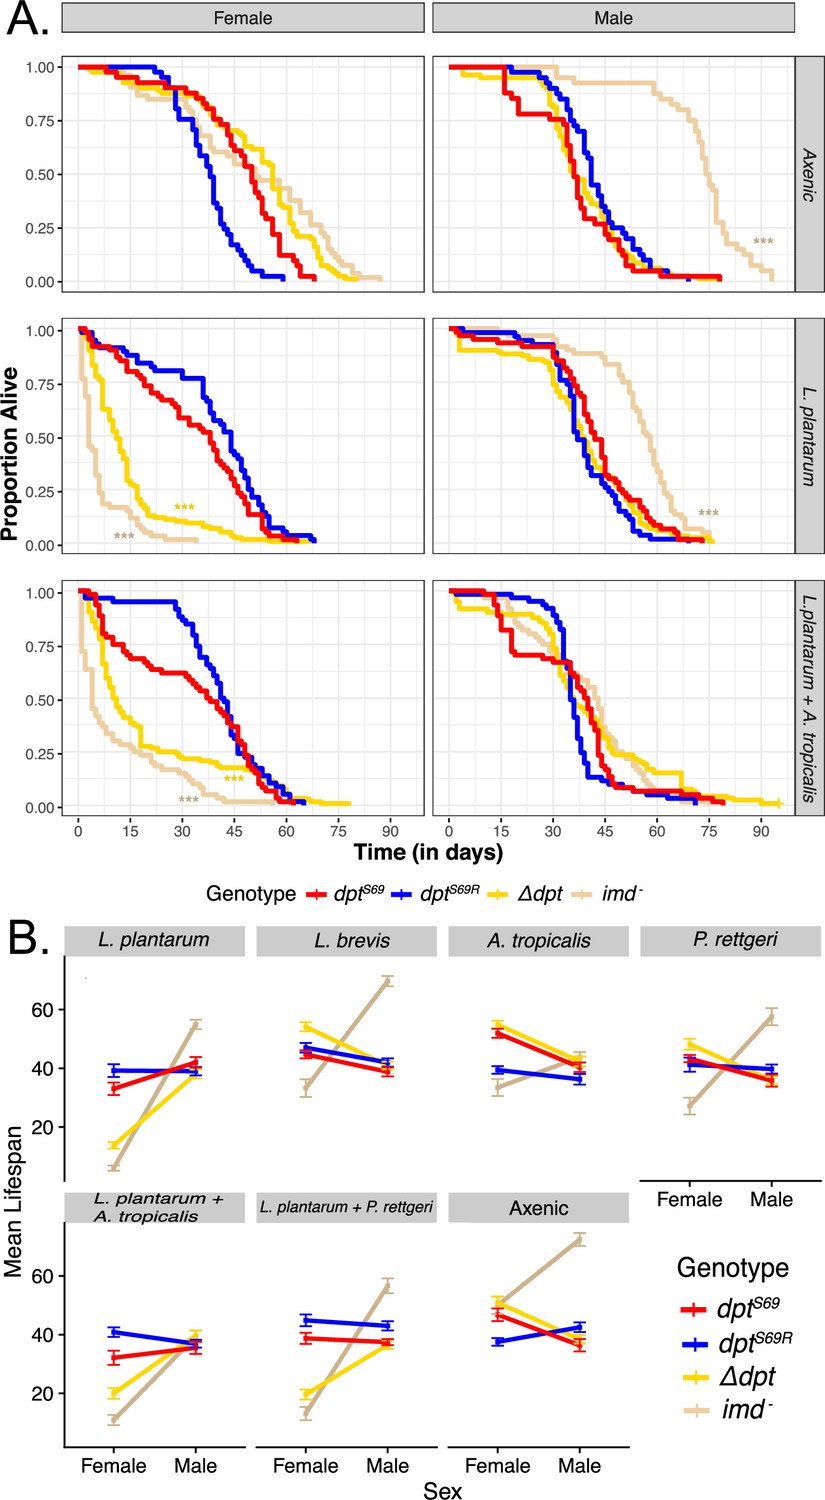
Axenic and gnotobiotic lifespan.
(A) Survival plots for axenic flies and gnotobiotic flies mono-associated with L. plantarum or poly-associated with L. plantarum and A. tropicalis. Each curve represents 60 flies from 3 replicates of 20 flies. Significance is shown in comparison to SS (red line) using the model Lifespan~(Genotype*Sex)/Vial + Block. (B) Mean lifespan was plotted against each sex and separated by bacterial association. Axenic flies have no bacterial association. Each point for each sex in a combination of 3 separate trials of 20 flies for a total of 60 flies. These interaction plots only have mean lifespan and thus are useful for seeing all the data at a glance. Error bars are mean plus or minus the standard error of the mean. *p<0.05, **p<0.01, ***p<0.001.
Figure 2—figure supplement 1
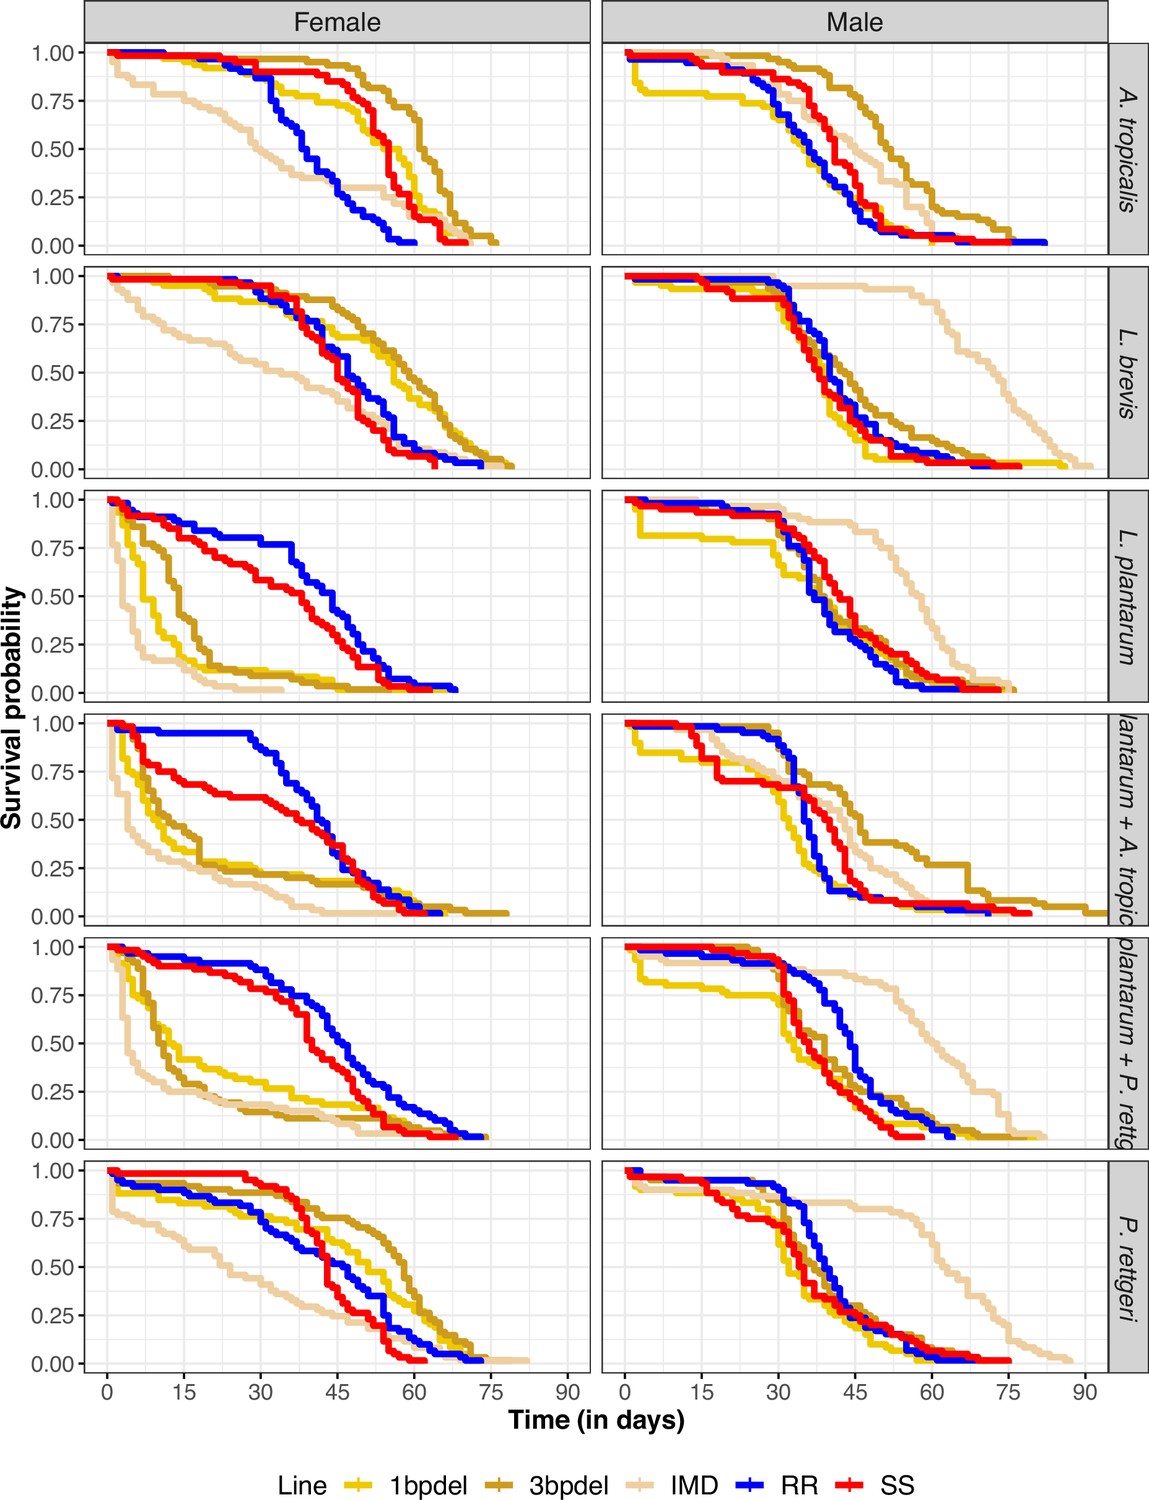
Gnotobiotic longevity.
Survival plots of all bacteria. Dpt null lines have been separated into the two lines used, 1 base pair deletion and 3 bp deletion.
Figure 2—figure supplement 2
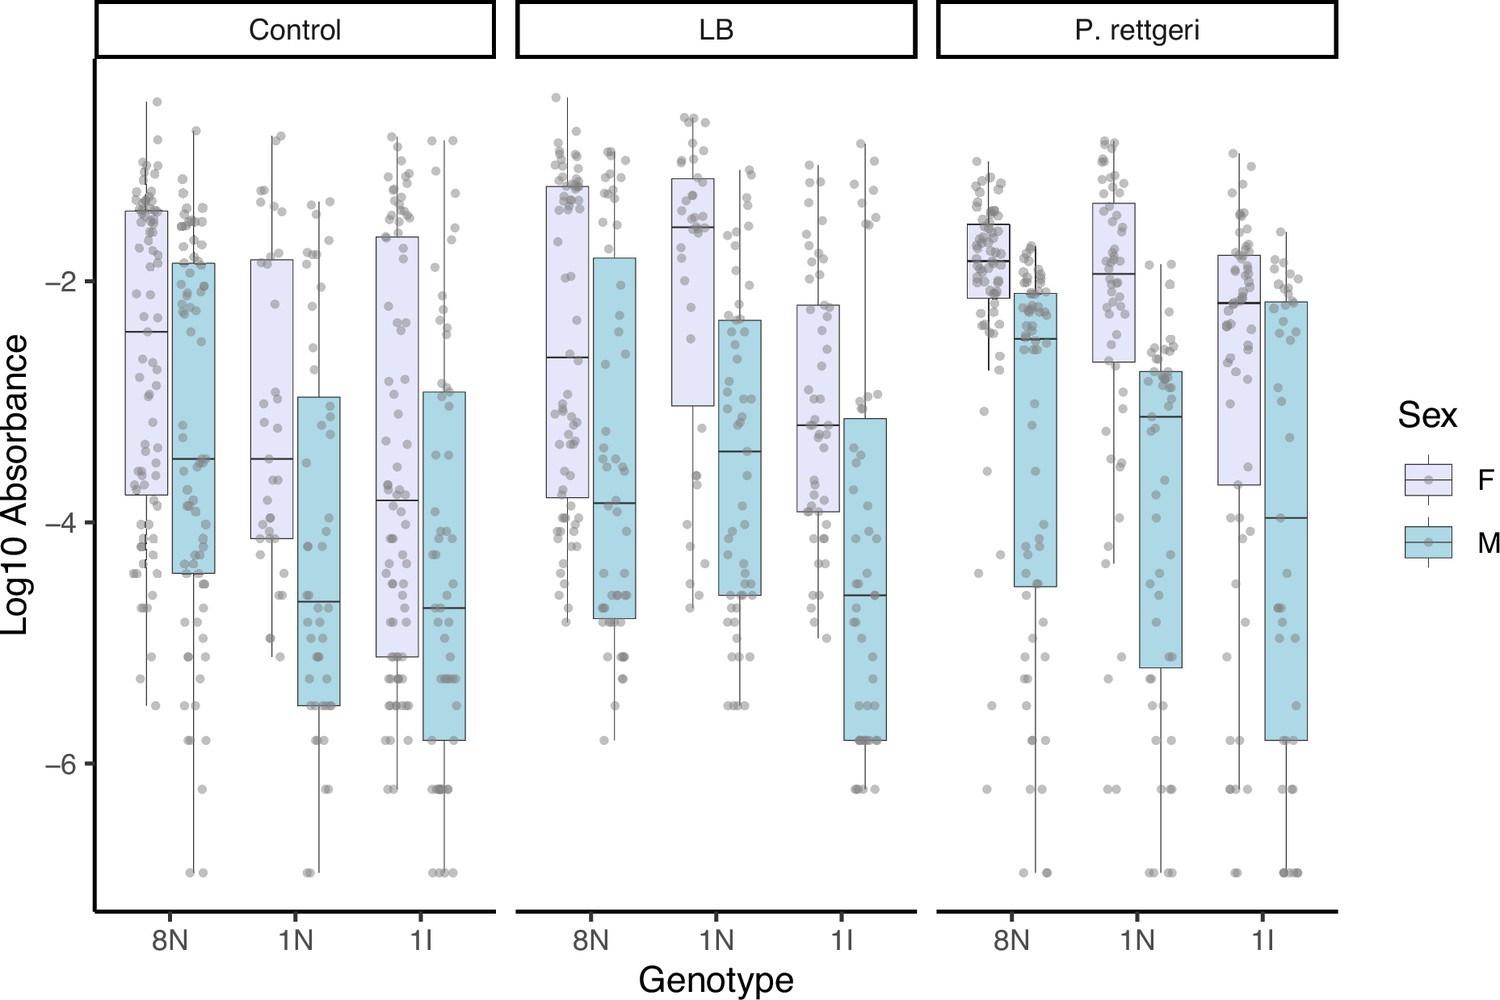
Feeding rates.
Female flies eat more food (as measured by blue dye ingestion) than males, but genotype also influences feeding. Each genotype has more than 100 individuals per treatment per sex. Control refers to no added media, LB media is the addition of sterile MB, and P. rettgeri is the addition of P. rettgeri at a concentration of OD600=15 (±1). Absorbance was measured at 630 nm. Boxes represent 25th and 75th percentiles with the median denoted as a horizontal line in the middle of the box. Whiskers represent minimum and maximum of the data.
Figure 3 with 2 supplements
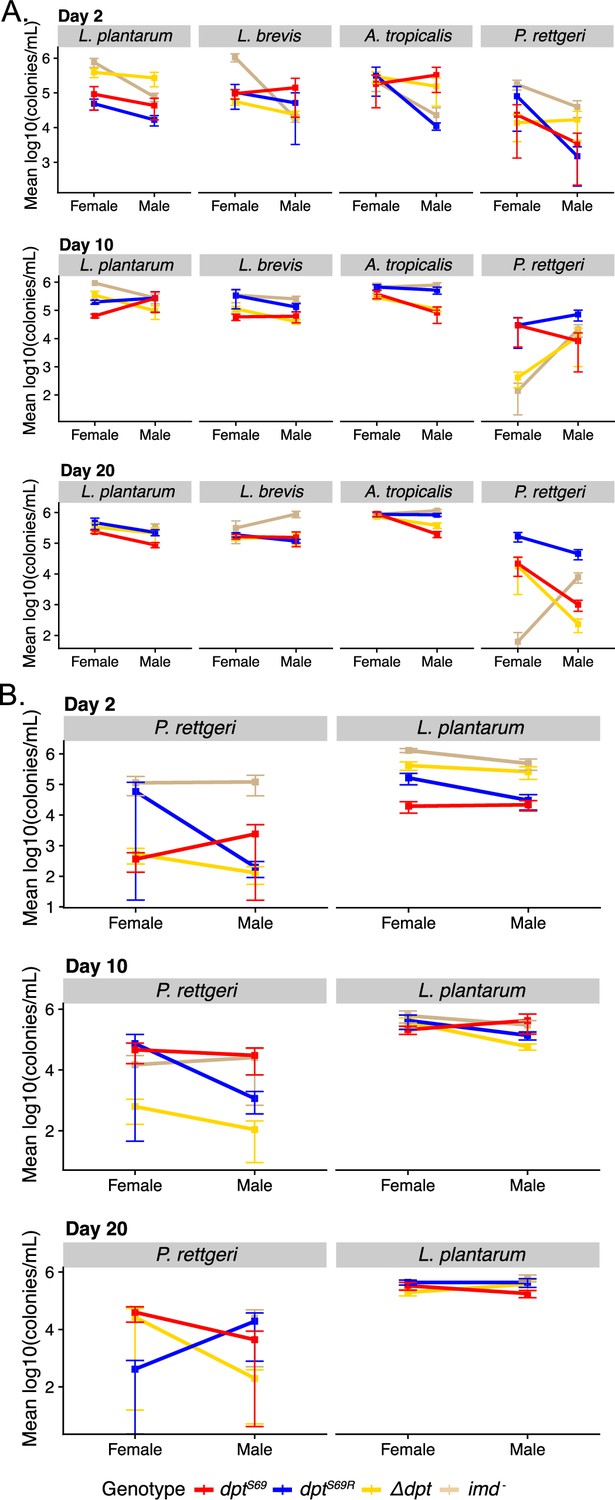
Bacterial load interaction plots for day 2, 10, and 20 post association with various microbes.
Two-day-old flies were placed on food seeded with a bacterial suspension of each bacteria at an OD600 of 15. Each point for each sex is from 3 separate trials of 2 samples of 3 flies each for a total of 6 samples per point. (A) Mono-associations where each plot represents a different condition, (B) poly-associations where each row plots both the P. rettgeri and L. plantarum load from the same flies but were plated on LB and De Man, Rogosa, and Sharpe (MRS), respectively. Error bars are mean plus or minus the standard error of the mean.
Figure 3—figure supplement 1
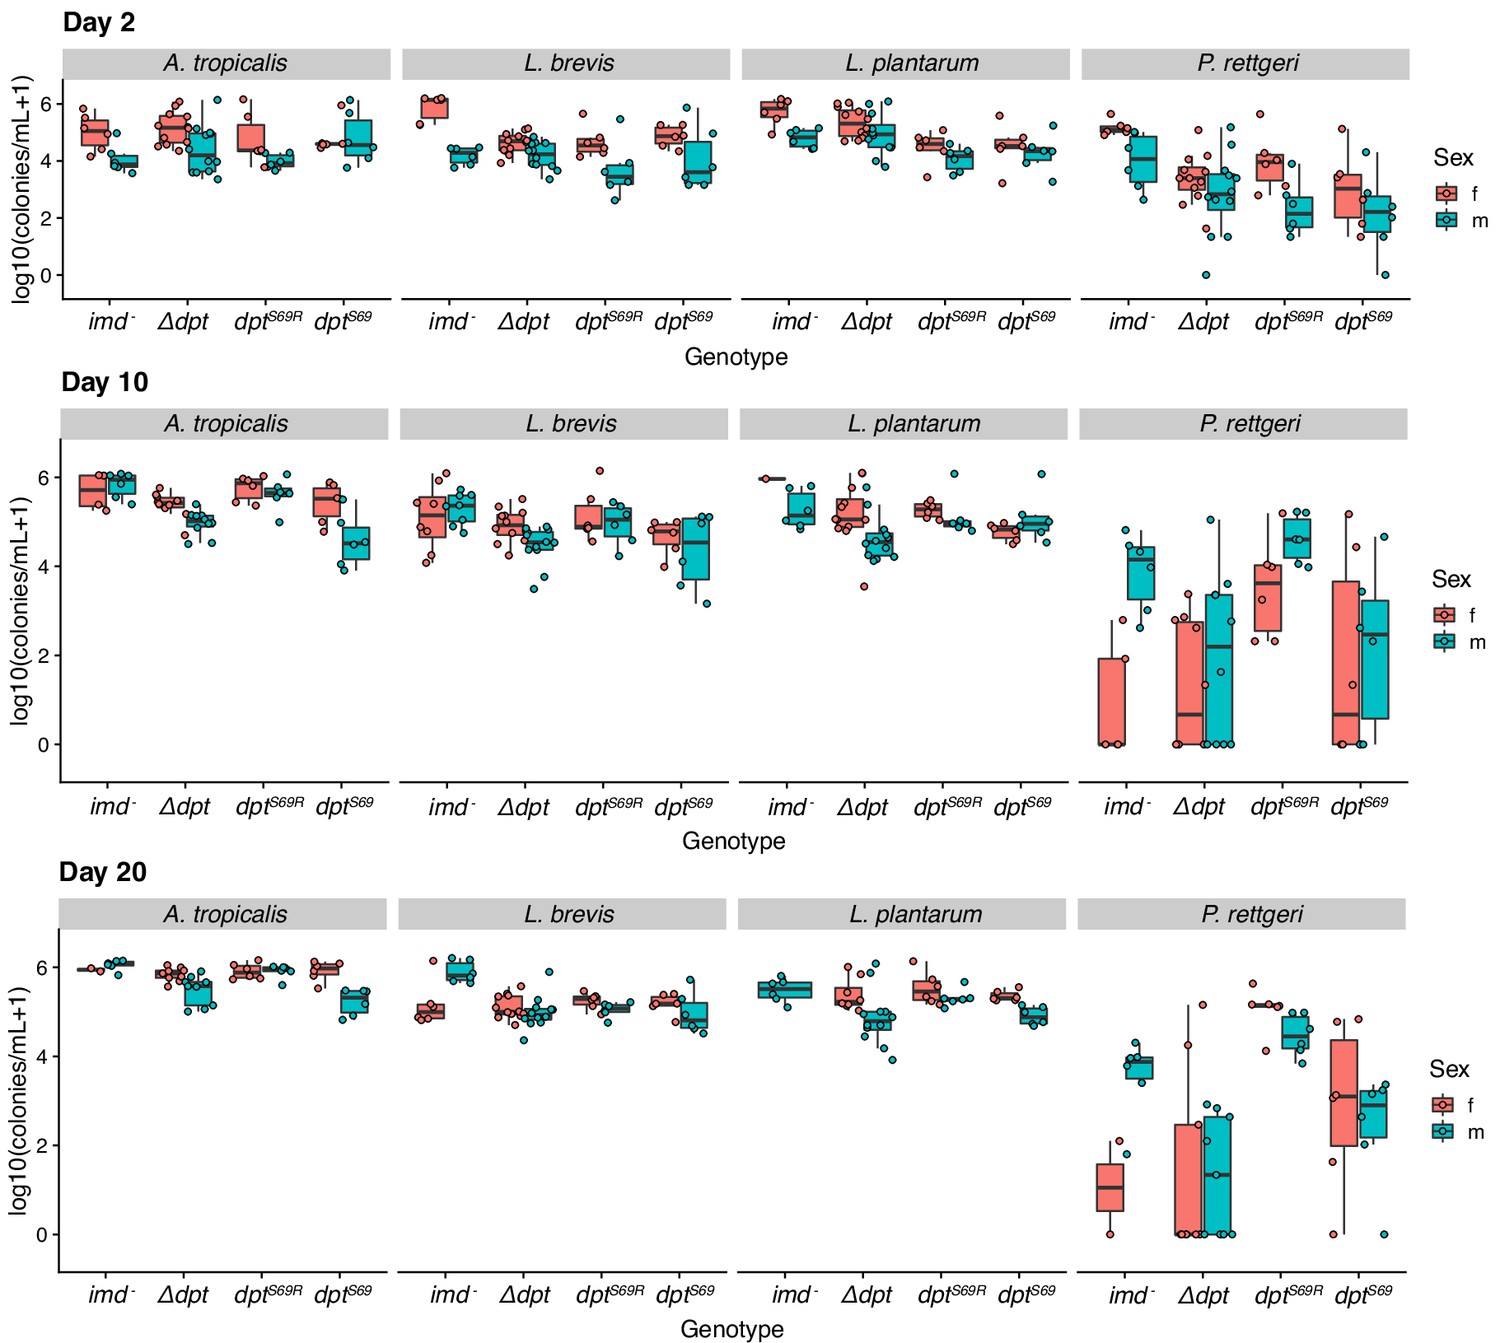
Bacterial load at day 2, 10, and 20 days post feeding.
All bacteria were plated on De Man, Rogosa, and Sharpe (MRS) media except for P. rettgeri, which was plated on LB media to grow colonies. Significance can be found in Supplementary file 5. Individual points represent a pool of 3 flies. There is no imd- female bar for L. plantarum on day 20 because all female flies had died at this time point. Boxes represent 25th and 75th percentiles with the median denoted as a horizontal line in the middle of the box. Whiskers represent minimum and maximum of the data.
Figure 3—figure supplement 2
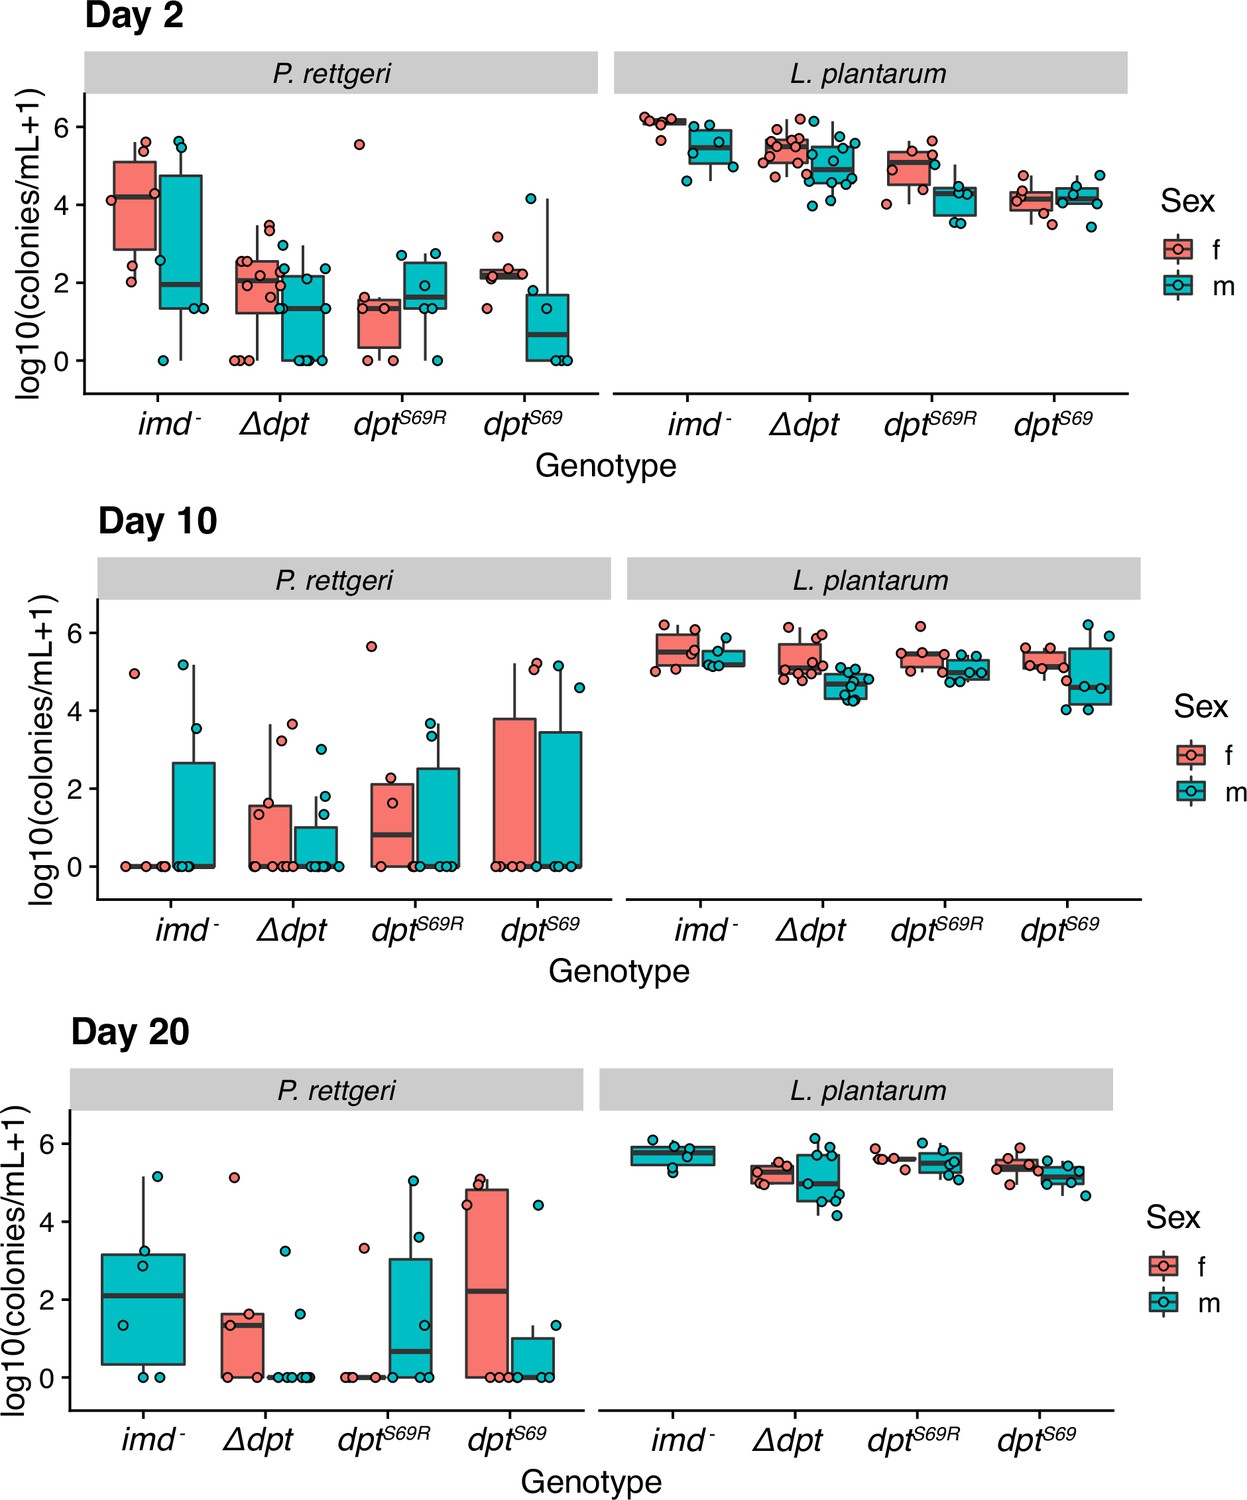
Bacterial load of L. plantarum and P. rettgeri poly-association.
The flies were co-fed with L. plantarum and P. rettgeri and plated on De Man, Rogosa, and Sharpe (MRS) and LB, respectively, to select for the different bacteria. There is no imd- female bar on day 20 because all flies had died at this time point. Significance can be found in Supplementary file 6. Boxes represent 25th and 75th percentiles with the median denoted as a horizontal line in the middle of the box. Whiskers represent minimum and maximum of the data.
Figure 4 with 3 supplements
Dpt genotype is associated with variation in some life history traits.
(A) Conventionally and axenically reared male flies desiccation resistance (N>90 for each line apart from Δdpt line). There is no significance between dptS69 (red line) and other genotypes. (B) Conventionally and axenically reared male flies starvation resistance (N>90 for each line apart from Δdpt line). (C) Female and male lifespan for conventionally reared flies. N>93 for each line and sex. Significance is shown in relation to dptS69 (red line). Note that axenic longevity is shown in Figure 2. *p<0.05, **p<0.01, ***p<0.001.
Figure 4—figure supplement 1
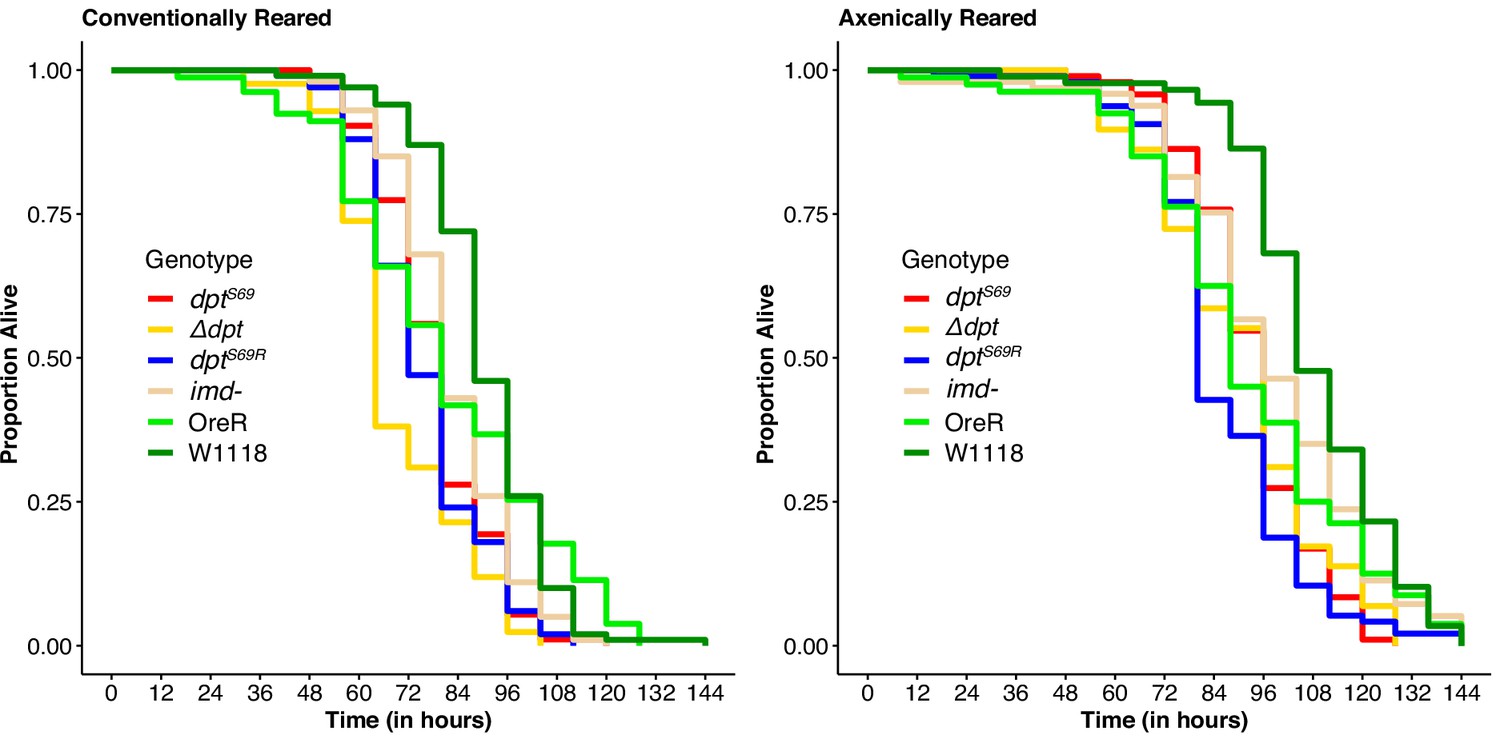
Desiccation stress survival with additional wildtype lines (OreR and W1118).
OreR and W1118 are standard D. melanogaster lab stocks. They are both homozygous serine but have different resistance to desiccation stress than dptS69.
Figure 4—figure supplement 2
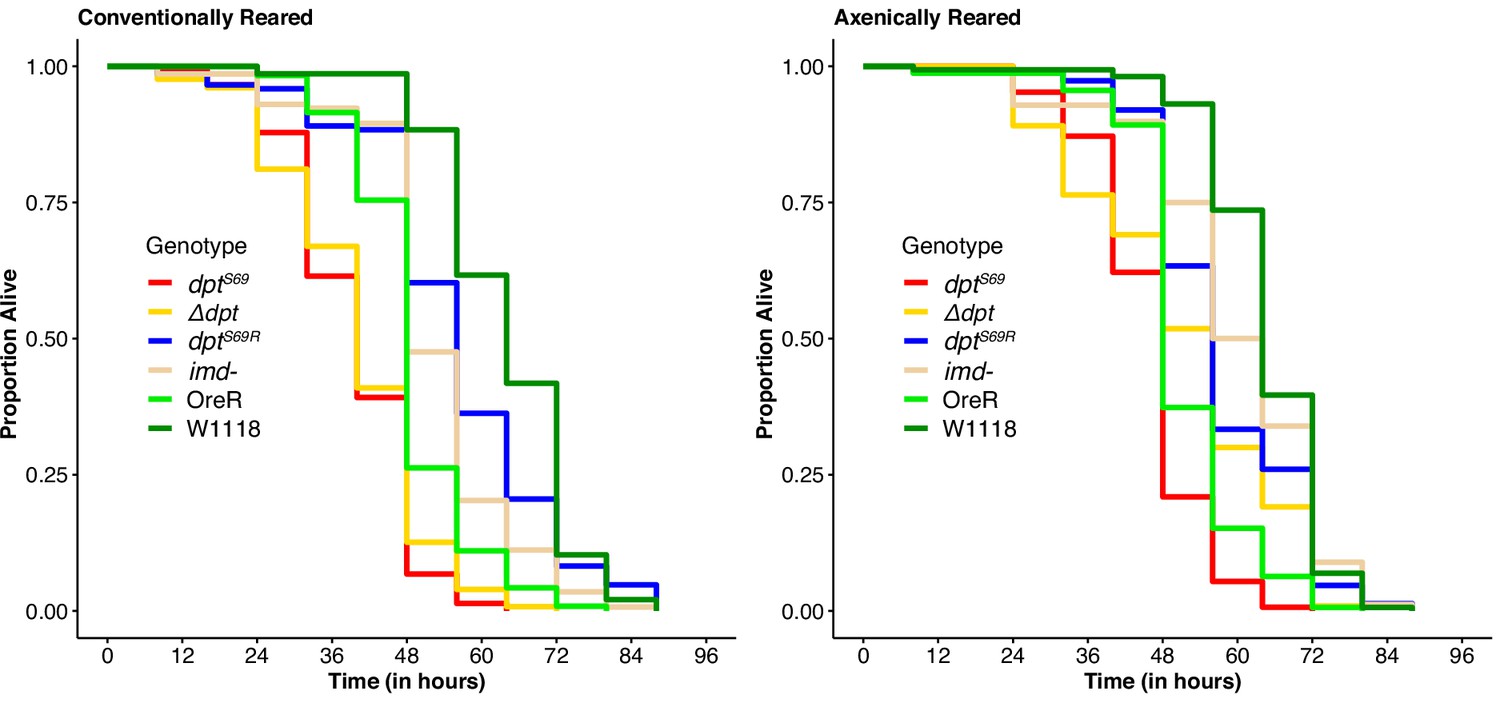
Starvation with additional wildtype lines (OreR and w1118).
OreR and W1118 are standard D. melanogaster lab stocks. They are both homozygous serine but have different resistance to starvation stress than dptS69.
Figure 4—figure supplement 3
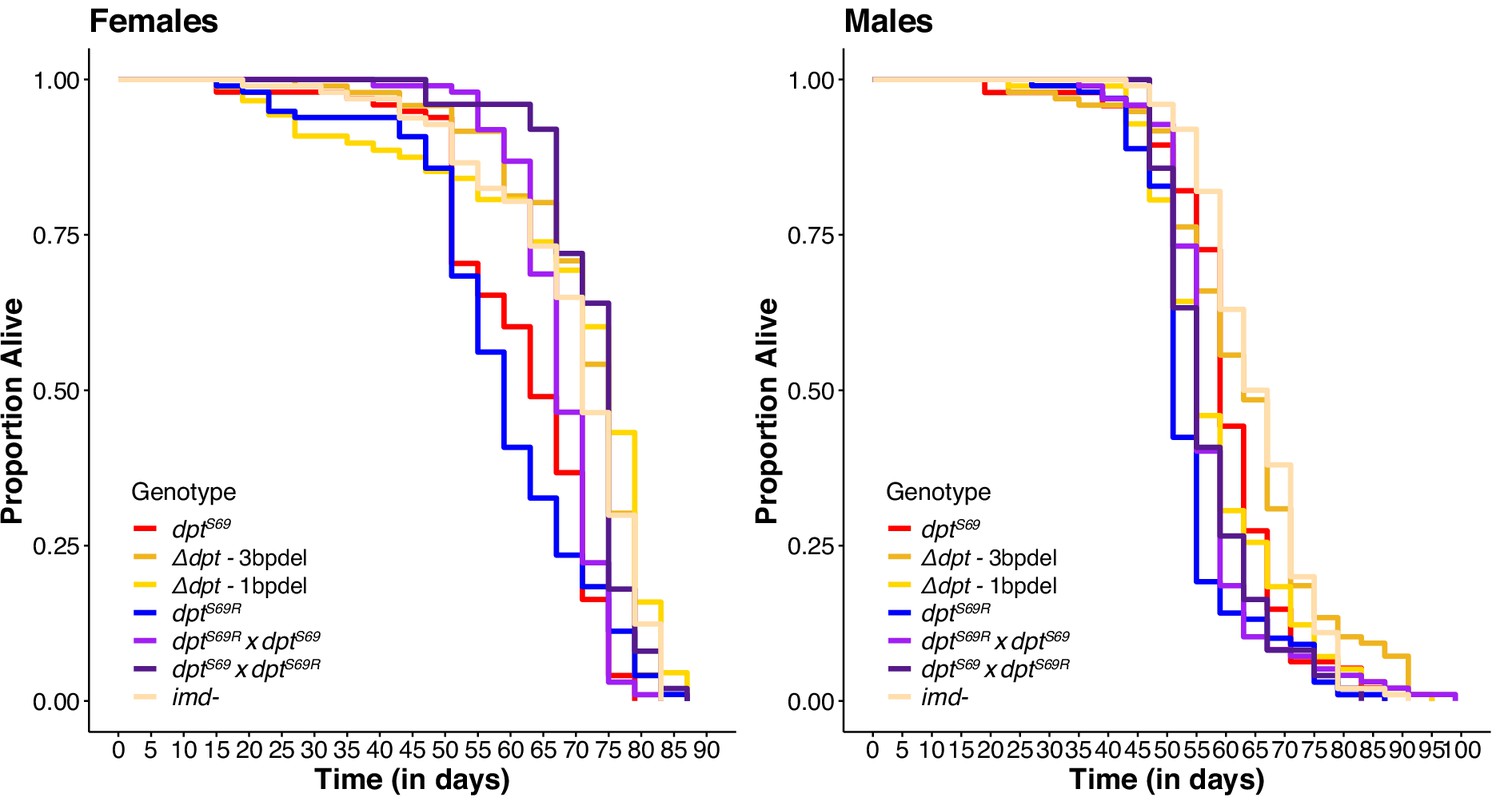
Longevity with separated Δdpt lines and heterozygotes.
Two Δdpt lines were used. One with a 1 base pair deletion and the other with a 3 base pair deletion. These lines were combined for ease of viewing in Figure 4C. Heterozygotes were made with reciprocal crosses.
Figure 5
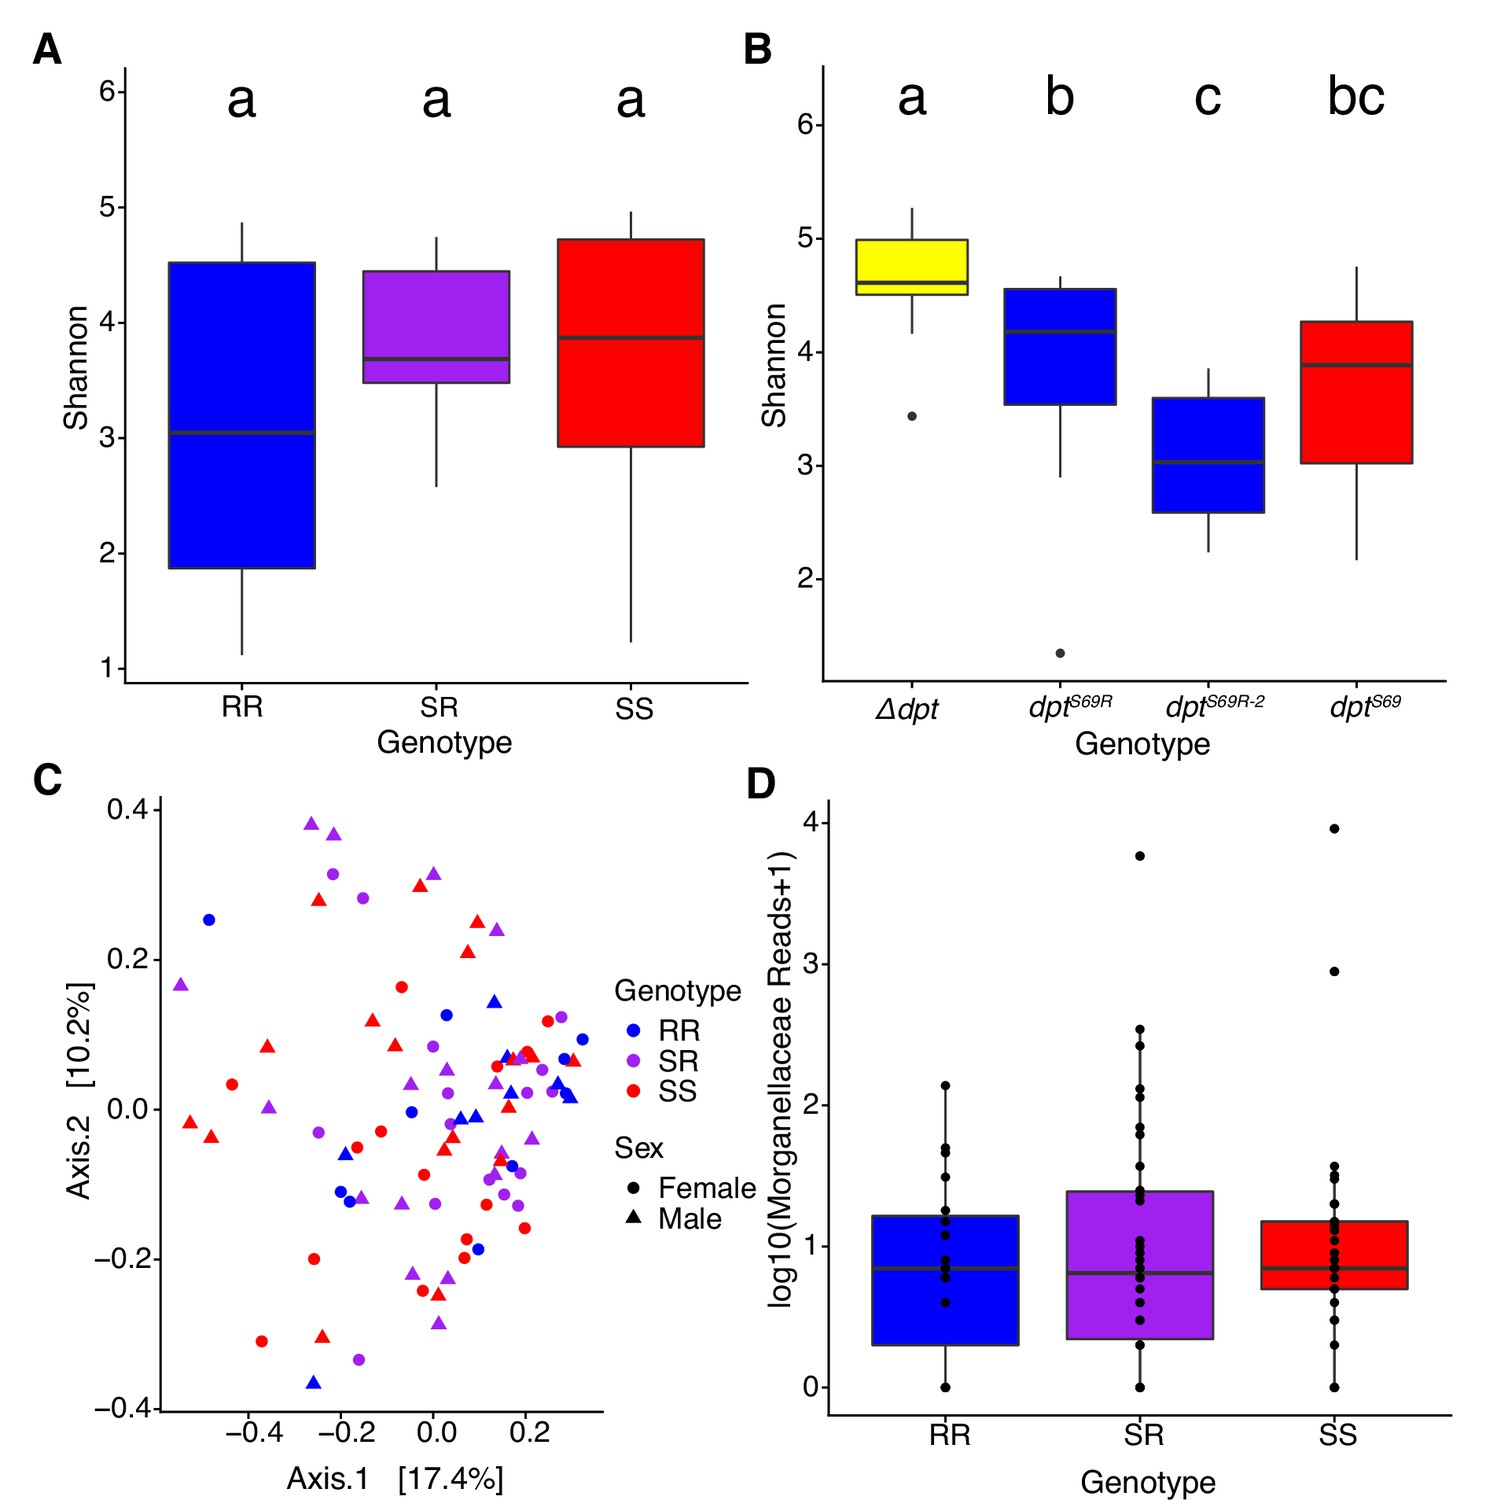
The influence of Dpt genotype on the gut microbiota.
(A) Shannon diversity of flies co-reared in cages. (B) Shannon diversity of individual genotypes reared in vials. (C) Bray-Curtis dissimilarity of wild-caught flies. (D) Differential abundance of Morganellaceae in wild-caught flies. Different letters show significance based on post hoc Tukey’s test, p<0.05. Boxes represent 25th and 75th percentiles with the median denoted as a horizontal line in the middle of the box. Whiskers represent minimum and maximum of the data.
Additional files
-
MDAR checklist
- https://cdn.elifesciences.org/articles/90638/elife-90638-mdarchecklist1-v1.pdf
-
Supplementary file 1
Oligonucleotide sequences used in this study.
- https://cdn.elifesciences.org/articles/90638/elife-90638-supp1-v1.xlsx
-
Supplementary file 2
Cox proportional hazard pairwise significance p-values for systemic infection.
p-Values less than 0.05 are underlined.
- https://cdn.elifesciences.org/articles/90638/elife-90638-supp2-v1.xlsx
-
Supplementary file 3
Cox proportional hazard ratio pairwise p-values for systemic infections with males and females.
p-Values less than 0.05 are underlined.
- https://cdn.elifesciences.org/articles/90638/elife-90638-supp3-v1.xlsx
-
Supplementary file 4
p-Values from Tukey’s HSD for axenic and gnotobiotic longevity.
p-Values less than 0.05 are underlined.
- https://cdn.elifesciences.org/articles/90638/elife-90638-supp4-v1.xlsx
-
Supplementary file 5
p-Values from Tukey’s HSD for bacteria load.
p-Values less than 0.05 are underlined.
- https://cdn.elifesciences.org/articles/90638/elife-90638-supp5-v1.xlsx
-
Supplementary file 6
p-Values from Tukey’s HSD for bacterial load from poly-association with L. plantarum and P. rettgeri.
p-Values less than 0.05 are underlined.
- https://cdn.elifesciences.org/articles/90638/elife-90638-supp6-v1.xlsx
-
Supplementary file 7
Desiccation resistance Tukey’s HSD p-values.
p-Values less than 0.05 are underlined. ‘A’ refers to flies reared axenically, ‘C’ refers to flies reared on a conventional diet.
- https://cdn.elifesciences.org/articles/90638/elife-90638-supp7-v1.xlsx
-
Supplementary file 8
Starvation resistance Tukey’s HSD p-values.
p-Values less than 0.05 are underlined. ‘A’ refers to flies reared axenically, ‘C’ refers to flies reared on a conventional diet.
- https://cdn.elifesciences.org/articles/90638/elife-90638-supp8-v1.xlsx
-
Supplementary file 9
Conventional longevity Cox proportional hazards regression p-values.
p-Values less than 0.05 are underlined. ‘F’ and ‘M’ refer to males and females, respectively; ‘het’ refers to heterozygotes for serine/arginine.
- https://cdn.elifesciences.org/articles/90638/elife-90638-supp9-v1.xlsx
-
Supplementary file 10
Genotyped wild-caught D. melanogaster.
Counts of serine/arginine polymorphism genotypes for wild-caught D. melanogaster including Wolbachia infection status and sex.
- https://cdn.elifesciences.org/articles/90638/elife-90638-supp10-v1.xlsx
Download links
A two-part list of links to download the article, or parts of the article, in various formats.
Downloads (link to download the article as PDF)
Open citations (links to open the citations from this article in various online reference manager services)
Cite this article (links to download the citations from this article in formats compatible with various reference manager tools)
A suite of selective pressures supports the maintenance of alleles of a Drosophila immune peptide
eLife 12:RP90638.
https://doi.org/10.7554/eLife.90638.3


