CryoEM structures of the human CLC-2 voltage-gated chloride channel reveal a ball-and-chain gating mechanism
- Department of Molecular and Cellular Physiology, Stanford University, United States
- Department of Chemistry, Stanford University, United States
- Department of Computer Science, Stanford University, United States
- Department of Structural Biology, Stanford University, United States
- Institute for Computational and Mathematical Engineering, Stanford University, United States
- Division of CryoEM and Bioimaging, SSRL, SLAC National Accelerator Laboratory, Stanford University, United States
- Department of Bioengineering and Department of Microbiology and Immunology, Stanford University, United States
Figures
Figure 1
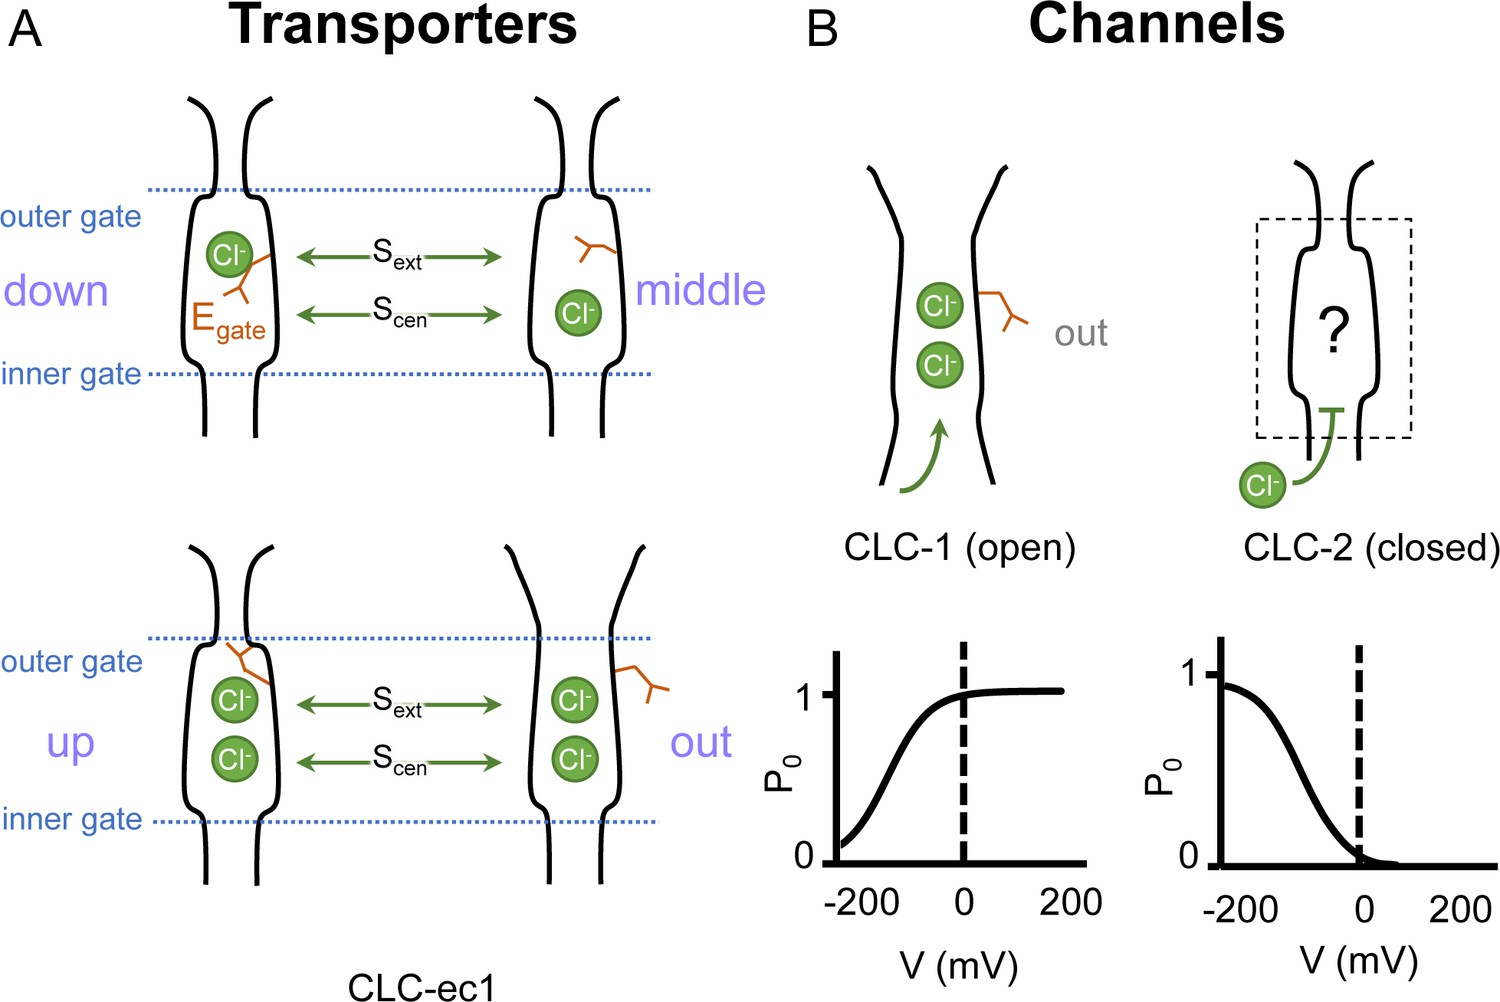
Gating conformations in CLC transporters and channels.
(A) Cartoon depictions of the CLC anion permeation pathway. The ‘gating glutamate’ (Egate) can occupy anion-binding sites within the permeation pathway (‘down’ and ‘middle’ conformations, occupying the central (Scen) and external (Sext) anion-binding sites, respectively) or away from these sites (‘up’ and ‘out’ conformations). Coupling of Egate movement to Cl−/H+ binding/unbinding and global conformational change generates 2:1 Cl−/H+ exchange. (B) Egate is required for voltage-dependent gating in CLC channels but cryoEM density for this residue has been observed only in CLC-1 (PDB ID: 6coy), in the ‘out’ position. In contrast to CLC-1, which is predominantly open at zero mV, CLC-2 is predominantly closed. The open probability (Po) versus voltage (V) traces were drawn based on published data reported for CLC-1 (Lísal and Maduke, 2008) and CLC-2 (Stölting et al., 2013).
Figure 2 with 4 supplements
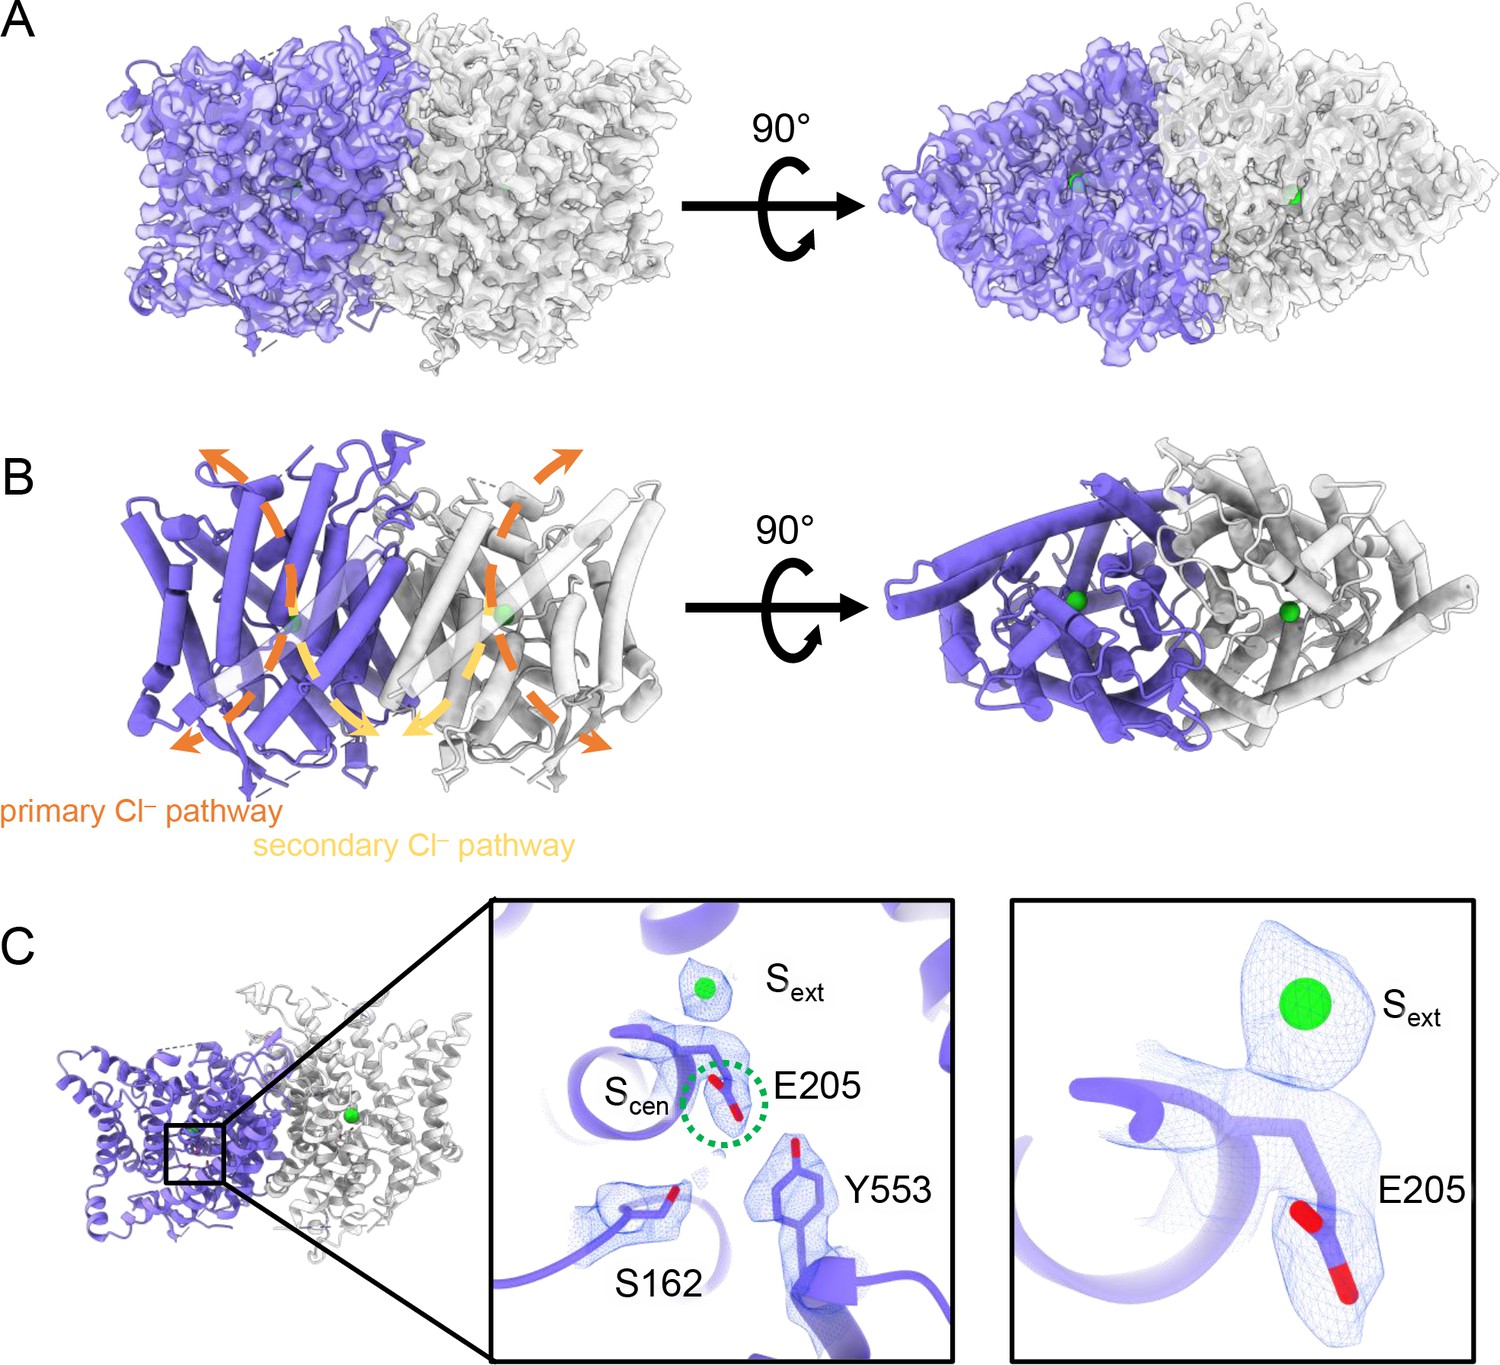
CryoEM structure of the human CLC-2 channel.
Overall structure of the transmembrane domain (CLC2-TM) at 2.46 Å. The identical subunits of the homodimer are shown in purple and gray; Cl− ions are shown as green balls. (A) CryoEM density map with model overlay (contour level: 0.71, 5.5 σ) and (B) model only with dashed arrows indicating the locations of pathways detected by Caver: orange, primary Cl− pathway common to all CLCs; yellow, secondary Cl− pathway detected in CLC-2 and CLC-1. Details of the pathways are presented in Figure 3. The secondary pathway, whose function is not yet known, was so named when first observed in the CLC-1 structure (Park and MacKinnon, 2018). (C) Zoomed-in views showing cryoEM density overlay of bound Cl− and key residues – Egate (E205) and inner-gate residues SerC (S162) and TyrC (Y553). Scen is indicated with a green dashed circle. Contour level: 1.1, 7.2 σ (middle panel); 0.97, 6.3 σ (right panel).
Figure 2—figure supplement 1
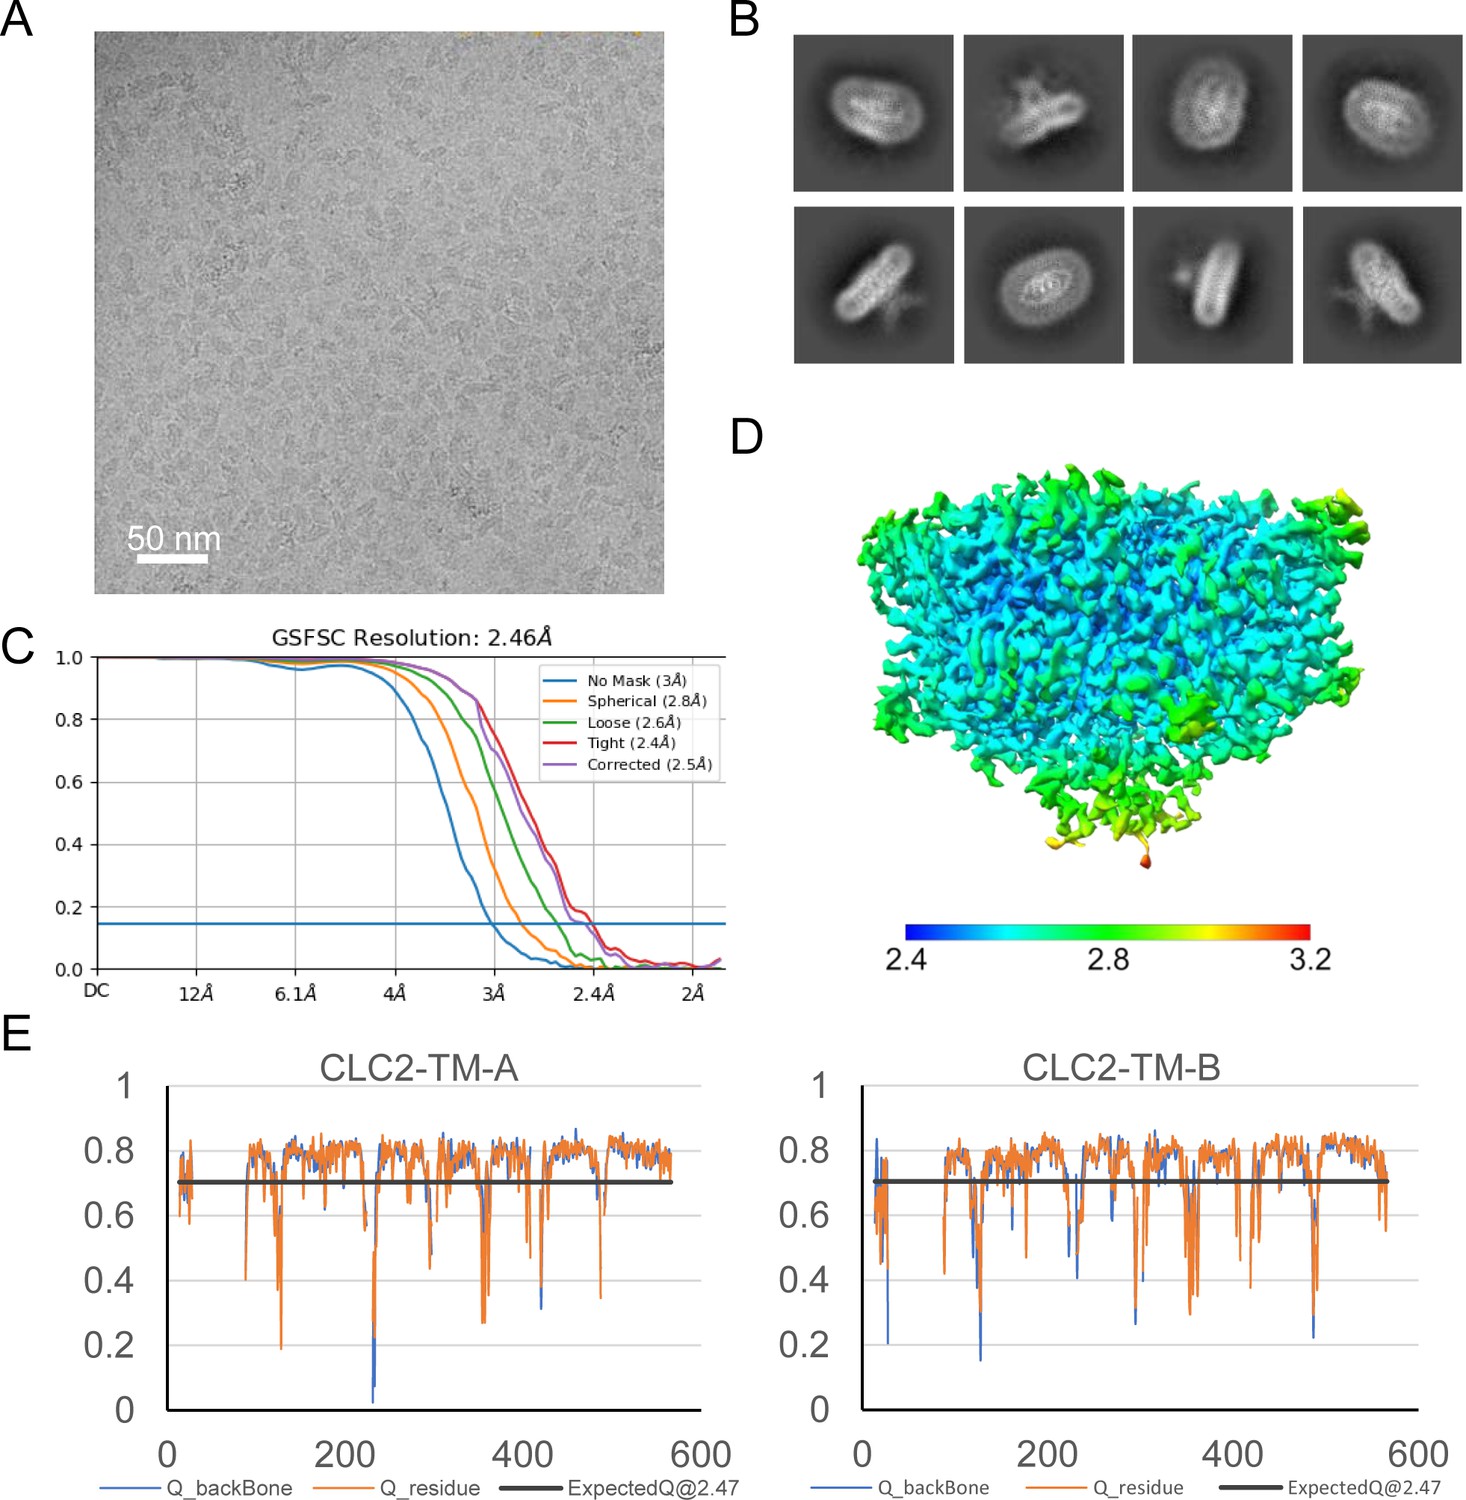
Micrograph, 2D classes, and structure validation of CLC2-TM.
(A) Representative motion-corrected cryoEM micrograph. (B) 2D class averages. (C) Gold standard Fourier shell correlation (FSC) plots calculated in cryoSPARC. (D) Local resolution of the cryoEM map of the CLC2-TM. (E) Model validation using Q-scores (Pintilie et al., 2020) of subunits A (left) and B (right). The black line represents the expected Q-score at respective resolution based on the correlation between Q-scores and map resolution.
Figure 2—figure supplement 2
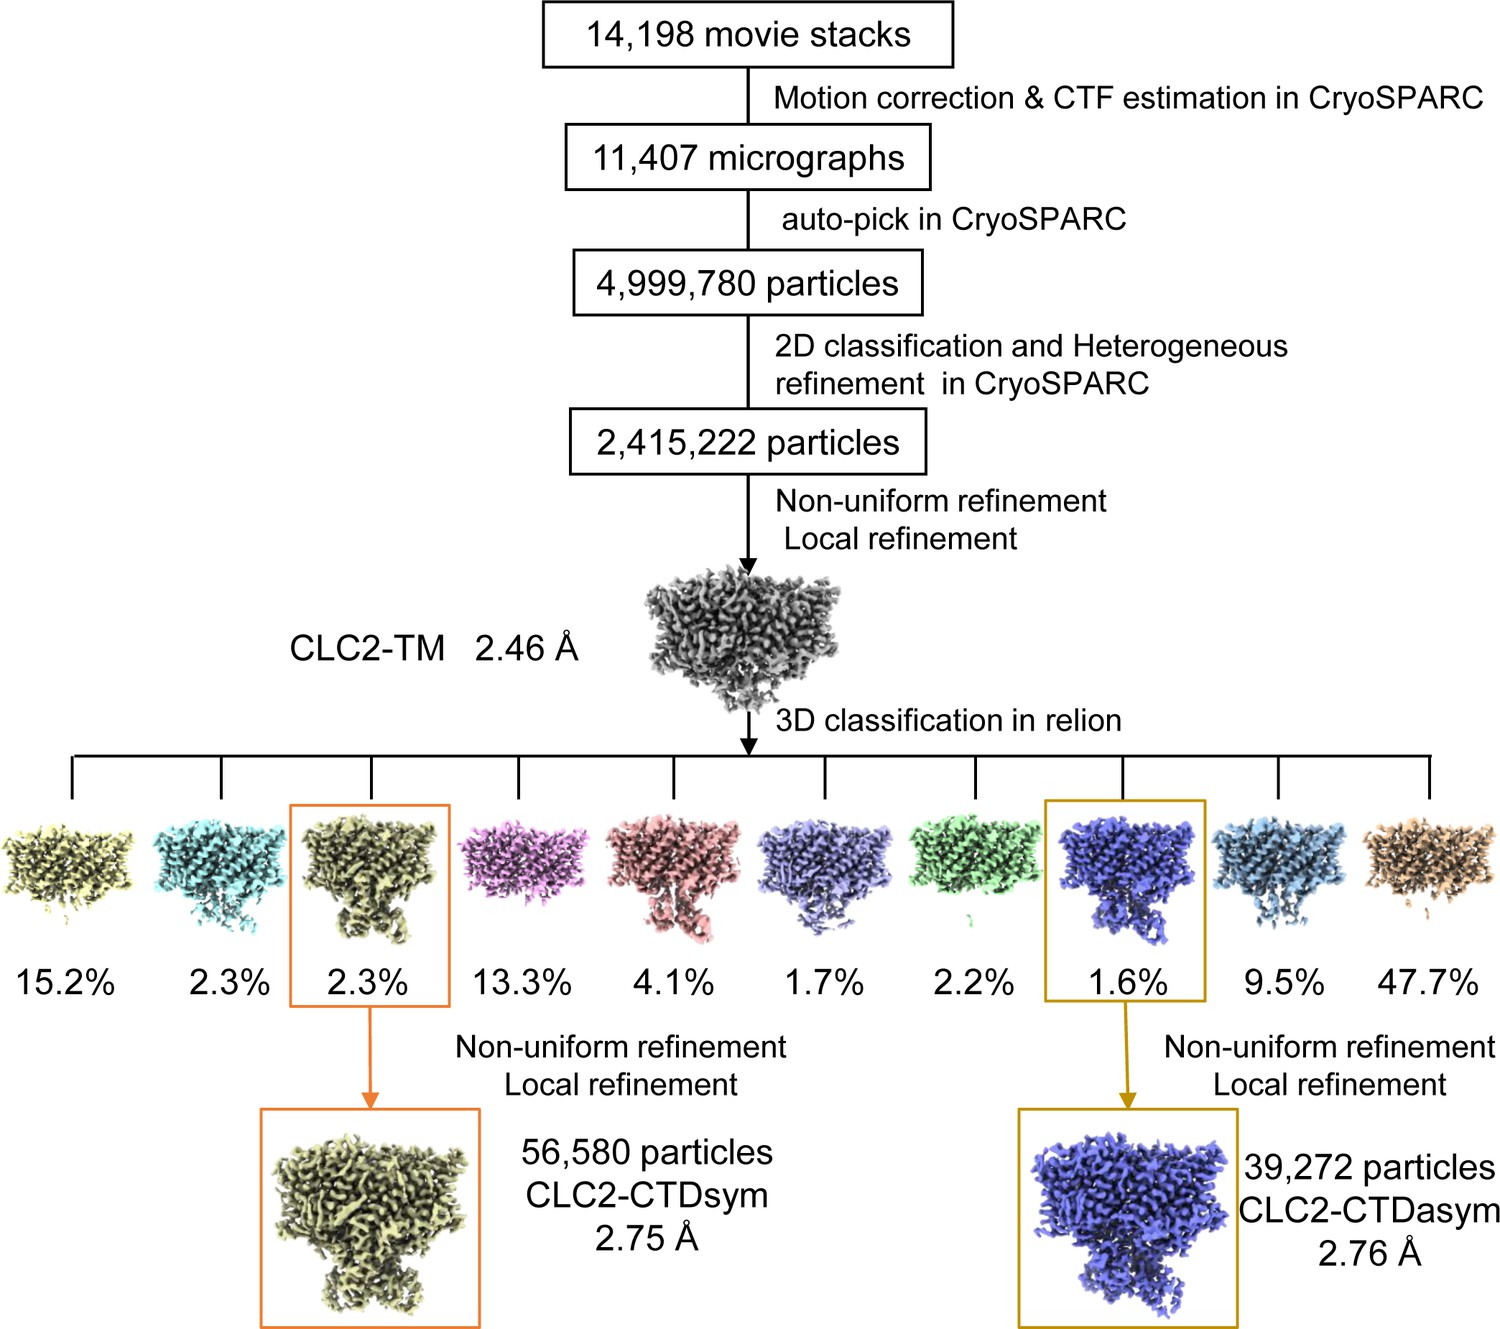
CryoEM workflow of the CLC2 single-particle cryoEM data processing.
A total of 14,198 movie stacks were collected on a 300 kV Titan Krios cryo-electron microscope. cryoSPRAC was used for 2D classification, and the CLC2-TM density map was obtained after 2D classification. Relion was used for 3D classification and yielded two conformations differing in the C-terminal domain (CTD): CLC2-CTDsym and CLC2-CTDasym. Resolutions shown refer to the whole protein molecule.
Figure 2—figure supplement 3
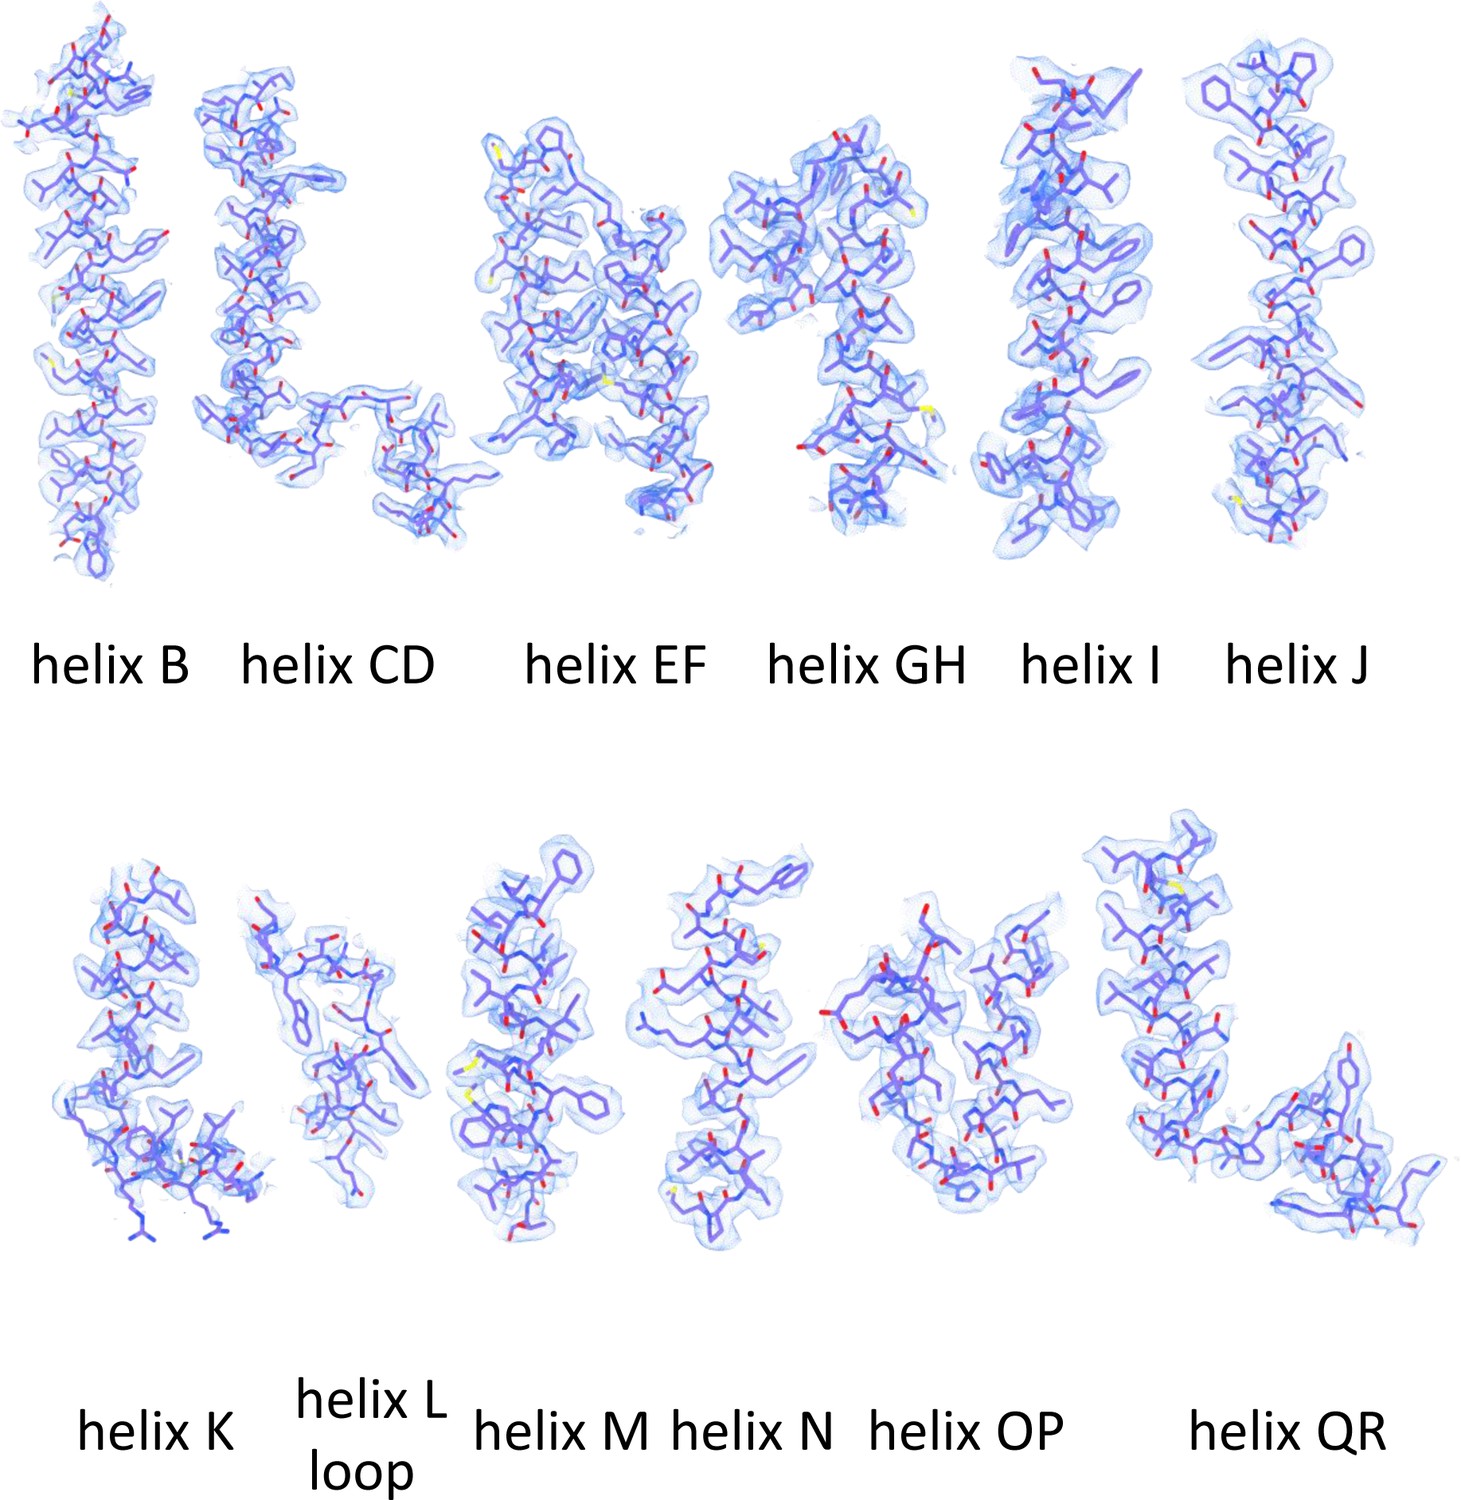
Helix map of CLC2-TM.
CryoEM densities and model of CLC-2 transmembrane helices (contour level: 0.73, 2.7 σ).
Figure 2—figure supplement 4
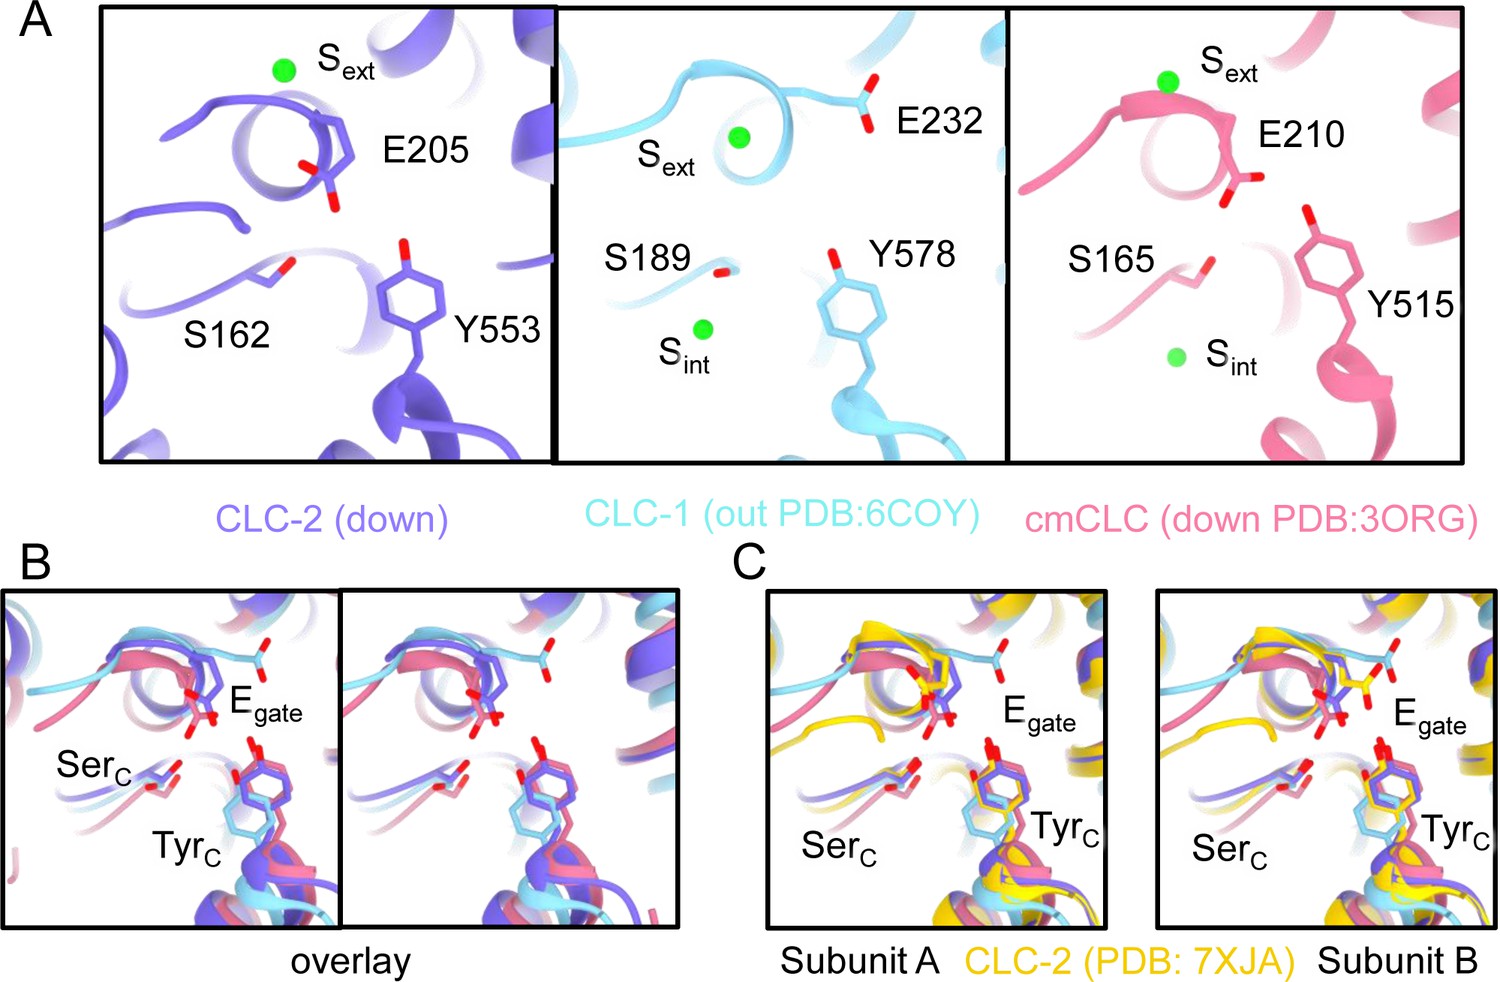
Egate position and Cl−-binding sites (Sext and Scen).
(A) Comparison between CLC-2 (purple), CLC-1 (light blue), and cmCLC (salmon pink). Egate (E205 in CLC-2, E232 in CLC-1, and E210 in cmCLC), SerC (S162 in CLC2, S189 in CLC-1, and S165 in cmCLC), and TyrC (Y553 in CLC-2, Y578 in CLC-1, and Y515 in cmCLC) are shown as sticks. In CLC-2 and cmCLC, Sext is occupied by Cl−, and Scen is occupied by Egate. Egate is in the ‘down’ position. In CLC-1, Sext is occupied by Cl−, and Scen lacks anion density. Egate is in the ‘out’ position, away from the Cl− permeation pathway. (B) Overlay view (stereo) of panel A. (C) Overlay with the CLC-2 Egate conformations modeled in PDB ID: 7XJA (Ma et al., 2023).
Figure 3 with 2 supplements
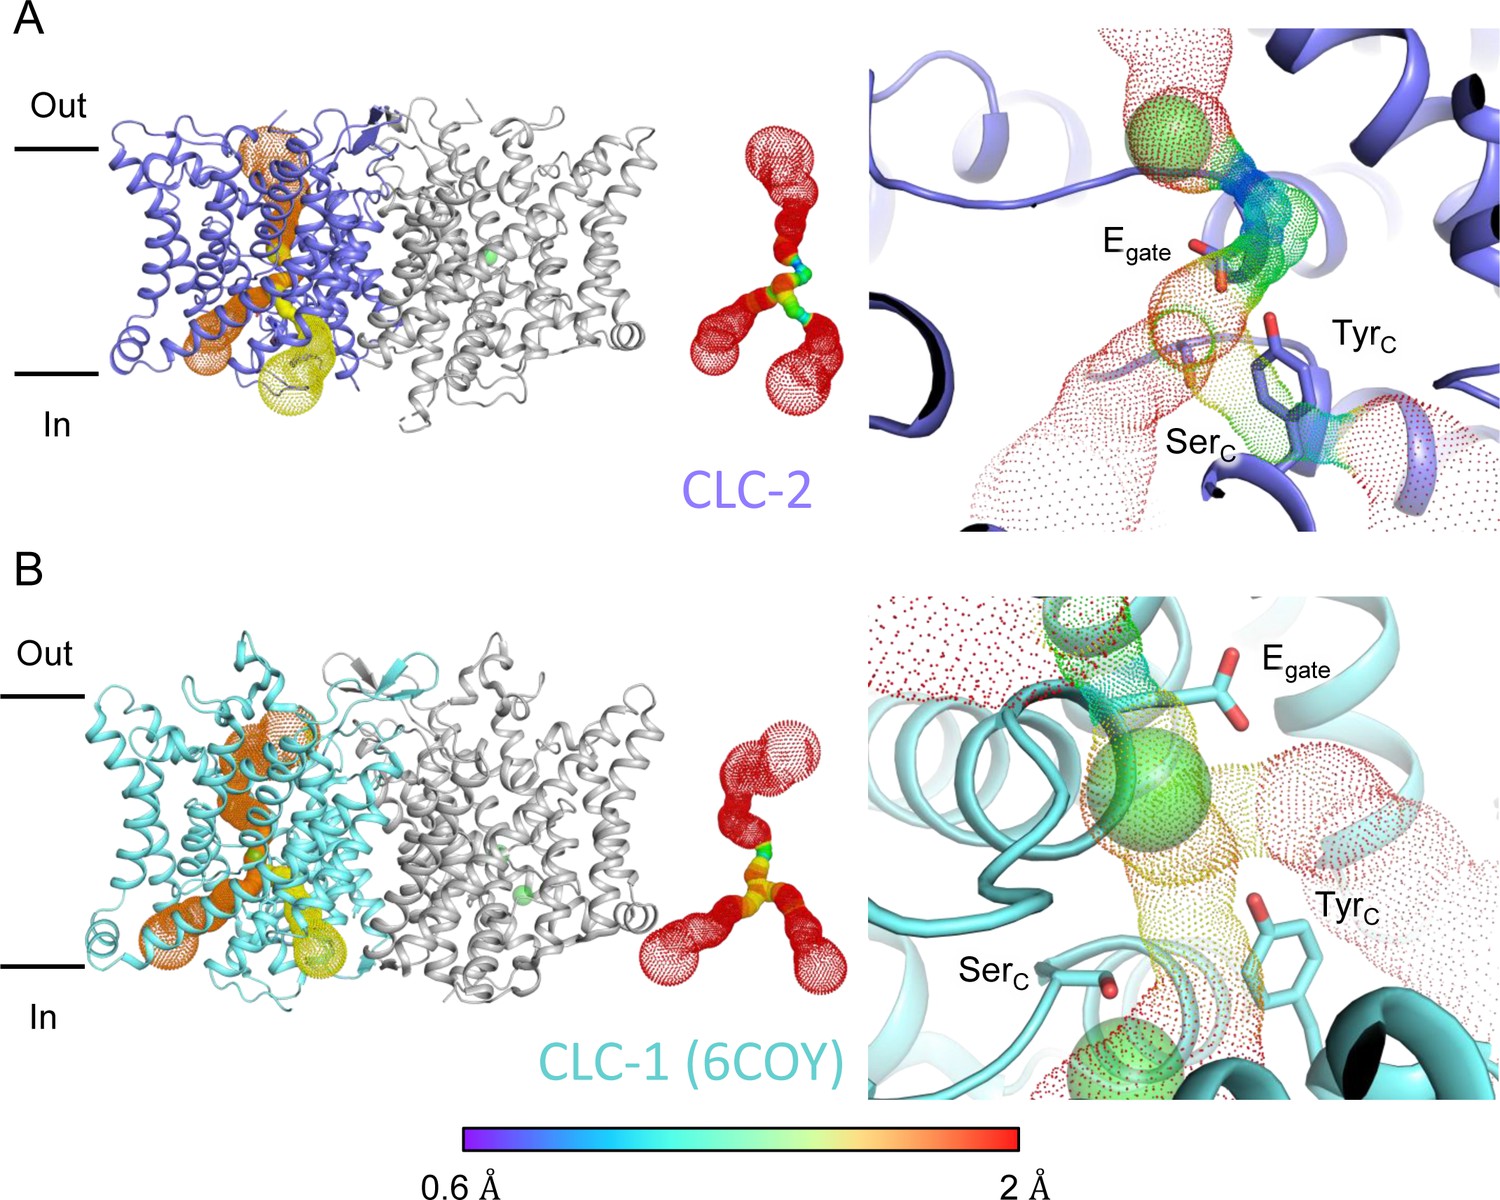
Pore profile detected in CLC-2.
(A) Left: The primary (orange) and secondary (yellow) pore detected in CLC-2 using Caver. Middle: The detected pore radii are displayed in dots as a color map. Right: Zoomed-in view of the restricted (narrowest) site of the pore profile, using the same coloring as in the middle panel. Egate, SerC, and TyrC are shown as sticks. (B) Pore profile for CLC-1 (PDB ID: 6coy), with display as in panel A.
Figure 3—figure supplement 1
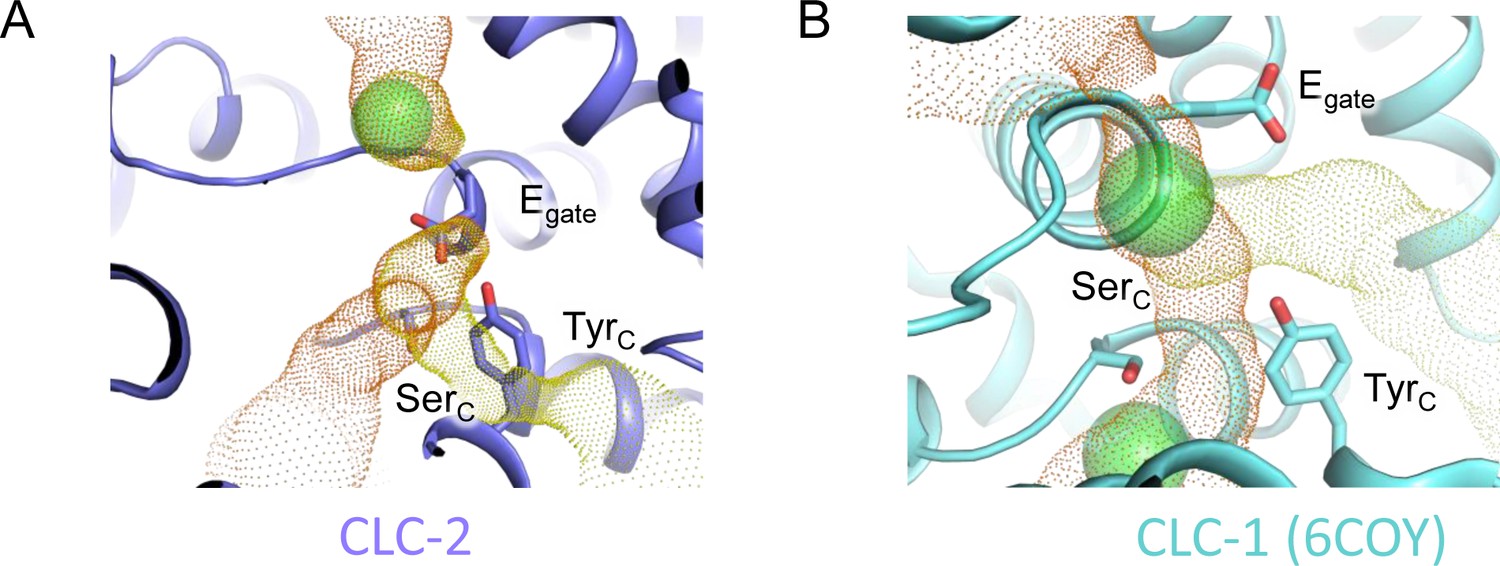
Cl− pathway in CLC-2 and CLC-1.
(A) CLC-2 Cl− pathway as shown in Figure 3 but omitting sections with pore radius less than 1 Å. Egate, occupying the Scen site, blocks the canonical Cl− pathway. (B) Same as panel A, for CLC-1 (PDB ID: 6coy).
Figure 3—figure supplement 2

Comparison of primary and secondary Cl− pathways with transporter Cl− and H+ pathways.
(A) The top two panels are repeated from Figure 3A, indicating the primary (orange) and secondary (yellow) caver-detected pores in CLC-1 and CLC-2. The lower panel shows CLC-ec1 (PDB ID: 1OTS), a representative for the CLC transporters, where caver detects only the primary pore (orange dots as for CLC-1 and CLC-2). (B) Detected pore radii show a longer constriction in the CLC-ec1 transporter compared to the CLC-1 and CLC-2 channels. (C) Zoomed-in view of the secondary-pore region for CLC-2 (top), CLC-1 (middle), and CLC-ec1 (bottom). The CLC-ec1 panel shows water wires (space-filled) detected in simulations of the QQQ mutant structure (PDB ID: 6V2J) (Chavan et al., 2020).
Figure 4 with 5 supplements
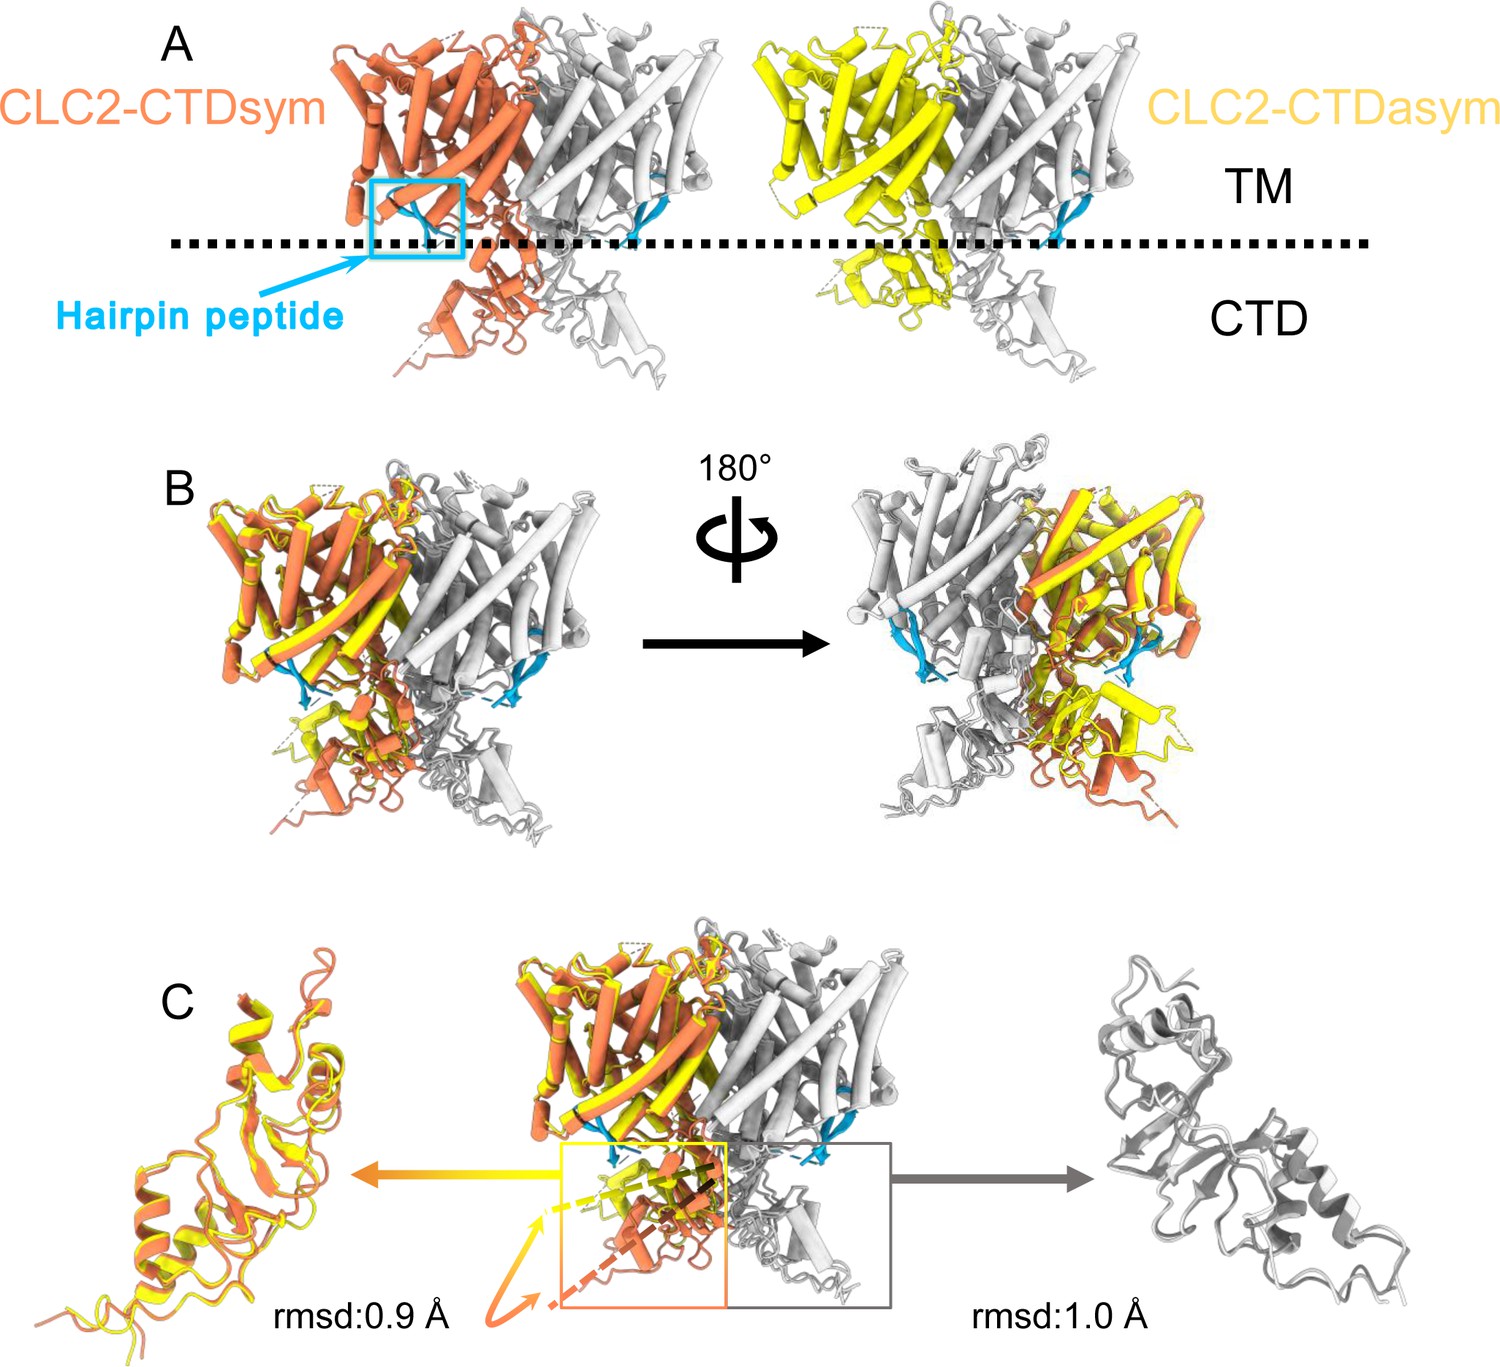
Different conformations of the C-terminal domain (CTD).
(A) Overall structure of the two CLC-2 conformations. Left: CLC2-CTDsym at 2.75 Å. Right: CLC2-CTDasym at 2.76 Å. The subunits of the homodimer are shown in orange (CLC2-CTDsym) or yellow (CLC2-CTDasym) and gray (for both). The subunits adopting different CTD conformations are shown in orange and yellow, while the subunits sharing the same CTD conformation are shown in gray. The dashed line demarcates the transmembrane (TM) and cytoplasmic (CTD) domains. A hairpin structure detected at the intracellular pore is shown in blue. (B) Overlay of two conformations. (C) Hinge movement of the CTD between two conformations. The middle panel shows an overlay of CLC2-CTDsym (orange and gray) and CLC1-CTDasym (yellow and gray), with the CTDs highlighted in boxes. For the subunits that adopt different conformations (orange and yellow), the double-headed arrow indicates the change between the two conformations. The root-mean-square deviation (RMSD) between the subunits shown in orange/yellow is 6.9 Å, while the RMSD for the subunits shown in gray is only 1.3 Å. Alignments of only the CTDs are shown at left and right; in these alignments, the low RSMD values (0.9 and 1.0 Å, respectively) indicate that the CTDs undergo a hinge movement.
Figure 4—figure supplement 1
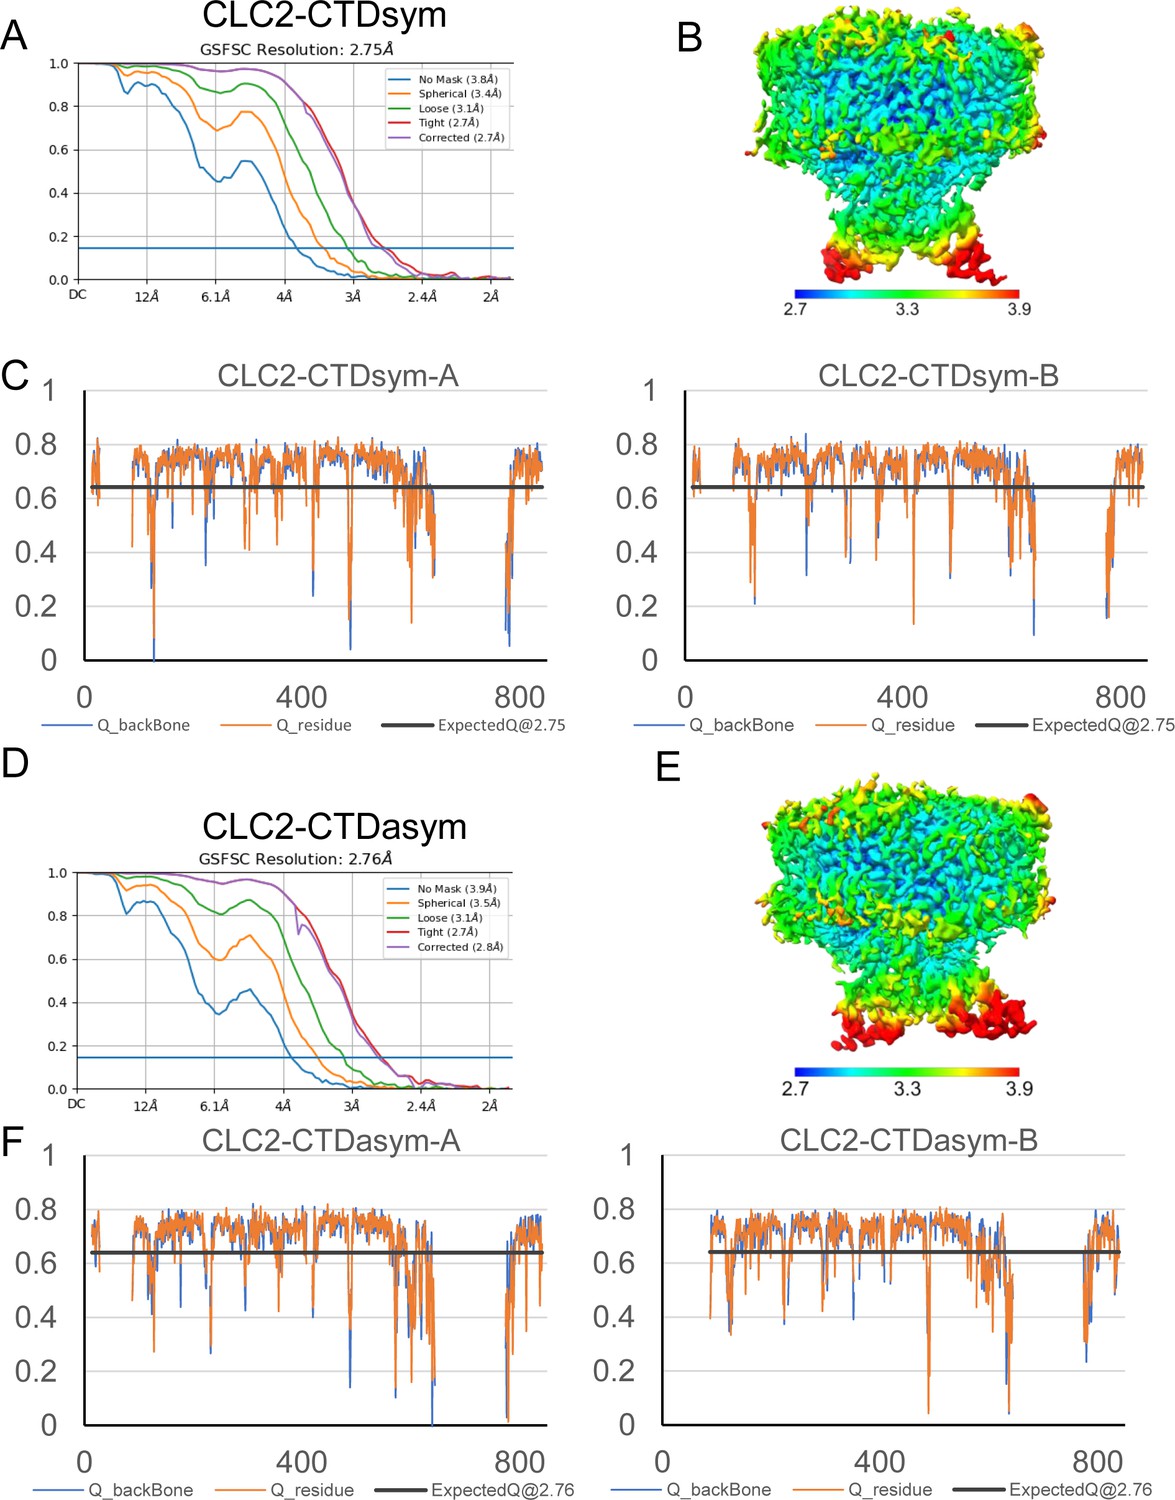
Structure validation of CLC2-CTDsym and CLC2-CTDasym.
(A) Gold standard Fourier shell correlation (FSC) plots calculated in cryoSPARC for CLC2-CTDsym. (B) Local resolution of the cryoEM map of the CLC2-CTDsym. (C) Model validation using Q-scores of subunits A (left) and B (right) of CLC2-CTDsym. The black line represents the expected Q-score at respective resolution based on the correlation between Q-scores and map resolution. (D–F) The same as (A–C) for CLC2-CTDasym.
Figure 4—figure supplement 2
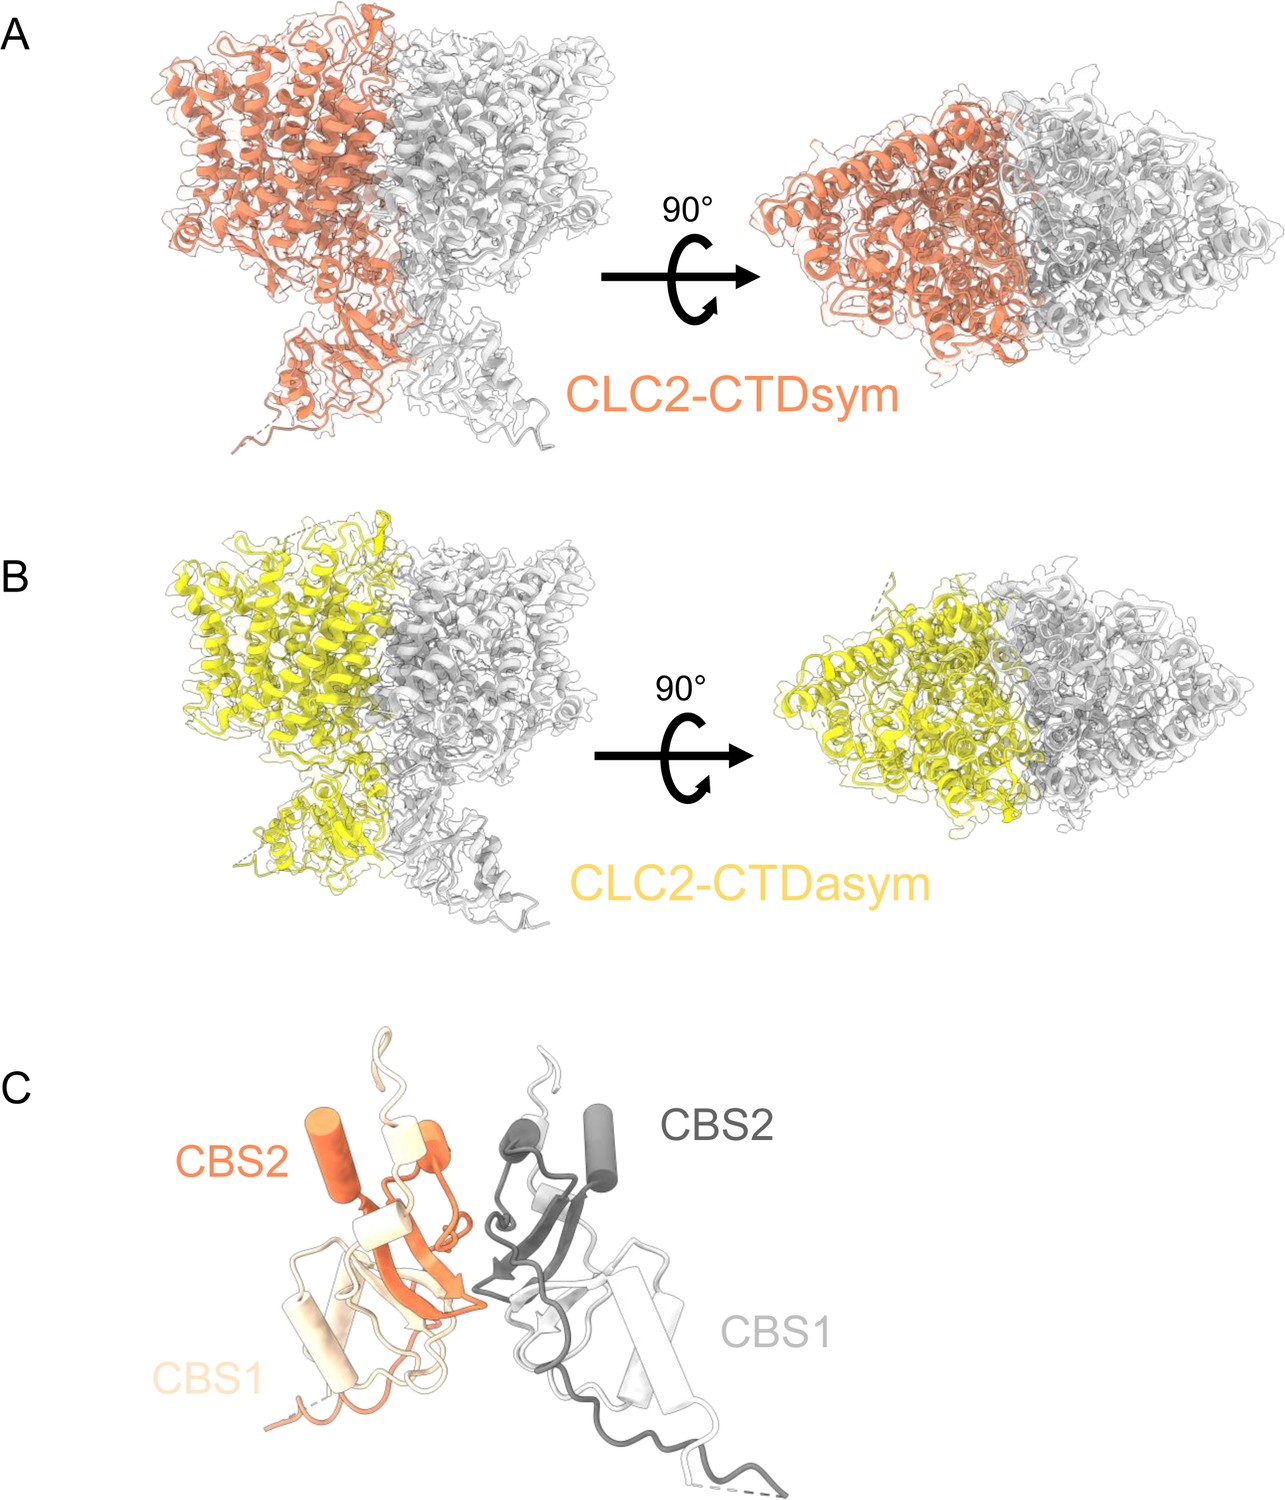
CryoEM density maps for the two C-terminal domain (CTD)-containing CLC-2 conformations, overlaid with structural models.
(A) CLC2-CTDsym (contour level: 0.68, 4.9 σ). (B) CLC2-CTDasym (contour level: 0.75, 6.8 σ). Side view (left) and top view (right) are shown. (C) CTD of CLC2-CTDsym shows two CBS domains on each subunit (orange and light orange for subunit A; gray and light gray for subunit B).
Figure 4—figure supplement 3
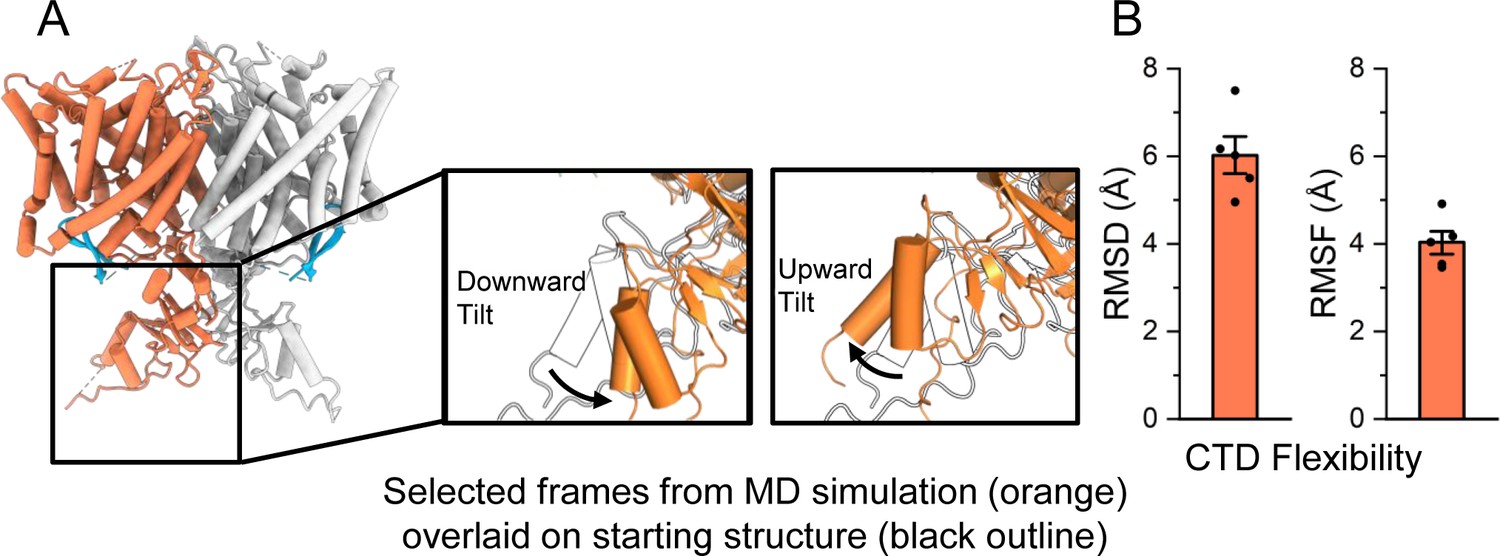
Molecular dynamics (MD) analysis indicates conformational flexibility of the C-terminal domain (CTD).
(A) The CTD is highly mobile relative to the transmembrane domain, and often tilts upward or downward relative to its initial location. In the inset images, two representative frames from simulation are shown (orange) overlaid on the starting structure (black outline). (B) The RMSD (root-mean-square deviation) and RMSF (root-mean-square fluctuation) of the cytoplasmic domain backbone were calculated after aligning frames on the transmembrane domains. Bars show the mean of five independent simulations, each 2.0 μs in length. Error bars are 68% confidence intervals of the mean.
Figure 4—figure supplement 4
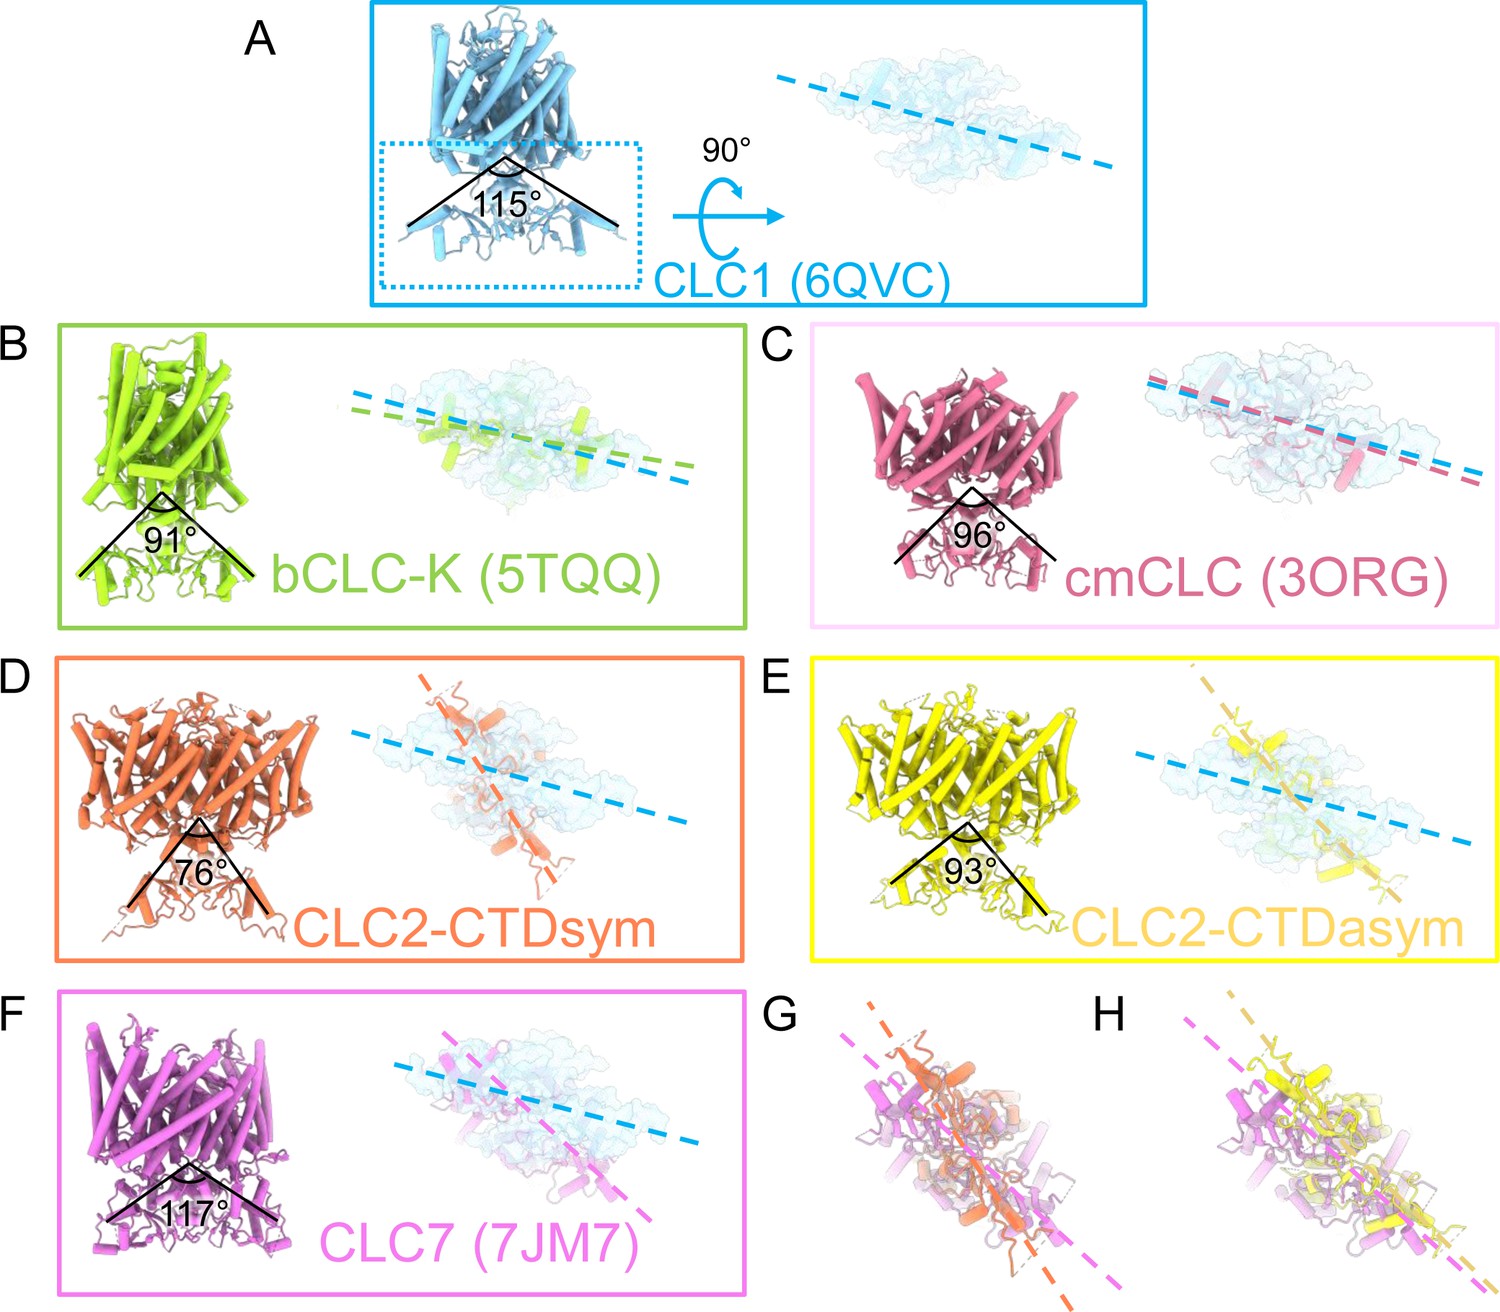
Comparison of C-terminal domain (CTD) orientation with respect to the transmembrane (TM) domain.
(A) The CLC-1 structure is shown in light blue. The angle of orientation for the CTDs was calculated using the far end residue of helix T (the second helix of first CBS domain) as the endpoint of rays and the center of the TM-CTD connecting plane as the vertex of the angle. On the right the CTD is shown in surface representation following rotation as indicated. Panels (B–F) show the CLC homolog indicated, with angles calculated as for CLC-1, and the rotated view of the CTD shown to compare the positioning of the CTDs relative to the membrane domains. The dashed lines indicate the long axes of the CTDs. In each panel, CLC-1 is shown in light blue as a reference for comparison. (G, H) Overlays compare the CTD orientations in the CLC-2 structures to that in CLC-7. PDB IDs are shown in the parentheses. PDB IDs for CLC2-CTDsym and CLC2-CTD asym are 8TA4 and 8TA5.
Figure 4—figure supplement 5
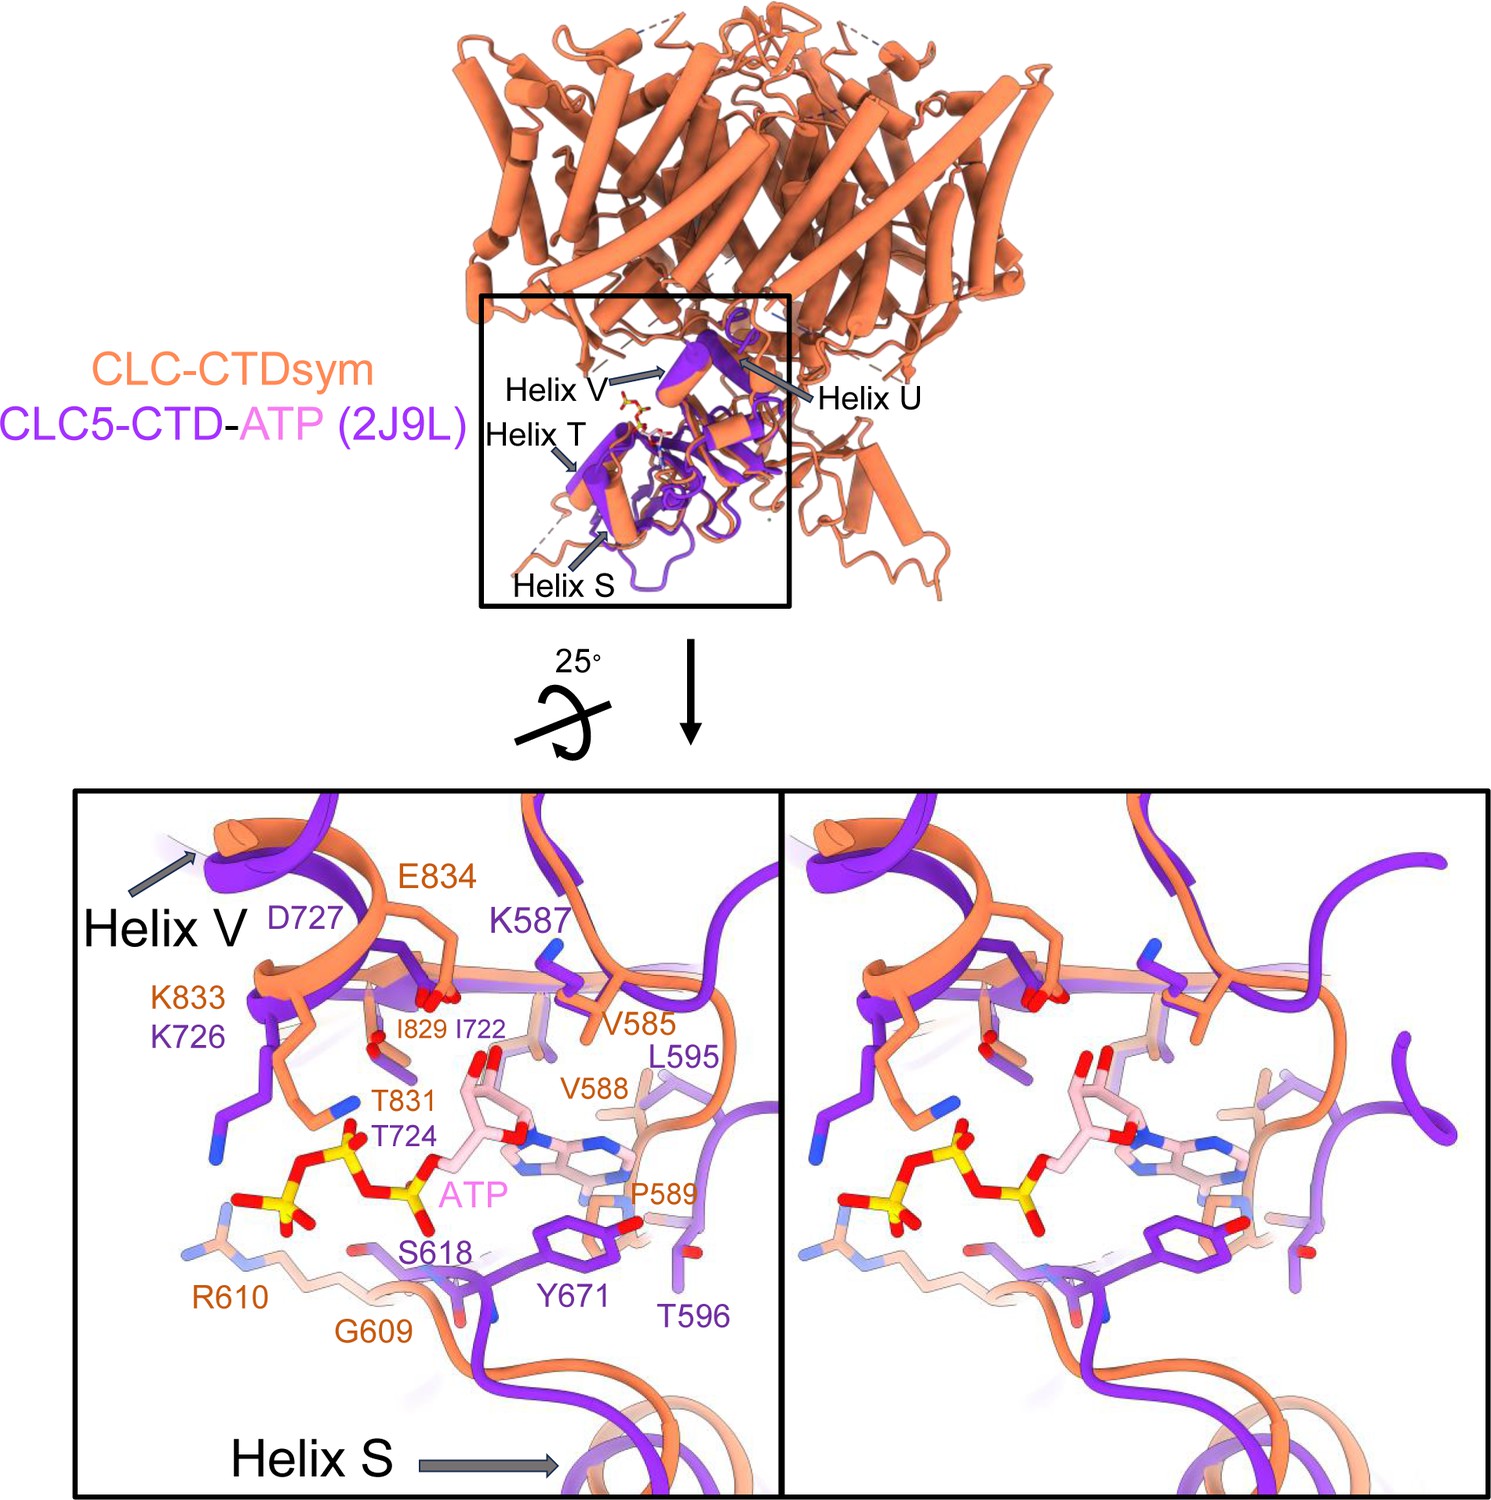
ATP-binding site comparison between CLC-2 and CLC-5.
Top: Structural overlay of CLC2-CTDsym (in orange) and CLC5-CTD (in dark purple) with ATP (pink carbon atoms; CPK coloring on non-carbon atoms; PDB ID: 2J9L). Bottom: Zoomed-in stereo view of ATP-binding site in CLC5-CTD (dark purple) overlaid with the same region in CLC2-CTDsym (orange). Residue numbers are labeled in dark purple for CLC-5 and orange for CLC-2.
Figure 5 with 6 supplements
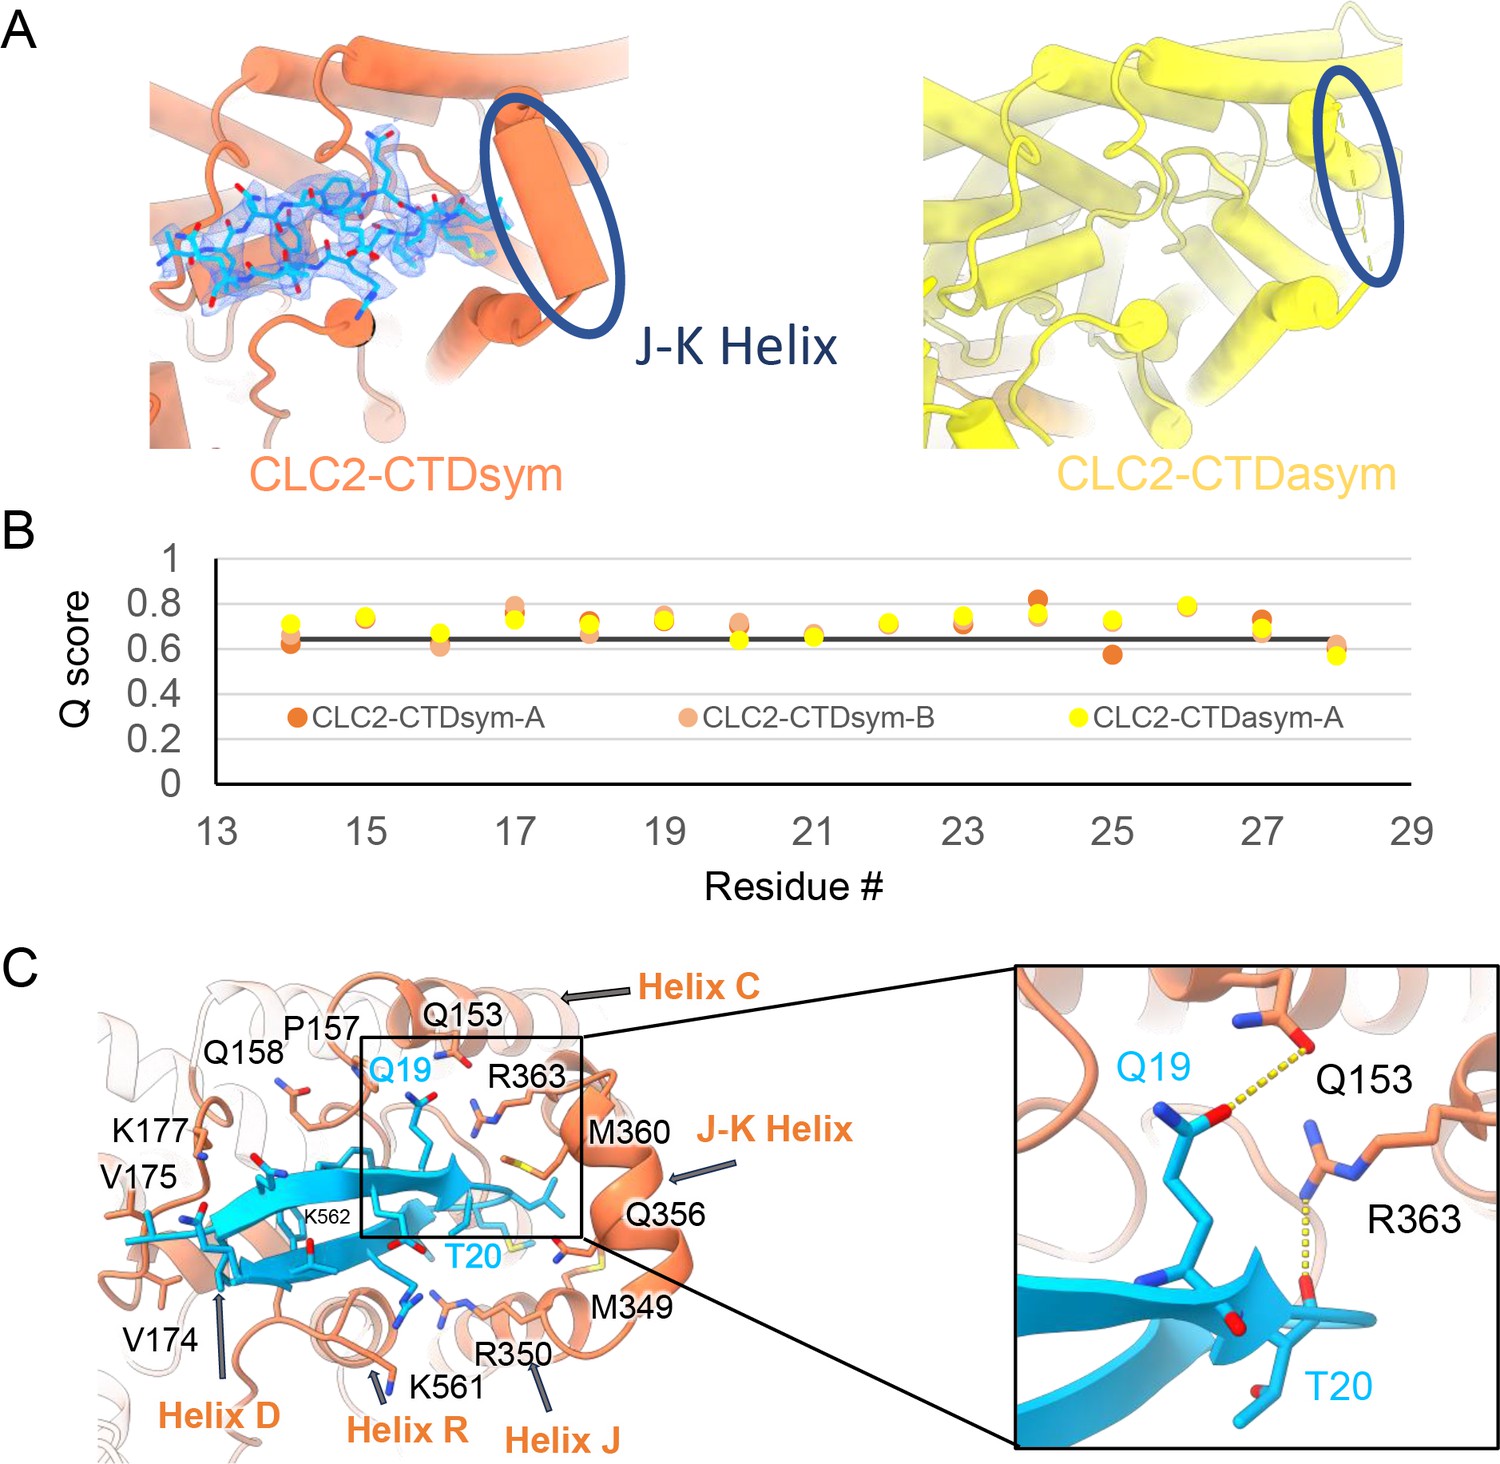
The blocking hairpin structure corresponds to an N-terminal sequence of CLC-2.
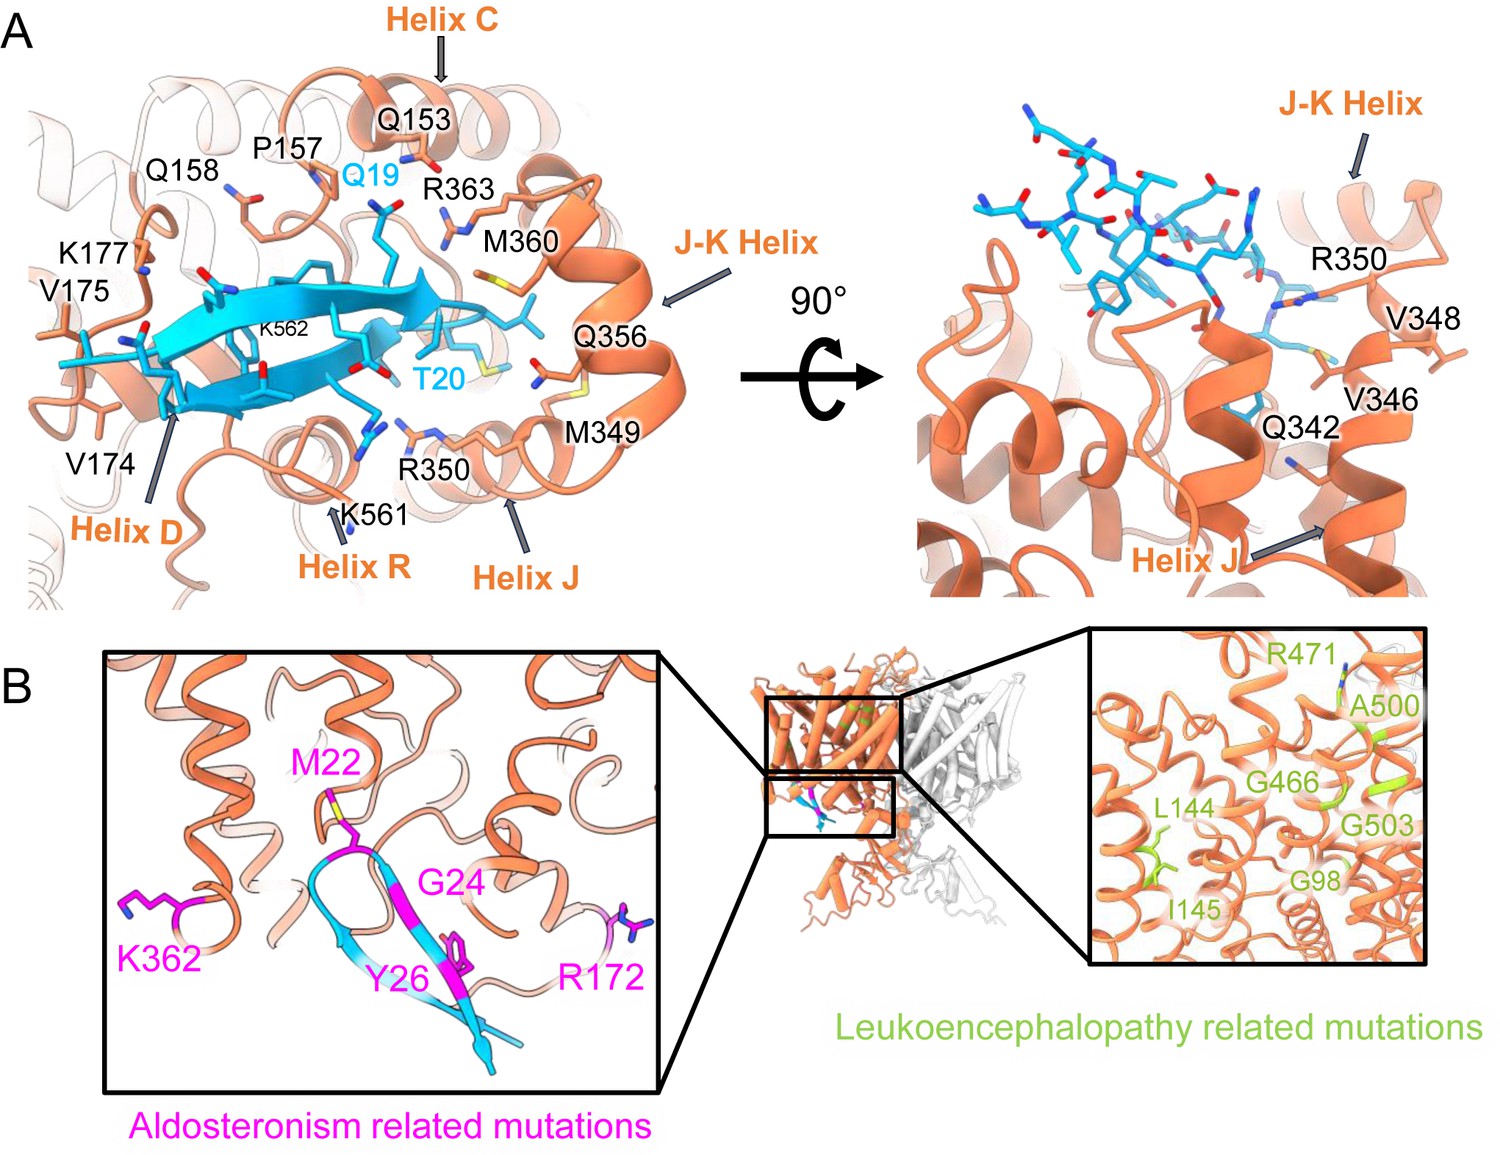
(A) Left: The hairpin structure seen in the cryoEM density (blue mesh) fits N-terminal residues 14–28 (blue). Right: The subunit in CLC2-CTDasym structure that contains a C-terminal domain (CTD) with rotated orientation lacks density for the hairpin structure. In this structure, the residues linking transmembrane (TM) helices J and K are not resolved. The dark blue circles indicate this unresolved region (right panel) and the corresponding resolved J-K helix that occurs in the other subunits. (Contour level: 0.76, 5.5 σ.) (B) Model validation using Q-scores for the N-terminal hairpin: orange and light orange for subunits A and B of CLC2-CTDsym subunit; yellow for subunit A (the hairpin-containing subunit) of CLC2-CTDasym. The black line represents the expected Q-score at 2.75 Å based on the correlation between Q-scores and map resolution. (C) Residues on the TM domain interact with the N-terminal hairpin. The J-K helical linker and TM helices C, D, R, and J are labeled with arrows. Inset: Zoomed-in view of two hydrogen bonds formed between the hairpin structure and the TM domain: Q19–Q153 and T20–R363. Mutation of these two residues (Q25 and T26 in rat CLC-2) generated an open-channel phenotype for CLC-2 expressed in Xenopus oocytes (Gründer et al., 1992).
Figure 5—figure supplement 1
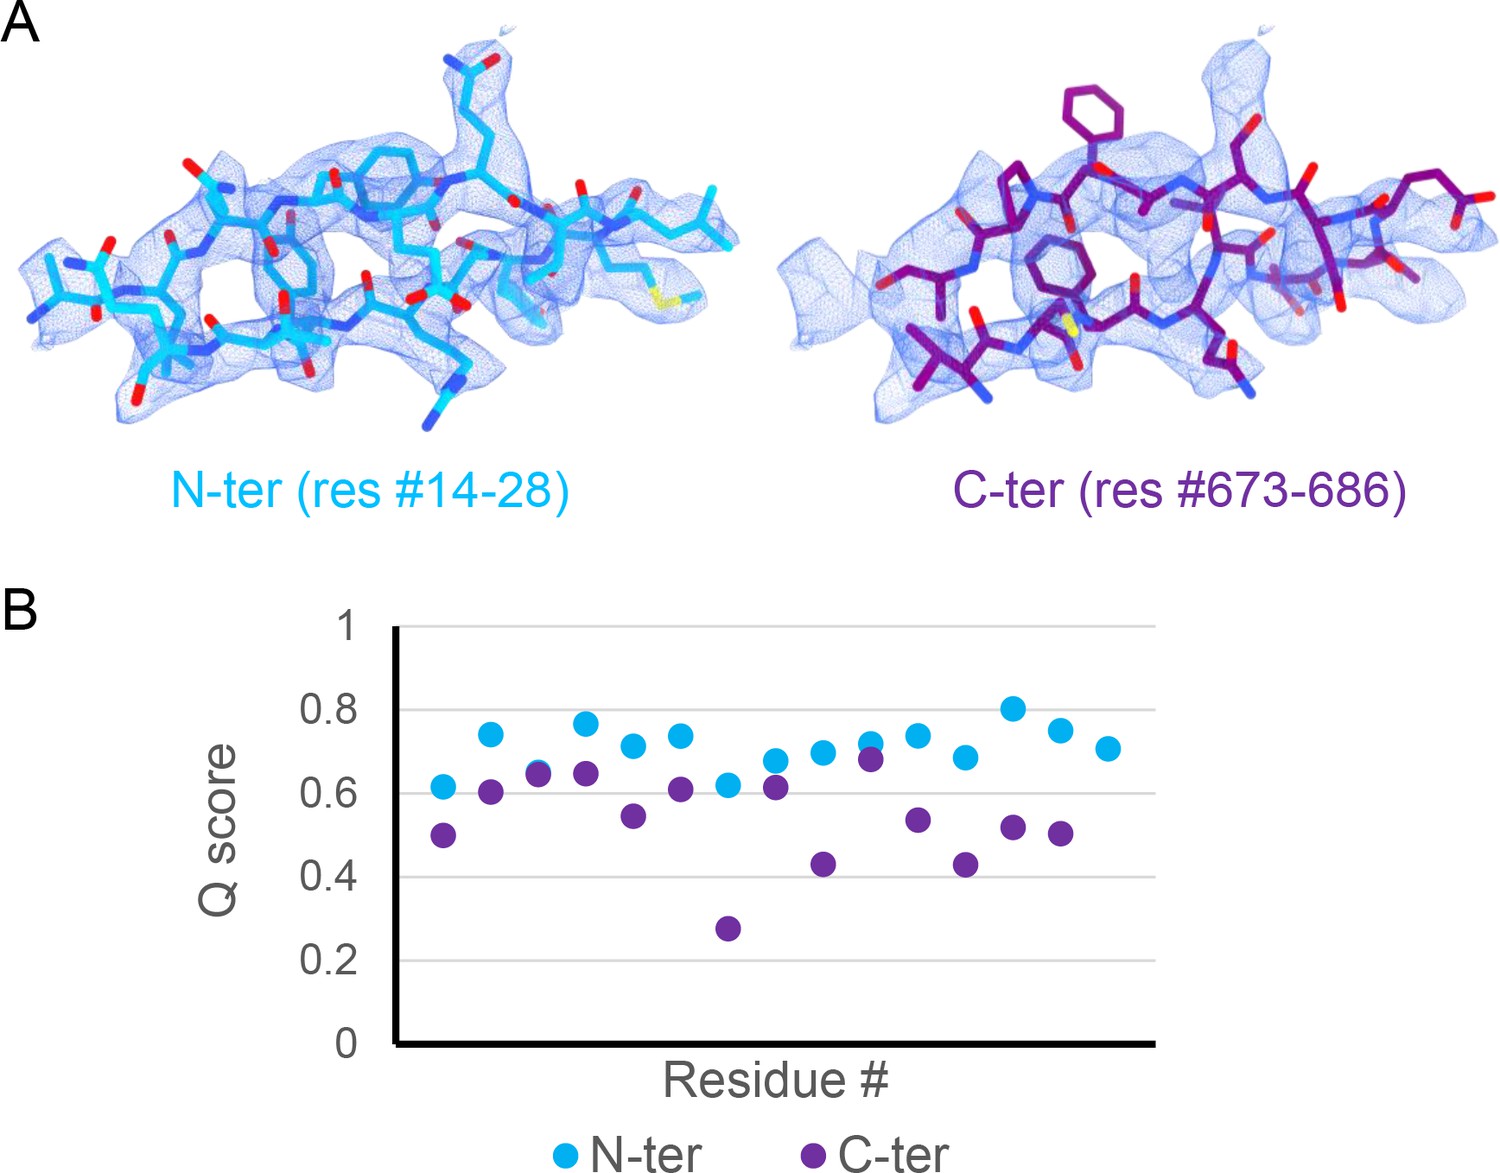
Comparison of peptide candidates fitting into the hairpin density.
(A) Best-fitting peptide candidate from the N-terminus (left shown in blue) and from the C-terminus (right shown in purple) fitted into cryoEM hairpin density (blue mesh). (B) Q-score plot of the two peptide candidates (residues 1–15 of the respective sequences). The Q-scores for the C-terminal peptide are generally lower than the Q-score expected for the corresponding resolution (0.65).
Figure 5—figure supplement 2
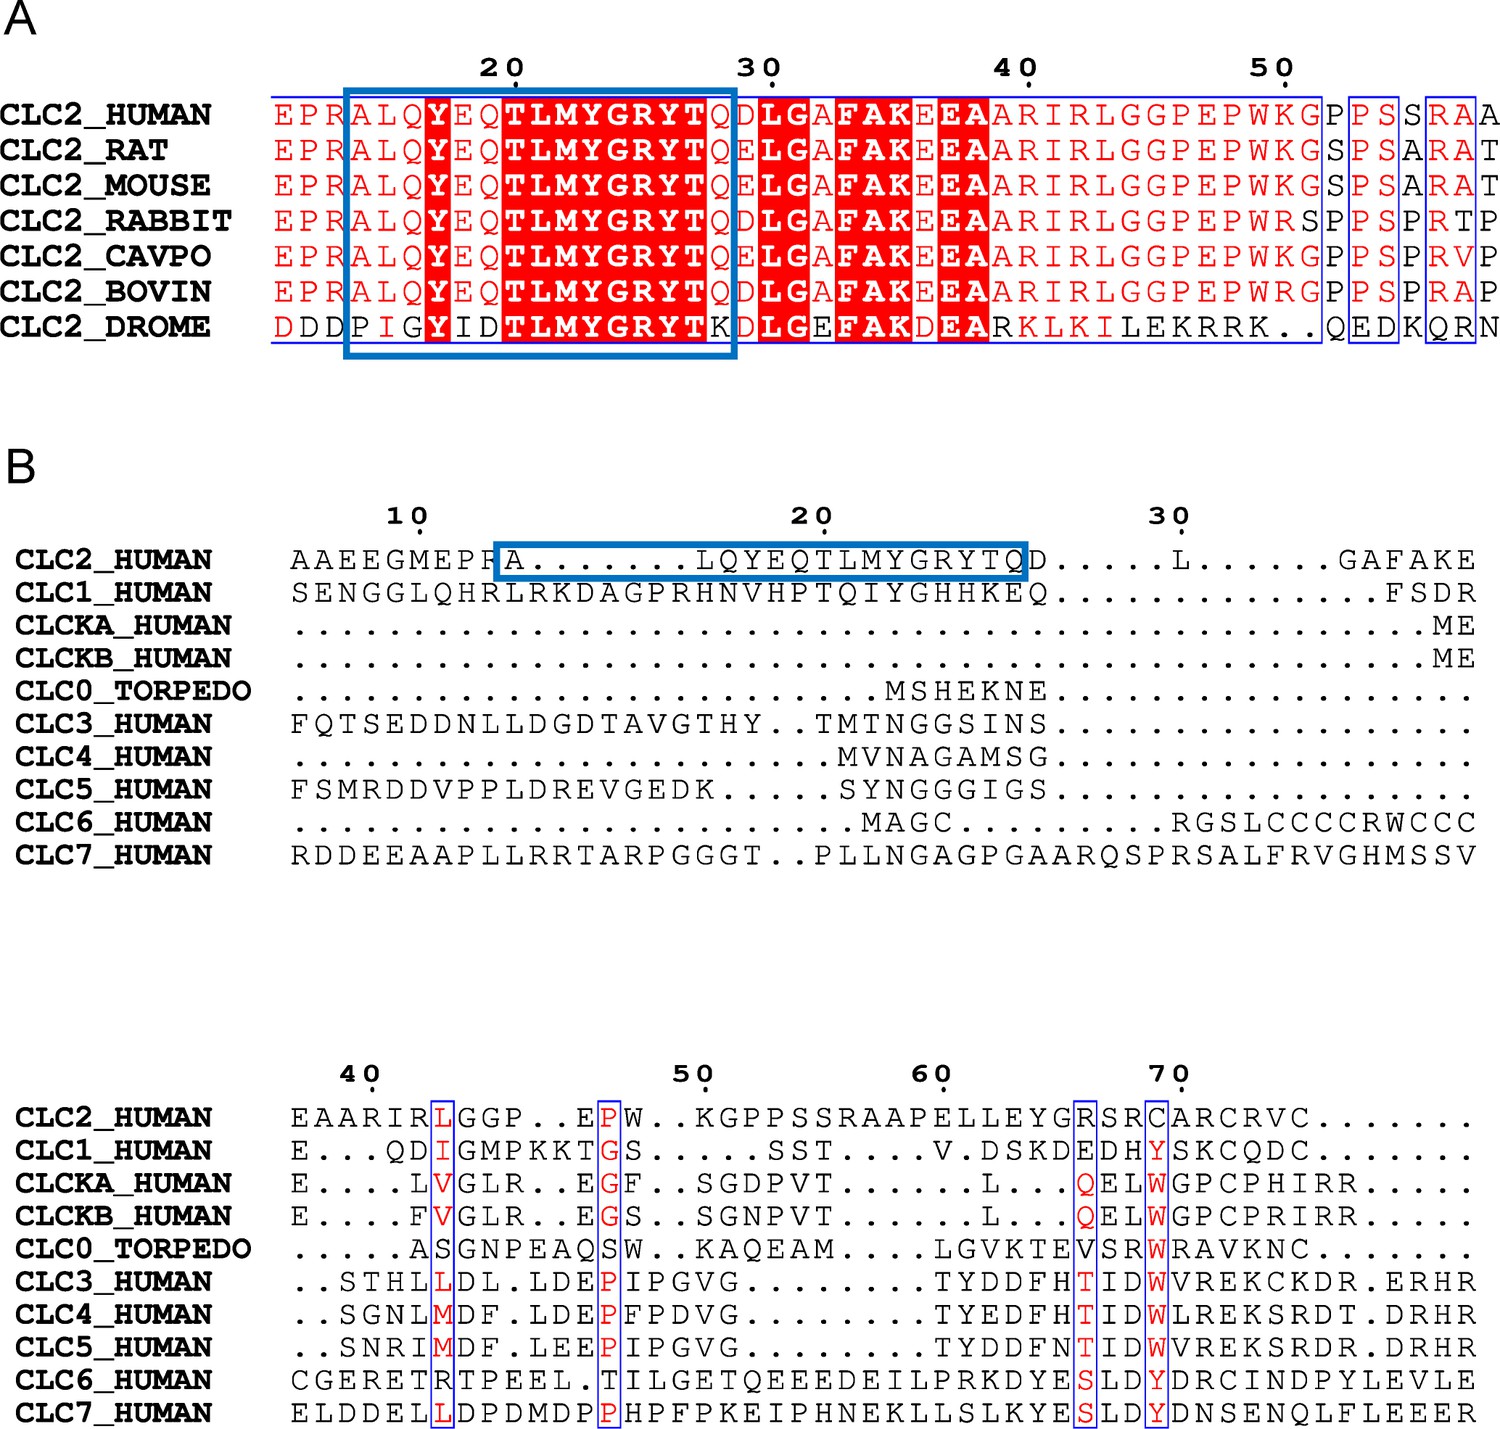
N-terminal hairpin sequence is conserved in CLC-2, but not other CLCs.
(A) Alignment of the N-terminal hairpin sequence (blue boxed) among different species. (B) Alignment of N-terminal hairpin sequence (blue boxed) among other human CLCs.
Figure 5—figure supplement 3
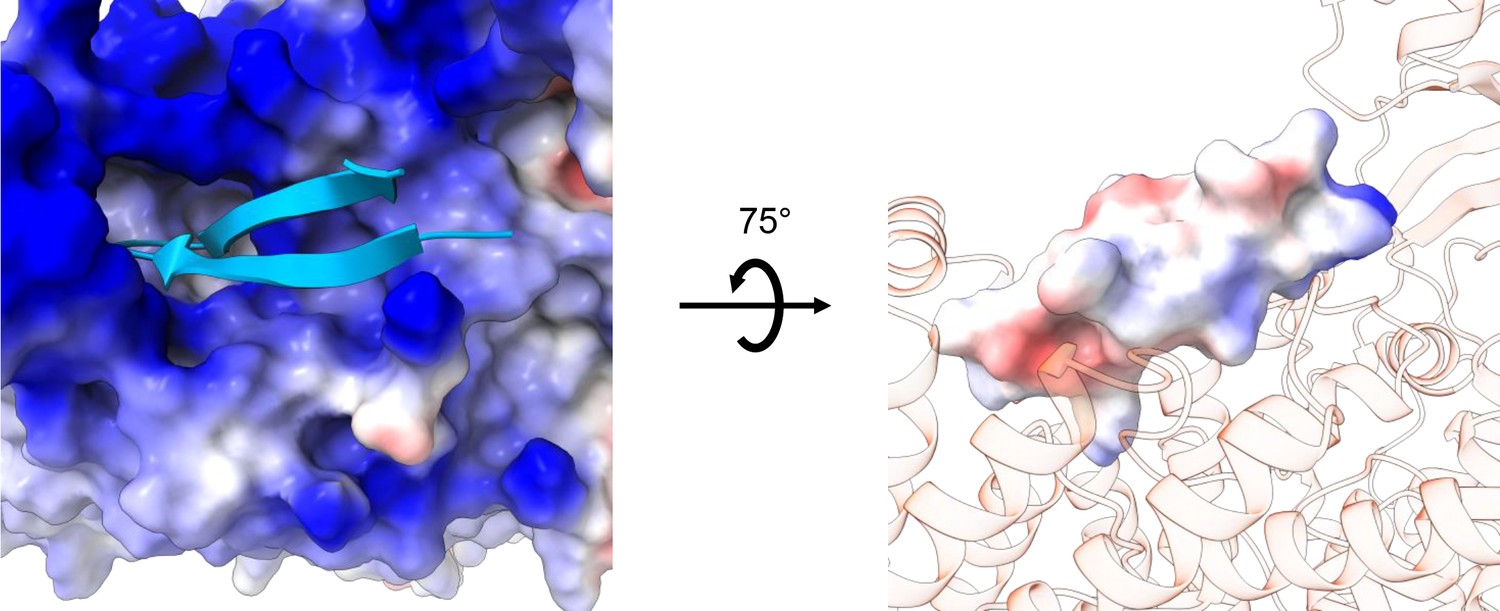
Electrostatic map of the N-terminal hairpin-blocking site.
Left: View from the cytoplasm showing the electrostatic surface potential of the transmembrane (TM) region (blue, positive; red, negative), with the hairpin shown in cartoon. Right: Side view showing the electrostatic surface potential of the hairpin (blue, positive; red, negative) and the TM blocking site shown in transparent cartoon model.
Figure 5—figure supplement 4
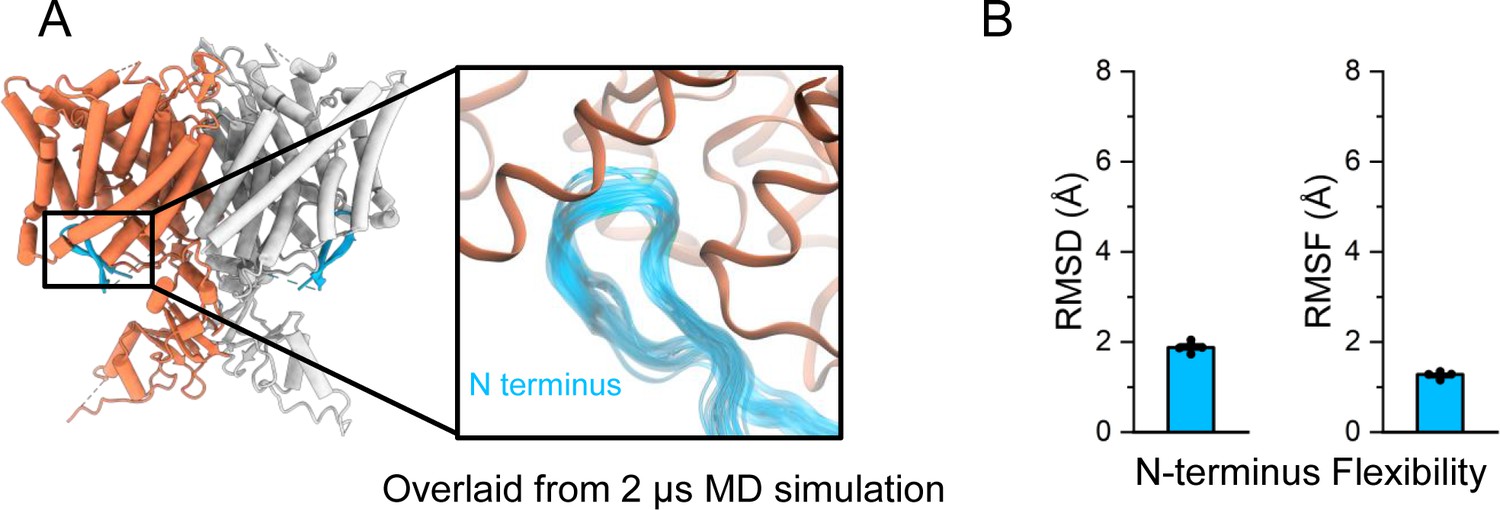
Molecular dynamics (MD) simulations confirm the N-terminal hairpin structure is stable.
(A) In simulations, the N-terminus (blue) remains stably bound to the intracellular side of the transmembrane domain (orange). In the inset image, frames of the N-terminus taken every 200 ns from a representative simulation are overlaid. (B) The root-mean-square deviation (RMSD) and root-mean-square fluctuation (RMSF) of the N-terminus backbone were calculated after aligning frames on the transmembrane domains. Bars show the mean of five independent simulations, each 2.0 μs in length. Error bars are 68% CI (confidence interval of the mean).
Figure 5—figure supplement 5
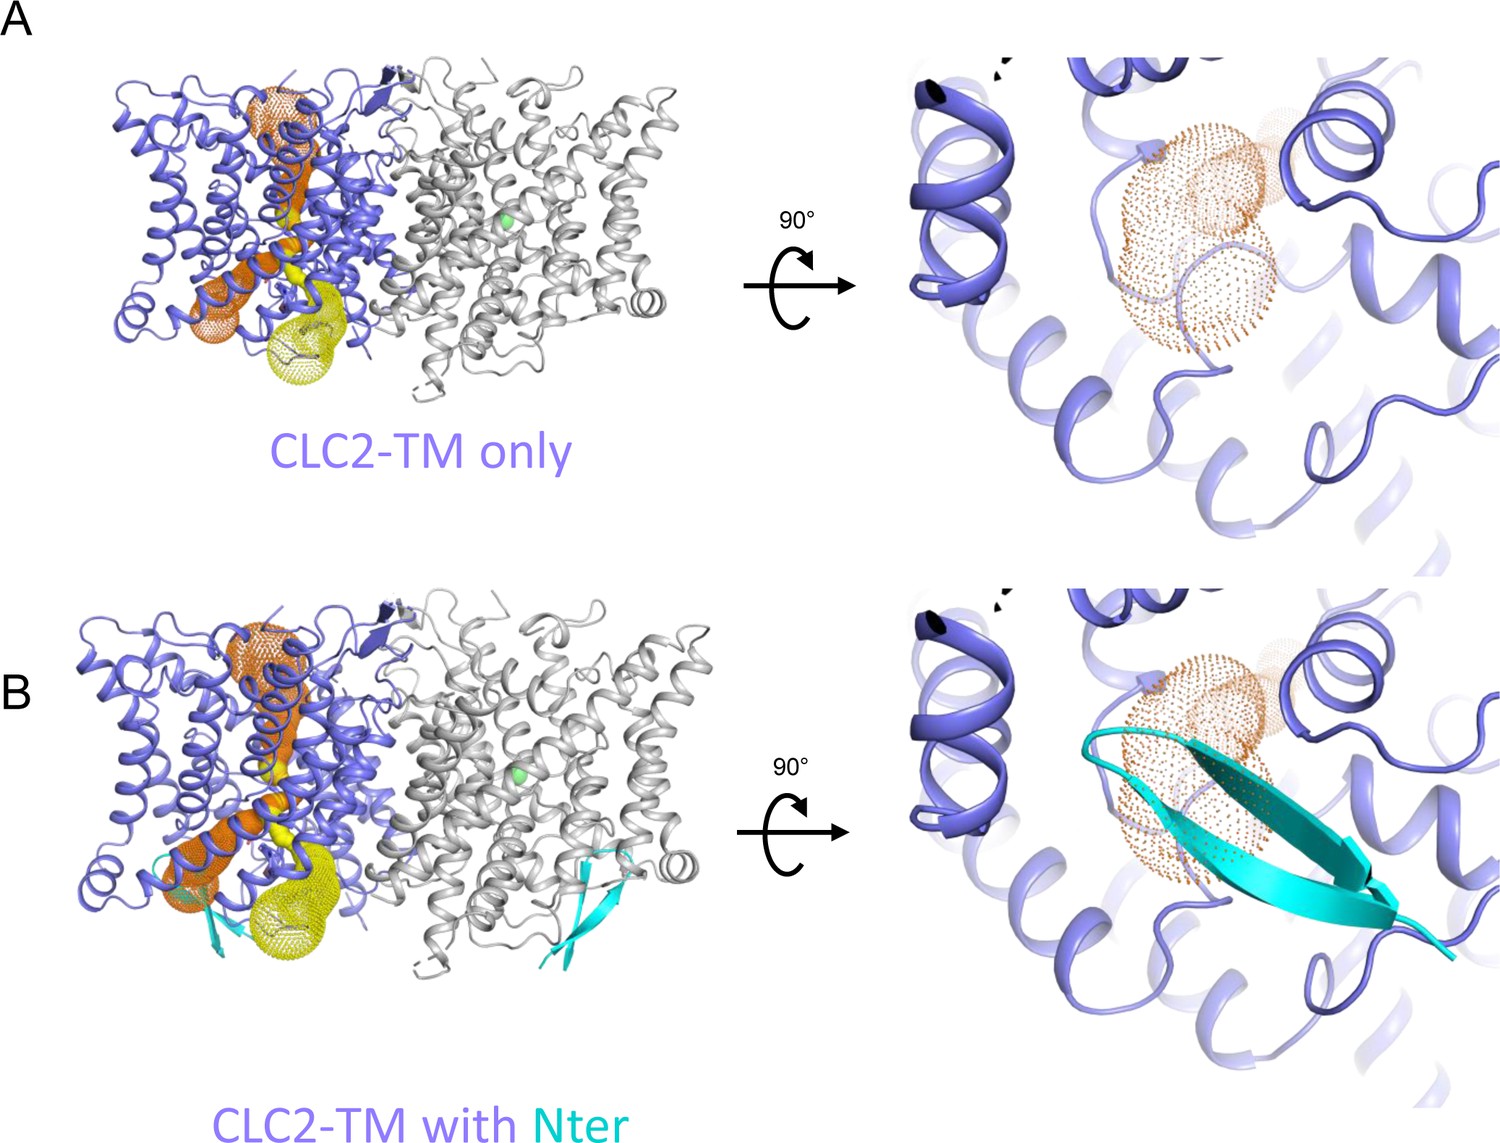
The N-terminal hairpin blocks the primary Cl− pore in CLC-2.
(A) Left: Side view of CLC2-TM showing the caver-detected pore (primary in orange and secondary in yellow). Right: View of the primary pore from the intracellular side. (B) The N-terminal hairpin (blue) overlaid with CLC2-TM as shown in panel A.
Figure 5—figure supplement 6
Mapping mutant data onto the cryoEM structure.
(A) Left: Same as Figure 5C, showing hairpin interactions. Right: Rotated view highlighting ball ‘receptor’ residues identified by Jordt and Jentsch, 1997. (B) Residues mutated in human Aldosteronism (Fernandes-Rosa et al., 2018; Scholl et al., 2018) and Leukoencephalopathy (Gaitán-Peñas et al., 2017) are shown on CLC2-CTDsym in magenta and green, respectively.
Figure 6 with 2 supplements
Patch-clamp experiments support CLC-2 channel block by the N-terminal hairpin structure.
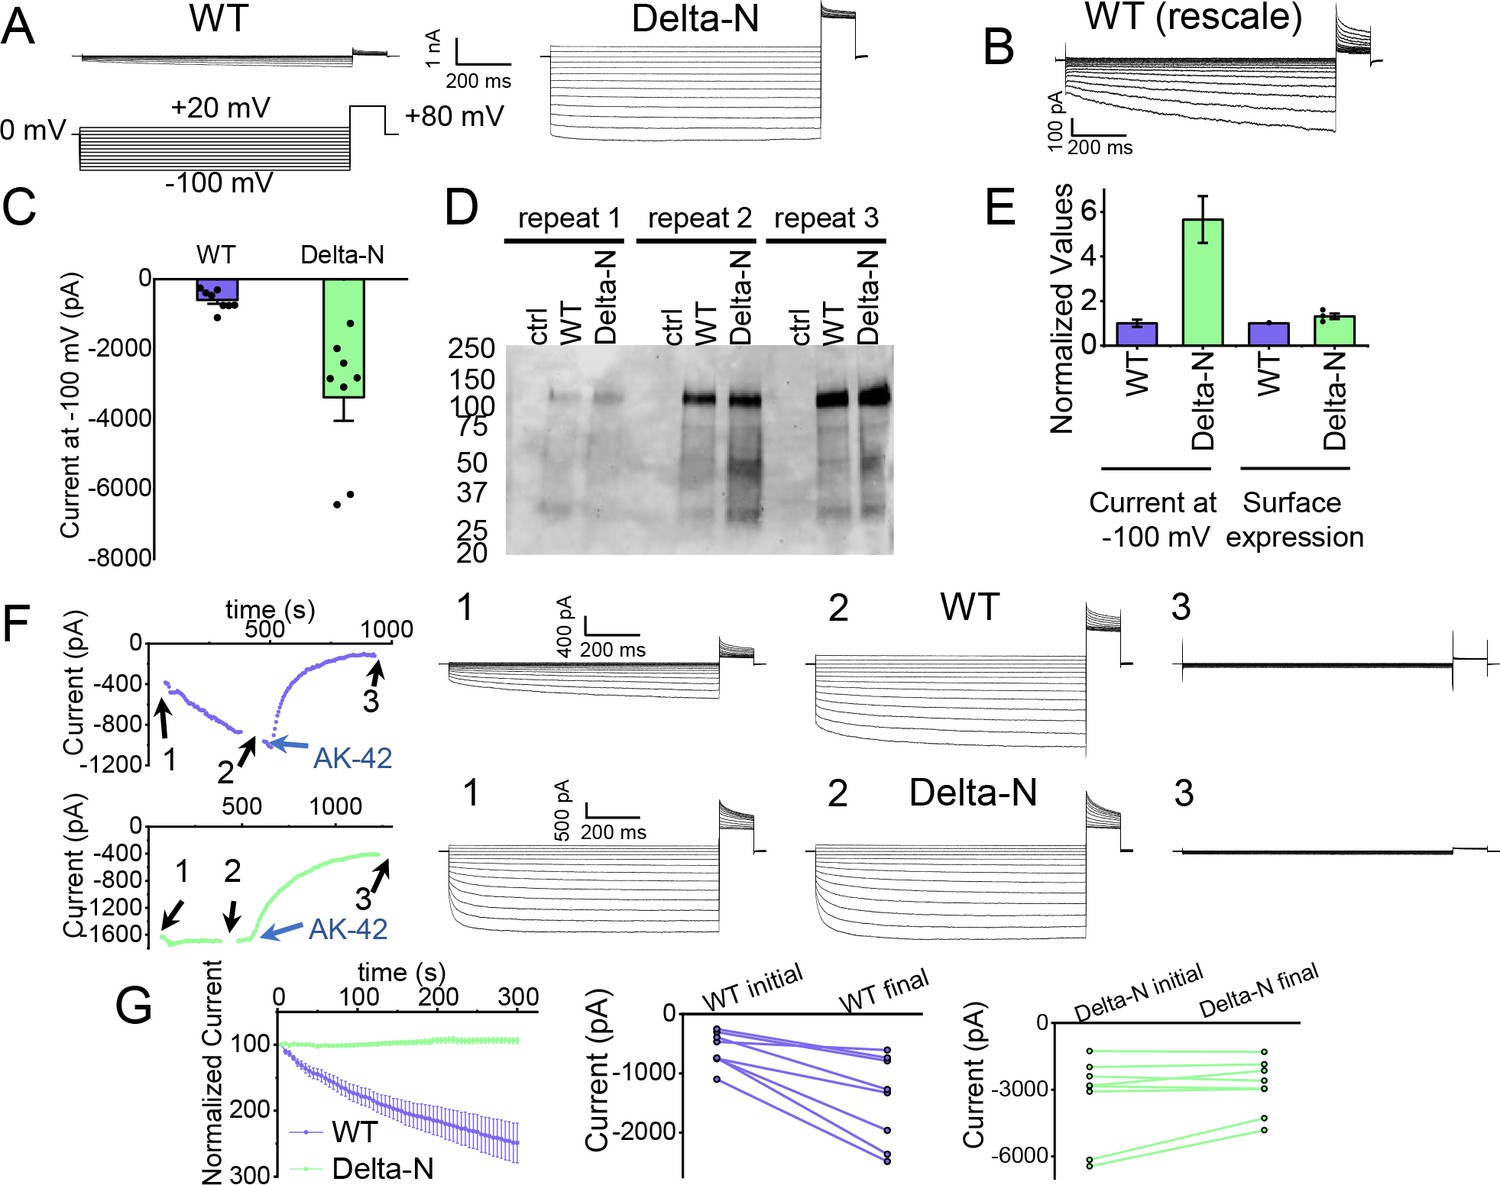
(A) Representative currents from WT and Delta-N CLC-2, recorded using the whole-cell patch-clamp configuration in response to the voltage protocol shown. (B) WT CLC-2 recording from panel A, shown on an expanded scale. (C) Summary of current levels measured for WT and Delta-N CLC-2 at the end of the 1 s voltage pulse to −100 mV. Data are from six independent transfection samples, in each case with WT and Delta-N recorded on the same day following transfection. WT: −600 ± 102 pA (standard error of the mean [SEM], n = 8); Delta-N: −3300 ± 630 pA (SEM, n = 8). (D) Western blot detection of biotinylated surface-expressed CLC-2 from three independent experiments. (E) Summary data for electrophysiology and surface biotinylation experiments. Points representing individual experiments for Delta-N surface biotinylation (each normalized to WT) are shown. Individual data points for the electrophysiology experiments are shown in panel C. (F) Representative examples of experiments to evaluate current run-up in WT and Delta-N CLC-2. Left panels: Time course data. Following an initial voltage-family measurement (I–V protocol as in panel A, taken at point ‘1’), currents were monitored by 1 s pulses to −100 mV every 5 s for 5 min, after which a second voltage-family measurement was made (point 2), followed by application of AK-42 to facilitate leak subtraction, and a final voltage-family measurement at point 3. I–V traces are shown at right. (G) Summary data for ‘run-up’ experiments. Left panel: Normalized time-dependent currents for WT and Delta-N. Currents were first leak-subtracted (using the steady-state current after AK-42 application) and then normalized to the amplitude of the current measured in the first step of the 5-min sequence. Right panels: Leak-subtracted current levels at −100 mV from ‘initial’ and ‘final’ IV traces measured at points ‘1’ and ‘2’ in the time course (panel F). Average initial and final currents (pA ± SEM, n = 8) are WT: −600 ± 102 and −1400 ± 260; Delta-N: −3300 ± 630 and −2900 ± 420.
-
Figure 6—source data 1
Original file for the Western blot analysis in Figure 6D (anti-GFP).
- https://cdn.elifesciences.org/articles/90648/elife-90648-fig6-data1-v1.zip
-
Figure 6—source data 2
PDF containing Figure 6D and original scan of the Western blot (anti-GFP) with highlighted band and sample labels.
- https://cdn.elifesciences.org/articles/90648/elife-90648-fig6-data2-v1.zip
-
Figure 6—source data 3
Excel file containing numerical data for electrophysiology and Western blot results shown in Figure 6C–F.
- https://cdn.elifesciences.org/articles/90648/elife-90648-fig6-data3-v1.zip
Figure 6—figure supplement 1
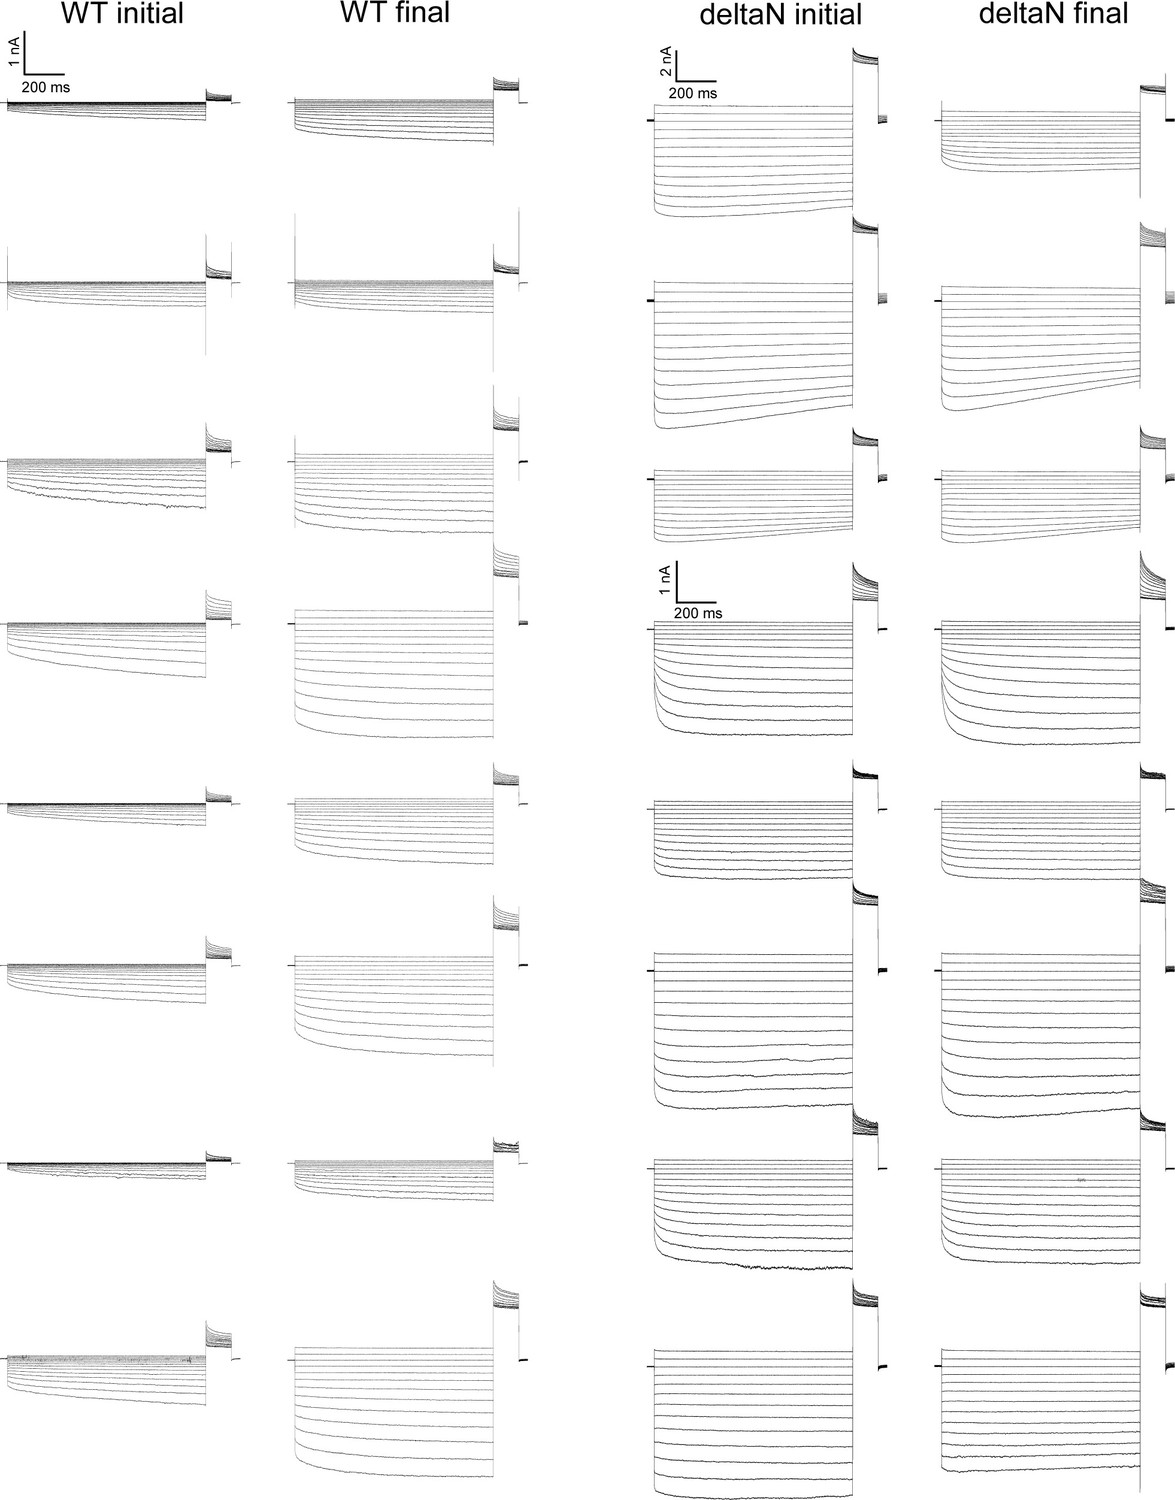
Data traces from the CLC-2 run-up experiments summarized in Figure 6G.
For Delta-N, separate scale bars indicate the currents for the top six and bottom 10 traces. AK-42 leak currents, not subtracted in these raw data traces, are summarized in Figure 6—source data 3.
Figure 6—figure supplement 2
CLC-2 current rectification.
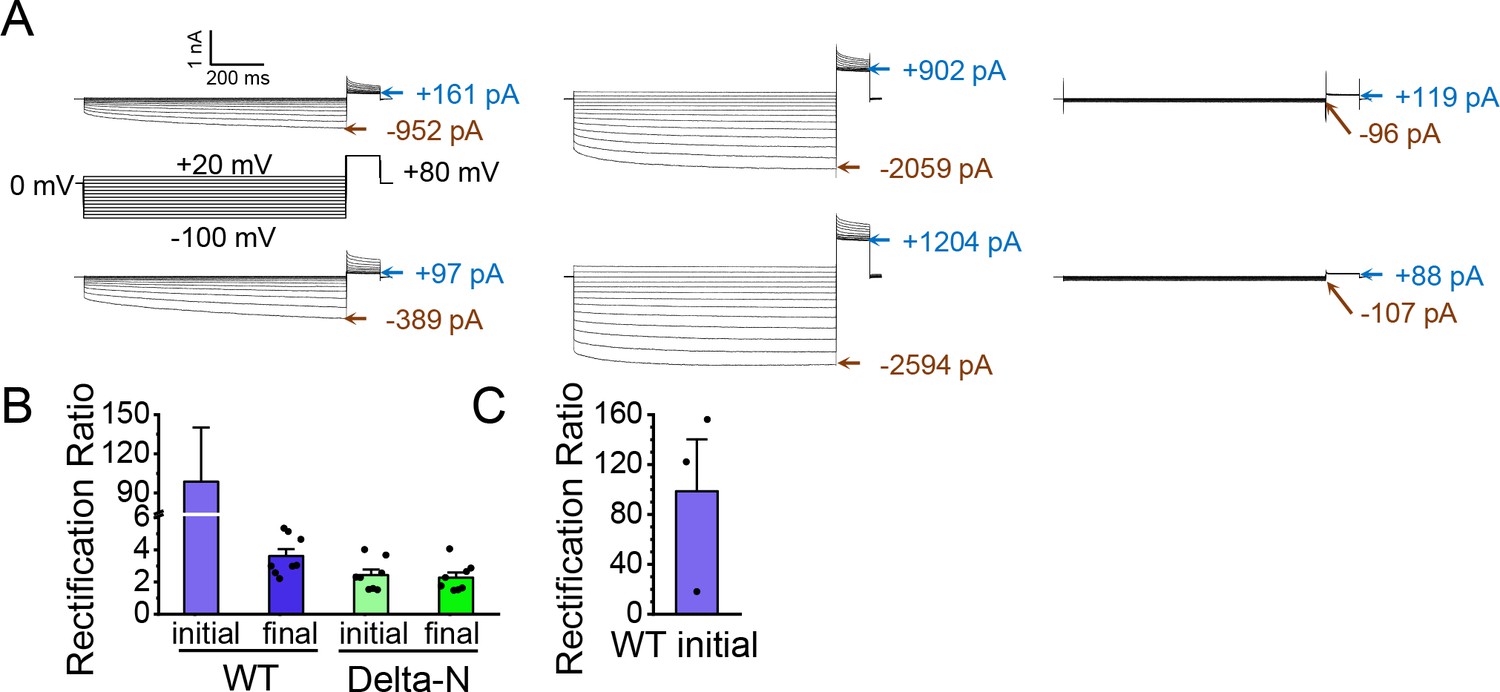
(A) Example traces from two experiments on WT CLC-2. Current values at end of the −100-mV test pulses and in the steady-state portion of the +80-mV tail pulse (following the +20-mV test pulse) are indicated. Robust AK-42 inhibition of the current at +80 mV indicates that CLC-2 is passing current at positive voltages. (B) Rectification ratios. Rectification was quantified by taking the ratio (absolute value) of the leak-subtracted currents at −100 and +80 mV. For WT initial currents, the low currents at +80 mV make this quantification challenging: for five out of eight experiments on WT CLC-2, the AK-42 current at +80 mV was greater than the initial WT current at +80 mV, likely due to an increase in leak over the course of the experiment (~15 min of voltage pulsing). Therefore, the rectification calculated for the WT initial currents (99 ± 34, standard error of the mean [SEM], n = 3) has substantial uncertainty. That said, such high rectification is consistent with reports of CLC-2 rectification throughout the literature (Park et al., 1998; Arreola et al., 2002; Jentsch and Pusch, 2018). On the other hand, Delta-N currents display only mild rectification, which is straightforward to quantify given the high signal:noise (high AK-42-sensitive current relative to background), and which does not change in response to voltage pulsing. For ‘WT-final’, the rectification ratio similarly can be accurately quantified. Thus, while the high uncertainty and variance in estimating WT initial rectification precludes quantitative statistical comparisons, these data strongly suggest that WT CLC-2 current rectification decreases in parallel to current run-up. (C) WT initial rectification ratio from panel B replotted to show the individual data points from the three experiments in which AK-42 current at +80 mV was less than the initial WT current at +80 mV. Data for all experiments are summarized in Figure 6—source data 3.
Figure 7 with 9 supplements
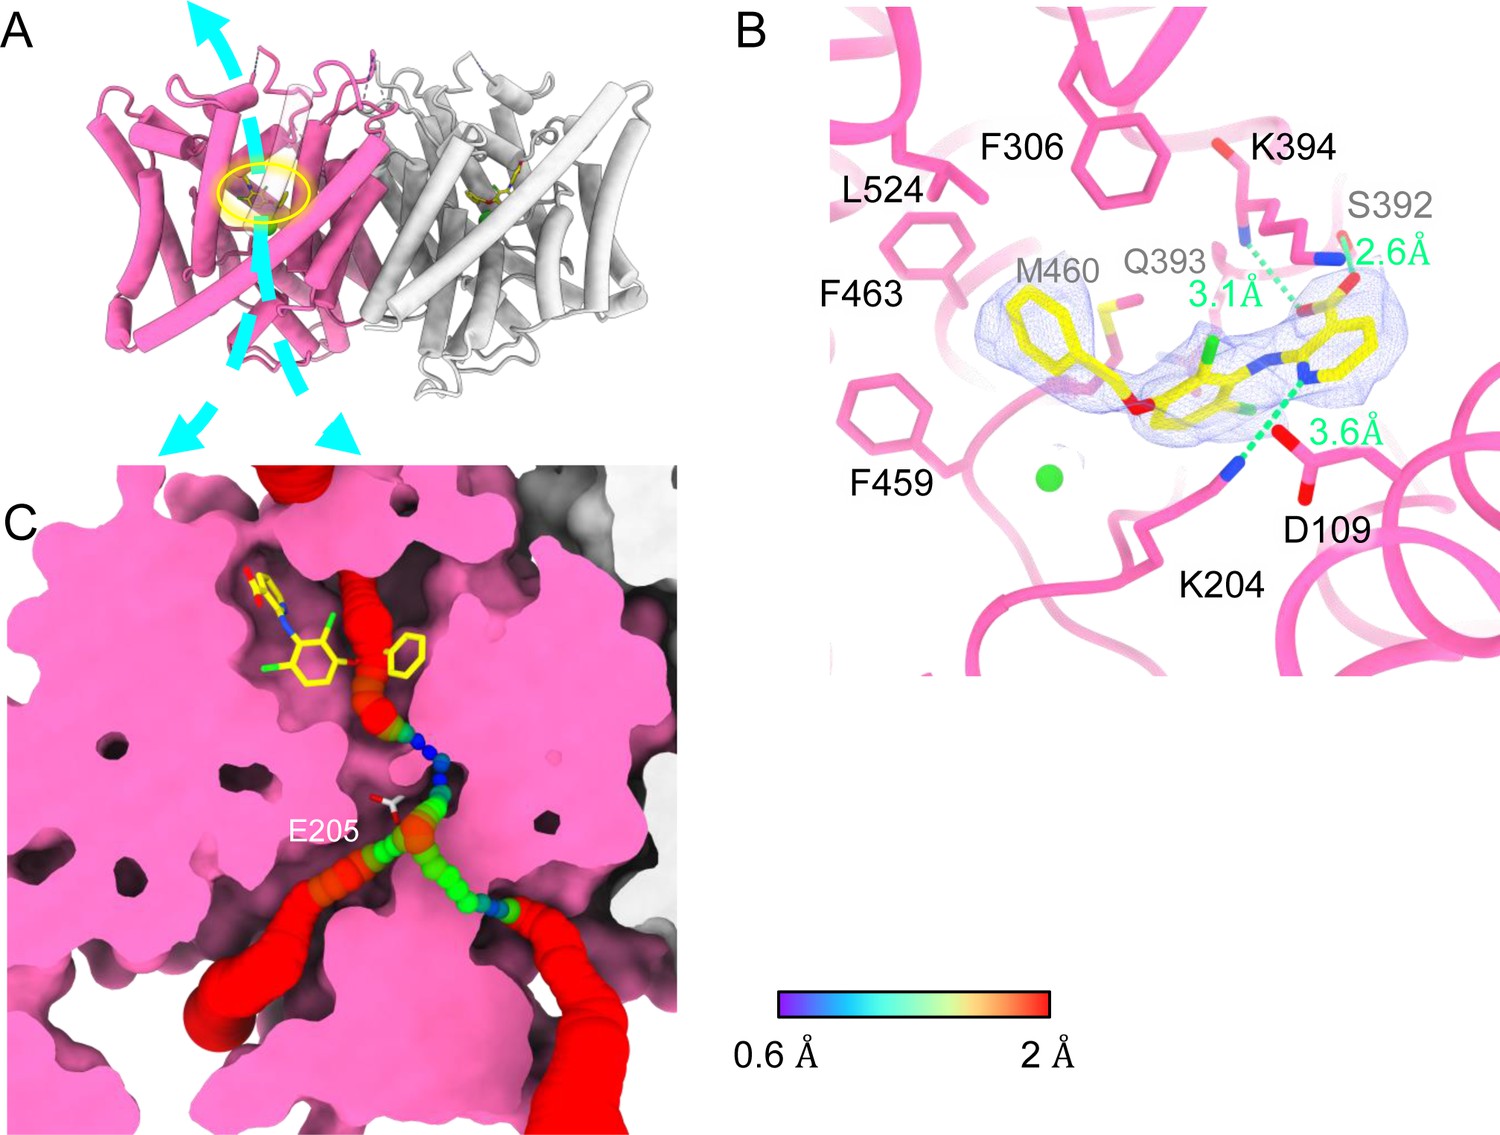
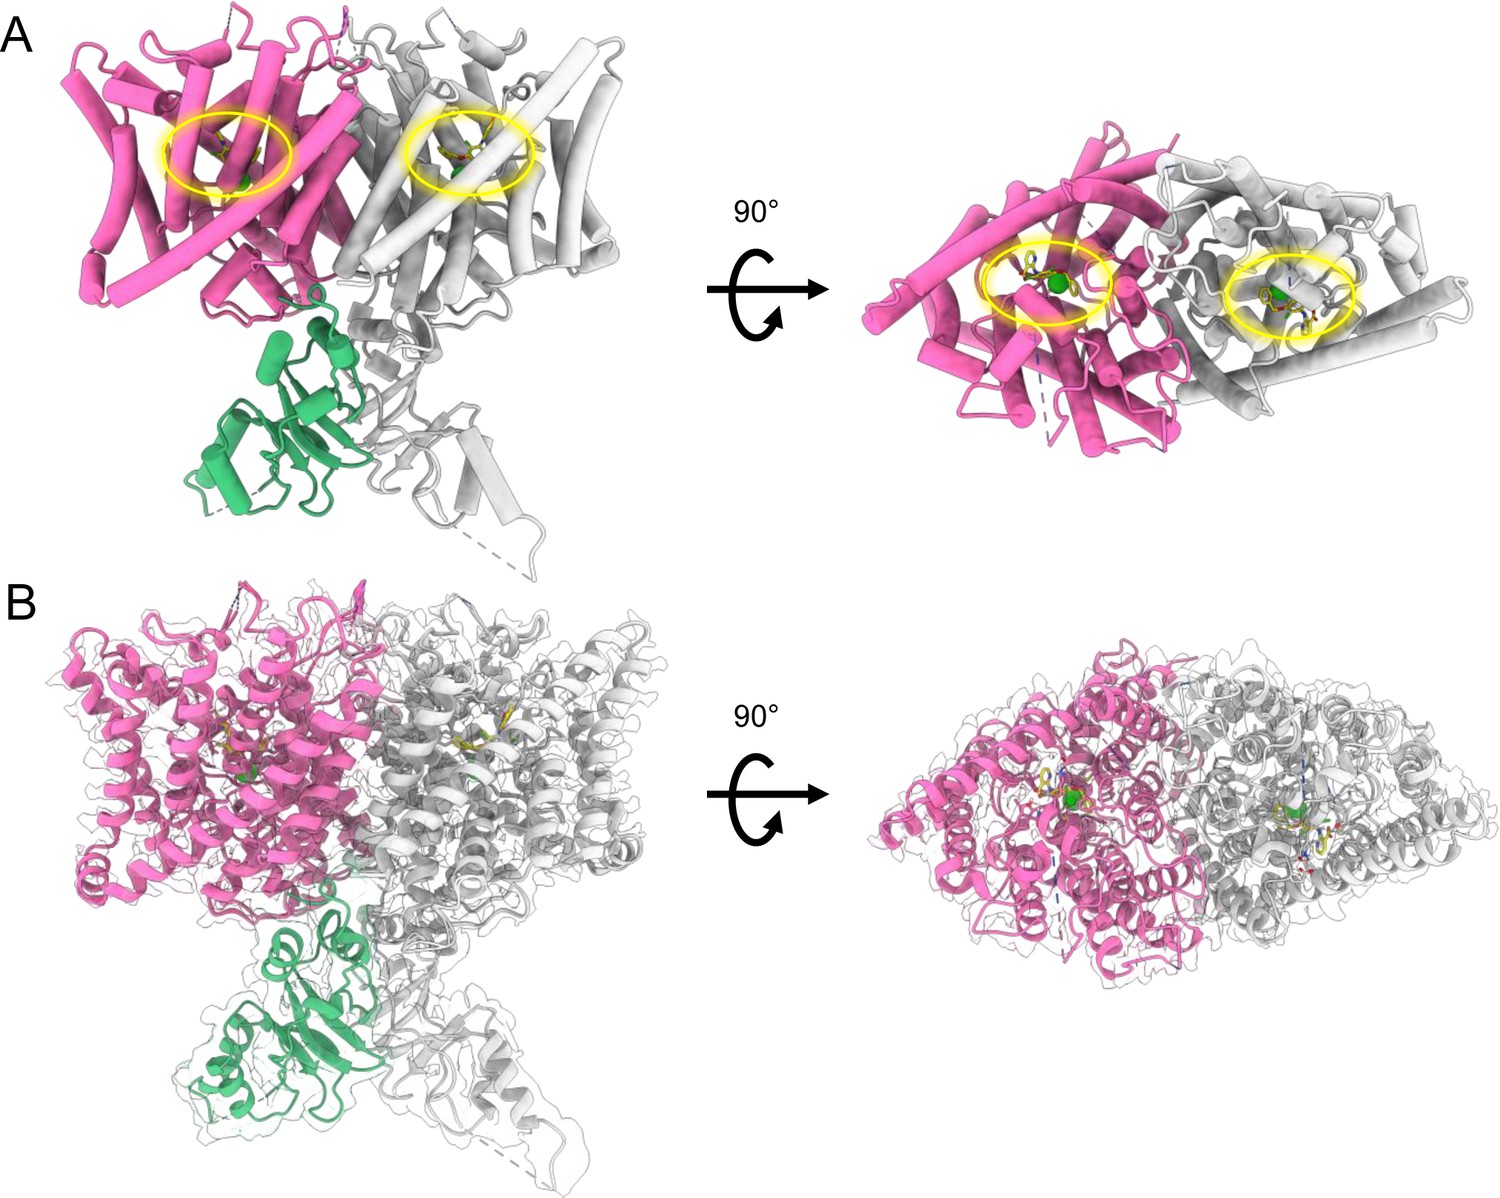
Bound AK-42 blocks the Cl− pathway in CLC-2.
(A) Transmembrane (TM) domain structure of the CLC-2 structure in complex with AK-42 (CLC2-TM-AK42) at 2.74 Å. The identical subunits of the homodimer are shown in hot pink and gray; Cl− ions are shown as green balls. Bound AK-42 is highlighted with a yellow circle on the pink subunit. The cyan arrow indicates the Cl− pathway. (B) Zoomed-in view of the AK-42-binding site (contour level: 0.91, 6.0 σ). (C) A sliced view of CLC-2 showing AK-42 (yellow carbon atoms; CPK coloring on non-carbon atoms) and Egate (CPK sticks). Both AK-42 and Egate obstruct the Cl− pathway, displayed as a color map.
Figure 7—figure supplement 1
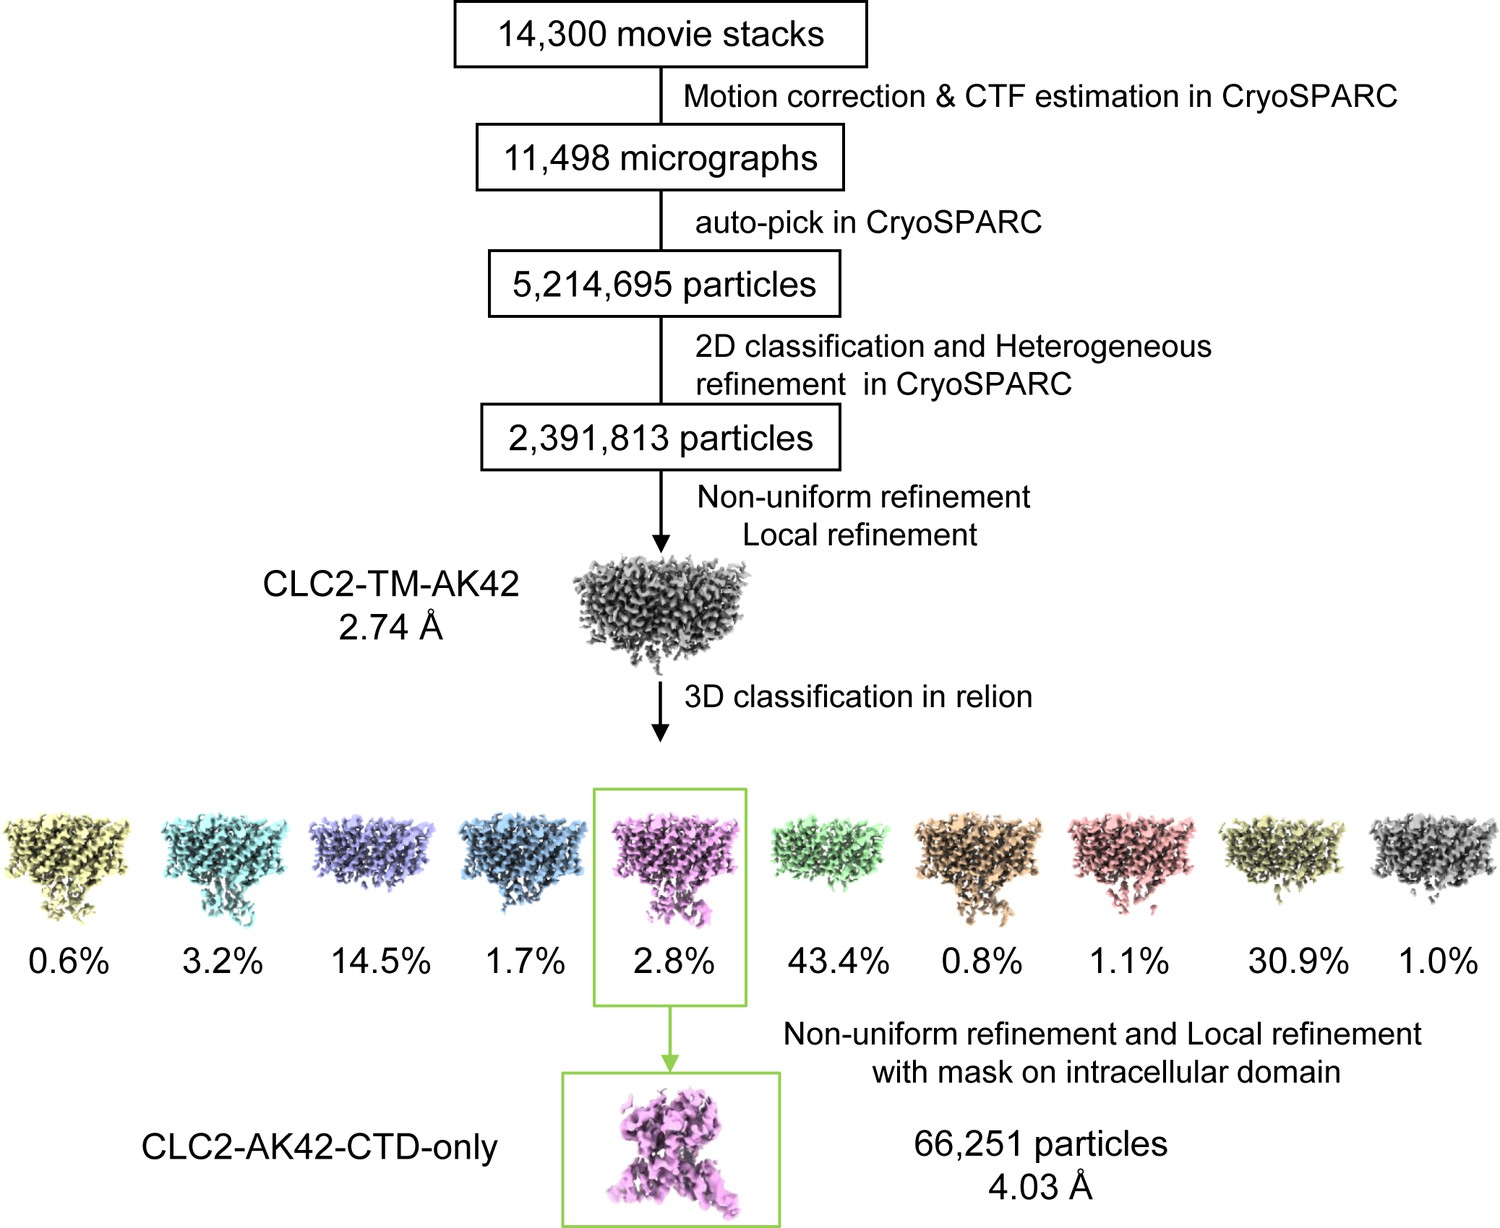
CryoEM workflow of the CLC2-TM-AK42 single-particle cryoEM data processing.
A total of 14,300 movie stacks were collected on a 300 kV Titan Krios cryo-electron microscope. cryoSPRAC was used for 2D classification and CLC2-TM-AK42 density map was obtained after 2D classification. Relion was used for 3D classification.
Figure 7—figure supplement 2
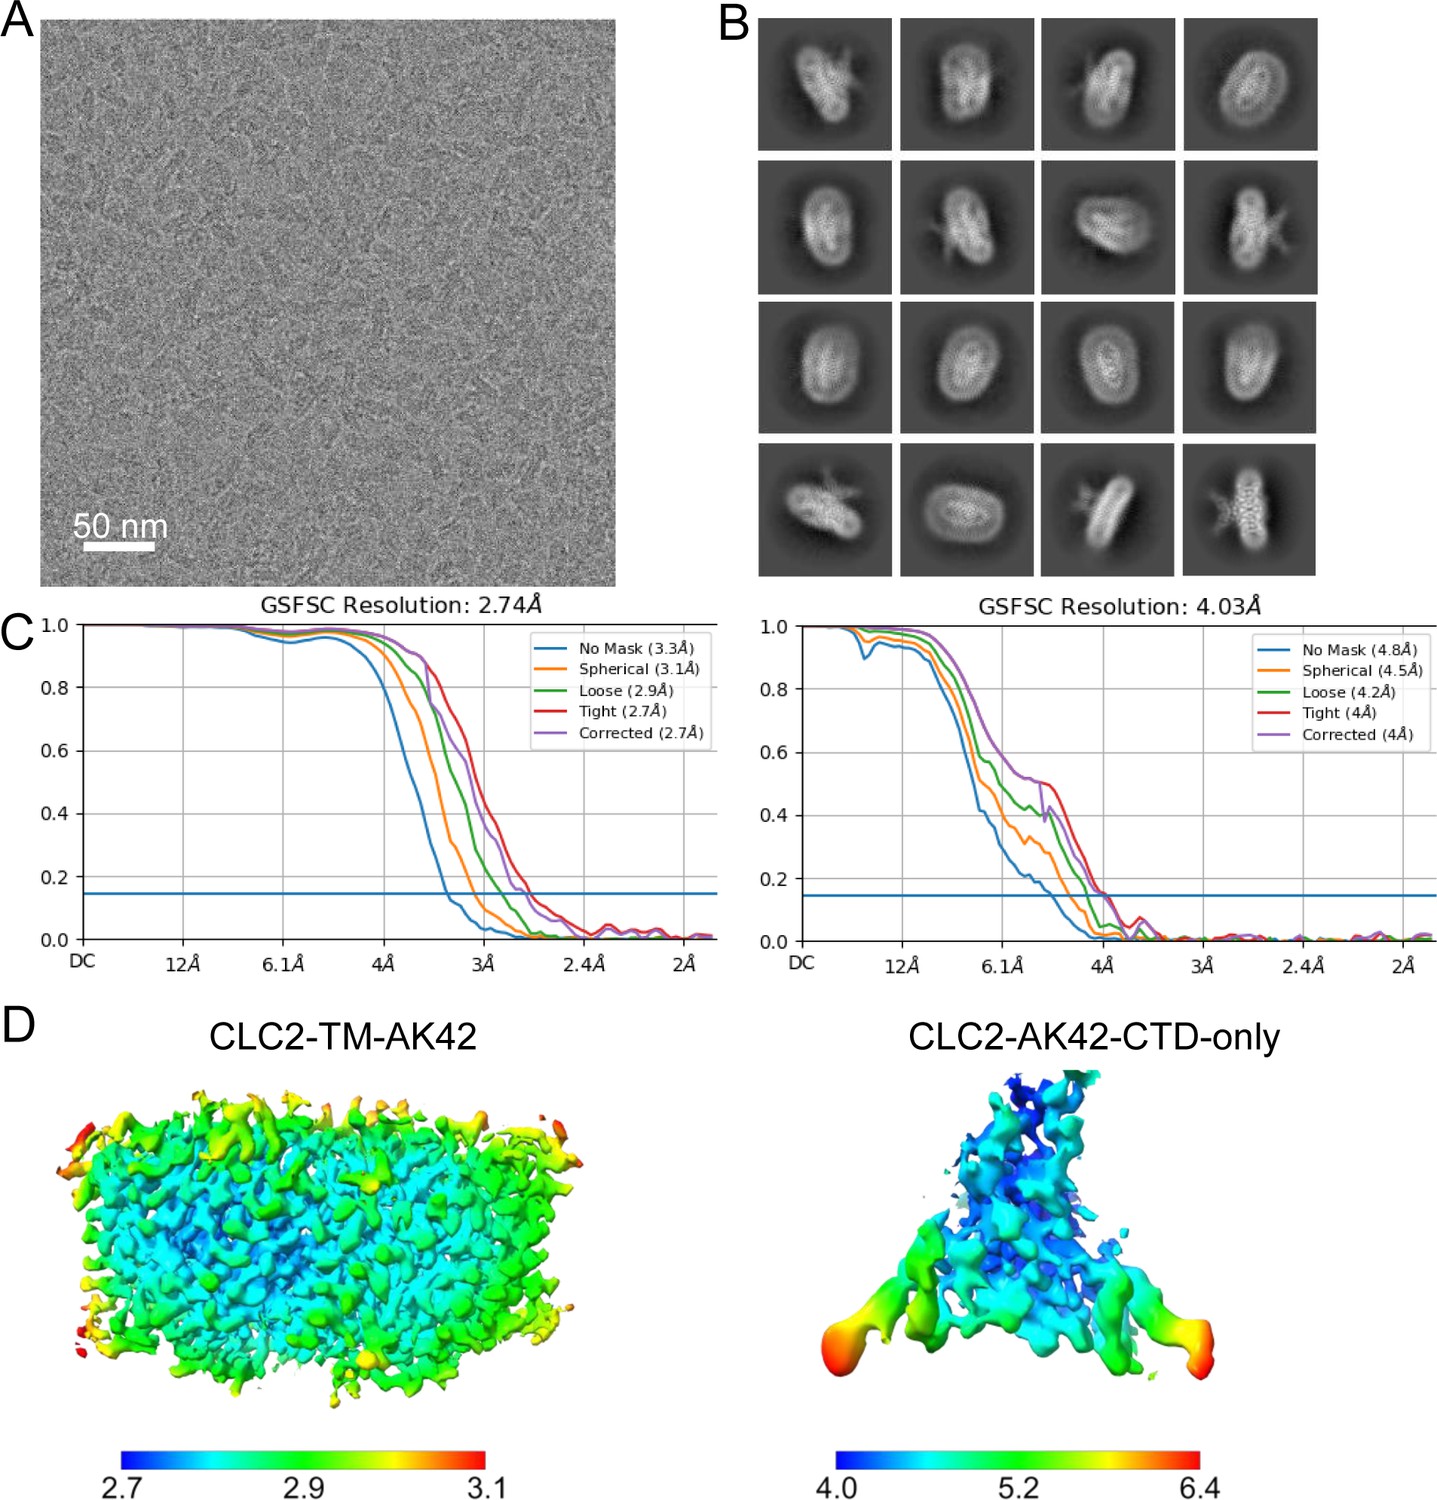
Micrograph and 2D classes and structure validation of CLC2-AK42.
(A) Representative motion-corrected cryoEM micrograph. (B) 2D class averages. (C) Gold standard Fourier shell correlation (FSC) plots calculated in cryoSPARC for CLC2-TM-AK42 (left) and CLC2-AK42-CTD-only (right). (D) Local resolution of the cryoEM map for CLC2-TM-AK42 (left) and CLC2-AK42-CTD-only (right).
Figure 7—figure supplement 3
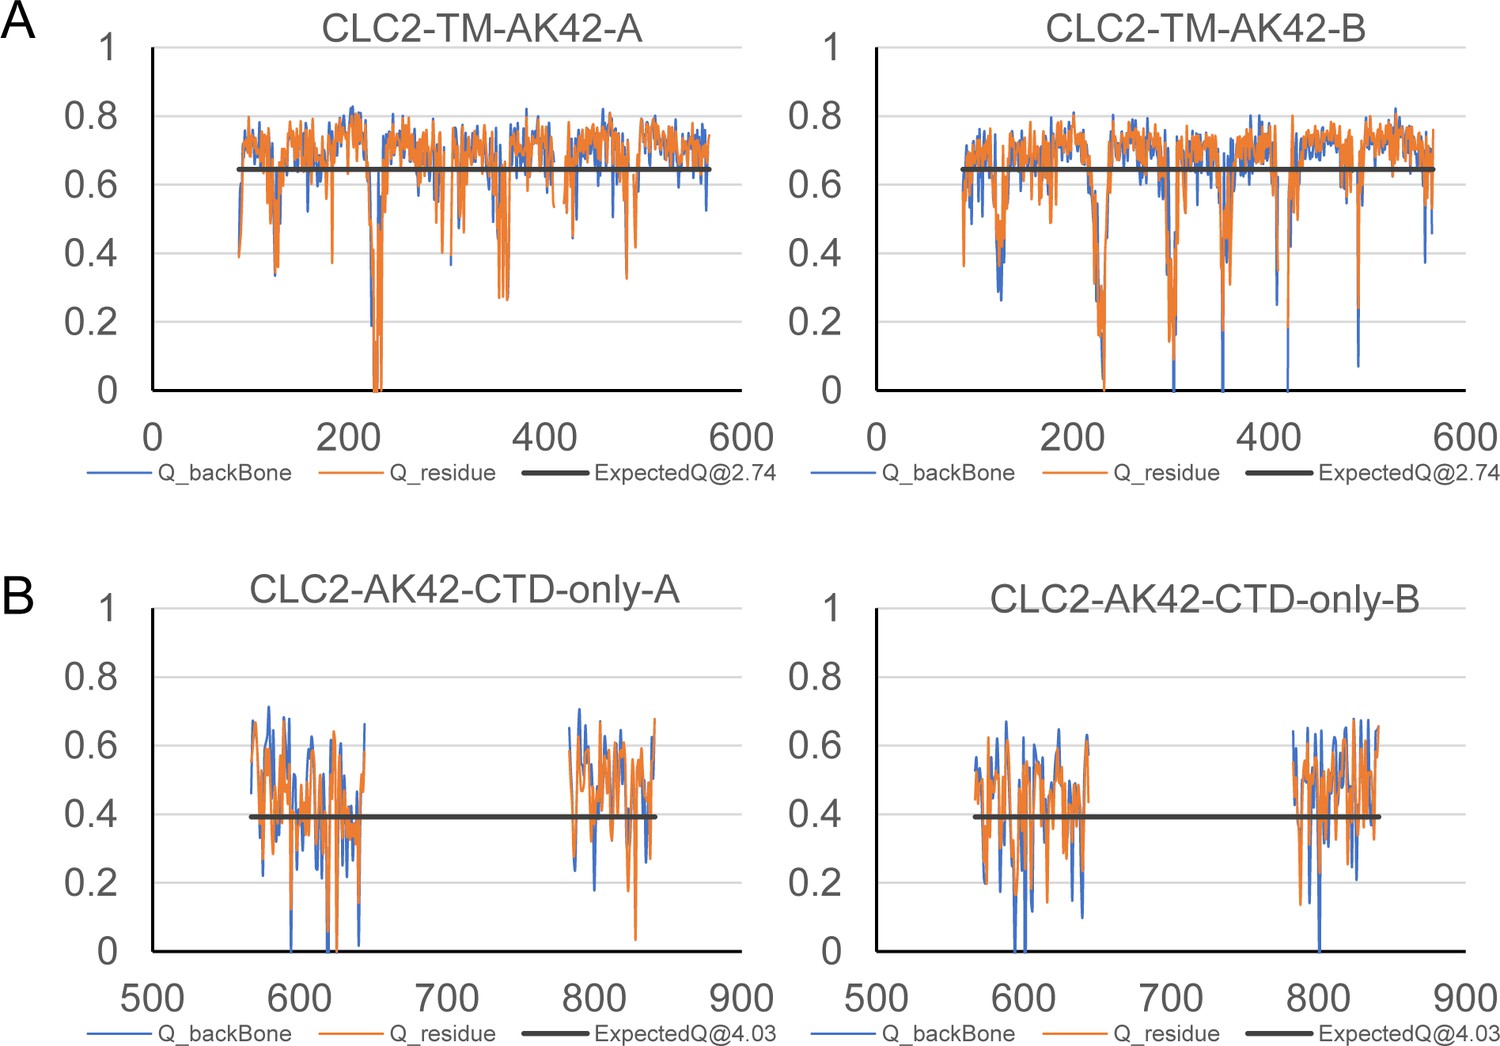
Model validation using Q-scores.
(A) Q-scores of CLC2-TM-AK42 for subunits A (left) and B (right). (B) Q-scores of CLC2-AK42-CTD-only for subunits A (left) and B (right). The black line represents the expected Q-score at respective resolution based on the correlation between Q-scores and map resolution.
Figure 7—figure supplement 4
cryoEM map and structure of CLC2-AK42.
(A) CryoEM model of CLC2-TM-AK42 with docked C-terminal domain (CTD). The transmembrane (TM) region is shown in hot pink and gray. The CTD is shown in green and gray. AK-42 is shown in yellow and highlighted by yellow circles. Chloride ions are shown in green. (B) CryoEM model overlay with density map of CLC2-AK42. Contour level: 0.83, 6.8 σ (TM region); 0.35, 14 σ (CTD).
Figure 7—figure supplement 5
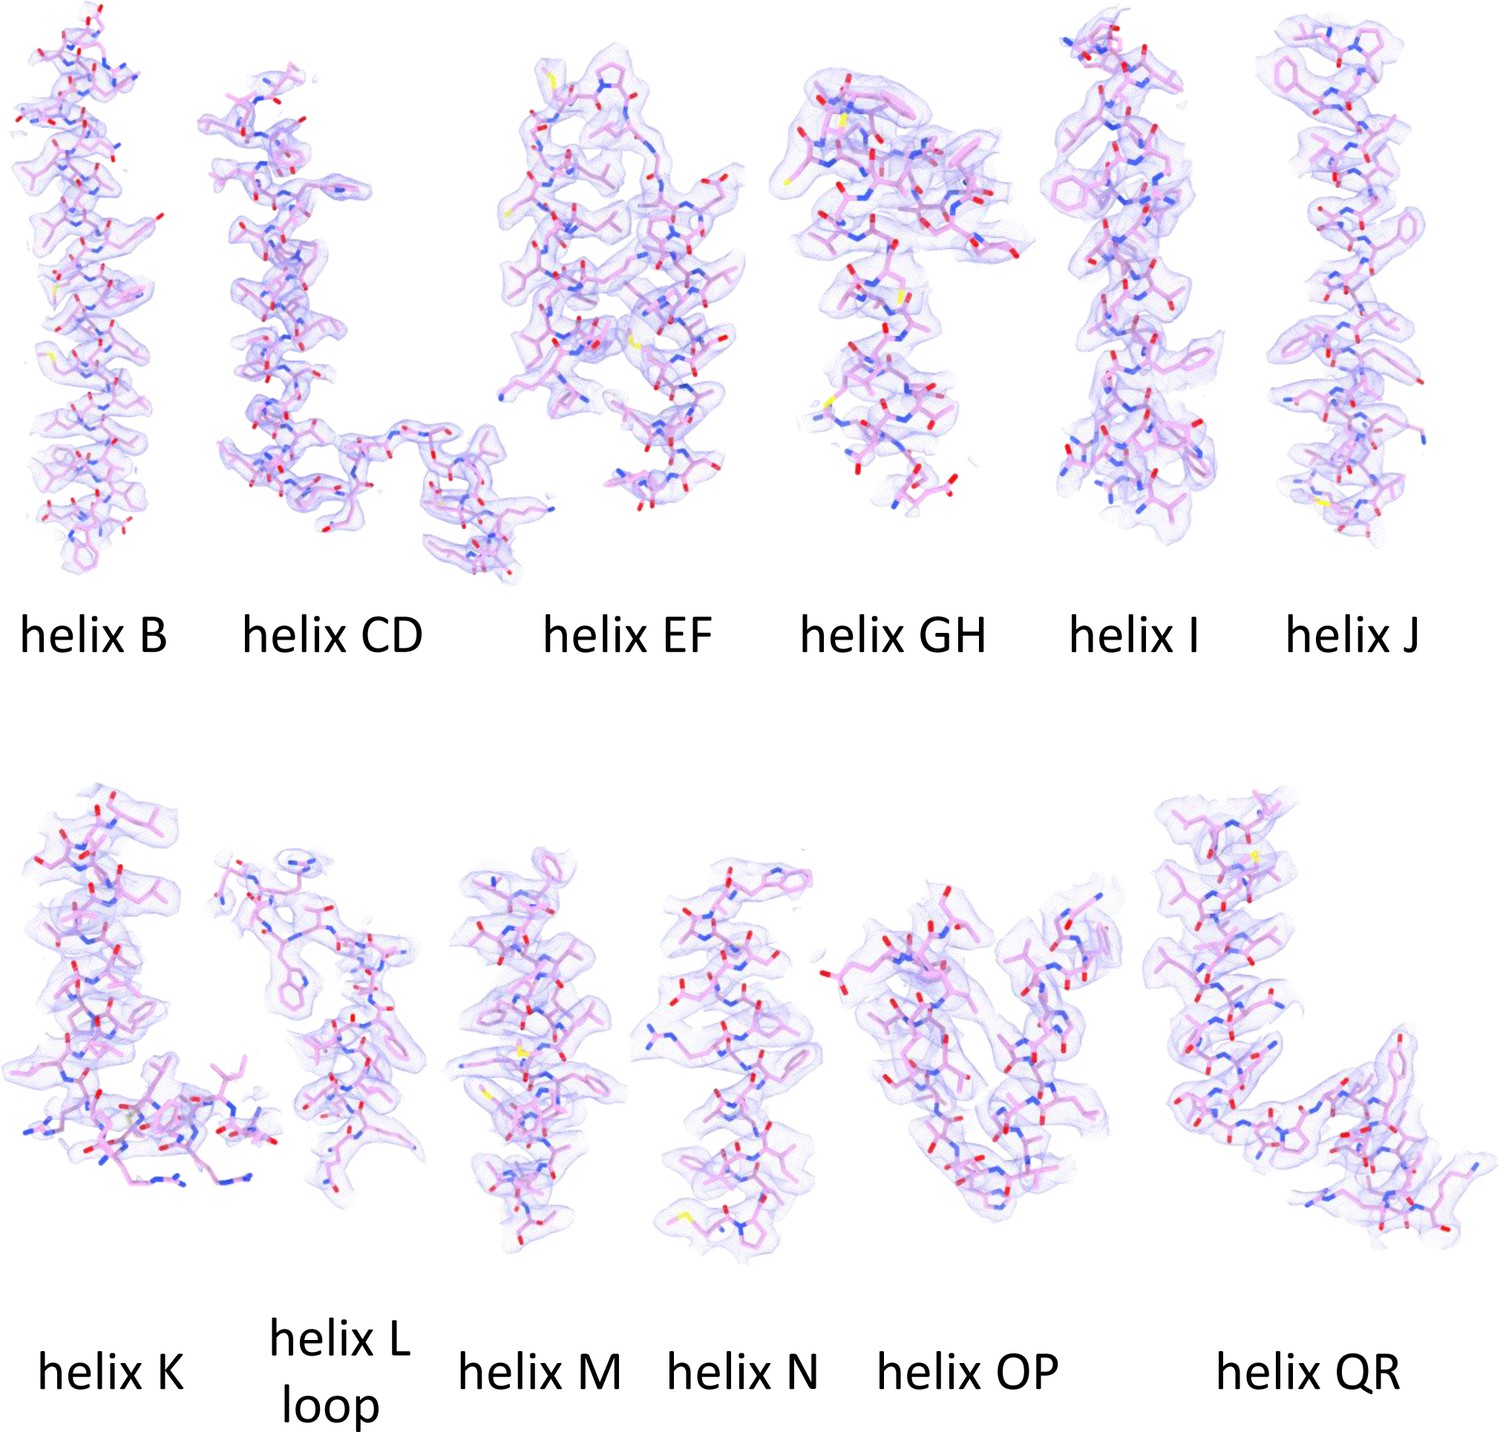
Helix map of CLC2-TM-AK42.
CryoEM densities and model of CLC2-AK42 transmembrane helices (contour level: 0.52, 3.4 σ).
Figure 7—figure supplement 6

Density overlay at key Cl− pathway residues.
Zoomed-in view highlighting residues S162, E205, Y553, and the bound chloride ion, with cryoEM density overlay (contour level: 1.4, 9.0 σ).
Figure 7—figure supplement 7
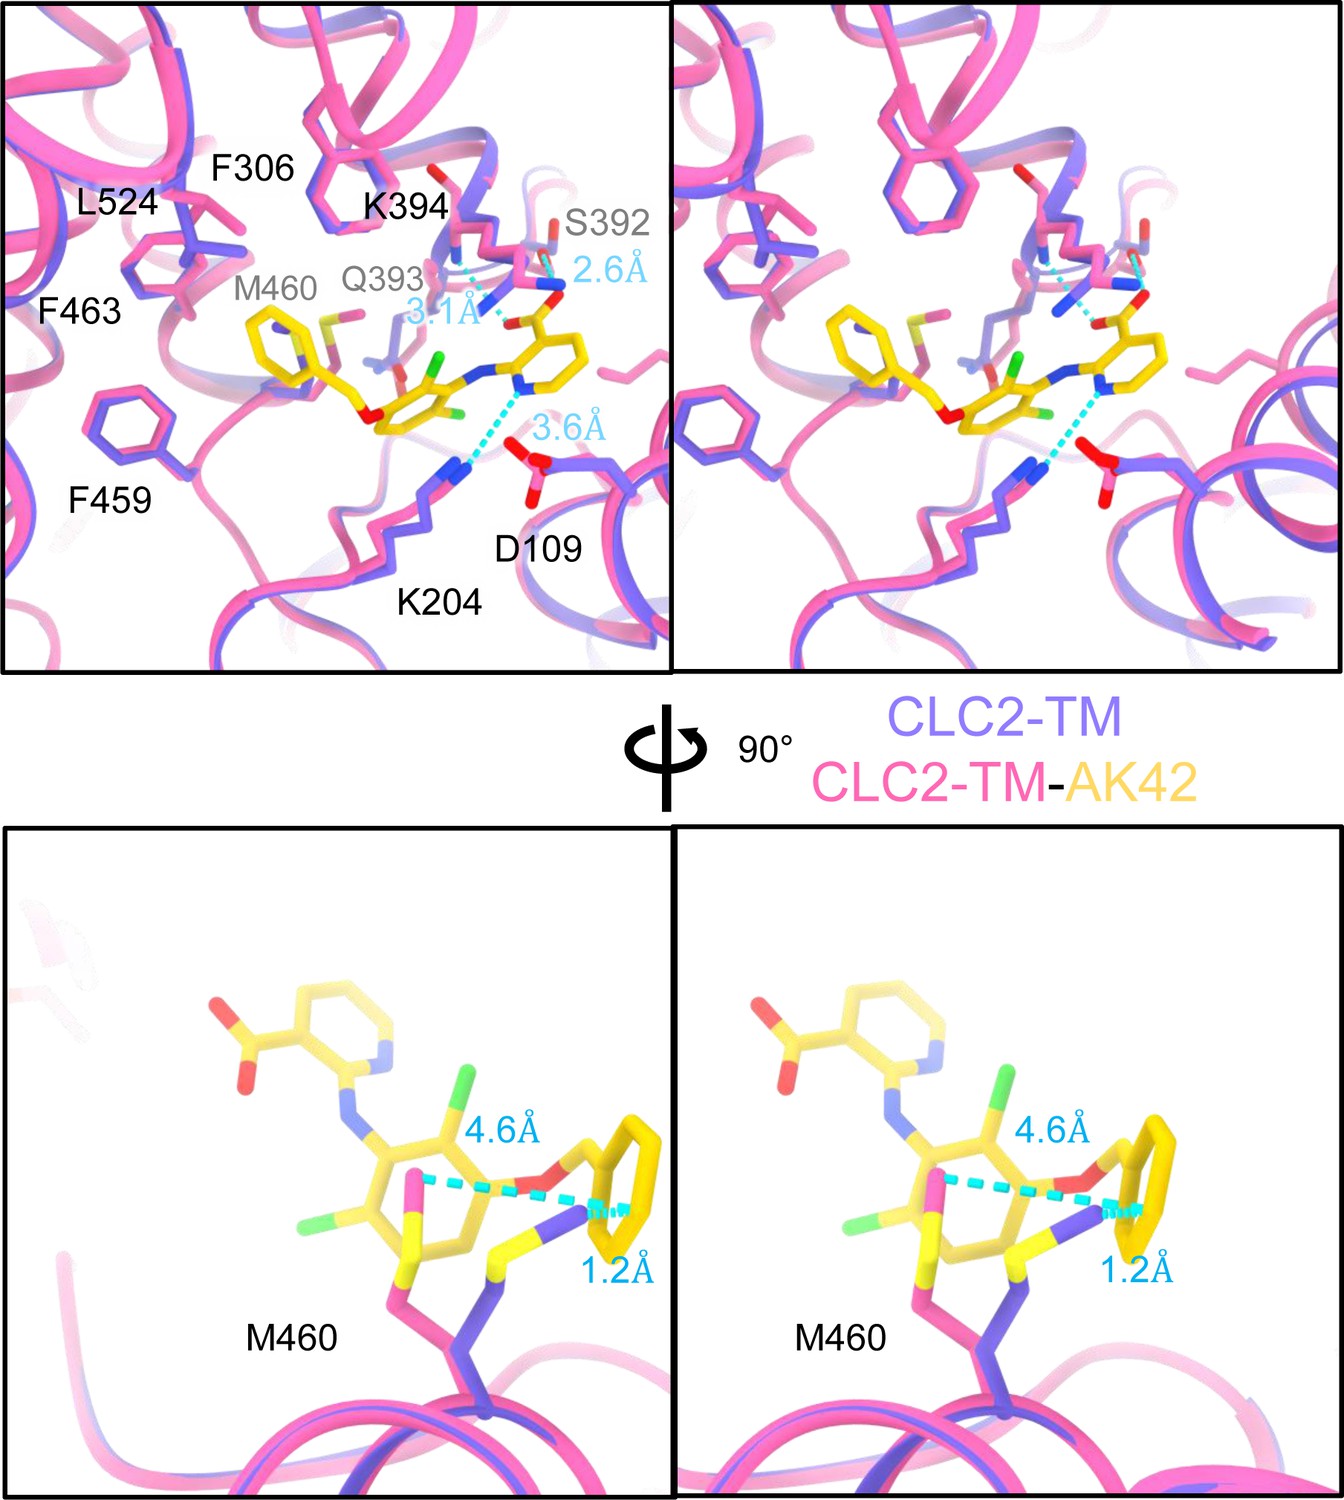
AK-42-binding site comparison between CLC2-TM and CLC2-TM-AK42.
Top: Stereo view of structural overlay at the AK-42-binding site. Hydrogen bonds between AK-42 and residues K204, S392, K394 are indicated by blue dashed lines. Bottom: A view highlighting the movement of residue M460 to make space for AK-42.
Figure 7—figure supplement 8
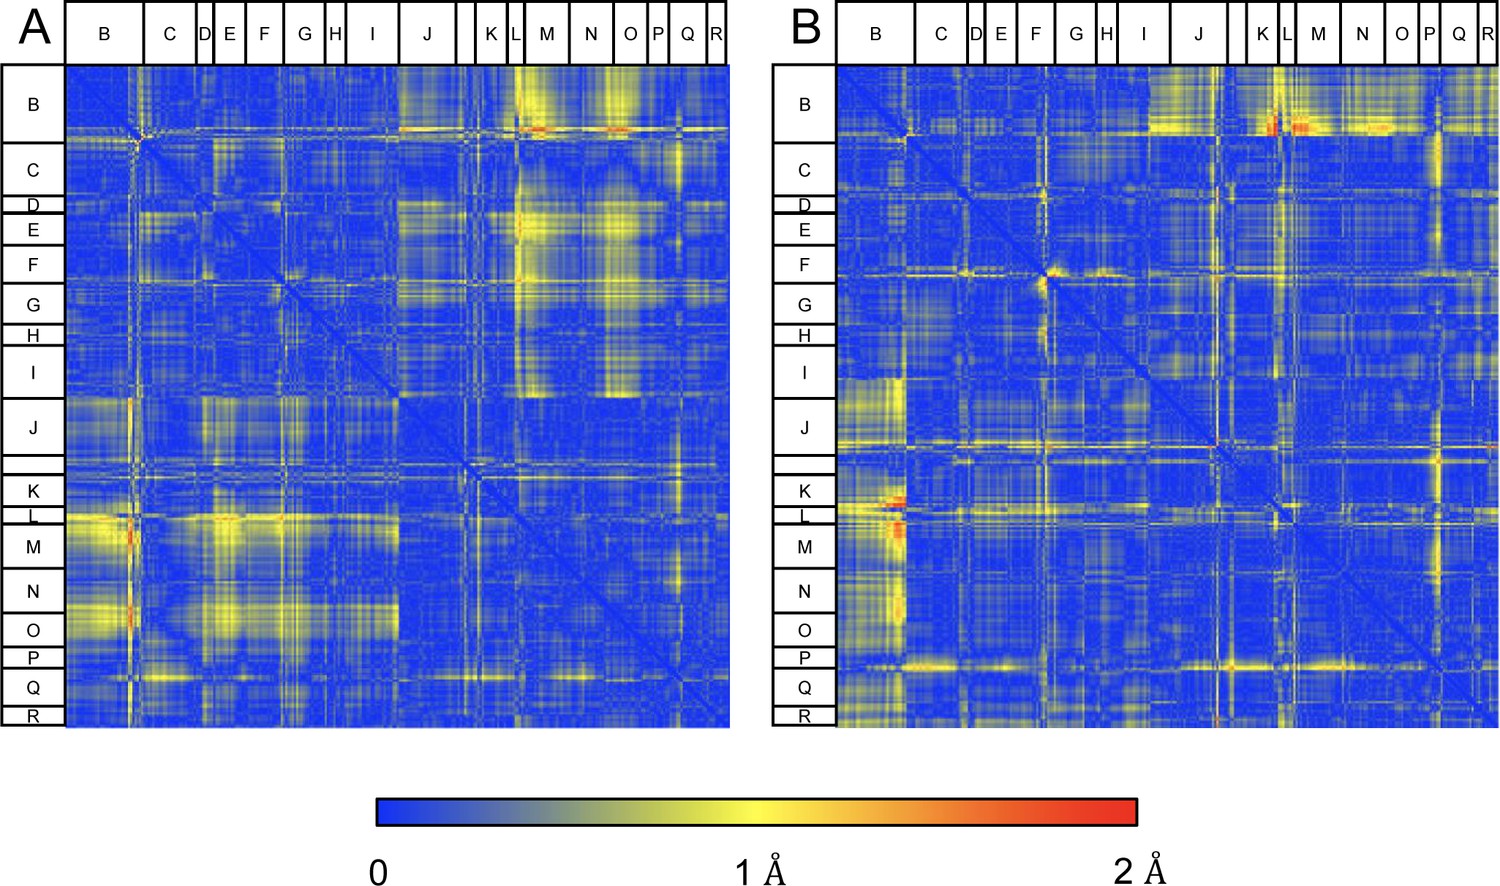
Structural comparison of CLC2-TM and CLC2-TM-AK42.
Difference distance matrices comparing Cɑ residues on transmembrane (TM) helices between CLC2-TM and CLC2-TM-AK42 in subunits A (A) or B (B). Residues in loops connecting helices, where there is low confidence in the model building (Q-score lower than the expected Q-score of 0.65), were omitted from the matrices.
Figure 7—figure supplement 9
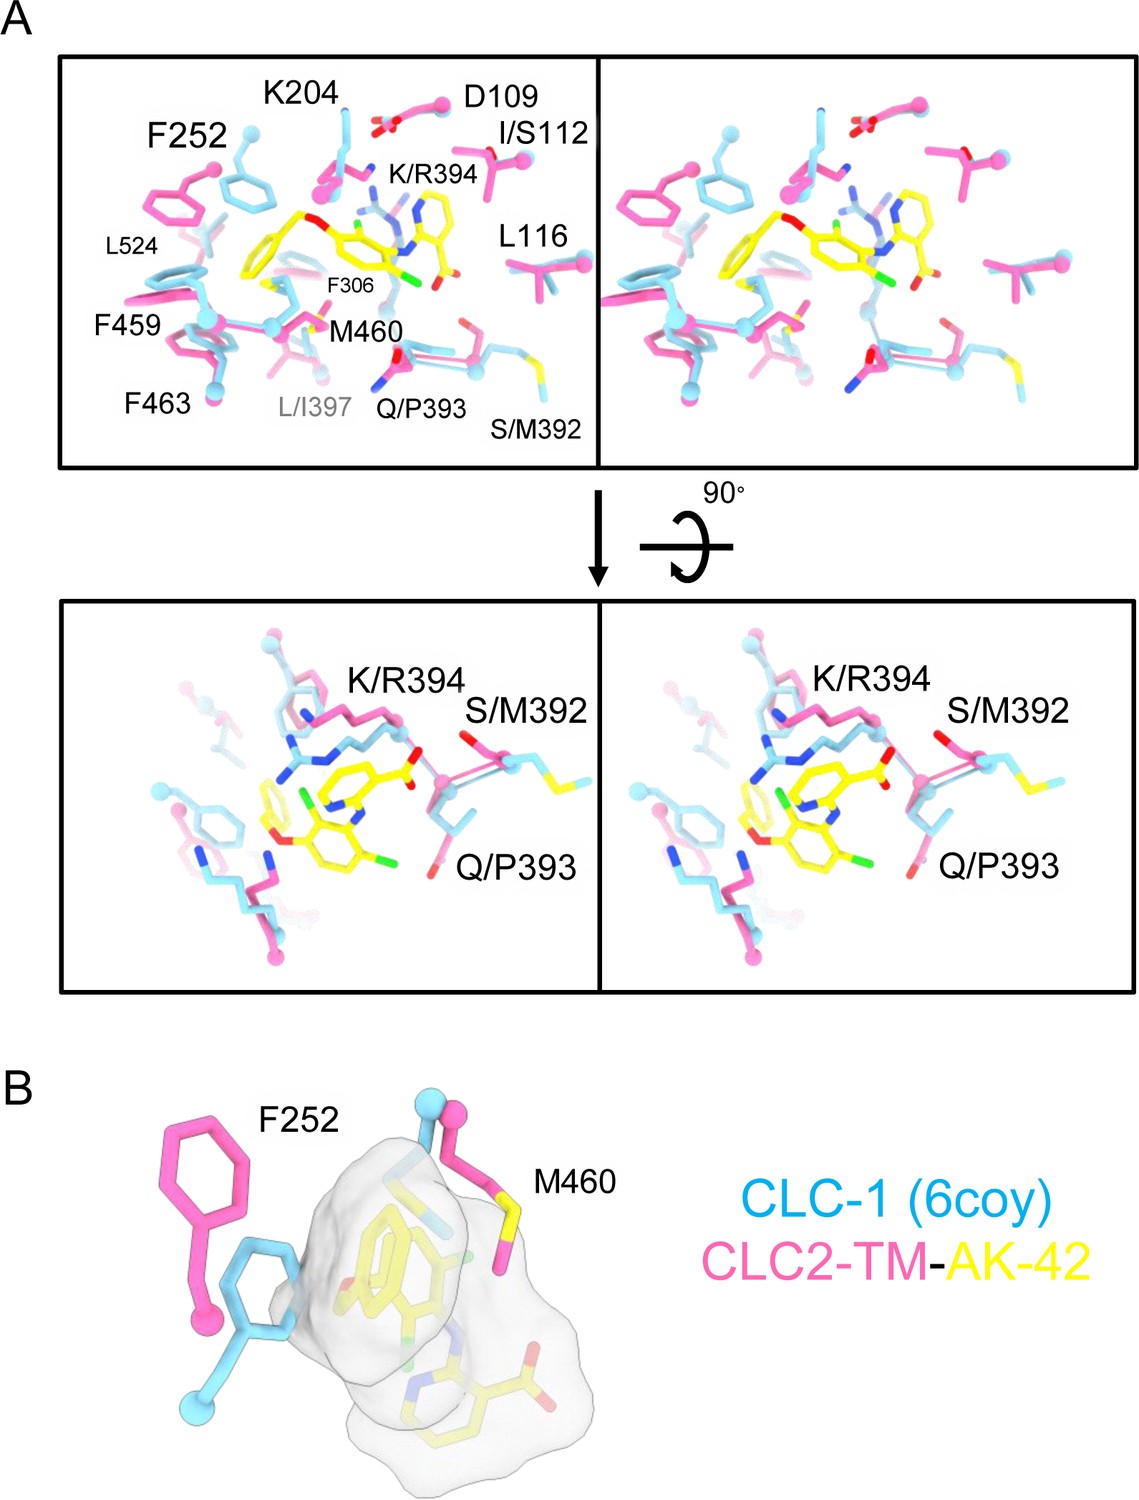
AK-42-binding site comparison between CLC-2 and CLC-1.
(A) Top: Stereo view of the AK-42-binding site in CLC2-TM-AK42 (hot pink) overlaid with the same region in CLC-1 (blue, PDB:6coy). Residue numbers correspond to those of CLC-2. The five residues that differ between CLC-2 and CLC-1 are: I112 (S139), S392 (M419), Q393 (P420), K394 (R421), and L397 (I424). Bottom: Rotated (stereo) view of AK-42-binding site to compare residues S392, Q393, and K394 in CLC-2 versus M419, P420, and R421 in CLC-1. These three were calculated to contribute most significantly to the AK-42-binding energy (Ma et al., 2023). (B) Residues in CLC-1 predicted to clash with AK-42. AK-42 is shown in yellow sticks and white surface. F252 and M460 in CLC-2 correspond to F279 and M485 in CLC-1.
Figure 8
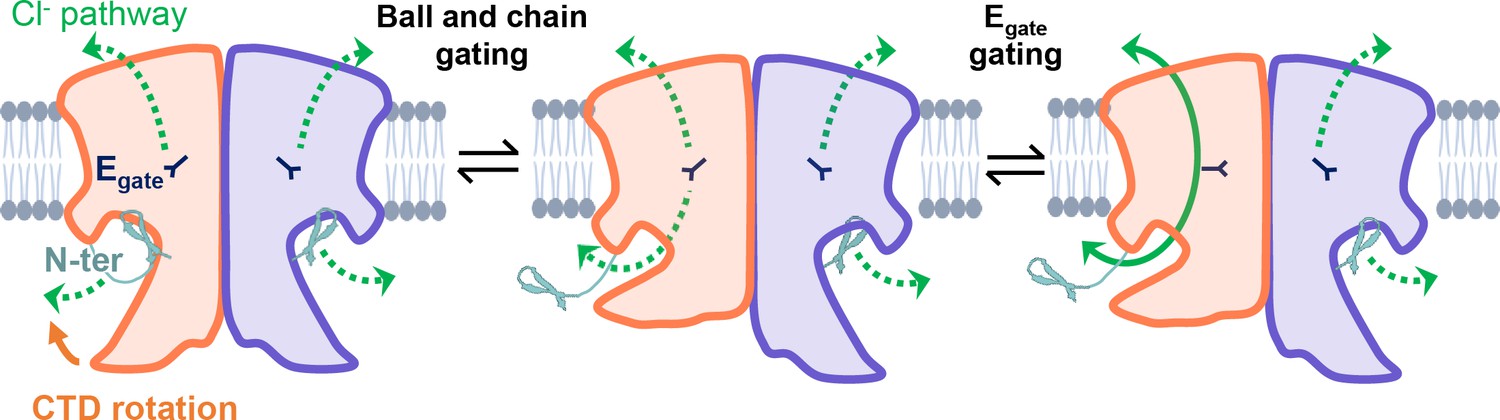
CLC-2’s gating is illustrated based on our new structural data.
Opening of each protopore requires at least two events – unblock by the N-terminal hairpin (N-ter) and rotation of Egate away from the permeation pathway. The dashed green arrow represents the Cl− conduction pathway. Hairpin unblock (ball-and-chain gating) is coupled to conformational change of the C-terminal domain (CTD): rotation of the CTD toward the membrane precludes hairpin binding, thus facilitating channel opening. Opening of the channel pore following these two events is depicted for one subunit of the homodimer (filled green arrow).
Videos
Video 1
CLC-2 pore detected using Caver.
Video 2
CLC-1 pore detected using Caver.
Video 3
CLC-ec1 caver-detected pathway.
Video 4
Rigid body movement from CLC2-CTDsym to CLC2-CTDasym.
Video 5
Hairpin surface potential.
Video 6
AK-42 density.
Additional files
-
MDAR checklist
- https://cdn.elifesciences.org/articles/90648/elife-90648-mdarchecklist1-v1.pdf
-
Supplementary file 1
cryoEM statistics.
- https://cdn.elifesciences.org/articles/90648/elife-90648-supp1-v1.docx
Download links
A two-part list of links to download the article, or parts of the article, in various formats.
Downloads (link to download the article as PDF)
Open citations (links to open the citations from this article in various online reference manager services)
Cite this article (links to download the citations from this article in formats compatible with various reference manager tools)
CryoEM structures of the human CLC-2 voltage-gated chloride channel reveal a ball-and-chain gating mechanism
eLife 12:RP90648.
https://doi.org/10.7554/eLife.90648.3


