Ribosome subunit attrition and activation of the p53–MDM4 axis dominate the response of MLL-rearranged cancer cells to WDR5 WIN site inhibition
- Department of Cell and Developmental Biology, Vanderbilt University School of Medicine, United States
- Department of Biostatistics, Vanderbilt University Medical Center, United States
- Center for Quantitative Sciences, Vanderbilt University Medical Center, United States
- Mass Spectrometry Research Center, Vanderbilt University School of Medicine, United States
- Department of Biochemistry, Vanderbilt University School of Medicine, United States
- Department of Medicine, Vanderbilt University Medical Center, United States
- Department of Pharmacology, Vanderbilt University School of Medicine, United States
- Department of Chemistry, Vanderbilt University, United States
Figures
Figure 1 with 2 supplements
Impact of WIN site inhibitors (WINi) on the transcriptome of MLLr cancer cells.
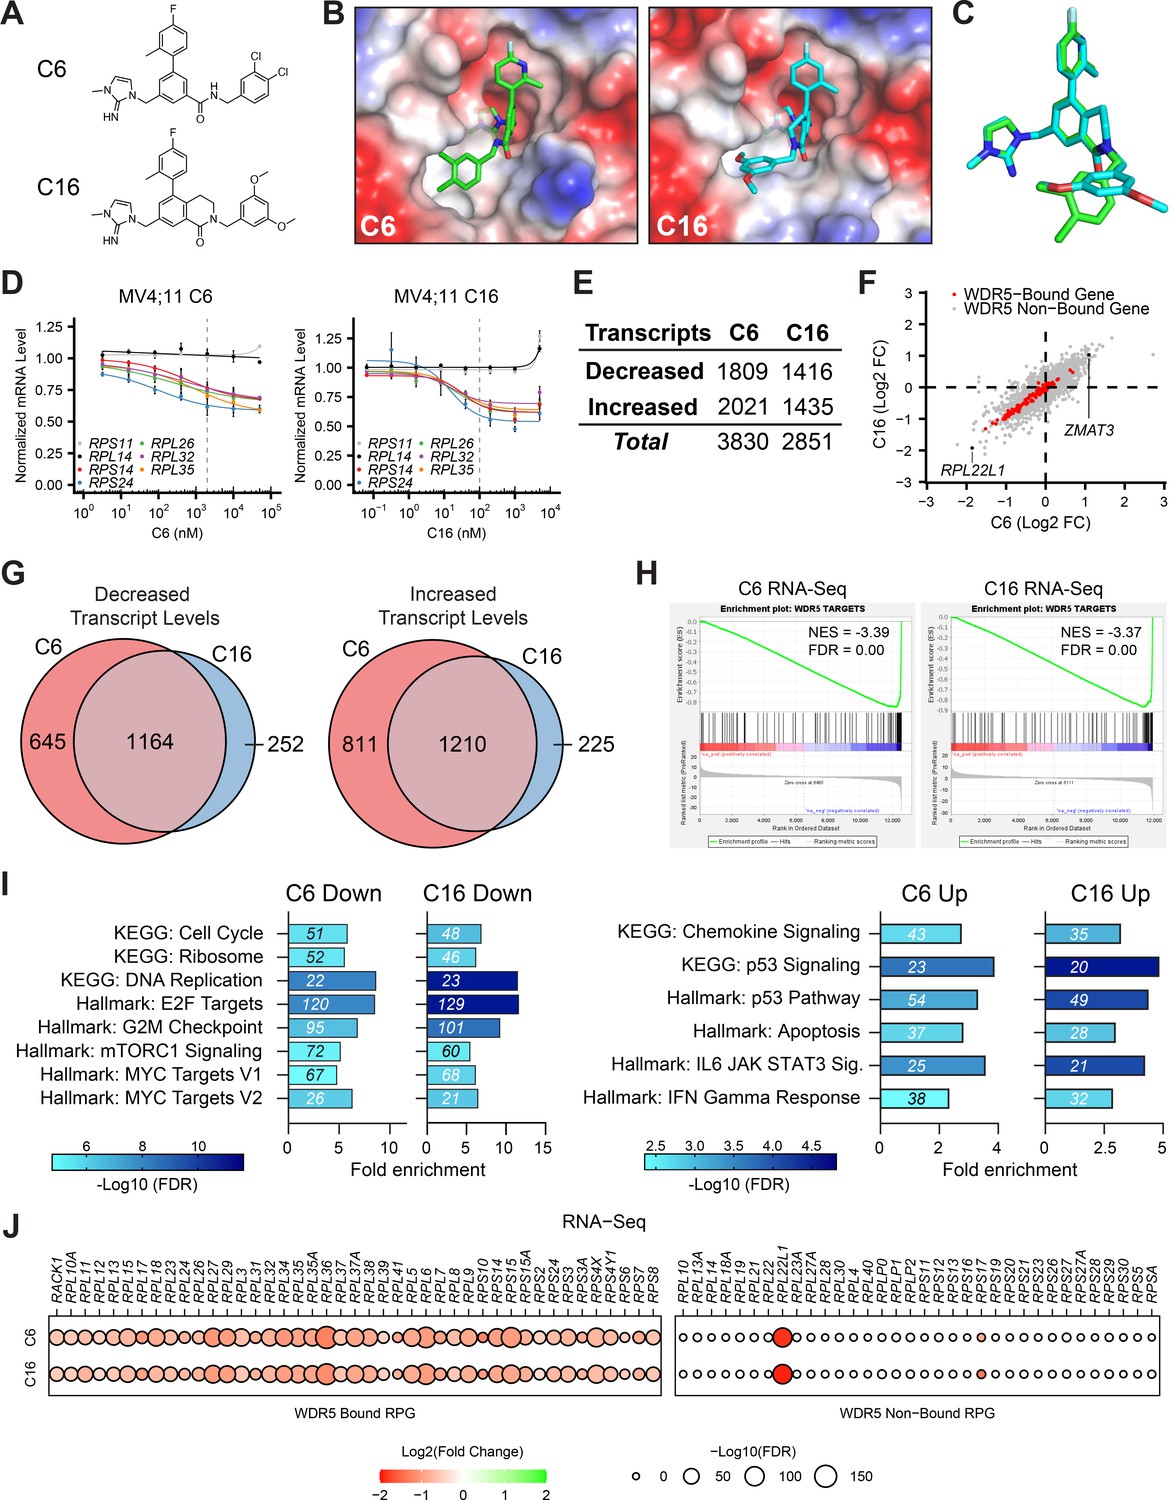
(A) Chemical structures of C6 and C16. (B) Crystal structures of C6 or C16 bound to the WIN site of WDR5 with electrostatic surfaces mapped (PDB IDs: 6E23 [Aho et al., 2019a]; 6UCS [Tian et al., 2020]). The image shows a close-up view of the WIN site. (C) Superimposed WIN site-binding conformations of C6 (green) and C16 (blue). (D) Transcript levels as determined by QuantiGene analysis of representative WDR5-bound (color) or non-bound (grayscale) ribosomal protein genes in MV4;11 cells treated with a serial dilution range of either C6 (left) or C16 (right) and relative to DMSO-treated cells (n = 2–3; mean ± SEM). Vertical dashed line indicates either 2 µM C6 (left) or 100 nM C16 (right). (E) Number of genes with significantly (false discovery rate [FDR] < 0.05) altered transcript levels following treatment of MV4;11 cells with C6 (2 µM) or C16 (100 nM) for 48 hr, as determined by RNA-Seq (n = 3). See Figure 1—source data 1 for complete output of RNA-seq analysis. (F) Comparison of gene expression changes elicited by C6 (x-axis) and C16 (y-axis), represented as Log2 fold change (FC) compared to DMSO. WDR5-bound genes are colored red. Locations of RPL22L1 and ZMAT3 are indicated. (G) Overlap of genes with decreased (left) or increased (right) transcript levels in MV4;11 cells treated with C6 or C16. (H) Gene set enrichment analysis (GSEA) showing the distribution of genes suppressed in MV4;11 cells in response to C6 (left) or C16 (right) against the list of all genes bound by WDR5 in those cells (Aho et al., 2019a). NES, normalized enrichment score. (I) Enrichment analysis of genes suppressed (left) or induced (right) by C6 or C16 in MV4;11 cells. KEGG and Hallmark.MSigDB pathways are shown. Fold enrichment of indicated pathways is presented on the x-axis, the number of genes is shown in italics in each bar, and colors represent -Log10 FDR. See Figure 1—source data 2 for additional GSEA (Hallmark) and over-representation analysis (ORA) (Hallmark) analyses of differentially expressed genes. (J) Transcript level changes in WDR5-bound (left) and non-bound (right) RPGs elicited by C6 (top) or C16 (bottom).
-
Figure 1—source data 1
Output of RNA-seq analysis of MV4;11 cells treated with C6/C16.
- https://cdn.elifesciences.org/articles/90683/elife-90683-fig1-data1-v1.xlsx
-
Figure 1—source data 2
GSEA Hallmark and over-representation analysis (ORA) Hallmark enrichment analysis of differentially expressed genes in RNA-seq.
- https://cdn.elifesciences.org/articles/90683/elife-90683-fig1-data2-v1.xlsx
Figure 1—figure supplement 1
Transcript changes elicited by WIN site inhibitors (WINi) in MLLr cancer cells.
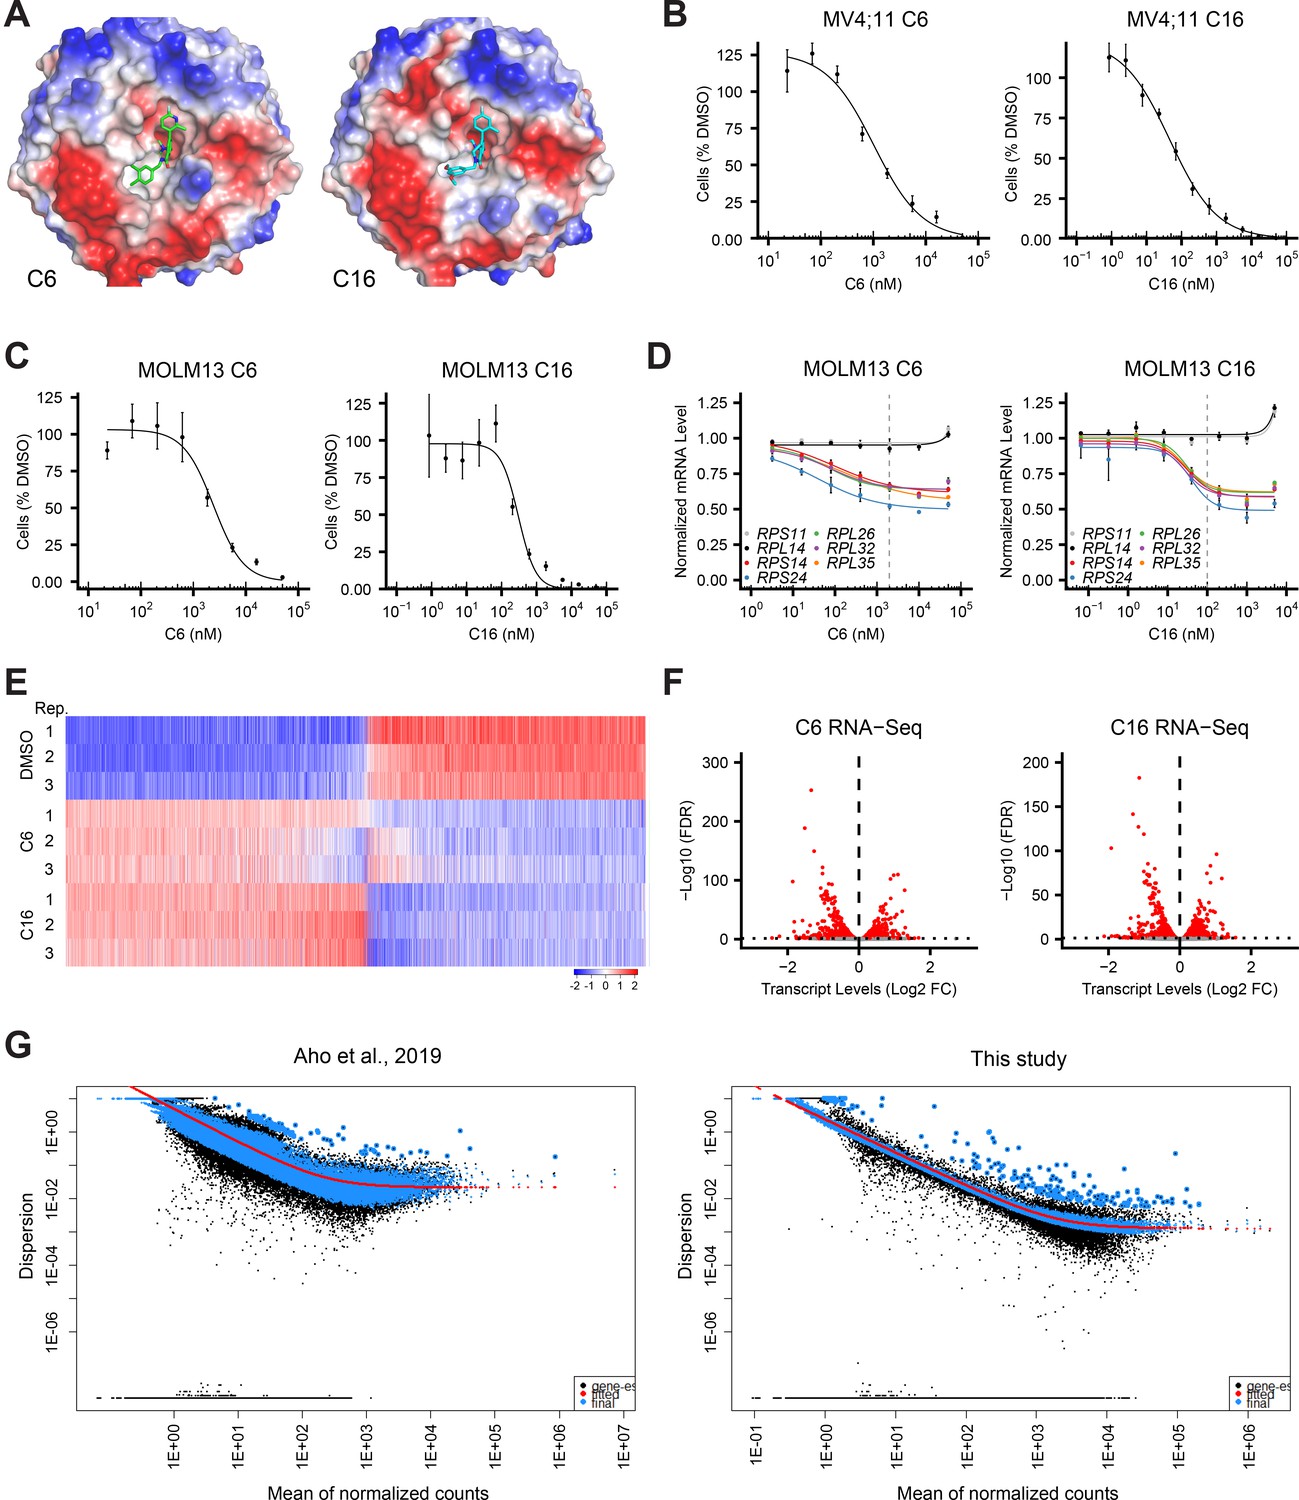
(A) Crystal structures of C6 or C16 bound to the WIN Site of WDR5 with electrostatic surfaces mapped (PDB IDs: 6E23 [Aho et al., 2019a]; 6UCS [Tian et al., 2020]). (B) Viabilities of MV4;11 cells treated with a serial dilution range of either C6 (left) or C16 (right) for 72 hr, relative to viability of DMSO-treated cells (n = 3; mean ± SEM). (C) As in (B) but for MOLM13 cells. (D) Transcript levels as determined by QuantiGene analysis of representative WDR5-bound (color) or non-bound (grayscale) ribosomal protein genes in MOLM13 cells treated with a serial dilution range of either C6 (left) or C16 (right) and relative to DMSO-treated cells (n = 3; mean ± SEM). Vertical dashed line indicates either 2 µM C6 (left) or 100 nM C16 (right). (E) Transformed z-scores of genes with significantly altered transcript levels (RNA-seq) in MV4;11 cells treated with either C6 (2 µM) or C16 (100 nM) for 48 hr, compared to DMSO treatment. (F) Volcano plots, showing transcript level alterations in MV4;11 cells treated 48 hr with 2 µM C6 (left) or 100 nM C16 (right) compared to DMSO (n = 3; red indicates false discovery rate [FDR] < 0.05). (G) Dispersion plot describing the variance in gene expression for the RNA-seq data in a previous study (left) and this study (right).
Figure 1—figure supplement 2
Impact of WIN site inhibitors (WINi) on RPL22L1 and p53 target gene expression.
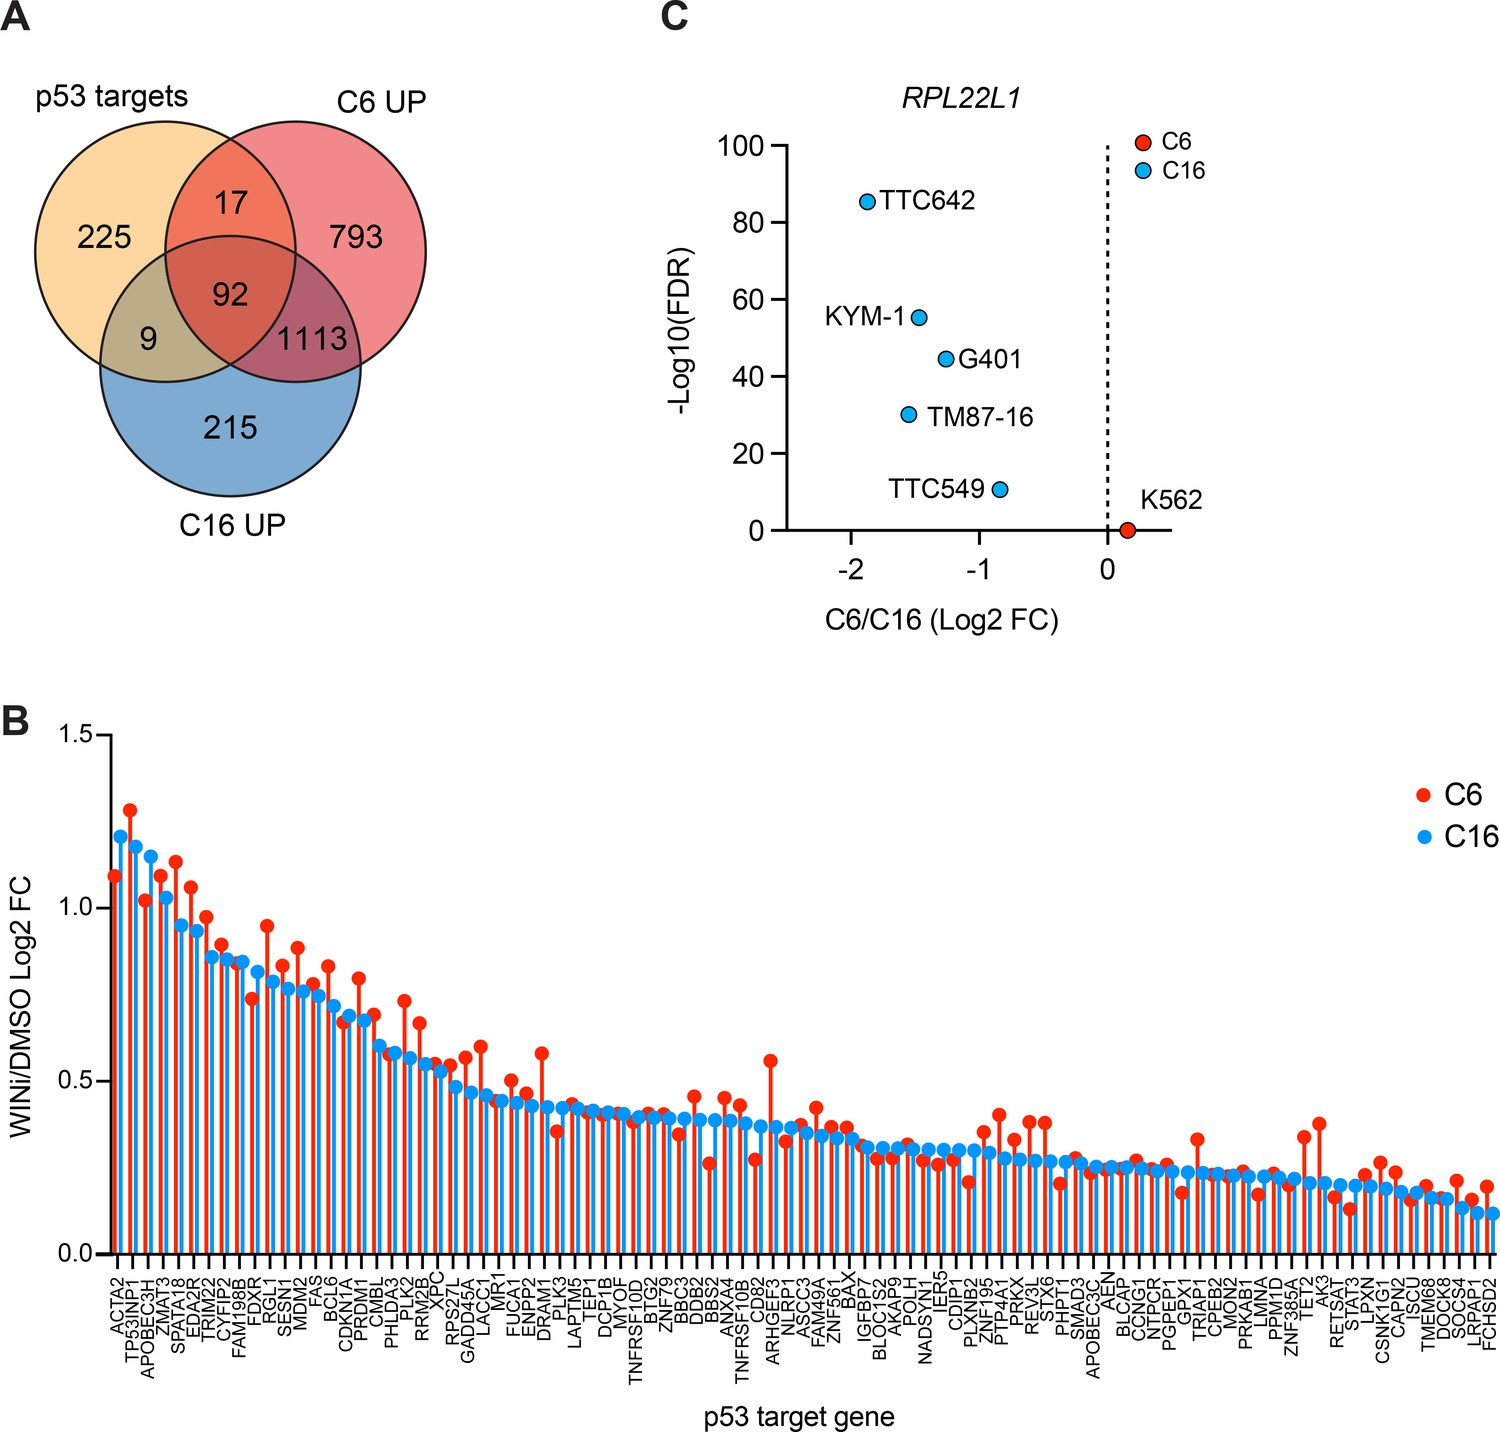
(A) Venn diagram, showing the overlap of consensus p53 target genes (Fischer, 2017) with genes significantly induced by C6 or C16 in MV4;11 cells. (B) Graph showing the changes in expression of the 91 common genes in (A) elicited by WINi C6 (red) or C16 (blue) in MV4;11 cells, compared to DMSO. (C) Changes in expression (and false discovery rate [FDR]) of RPL22L1 elicited in response to C6 (red) or C16 (blue) treatment of K562 leukemia cells (Aho et al., 2019a) or five rhabdoid tumor cell lines (TTC642, KYM-1, G401, TM87-16, and TTC549; Florian et al., 2022).
Figure 2 with 3 supplements

Impact of WIN site inhibitors (WINi) on the translatome of MLLr cancer cells.
(A) Volcano plots depicting alterations in translation efficiency (TE) induced by 48 hr treatment of MV4;11 cells with either 2 µM C6 (left) or 100 nM C16 (right) compared to DMSO (n = 2; red indicates false discovery rate [FDR] < 0.05 and Log2 FC > 0.25), as determined by Ribo-seq. (B) Number of mRNAs with significantly (FDR < 0.05 and Log2 FC > 0.25) altered TE levels following treatment of MV4;11 cells with C6 (2 µM) or C16 (100 nM) for 48 hr. See Figure 2—source data 1 for complete output of Ribo-seq analysis. (C) Overlap of mRNAs with significantly decreased TE in response to C6 or C16 treatment. (D) TE of mRNAs in DMSO-treated MV4;11 cells plotted against translation efficiencies of mRNAs in cells treated with either C6 (left) or C16 (right). Red indicates mRNAs with significantly altered translation efficiencies following inhibitor treatment (FDR < 0.05 and Log2 FC > 0.25). (E) Numbers of differentially translated mRNAs (∆TE) in each quartile of genes (stratified by TE in DMSO) in cells treated with C6 (left) or C16 (right). (F) Enrichment analysis of common mRNAs suppressed by C6/C16 at the mRNA (blue) and translational (red; TE) level in MV4;11 cells. Hallmark.MSigDB pathways are shown. The x-axis indicates the number of suppressed genes in each category; the italic numbers are the corresponding FDR. See Figure 2—source data 2 for the full Hallmark.MSigDB analysis, as well as for Reactome and KEGG pathways. (G) Enrichment analysis of mRNAs suppressed translationally by C6/C16 but with no significant changes in mRNA levels. Gene Ontology (GO) Biological Process (BP) and Molecular Function (MF) categories are shown, as well as KEGG pathways. The x-axis displays -Log10 FDR; the number of mRNAs is shown in italics in each bar. See Figure 2—source data 3 for extended enrichment analyses, broken down by TE and mRNA direction changes. (H) TE changes in WDR5-bound (left) and non-bound (right) RPGs elicited by C6 (top) or C16 (bottom).
-
Figure 2—source data 1
Output of Ribo-seq analysis of MV4;11 cells treated with C6/C16.
- https://cdn.elifesciences.org/articles/90683/elife-90683-fig2-data1-v1.xlsx
-
Figure 2—source data 2
Hallmark, Reactome, and KEGG enrichment analysis of differentially translated genes in Ribo-seq.
- https://cdn.elifesciences.org/articles/90683/elife-90683-fig2-data2-v1.xlsx
-
Figure 2—source data 3
Enrichment analysis of differentially translated genes, broken down by mRNA level change direction.
- https://cdn.elifesciences.org/articles/90683/elife-90683-fig2-data3-v1.xlsx
Figure 2—figure supplement 1
WIN site inhibitors (WINi) suppress bulk protein synthesis.
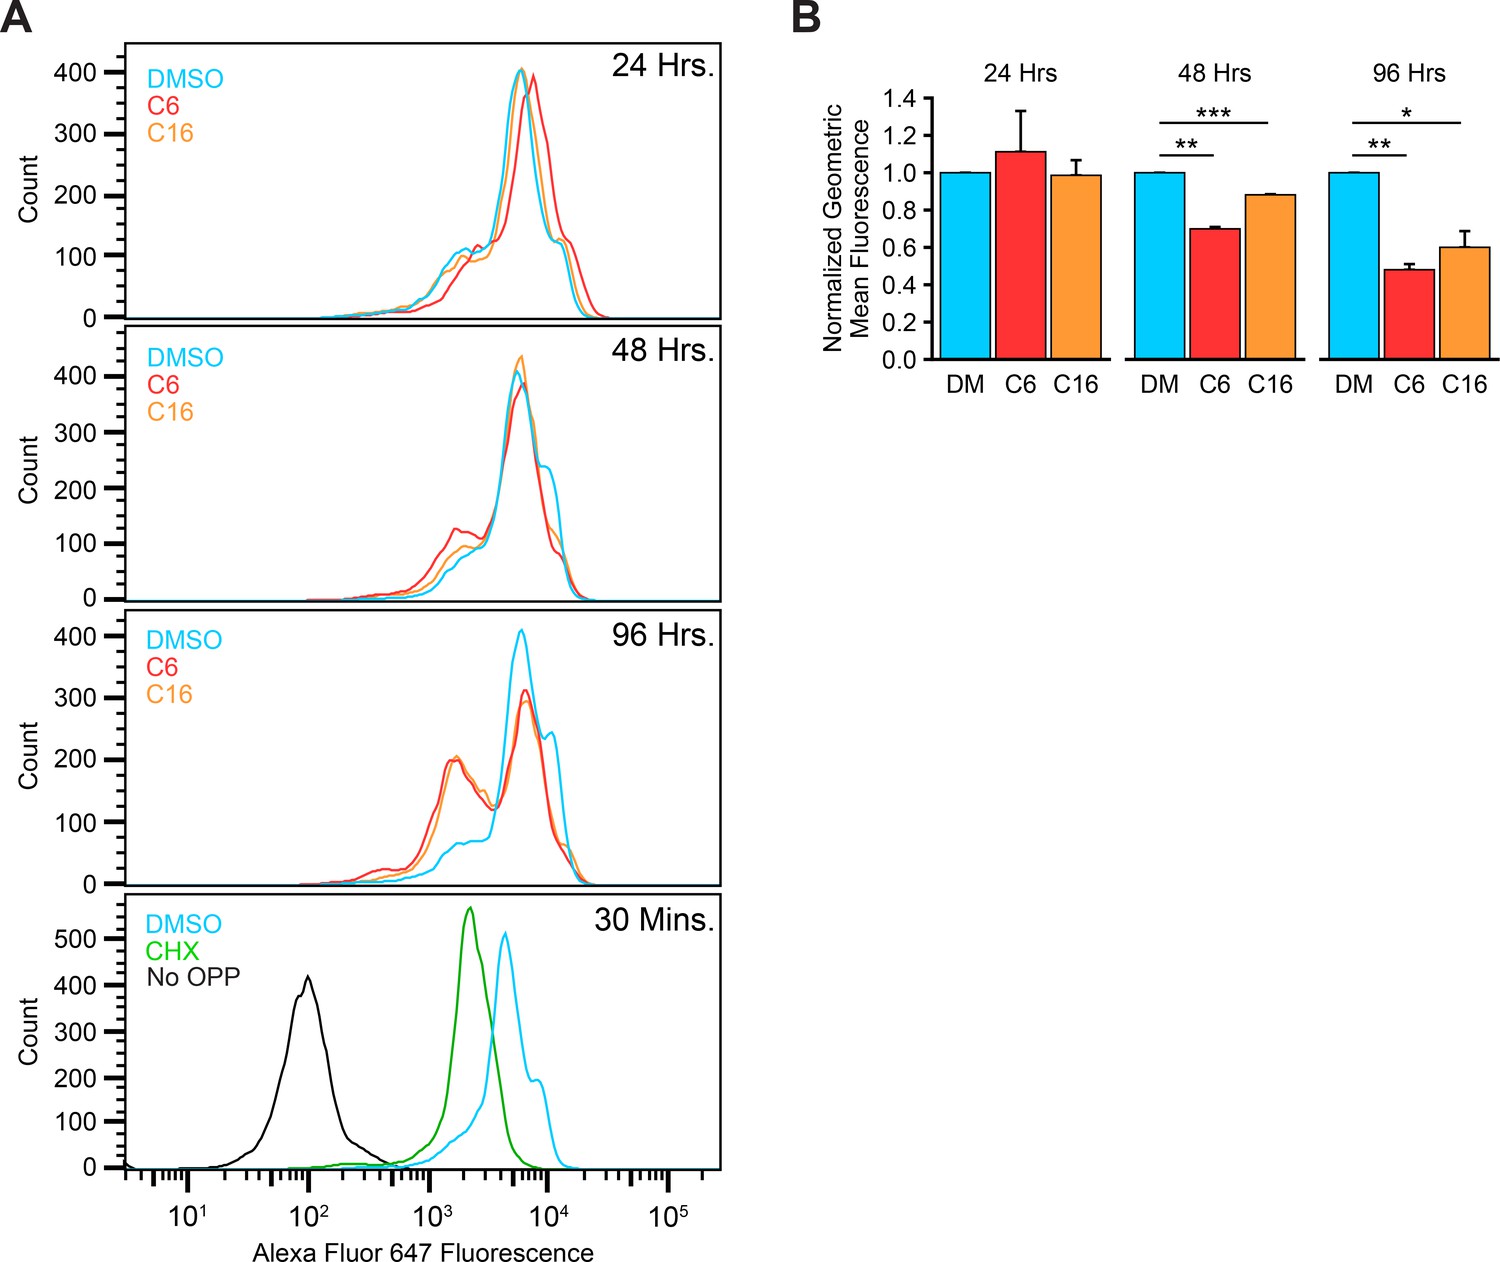
(A) Representative histograms from protein synthesis assays in MV4;11 cells treated 24, 48, or 96 hr with either 0.1% DMSO (blue), 2 µM C6 (red), or 100 nM C16 (orange). Cells were pulsed with O-propargyl-puromycin (OPP) to label nascent proteins, Alexa Fluor 647 linked to incorporated OPP in Click chemistry reactions, and fluorescence measured by flow cytometry analysis. MV4;11 cells treated 30 min with 100 µg/mL cycloheximide (‘CHX’; green) serve as a positive control for inhibited protein synthesis. MV4;11 cells pulsed with DMSO (‘No OPP’; black) serve as a control for background fluorescence. (B) Quantification of protein synthesis assays. Fluorescence from CHX-treated cells was set as the baseline, and fluorescence presented relative to DMSO-treated (DM) cells at each time point (n = 3; normalized geometric mean ± SEM). p-Values calculated by Student’s t-tests are represented by asterisks: *<0.05, **<0.01, ***<0.001.
Figure 2—figure supplement 2
WIN site inhibitors (WINi) suppress translation.
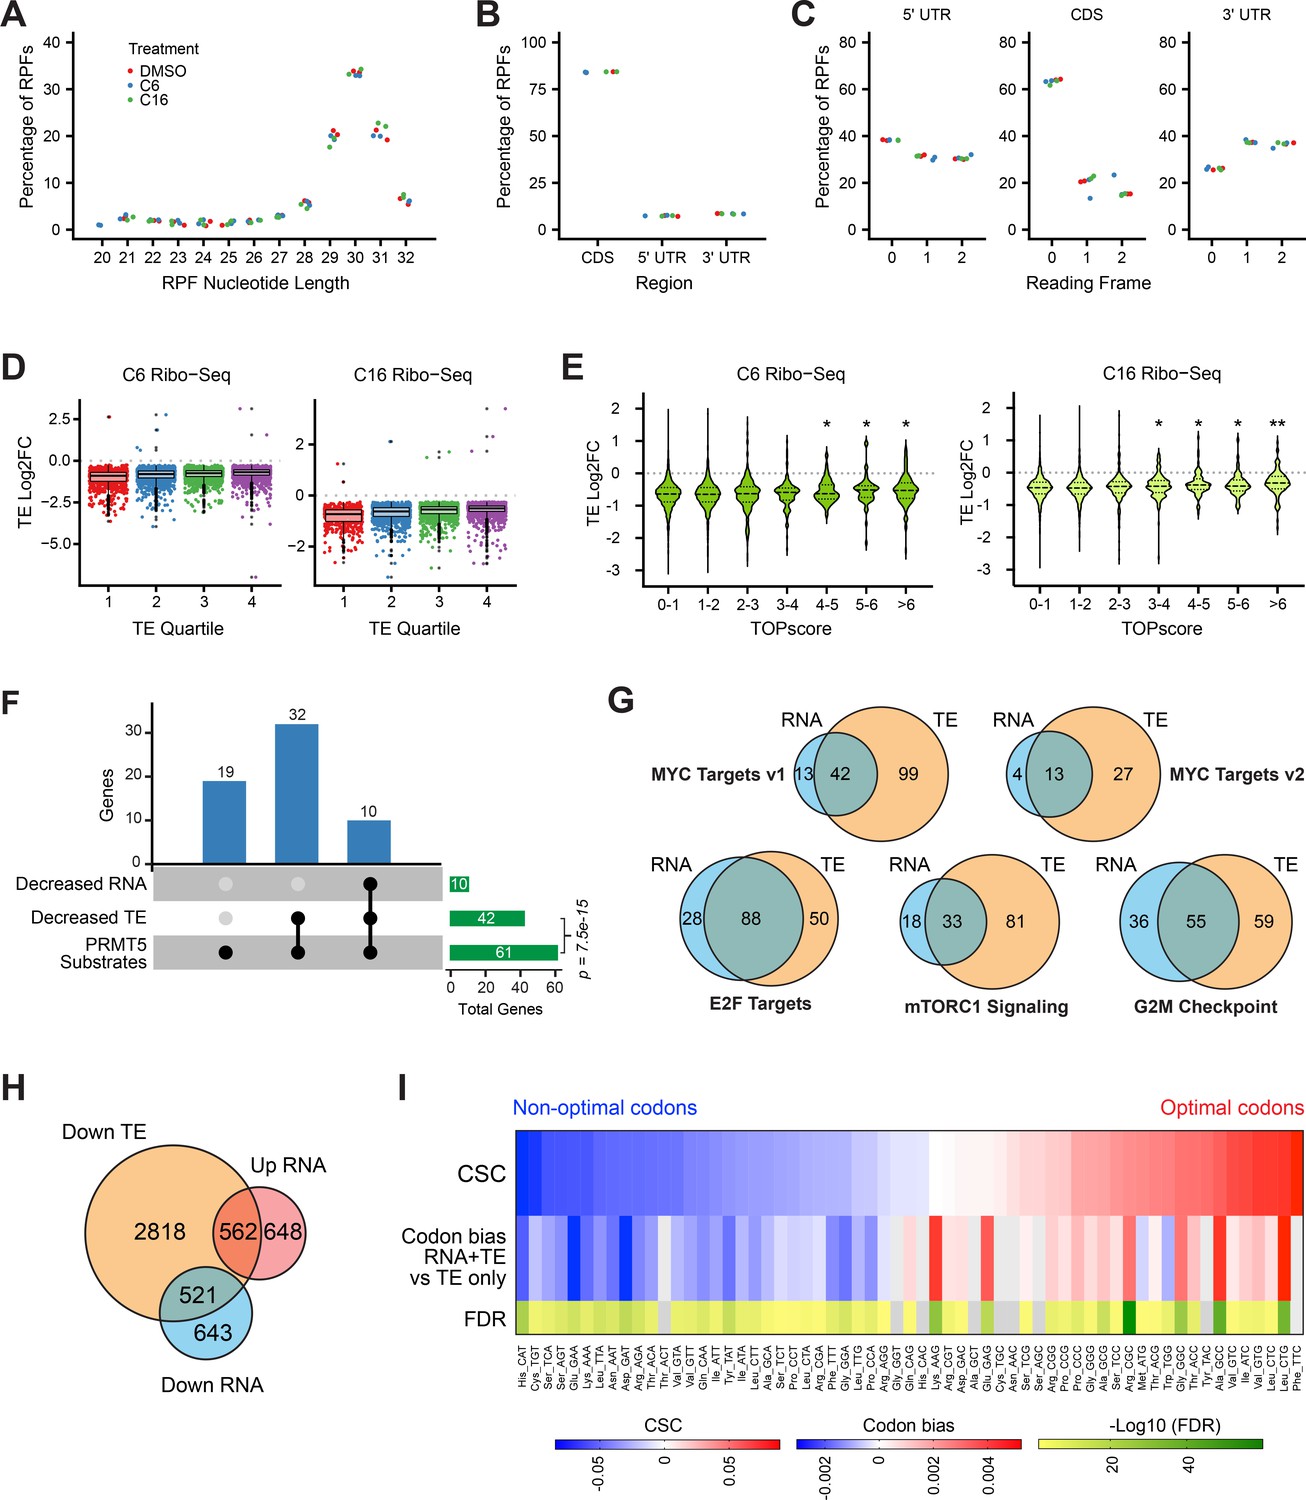
(A) Distribution of ribosome-protected fragment (RPF) lengths in each Ribo-seq sample/replicate. The length distribution of RPFs in mammalian Ribo-seq experiments typically peaks at 30–31 nucleotides. (B) Proportion of RPFs mapping to the coding sequence (CDS) or 5′ or 3′ untranslated regions (UTR) of transcripts. Color of dots is the same as in (A). (C) Proportion of RPFs mapping to each reading frame in the 5′ UTR (left), the CDS (middle), and the 3′ UTR (right). Color of dots is the same as in (A). (D) Magnitudes of significant translation efficiency (TE) alterations of mRNAs in each quartile (stratified by TE in DMSO) in cells treated with C6 (left) or C16 (right). Color dots represent individual genes. Bottom, middle, and top horizontal lines of each box represent first, second, and third quartiles, respectively. Vertical lines extend to data points within 1.5-fold of the interquartile range. Black dots represent values beyond 1.5-fold of the interquartile range. (E) Changes in TE induced by C6 (left) or C16 (right) in MV4;11 cells, binned according to mRNA TOPscores (Philippe et al., 2020). Dashed lines represent the median; dotted lines indicate quartiles. Significance by t-test is indicated compared to group with TOPscore 0–1 (*≤0.05, **≤0.0001). (F) UpSet plot, showing the breakdown of genes encoding PRMT5 substrates Radzisheuskaya et al., 2019 whose transcript levels and/or translation efficiencies decrease following WIN site inhibition (p-value calculated by hypergeometric test for over-representation of genes encoding PRMT5 substrates in genes with decreased translation efficiencies). (G) Overlap of C6/C16 common mRNAs with decreased abundance (RNA; blue) and those with decreased TE (salmon), grouped according to the indicated Hallmark.MSigDB categories. (H) Overlap of all C6/C16 common mRNAs with altered abundance and decreased TE. (I) The top row of the heatmap displays the codon stability coefficient (CSC) for each codon (Wu et al., 2019) ranked from lowest ('non-optimal') to highest ('optimal'). The middle row displays enrichment of each codon in mRNAs that are decreased at both the TE and mRNA levels (RNA + TE) versus those that show a decrease in TE without an accompanying decrease in mRNA abundance (TE only). Bottom row is -Log10 false discovery rate (FDR).
Figure 2—figure supplement 3
WIN site inhibitors (WINi) impair translation of mitochondrial ribosomal proteins.
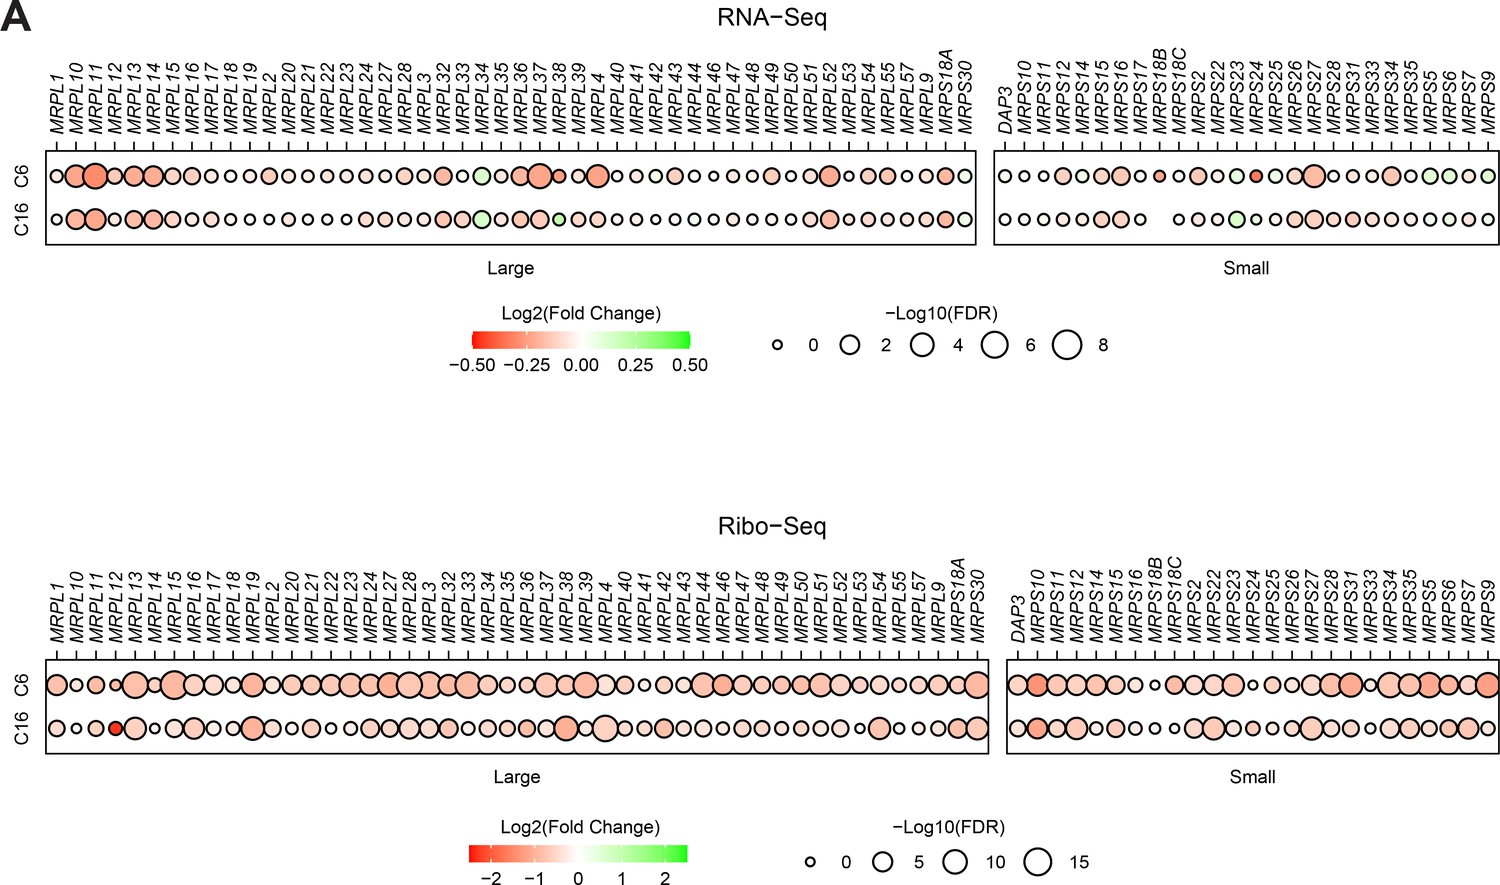
(A) Top: transcript level changes in mitochondrial ribosomal protein genes elicited by C6 or C16, as indicated. Bottom: translational efficiency (TE) changes in mitochondrial ribosomal protein genes elicited by C6 or C16. All of the mitochondrial RPGs are nuclear-encoded; none have detectable binding of WDR5.
Figure 3 with 4 supplements

Impact of WIN site inhibitors (WINi) on the ribosome inventory of MLLr cancer cells.
(A) Lysates from MV4;11 cells treated 24 or 72 hr with either 0.1% DMSO or 250 nM C16 were subjected to liquid chromatography coupled with tandem mass spectrometry and analyzed by label-free quantification (LFQMS). The table shows the number of proteins detected in DMSO and C16 samples and those with significantly altered levels at each time point (n = 4; adj. p-value<0.05). See Figure 3—source data 1 for complete output of LFQMS analysis. (B) Volcano plot, showing protein level alterations in cells treated with C16 for 24 hr (red indicates adj. p-value<0.05). The location of RPL22L1 is indicated. (C) As in (B) but for 72 hr treatment with C16. (D) Overlap of proteins significantly increased (top) or decreased (bottom) following 24 or 72 hr C16 treatment. (E) Protein level alterations induced by C16 in consensus p53 target proteins (Fischer, 2017) at the 24 and 72 hr treatment timepoints. Those proteins only altered in abundance at 24 hr are represented as blue dots; proteins only altered at 72 hr are red; proteins altered at both timepoints are gray. (F) As in (E) but for ribosomal proteins. (G) Changes in expression of proteins encoded by WDR5-bound (left) and non-bound (right) RPGs elicited by 24 (top) or 72 (bottom) hr treatment with C16. Note that, due to the magnitude of change, Log2(FC) for RPL22L1 is presented on a separate scale.
-
Figure 3—source data 1
Output of label-free quantitative mass spectrometry (LFQMS) analysis of MV4;11 cells treated with C16.
- https://cdn.elifesciences.org/articles/90683/elife-90683-fig3-data1-v1.xlsx
-
Figure 3—source data 2
Enrichment analysis of proteins altered in abundance by 24 or 72 hr of C16 treatment.
- https://cdn.elifesciences.org/articles/90683/elife-90683-fig3-data2-v1.xlsx
Figure 3—figure supplement 1
Distribution of peptide/protein intensities in label-free quantitative mass spectrometry (LFQMS) analysis.
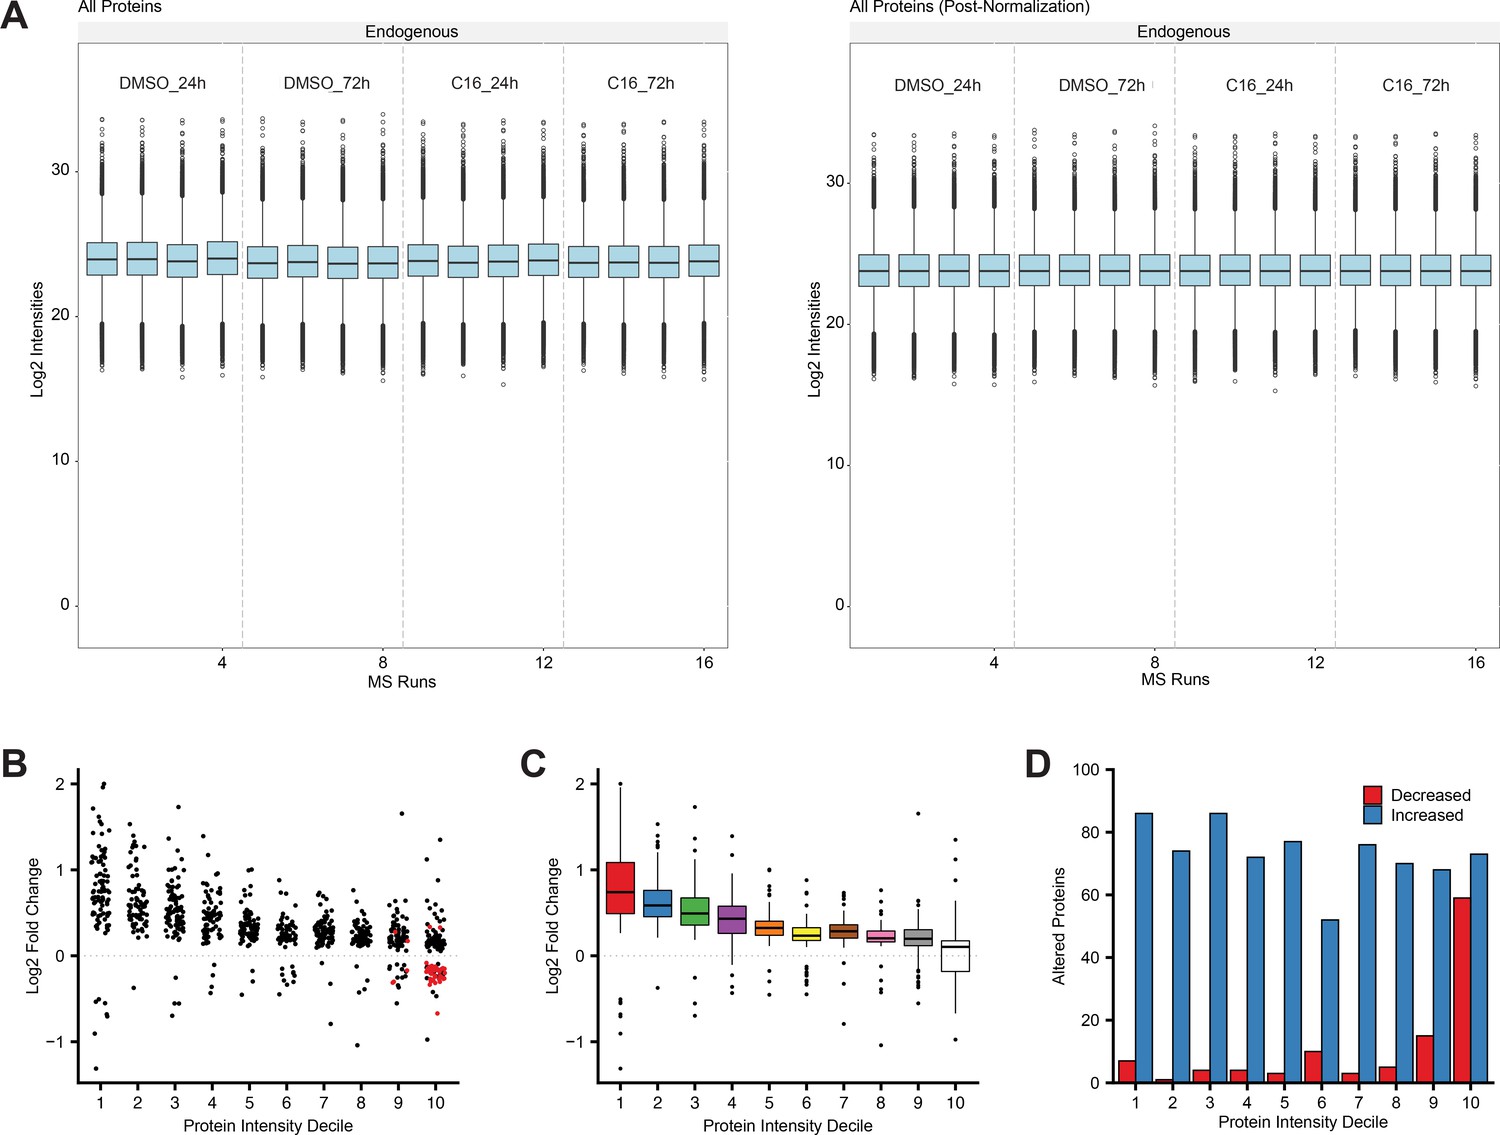
(A) Peptide intensities of all proteins detected in each mass spectrometry run before (left) and after normalization (right). (B) Magnitudes of significant protein level alterations within each decile (stratified by protein intensity in DMSO samples) in MV4;11 cells treated 24 hr with 250 nM C16. Red points represent ribosome proteins. (C) Box plot representation of data presented in (B). Bottom, middle, and top horizontal line of each box represents first, second, and third quartiles, respectively. Vertical lines extend to data points within 1.5-fold of the interquartile range. Black dots represent values beyond 1.5-fold of the interquartile range. (D) Number of proteins increased or decreased within each decile.
Figure 3—figure supplement 2
Enrichment analysis of proteins with altered expression in response to C16 treatment.
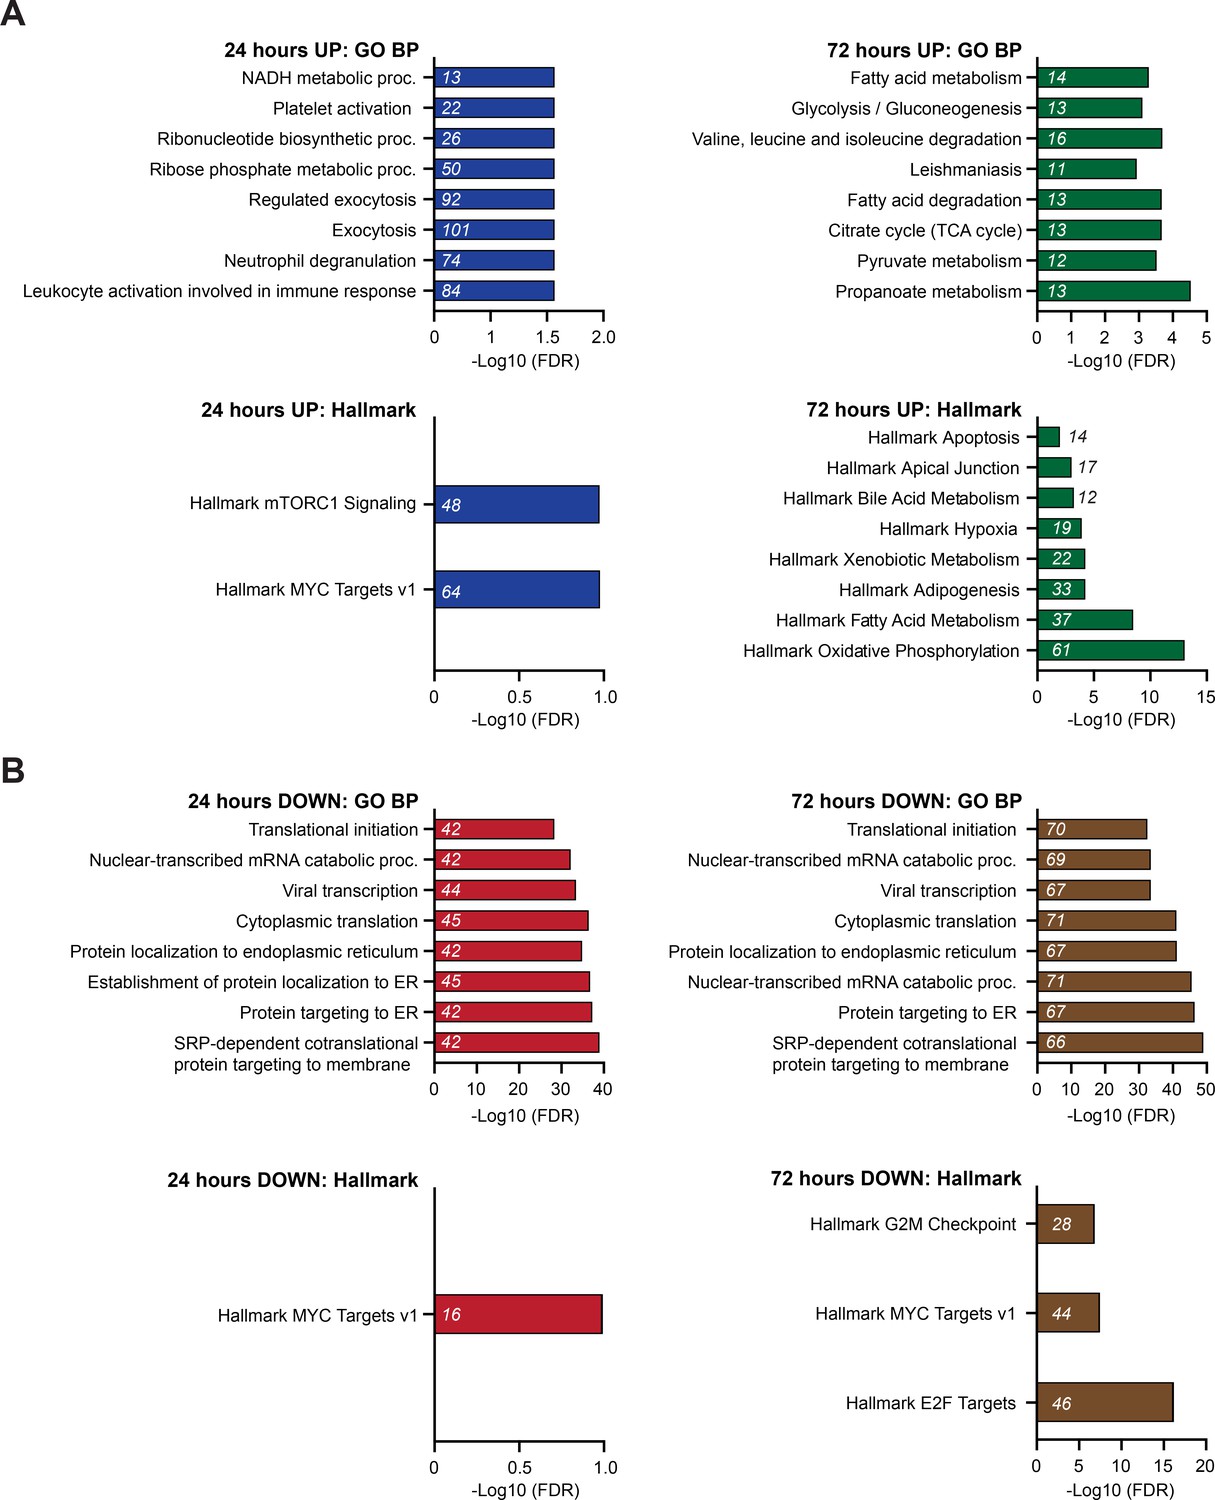
(A) Graphs showing enrichment of proteins in GO BP (top) and Hallmark.MSigDB (bottom) pathways that are induced by C16 treatment at 24 (blue) or 72 (green) hr. The x-axis displays -Log10 (FDR); the number of proteins in each category is given in italics. (B) Graphs showing enrichment of proteins in Gene Ontology (GO) Biological Process (BP) (top) and Hallmark.MSigDB (bottom) pathways that are suppressed by C16 treatment at 24 (red) or 72 (brown) hr. The x-axis displays -Log10 (FDR); the number of proteins in each category is given in italics. See Figure 3—source data 2 for output of the full enrichment analyses.
Figure 3—figure supplement 3
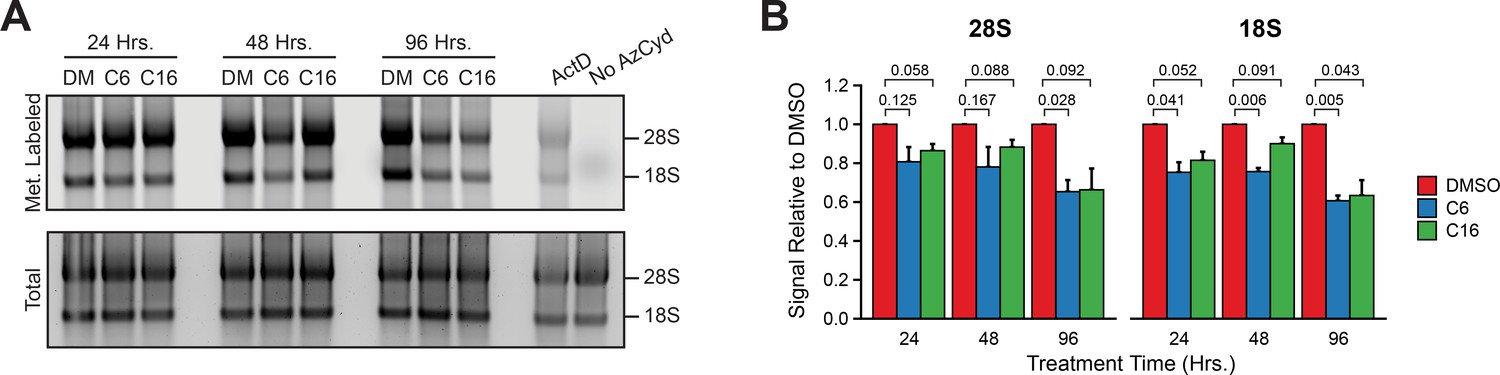
WIN site inhibitors suppress rRNA levels.
(A) In-gel fluorescence assay detecting metabolically labeled rRNA (top) isolated from MV4;11 cells treated 24, 48, or 96 hr with either DMSO (0.1%), C6 (2 µM), or C16 (100 nM), and pulsed with 2′-azido-2′-cytidine (AzCyd). As a positive control for inhibited rRNA synthesis, MV4;11 cells were treated 1 hr with 5 nM actinomycin D (‘ActD’). As a control for background labeling, MV4;11 cells were pulsed with DMSO (‘No AzCyd’). Fluorescent probes were covalently linked to incorporated AzCyd in Click chemistry reactions. Total RNA (bottom) was detected by SYBR stain. (B) Quantification of metabolic rRNA labeling (n = 3; mean ± SEM). p-Values calculated by Student’s t-tests are indicated. Raw unprocessed gel images are presented in Figure 3—figure supplement 3—source data 1.
-
Figure 3—figure supplement 3—source data 1
Raw unprocessed gel images corresponding to Figure 3—figure supplement 3A.
- https://cdn.elifesciences.org/articles/90683/elife-90683-fig3-figsupp3-data1-v1.pdf
Figure 3—figure supplement 4
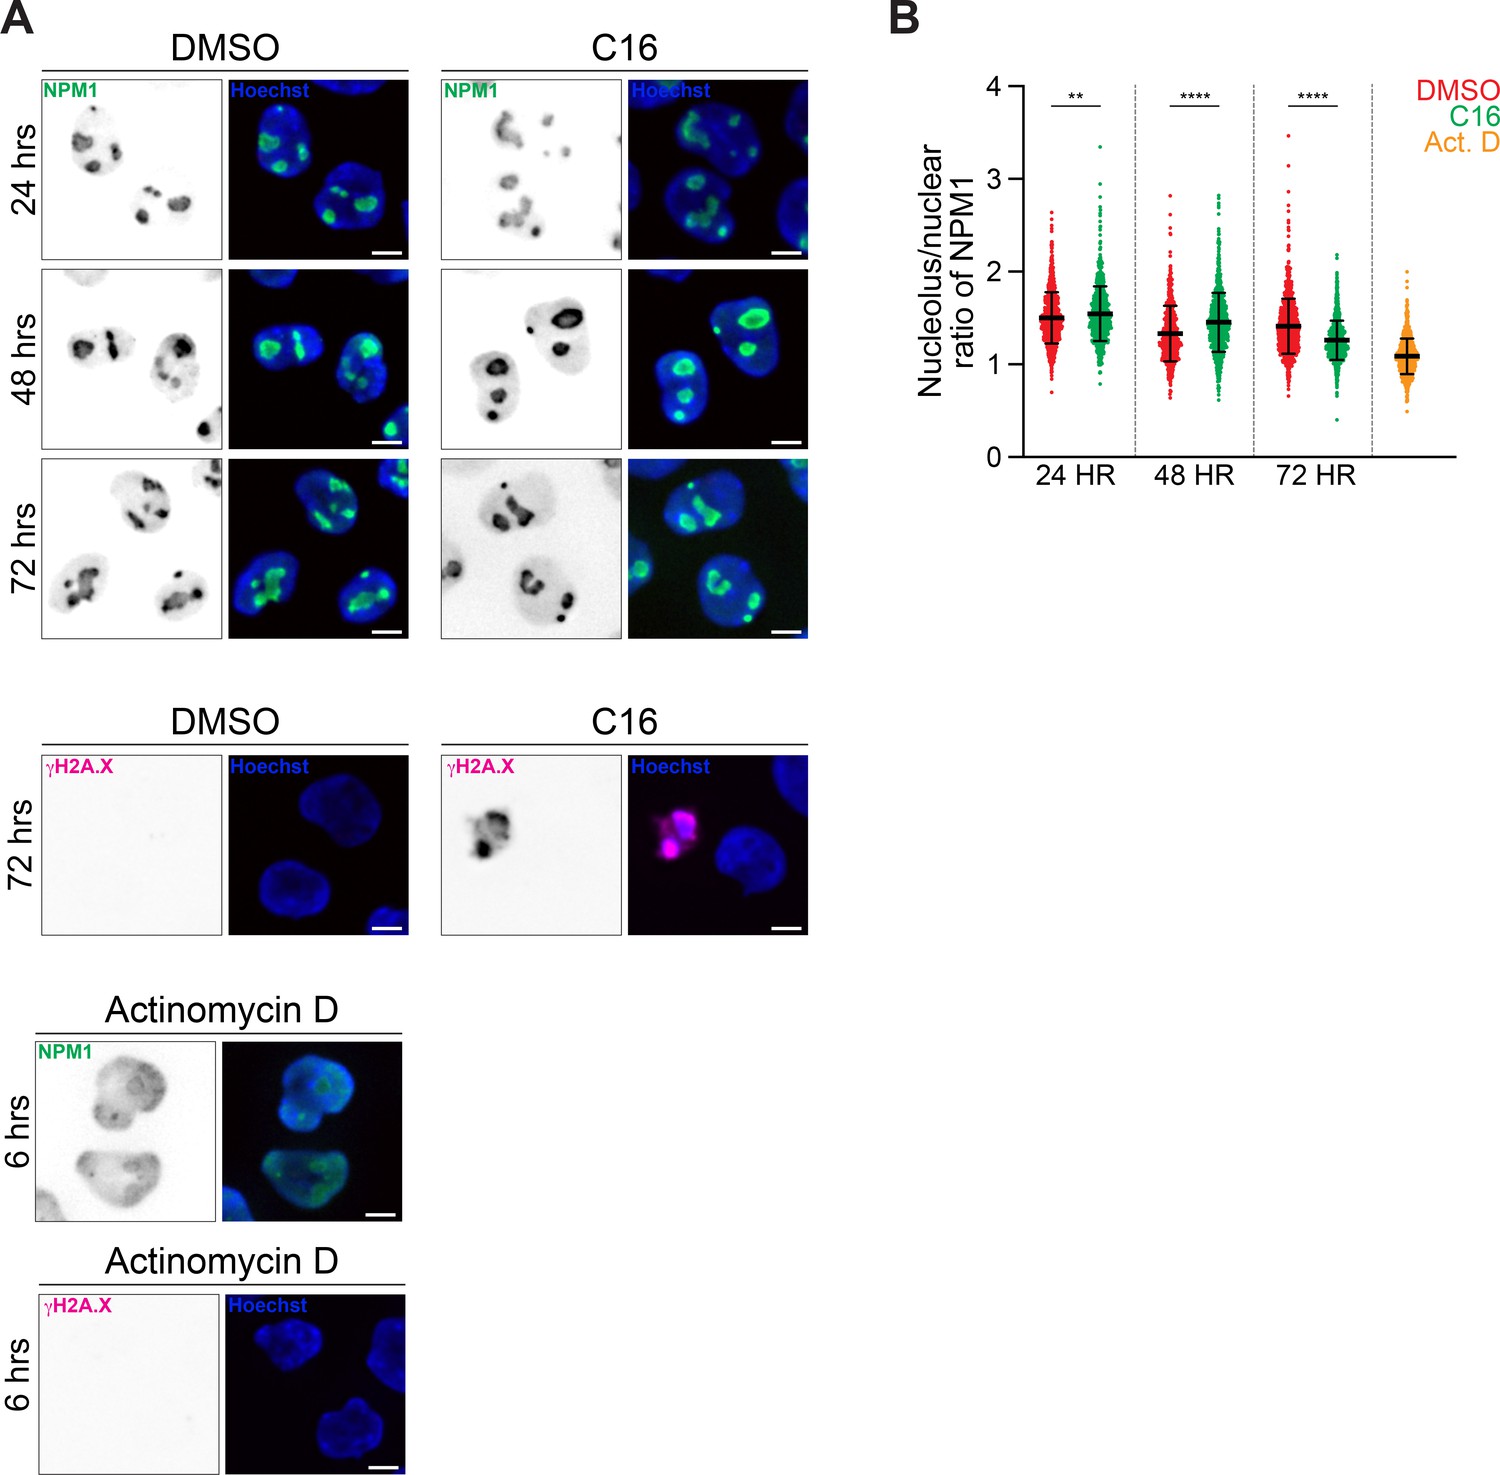
C16 induces redistribution of nucleophosmin from the nucleolus to the nucleoplasm.
(A) Representative immunofluorescent images of MV4;11 cells treated with vehicle (DMSO control), C16 (100 nM), or ActD (5 nM) for the times indicated and stained for nucleophosmin (NPM1, green), gH2A.X pSer139 (double-stranded break marker, magenta) and Hoechst (blue). DNA damage arises upon cell death following drug treatment. Scale bars are 5 μm. (B) Quantification of the ratio of nucleolar to total NPM1 in the cells described in (A). C6, C16, and ActD treatment disrupted NPM1 localization. p-Values calculated by Student’s t-tests are represented by asterisks: **0.0012, ****<0.0001.
Figure 4 with 1 supplement
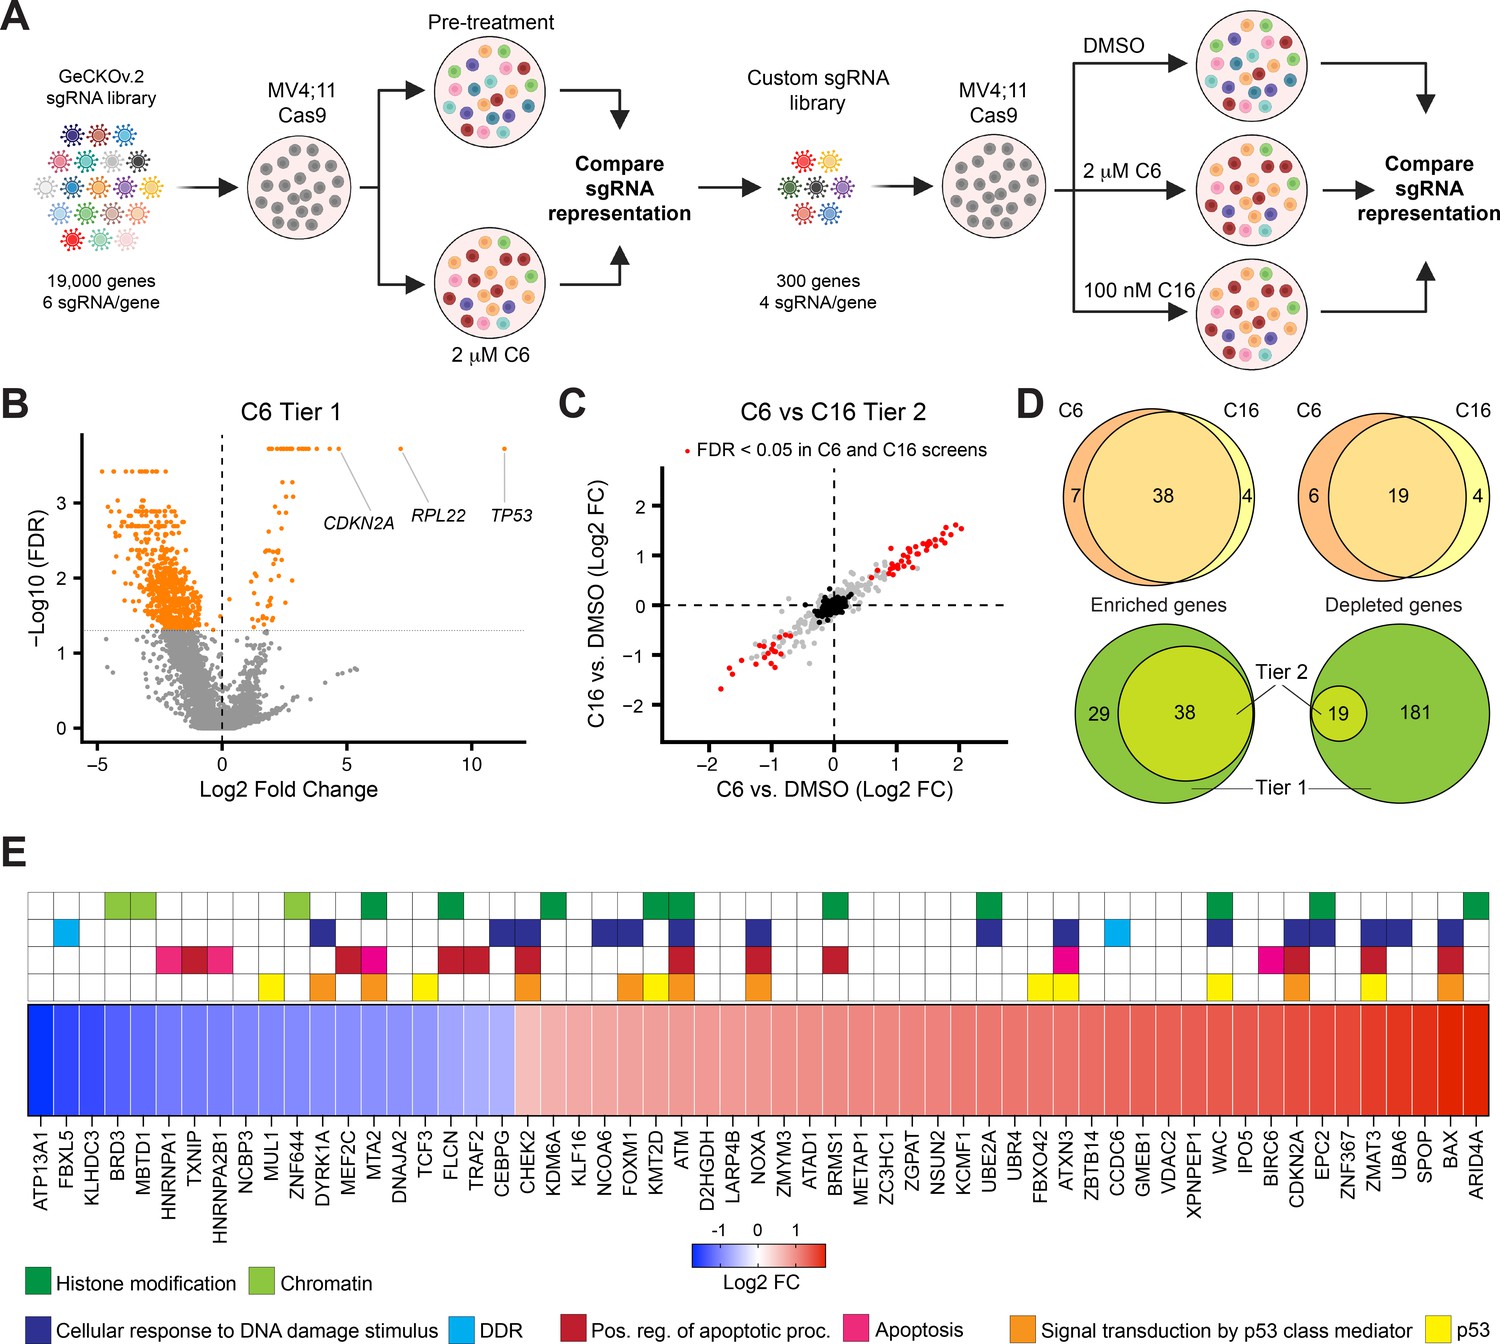
A two-tier loss-of-function screen for modulators of the response to WIN site inhibitors (WINi).
(A) Two-tier screen design. In the first tier, Cas9-expressing MV4;11 cells were transduced with a genome-wide sgRNA library and treated with 2 µM C6 until a resistant cell population emerged. sgRNA representation in the pretreatment population was compared to the post-treatment population (n = 2). In the second tier, cells were transduced with a custom library of distinct sgRNAs targeting non-pan-essential ‘hits’ from the first tier, cultured in the presence of DMSO, C6, or C16, and sgRNA representation in C6/C16-treated cultures compared to that from DMSO-treated cultures (n = 2). (B) Volcano plot, showing gene-level changes in sgRNA representation from the first tier (orange indicates false discovery rate [FDR] < 0.05). Datapoints corresponding to TP53, RPL22, and CDKN2A are indicated. See Figure 4—source data 1 for full output of the tier 1 screen. (C) Comparison of gene-level changes in sgRNA representation in C6- and C16-treated populations in the second tier screen, each compared to DMSO-treated populations (red indicates FDR < 0.05; black indicates non-targeting control sgRNAs). See Figure 4—source data 2 for full output of the tier 2 screen. (D) Top: overlap of genes from the tier 2 screen with enriched (left) or depleted (right) sgRNAs in C6- and C16-treated MV4;11 populations, compared to the DMSO control. Bottom: overlap of genes with enriched (left) or depleted (right) sgRNAs in the first versus second tiers of the screen. ‘Tier 1’ contains only those genes targeted in the tier 2 screen. ‘Tier 2’ contains the intersection of genes with altered sgRNAs in both the C6 and C16 treatments. (E) Ranked heatmap, representing the mean gene-level Log2 fold change (FC) of sgRNAs from the C6 and C16 treatments in the tier 2 screen, as well as gene enrichment analysis outputs. Note that ‘Signal transduction by p53 class mediator’ is a GO:BP term (orange); ‘p53’ assignments (yellow) were added by manual curation.
© 2024, BioRender Inc. Figure 4A was created using BioRender, and is published under a CC BY-NC-ND license. Further reproductions must adhere to the terms of this license.
-
Figure 4—source data 1
Output of the tier 1 screen.
- https://cdn.elifesciences.org/articles/90683/elife-90683-fig4-data1-v1.xlsx
-
Figure 4—source data 2
Output of the tier 2 screen.
- https://cdn.elifesciences.org/articles/90683/elife-90683-fig4-data2-v1.xlsx
Figure 4—figure supplement 1
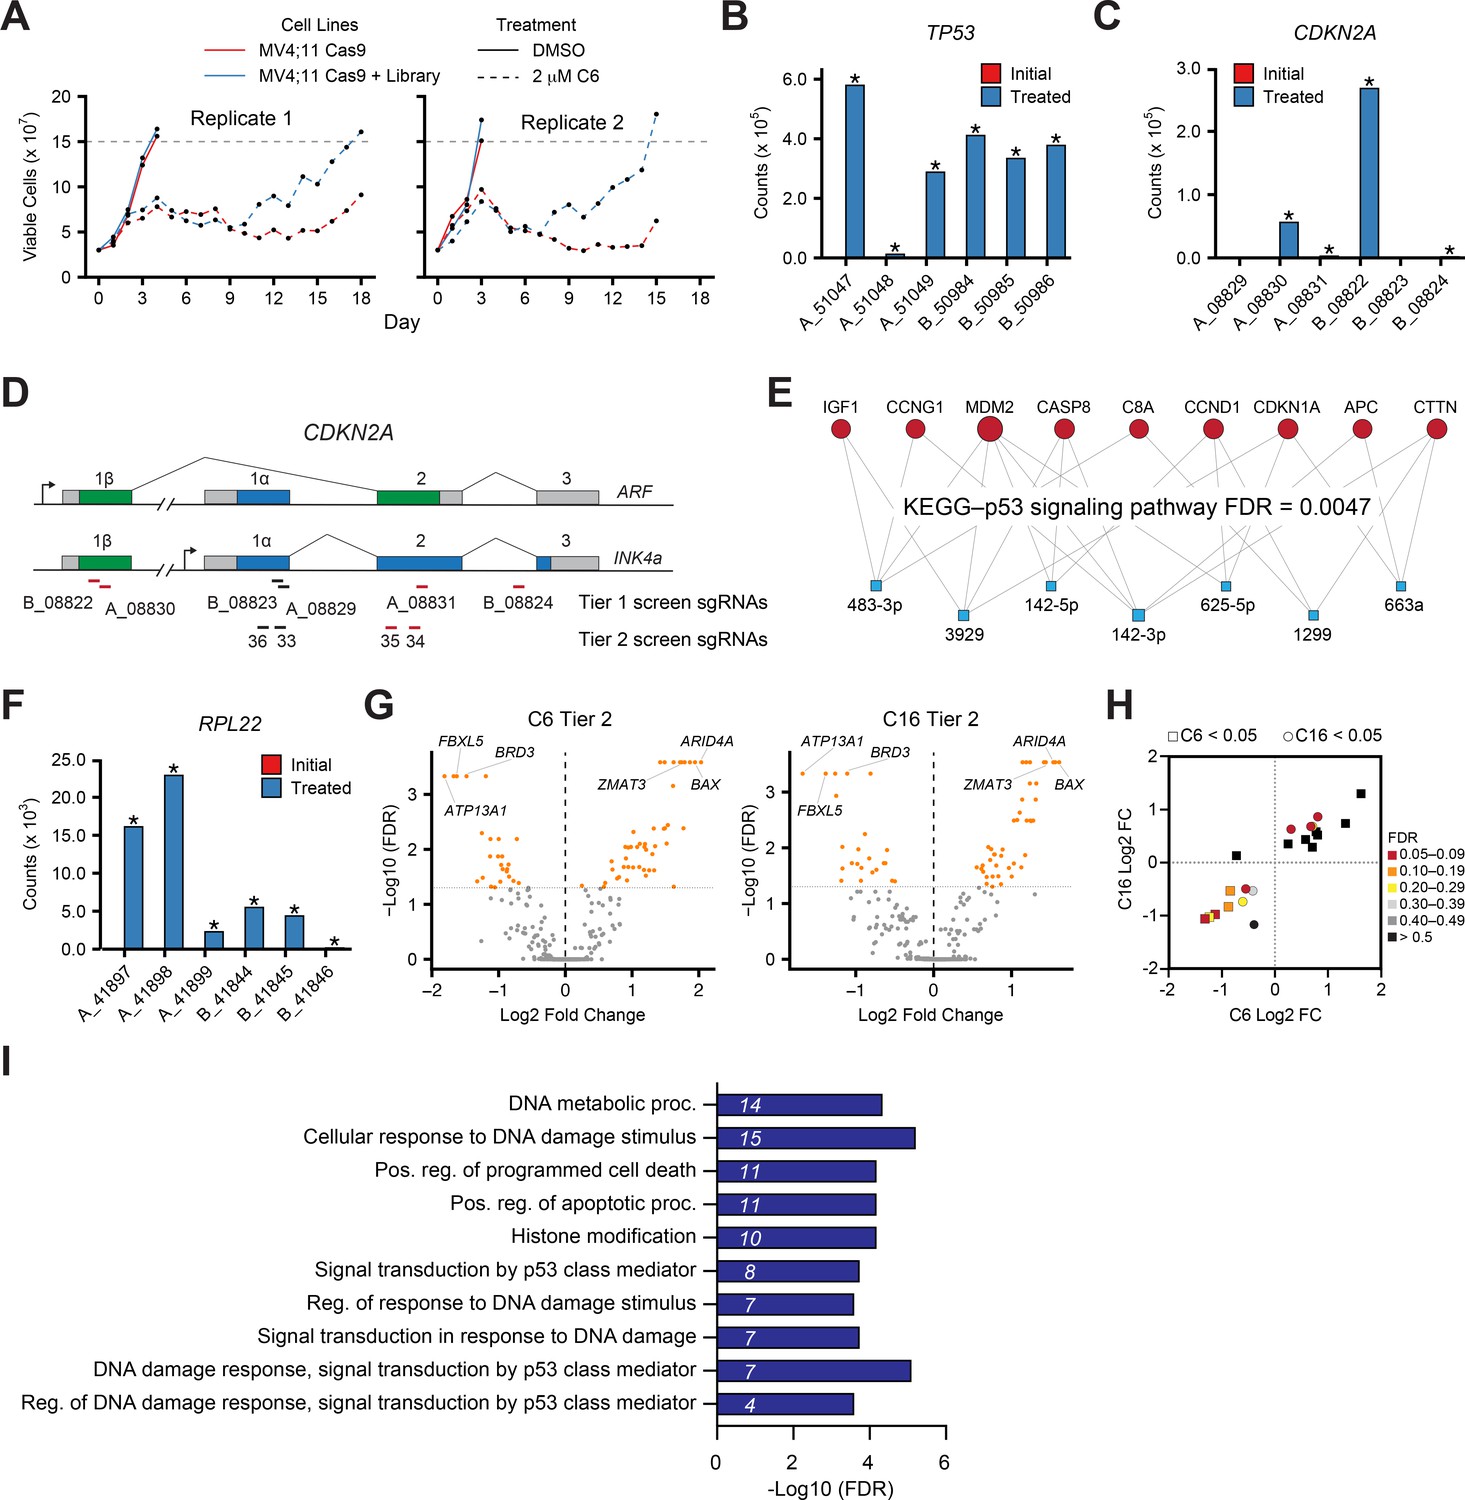
Genome-wide CRISPR screen identifies genes that influence response to C6/C16.
(A) Tier 1 screen: daily cell counts of MV4;11 Cas9 and MV4;11 Cas9+GeCKOv2 (Library) populations treated with either DMSO or 2 µM C6. The two replicates of this screen are shown separately. (B) Normalized counts of each sgRNA (x-axis) in the GeCKOv.2 library targeting TP53 in the initial transduced cells (red; not visible on this scale) and the C6-treated population (blue). Data represents means of replicates; * indicates false discovery rate (FDR) < 0.05. (C) As in (B) but for sgRNAs targeting CDKN2A. (D) Schematic of the CDKN2A gene locus with indicated sites complementary to tier 1 and tier 2 screen sgRNAs. Red sgRNAs increase in representation in CRISPR screens. (E) miRNet 2.0 (Chang and Xia, 2023) analysis of the 27 miRNAs enriched in the tier 1 screen produced a single significant hit corresponding to the KEGG p53 signaling pathway. The miRNAs are represented as blue boxes and target genes as red circles; the connections between them are indicated. (F) As in (B) but for sgRNAs targeting RPL22. (G) Volcano plots, showing gene-level changes from the tier 2 screen in sgRNA representation in C6- (left) and C16- (right) treated populations compared to DMSO control cultures (orange indicates FDR < 0.05). (H) Graph depicting gene-level Log2 FC and FDR values for genes that were flagged as C6- (squares) or C16- (circles) specific in the tier 2 screen. (I) GO enrichment analysis of the 57 C6/C16 common genes emerging from tier 2 of the screen. Italics represent the number of genes in each category.
Figure 5 with 3 supplements
Identification of agents that synergize with WIN site inhibitors (WINi) in MLLr cells.
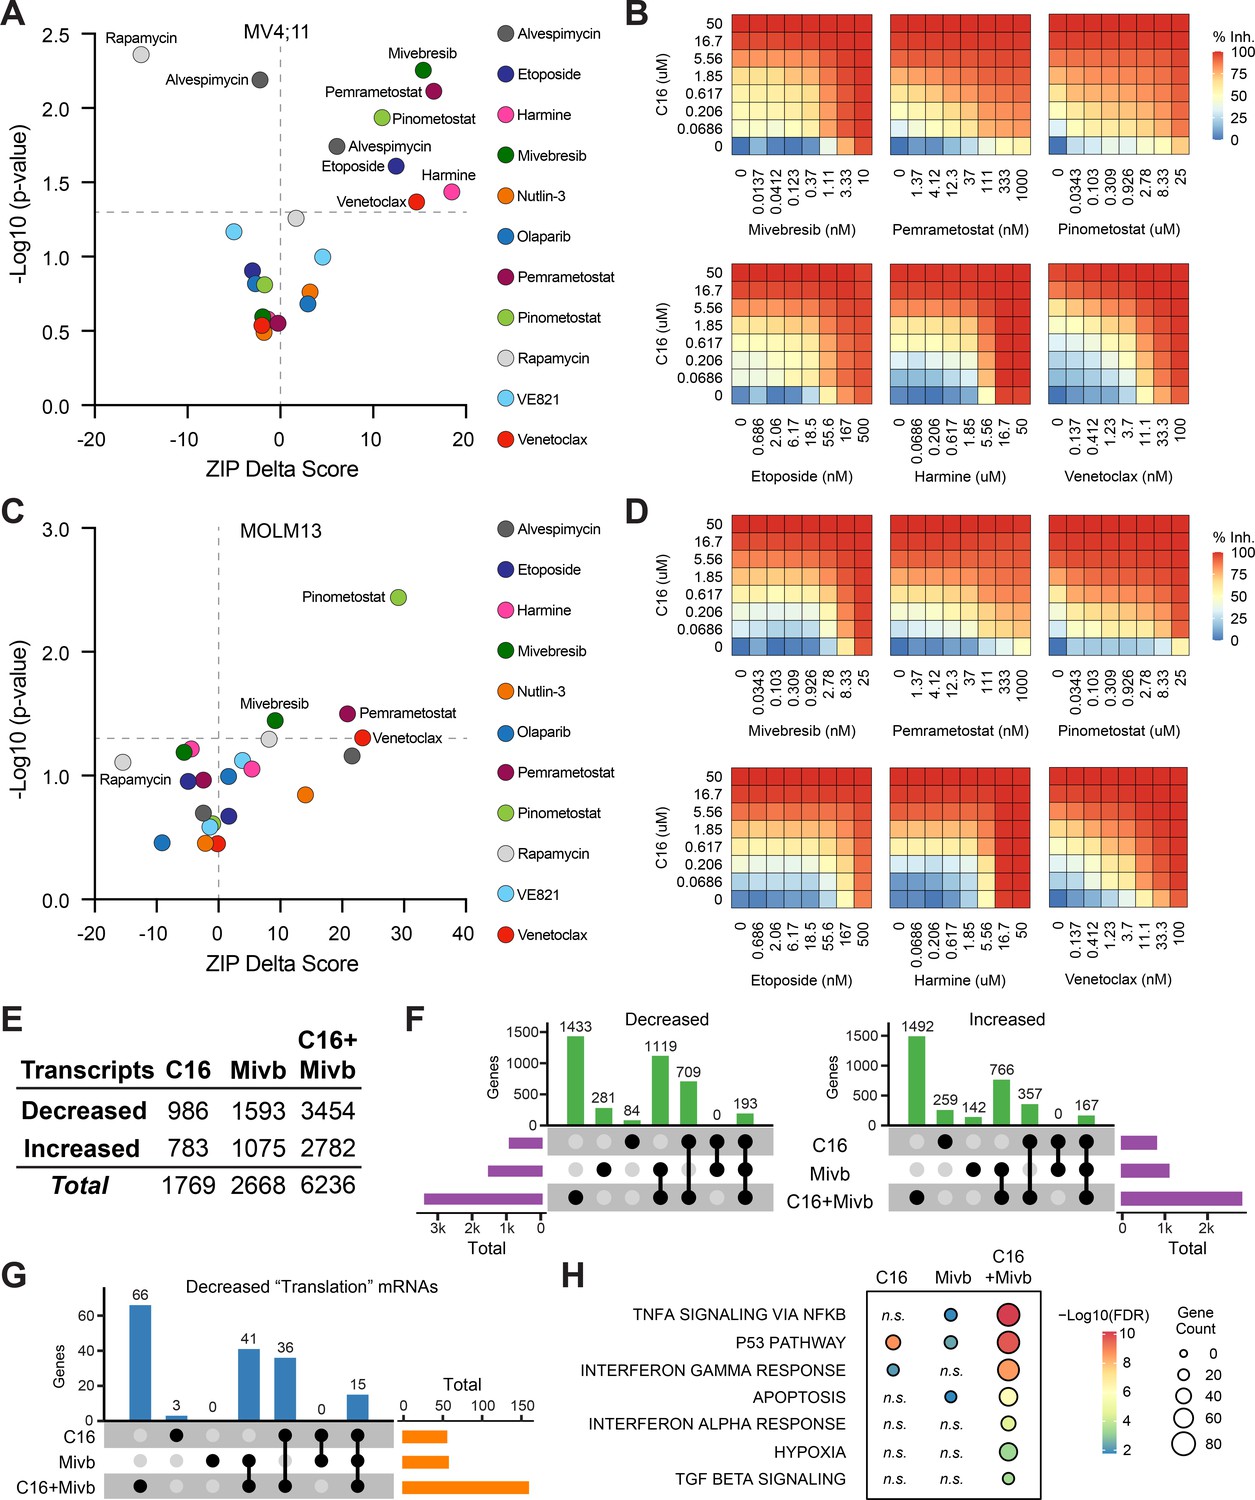
(A) Peak synergy (>0) and antagonism (<0) zero interaction potency (ZIP) delta (δ) scores from synergy assays in which MV4;11 cells were treated for 3 d with 49 unique dose combinations of C16 and the indicated compound of interest (n = 4). See Figure 5—source data 1 for numerical ZIP delta analysis output. (B) Heatmaps of MV4;11 cell growth inhibition at each dose of C16 and the indicated six compounds. The remaining five combinations tested are shown in Figure 5—figure supplement 1. (C) As in (A) but for MOLM13 cells. See Figure 5—source data 1 for numerical ZIP delta analysis output. (D) As in (B) but for MOLM13 cells. The remaining five combinations tested are shown in Figure 5—figure supplement 2. (E) Number of genes with significantly (false discovery rate [FDR] < 0.05) altered transcript levels following treatment of MV4;11 cells with C16 (100 nM), mivebresib (Mibv; 2.5 nM), or the combination for 48 hr, as determined by RNA-seq (n = 3). See Figure 5—source data 2 for complete output of RNA-seq analysis. (F) UpSet plot, showing the overlap of genes suppressed (left) or induced (right) in response to C16, mivebresib, or the combination. (G) UpSet plot, showing the breakdown of Reactome ‘Translation’ pathway genes suppressed in response to C16, mivebresib, or the combination. (H) Enrichment of Reactome Pathways in genes with increased transcripts following treatment of MV4;11 cells with C16, mivebresib, or the combination. See Figure 5—source data 3 for complete output of enrichment analyses.
-
Figure 5—source data 1
Peak synergy and antagonism scores for MV4:11 and MOLM13 cells treated with C16 in combination with 11 agents.
- https://cdn.elifesciences.org/articles/90683/elife-90683-fig5-data1-v1.xlsx
-
Figure 5—source data 2
Output of RNA-seq analysis of MV4;11 cells treated with C16, mivebresib, or both.
- https://cdn.elifesciences.org/articles/90683/elife-90683-fig5-data2-v1.xlsx
-
Figure 5—source data 3
Enrichment analysis of differentially expressed genes in RNA-seq of MV4;11 cells treated with C16, mivebresib, or both.
- https://cdn.elifesciences.org/articles/90683/elife-90683-fig5-data3-v1.xlsx
Figure 5—figure supplement 1
C16 is synergistic with multiple agents in MV4;11 cells.
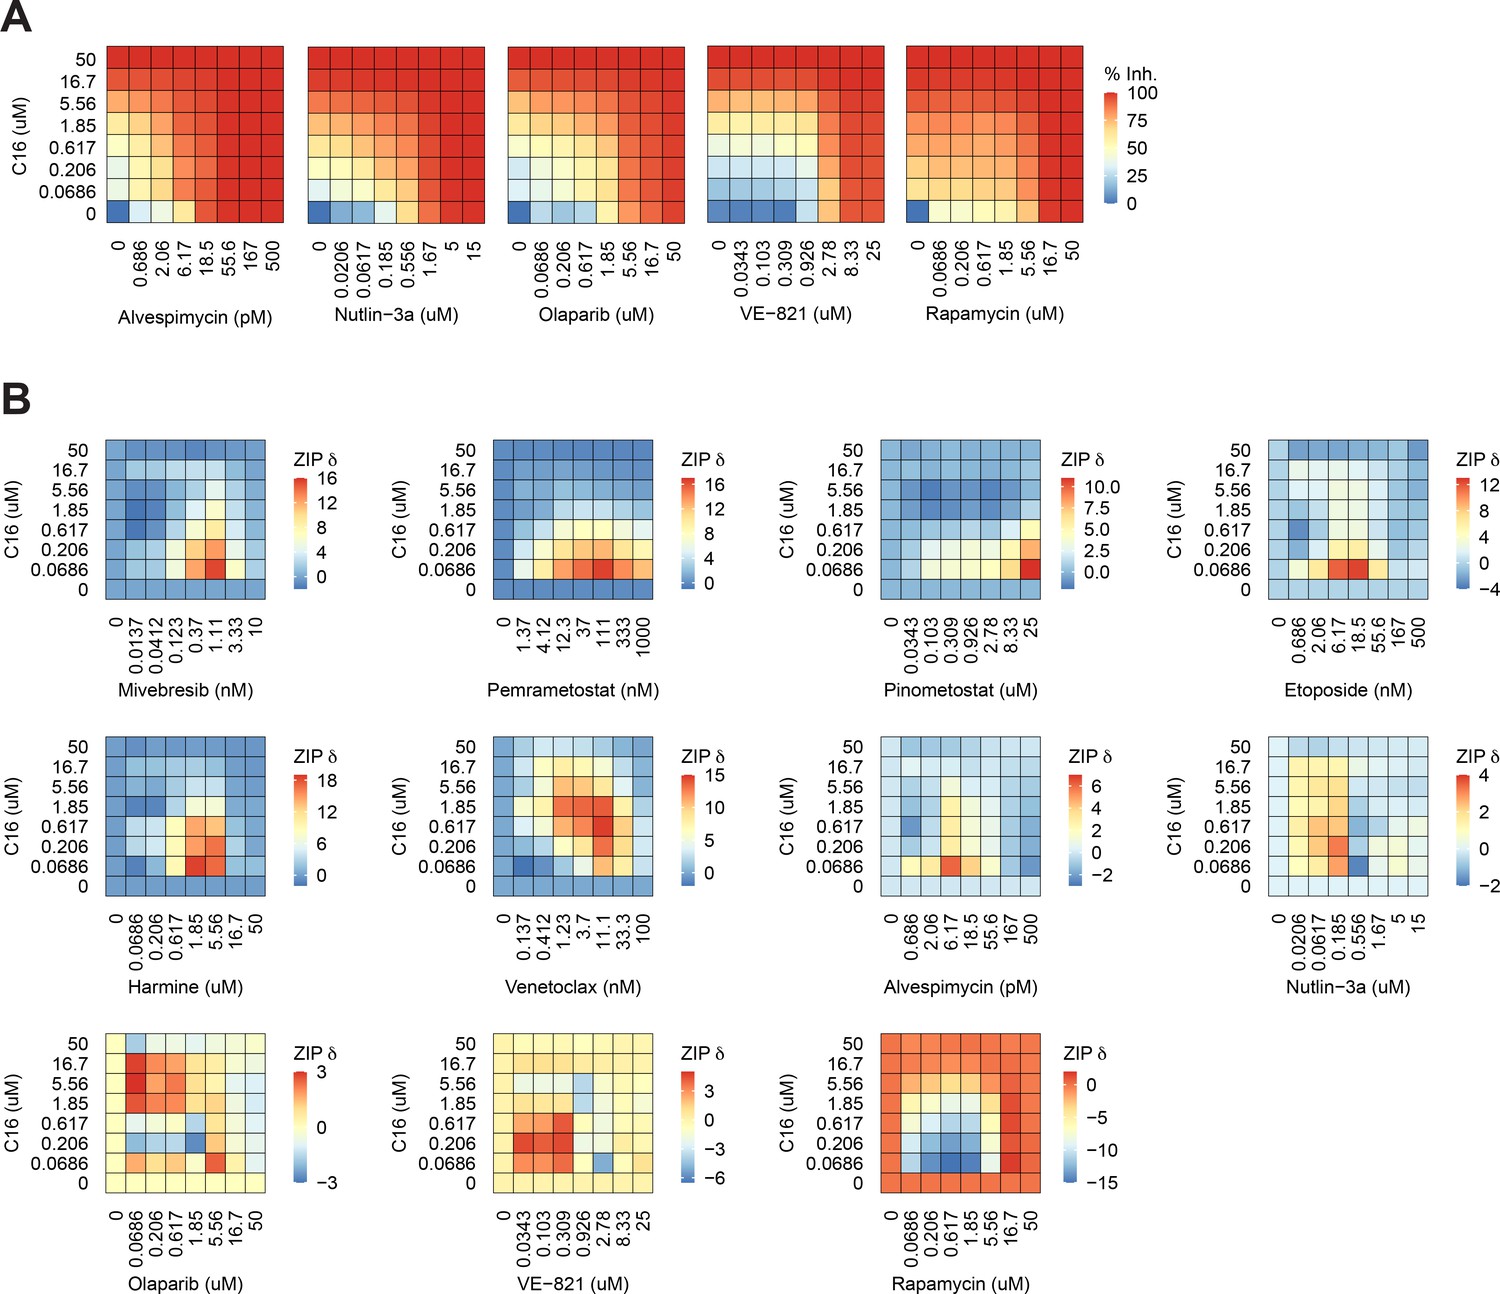
(A) Heatmaps of MV4;11 cell growth inhibition at each dose of C16 and the indicated five compounds. (B) Heatmaps of δ scores from MV4;11 cells at each dose combination of C16 and the indicated agents.
Figure 5—figure supplement 2
C16 is synergistic with multiple agents in MOLM13 cells.
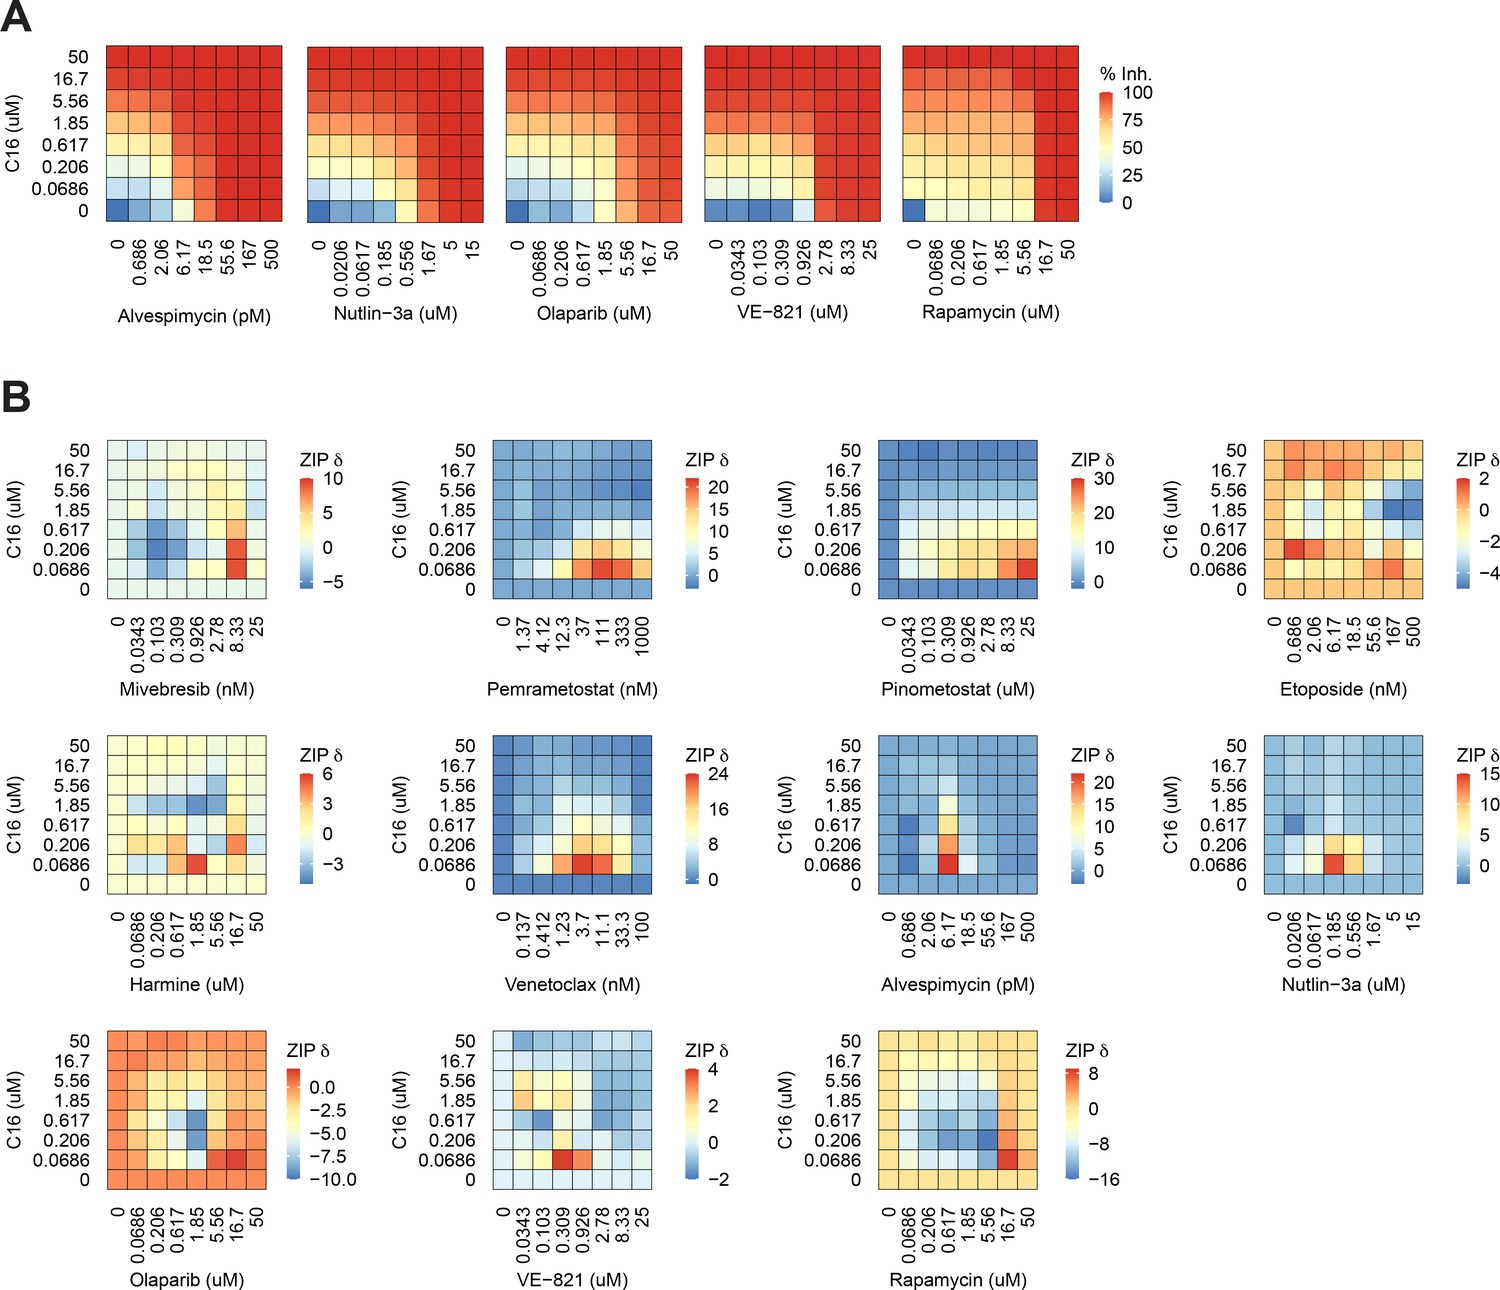
(A) Heatmaps of MOLM13 cell growth inhibition at each dose of C16 and the indicated five compounds. (B) Heatmaps of δ scores from MOLM13 cells at each dose combination of C16 and the indicated agents.
Figure 5—figure supplement 3
Impact of C16 and mivebresib on RPG and p53 target gene expression.
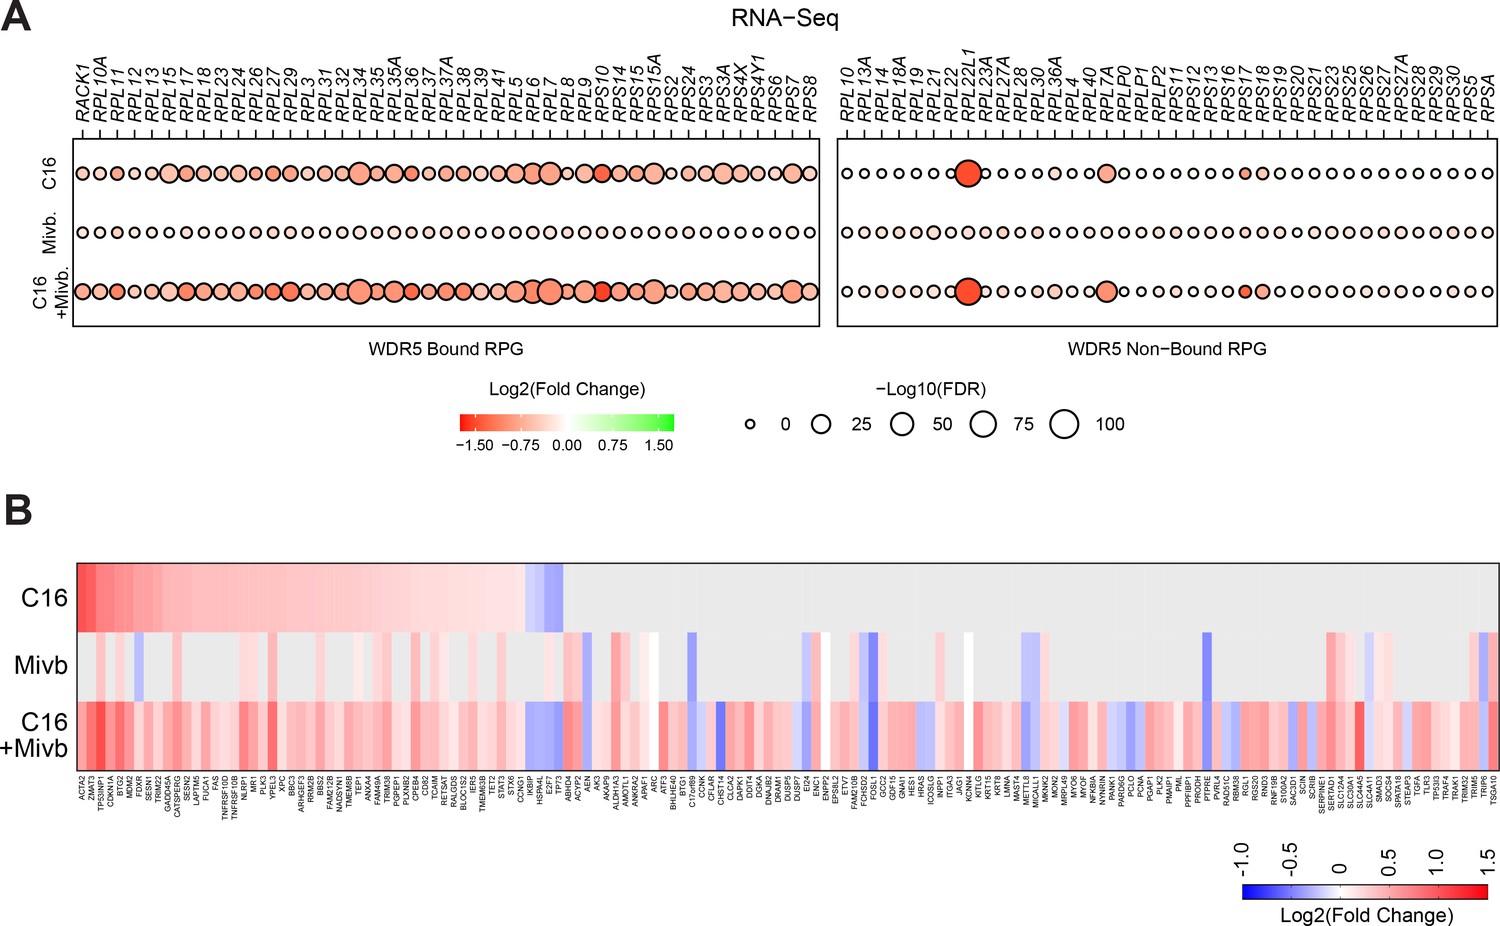
(A) Transcript level changes in WDR5-bound (left) and non-bound (right) RPGs elicited by C16 (top), mivebresib (Mivb; middle), or the combination (bottom). (B) Heatmap, showing significant changes in the expression of consensus p53 target genes (Fischer, 2017) induced by C16, mivebresib (Mivb; middle) or the combination (bottom) in MV4;11 cells.
Figure 6 with 3 supplements

WIN site inhibitors (WINi) inactivate MDM4 in an RPL22-dependent manner.
(A) Differential alternative splicing events affected by C6/C16 treatment of MV4;11 cells were quantified by rMATS. The types of alternative splicing events are cartooned at left, and the number of significantly different events (>5% ∆ψ; false discovery rate [FDR] < 0.05) common to C6/C16 depicted in the graph. See Figure 6—source data 2 for output of rMATS analysis. (B) Sashimi plot quantifying read junctions that span exons 5–7 of MDM4 in MV4;11 cells treated with DMSO (green) or C16 (blue). Numbers in the arcs display junction depth. The location of exons 5, 6, and 7 is depicted at the bottom; skipped exon 6 is highlighted in orange. (C) Viabilities of control (non-targeting: NT) and RPL22 knock out (KO) MV4;11, MOLM13, and K562 cells treated with a serial dilution range of C16 for 72 hr, relative to viability of DMSO-treated cells (n = 3; mean ± SEM). (D) Western blot analysis of p53 levels in control (NT) and RPL22 knockout (KO) MV4;11 and MOLM13 cells treated with either 0.1% DMSO or C16 (MV4;11, 200 nM; MOLM13, 400 nM) for 72 hr. α-Actinin is loading control. Representative images from three biological replicates shown. Raw unprocessed gel images are presented in Figure 6—source data 5. (E) Heatmap, showing significant changes in the expression of consensus p53 target genes (Fischer, 2017) between the indicated pairwise comparisons of RNA-seq datasets. Note that only consensus p53 target genes altered in expression by C16 in control (NT) cells are represented. (F) Sashimi plot quantifying read junctions that span exons 5–7 of MDM4 in RPL22KO MV4;11 cells treated with DMSO or C16. Numbers in the arcs display junction depth. The location of exons 5, 6, and 7 is depicted at the bottom; skipped exon 6 is highlighted in orange. Corresponding NT images are presented alongside RPL22KO images in Figure 6—figure supplement 3B. (G) Western blots, comparing the effects of 72 hr of DMSO (DM) or C16 treatment (MV4;11, 200 nM; MOLM13, 400 nM) of control (NT) or RPL22 knockout (KO) MV4;11 (left) or MOLM13 (right) cells on levels of MDM4, p21, RPL22L1, RPL22, and GAPDH (loading control). Representative images from three biological replicates are shown. Raw unprocessed gel images are presented in Figure 6—source data 9.
-
Figure 6—source data 1
Raw unprocessed gel images corresponding to Figure 6—figure supplement 1A.
- https://cdn.elifesciences.org/articles/90683/elife-90683-fig6-data1-v1.pdf
-
Figure 6—source data 2
Output of rMATS analysis of MV4;11 cells treated with C6/C16.
- https://cdn.elifesciences.org/articles/90683/elife-90683-fig6-data2-v1.xlsx
-
Figure 6—source data 3
Raw unprocessed gel images corresponding to Figure 6—figure supplement 1F.
- https://cdn.elifesciences.org/articles/90683/elife-90683-fig6-data3-v1.pdf
-
Figure 6—source data 4
Raw unprocessed gel images corresponding to Figure 6—figure supplement 2A.
- https://cdn.elifesciences.org/articles/90683/elife-90683-fig6-data4-v1.pdf
-
Figure 6—source data 5
Raw unprocessed gel images corresponding to Figure 6D.
- https://cdn.elifesciences.org/articles/90683/elife-90683-fig6-data5-v1.pdf
-
Figure 6—source data 6
Output of RNA-seq analysis of NT and RPL22KO MV4;11 cells treated with C16.
- https://cdn.elifesciences.org/articles/90683/elife-90683-fig6-data6-v1.xlsx
-
Figure 6—source data 7
GSEA Hallmark and GOBP enrichment analysis of differentially expressed genes in RNA-seq of NT and RPL22KO MV4;11 cells treated with C16.
- https://cdn.elifesciences.org/articles/90683/elife-90683-fig6-data7-v1.xlsx
-
Figure 6—source data 8
Output of rMATS analysis of NT and RPL22KO MV4;11 cells treated with C16.
- https://cdn.elifesciences.org/articles/90683/elife-90683-fig6-data8-v1.xlsx
-
Figure 6—source data 9
Raw unprocessed gel images corresponding to Figure 6G.
- https://cdn.elifesciences.org/articles/90683/elife-90683-fig6-data9-v1.pdf
Figure 6—figure supplement 1
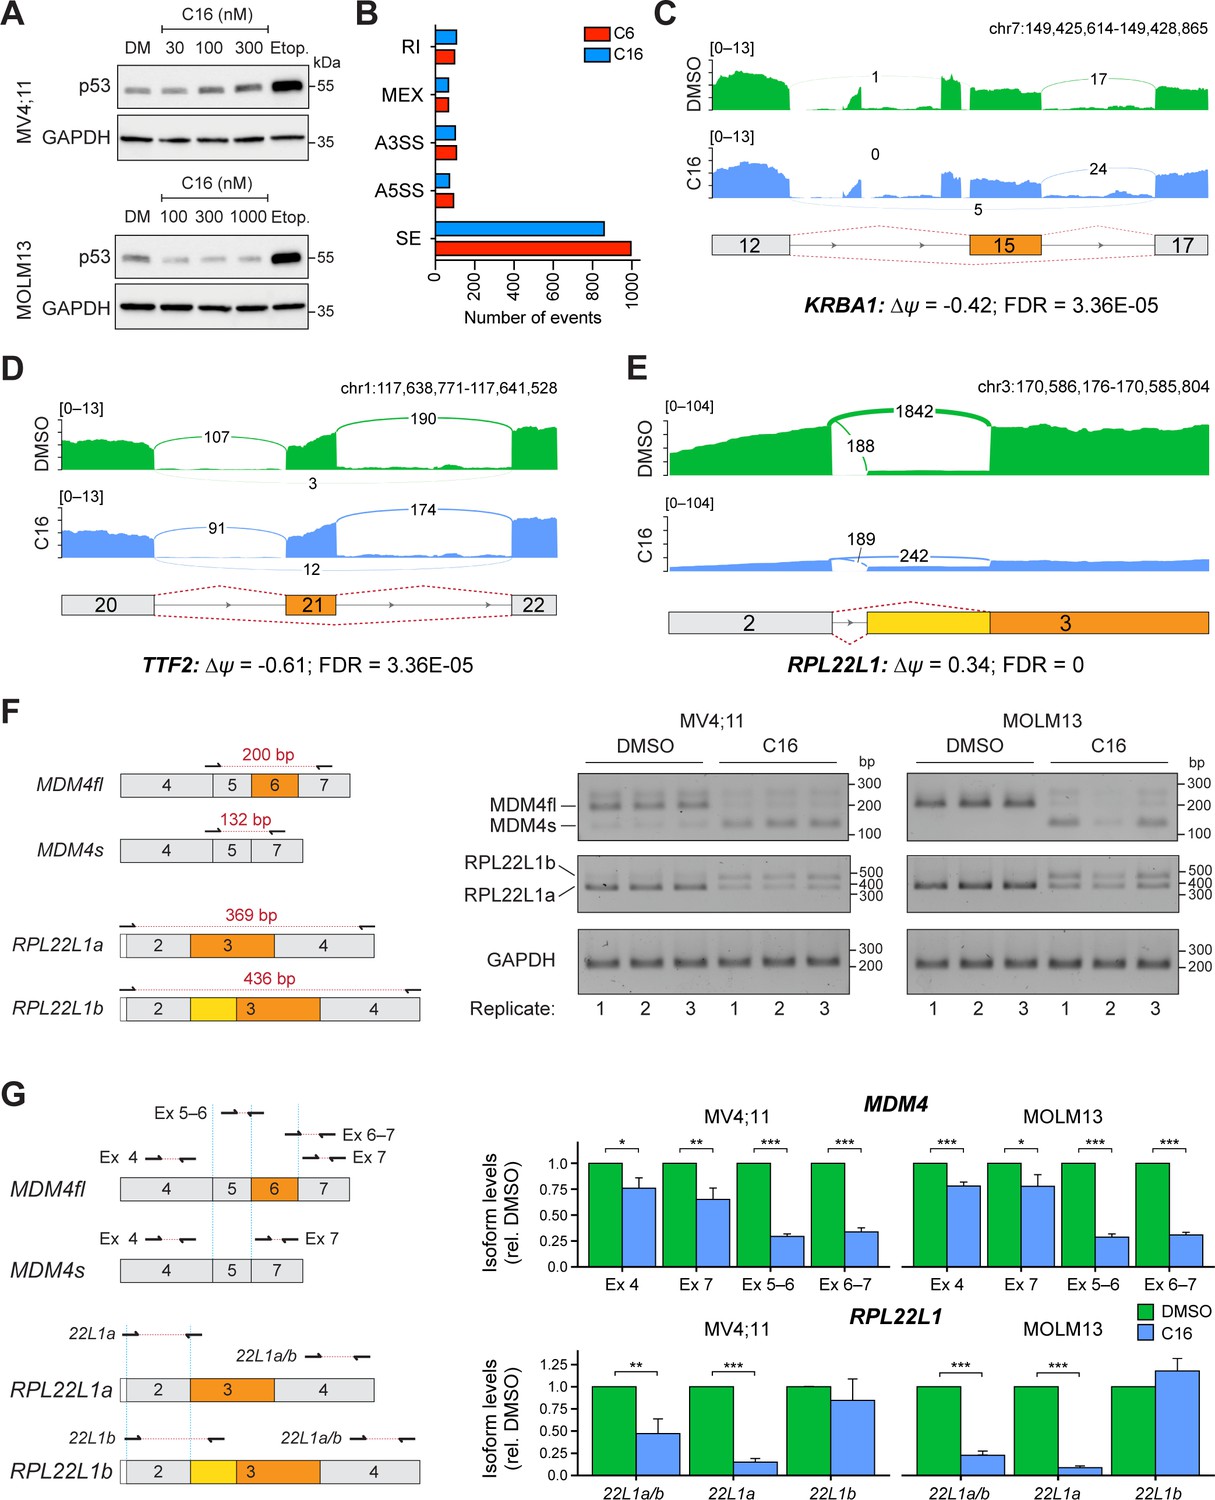
WIN site inhibitors (WINi) alter the abundance of alternatively spliced mRNA isoforms.
(A) Western blots comparing the effects of 72 hr DMSO (DM) or C16 treatment of MV4;11 (top) or MOLM13 (bottom) cells on levels of p53 and GAPDH (loading control). Representative images from three biological replicates are shown. Raw unprocessed gel images are presented in Figure 6—source data 1. (B) Differential alternative splicing events impacted by C6 (red) or C16 (blue) treatment of MV4;11 cells were quantified by rMATS. The number of significantly different events (>5% ∆ψ; false discovery rate [FDR] < 0.05) for each WINi are depicted in the graph. ‘RI’ is retained intron; ‘MEX’ is mutually exclusive exons; ‘A3SS’ is alternative 3' splice site; ‘A5SS’ is alternative 5' splice site; ‘SE’ is skipped exon. See Figure 6—source data 2 for output of rMATS analysis. (C) Sashimi plot quantifying read junctions that span exons 12–17 of KRBA1 in MV4;11 cells treated with DMSO (green) or C16 (blue). Numbers in the arcs display junction depth. Skipped exon 15 is highlighted in orange. (D) As in (C) but for read junctions that span exons 20–22 of TTF2. Skipped exon 21 is highlighted in orange. (E) As in (C), but for read junctions that span exons 2 and 3 of RPL22L1. The location of exons 2 and 3 is depicted at the bottom. Splicing of exon 2 to the distal acceptor site in exon 3 results in an mRNA encoding RPL22L1a (orange); splicing to the proximal acceptor site in exon 3 results in an mRNA encoding RPL22L1b (yellow). (F) Left: representation of amplicons used to discriminate between different MDM4 (top) and RPL22L1 (bottom) isoforms via semi-quantitative PCR. Right: results of semi-quantitative PCR analysis for the various isoforms of MDM4 and RPL22L1, and a GAPDH control, in MV4;11 or MOLM13 cells treated for 48 hr with DMSO or C16 (MV4;11, 100 nM; MOLM13, 250 nM; n = 3). All three biological replicates for DMSO and C16 are shown. Raw unprocessed gel images for the data in (F) are presented in Figure 6—source data 3. (G) Left: representation of amplicons used to discriminate between MDM4 (top) and RPL22L1 (bottom) isoforms via RT-qPCR. Right: results of RT-qPCR analysis for the various isoforms of MDM4 (top) and RPL22L1 (bottom) in MV4;11 or MOLM13 cells treated for 48 hr with DMSO or C16 (MV4;11, 100 nM; MOLM13, 250 nM; n = 3; mean ± SEM). For each amplicon, isoform levels are expressed relative to the DMSO control. p-Values calculated by Student’s t-tests are represented by asterisks: *≤0.05, **≤0.01, ***≤0.001.
Figure 6—figure supplement 2
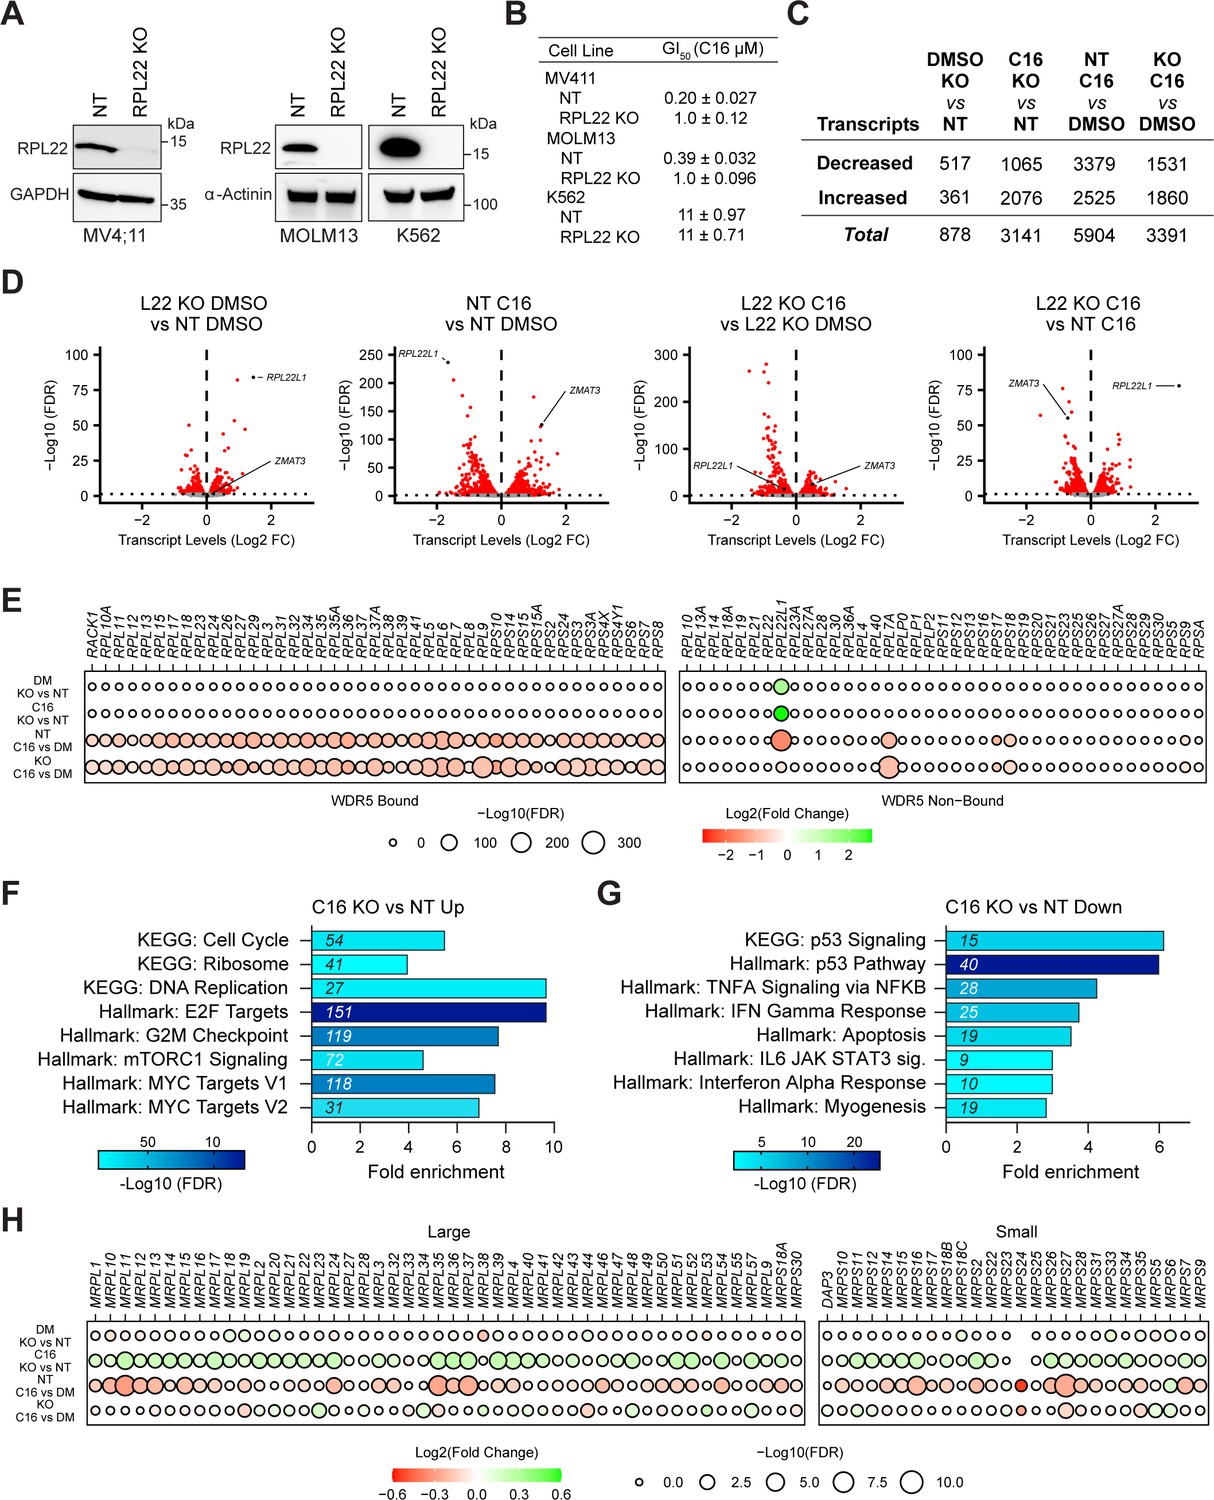
Impact of RPL22 loss on the response of MLLr cells to WIN site inhibitors (WINi).
(A) Western blot analysis of RPL22 expression in MV4;11, MOLM13, and K562 cells electroporated with Cas9 and either scrambled non-targeting (NT) control or RPL22-targeting sgRNAs. GAPDH and α-actinin are loading controls. Representative images from three biological replicates shown. Raw unprocessed gel images are presented in Figure 6—source data 4. (B) GI50 values of C16 in non-targeted (NT) and RPL22 knock out (KO) MV4;11, MOLM13, and K562 cells in a 72 hr assay (n = 3; mean ± SEM). (C) Number of genes with significantly (false discovery rate [FDR] < 0.05) altered transcript levels following treatment of RPL22KO or control (NT) cells treated with DMSO or 100 nM C16 for 48 hr, as determined by RNA-seq (n = 4). See Figure 6—source data 6 for complete output of RNA-seq analysis. (D) Volcano plots, showing pairwise transcript level alterations in NT (control) and RPL22KO MV4;11 cells treated 48 hr with DMSO or 100 nM C16 (red indicates FDR < 0.05). The locations of transcripts from ZMAT3 and RPL22L1 are indicated. (E) Transcript level changes in WDR5-bound (left) and non-bound (right) RPGs in each of the indicated pairwise comparisons of RNA-seq datasets. (F) Enrichment analysis of genes differentially induced by C16 in RPL22KO cells compared to control (NT) cells. KEGG and Hallmark.MSigDB pathways are shown. Fold enrichment of indicated pathways is presented on the x-axis, the number of genes is shown in italics in each bar, and colors represent -Log10 FDR. See Figure 6—source data 7 for complete enrichment analyses. (G) As in (F) but for suppressed genes. (H) Transcript level changes in mitochondrial ribosomal protein genes elicited by C16 in NT or RPL22KO cells.
Figure 6—figure supplement 3
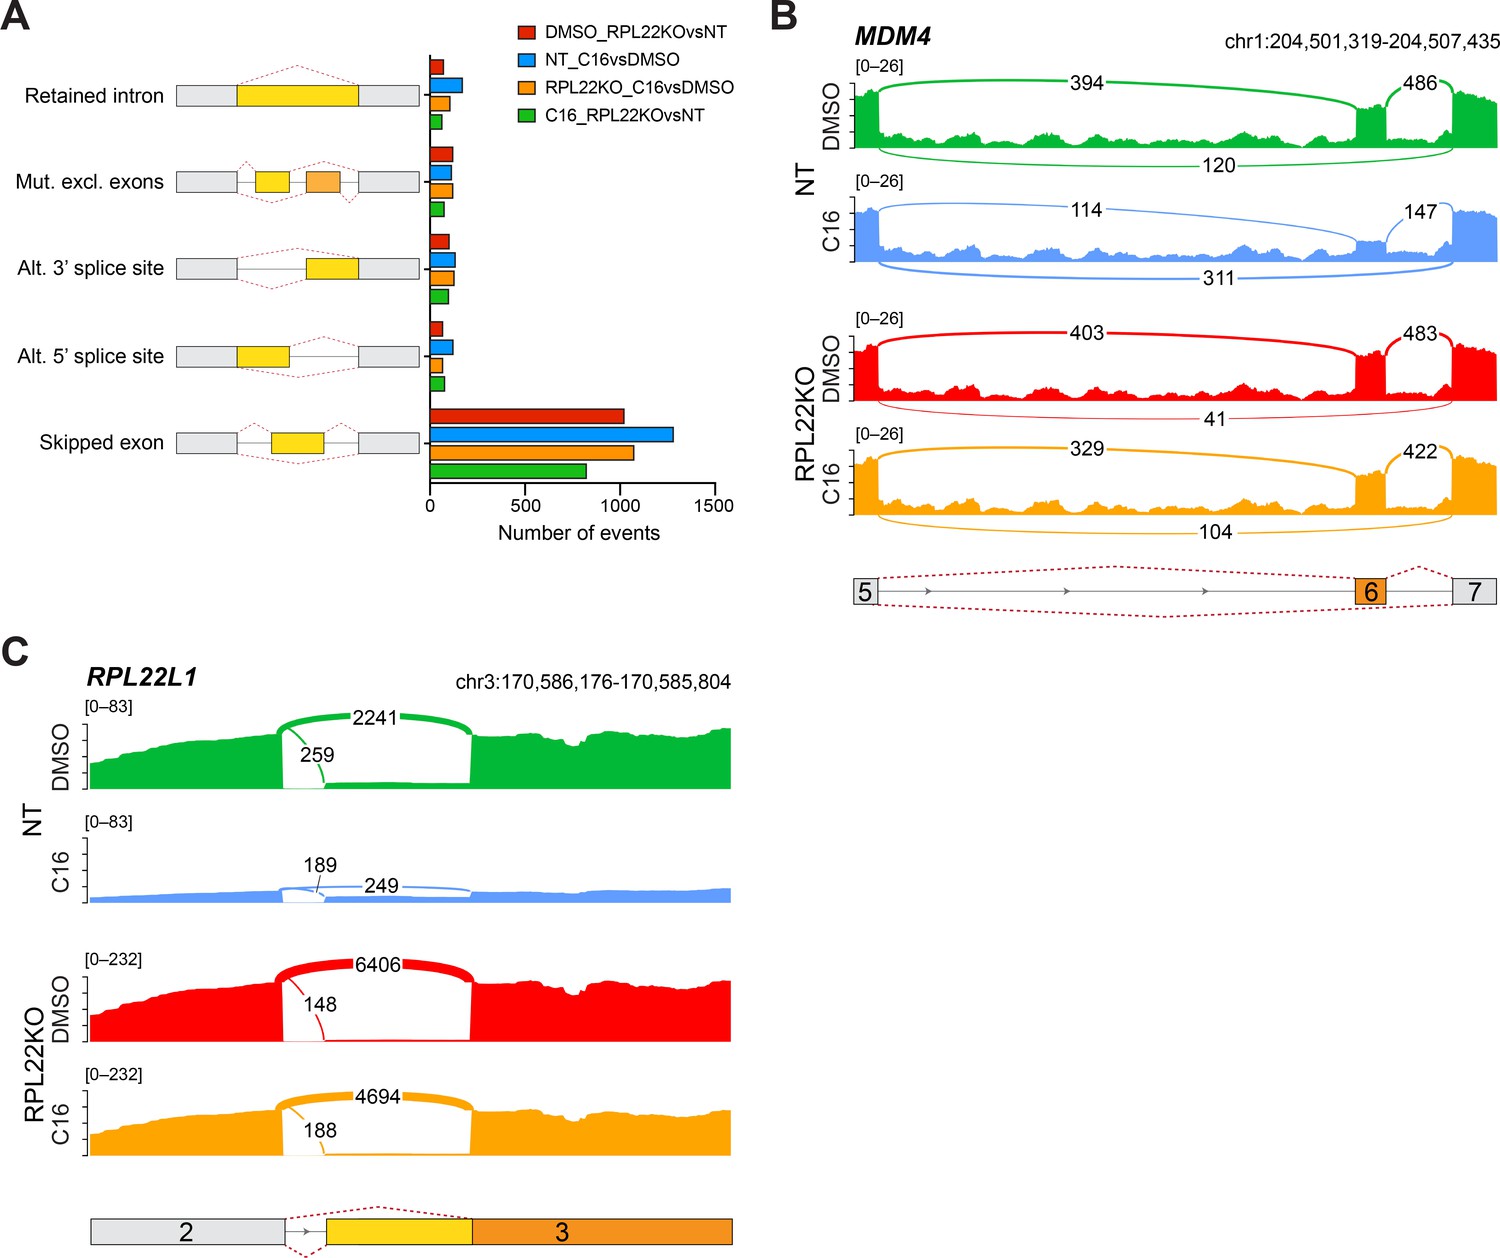
Impact of RPL22 loss on the abundance of alternatively-spliced mRNA isoforms in MV4;11 cells.
(A) Differential alternative splicing events affected by C16 treatment of control (NT) or RPL22 knockout (KO) MV4;11 cells were quantified by rMATS. The types of alternative splicing events are cartooned at left, and the number of significantly different events (>5% ∆ψ; false discovery rate [FDR] < 0.05) depicted in the graph. See Figure 6—source data 8 for output of rMATS analysis. (B) Sashimi plot quantifying read junctions that span exons 5–7 of MDM4 in NT or RPL22KO MV4;11 cells treated with DMSO or C16. Numbers in the arcs display junction depth. The location of exons 5, 6, and 7 is depicted at the bottom; skipped exon 6 is highlighted in orange. Note that RPL22KO images are also represented in Figure 6F. (C) As in (B) but for read junctions that span exons 2 and 3 of RPL22L1. The location of exons 2 and 3 is depicted at the bottom. Splicing of exon 2 to the distal acceptor site in exon 3 results in an mRNA encoding RPL22L1a (orange); splicing to the proximal acceptor site in exon 3 results in an mRNA encoding RPL22L1b (yellow).
Tables
Appendix 1—key resources table
| Reagent type (species) or resource | Designation | Source or reference | Identifiers | Additional information |
|---|---|---|---|---|
| Gene (Homo sapiens) | RPL22 | NA | ENSEMBL:ENSG00000116251 | |
| Gene (H. sapiens) | RPL22L1 | NA | ENSEMBL:ENSG00000163584 | |
| Gene (H. sapiens) | MDM4 | NA | ENSEMBL:ENSG00000198625 | |
| Strain, strain background (Escherichia coli) | Endura ElectroCompetent Cells | Lucigen | Cat# 60242-2 | |
| Cell line (H. sapiens) | ‘MV4;11’ | ATCC | Cat# CRL-9591; RRID:CVCL_0064 | |
| Cell line (H. sapiens) | ‘MV4;11 NT’ | This study | NA | See ‘Generation of RPL22-null cell lines’ |
| Cell line (H. sapiens) | ‘MV4;11 RPL22 KO’ | This study | NA | See ’Generation of RPL22-null cell lines’ |
| Cell line (H. sapiens) | ‘MV4;11 Cas9’ | This study | NA | See ‘Generation of Cas9-expressing MV4;11 cells’ |
| Cell line (H. sapiens) | MOLM13 | DMSZ | Cat# ACC554; RRID:CVCL_2119 | |
| Cell line (H. sapiens) | MOLM13 NT | This study | NA | See ‘Generation of RPL22-null cell lines’ |
| Cell line (H. sapiens) | MOLM13 RPL22 KO | This study | NA | See ‘Generation of RPL22-null cell lines’ |
| Cell line (H. sapiens) | K562 | ATCC | Cat# CCL-243; RRID:CVCL_0004 | |
| Cell line (H. sapiens) | K562 NT | This study | NA | See ‘Generation of RPL22-null cell lines’ |
| Cell line (H. sapiens) | K562 RPL22 KO | This study | NA | See ‘Generation of RPL22-null cell lines’ |
| Cell line (H. sapiens) | HEK293T | ATCC | Cat# CRL-11268; RRID:CVCL_1926 | |
| Antibody | Anti-p53 (DO-1) (mouse monoclonal) | Santa Cruz Biotechnology | Cat# sc-126; RRID:AB_628082 | (1:2000) |
| Antibody | Anti-RPL22 (52) (mouse monoclonal) | Santa Cruz Biotechnology | Cat# sc-136413; RRID:AB_10658965 | (1:1000) |
| Antibody | Anti-RPL22L1 (rabbit polyclonal) | Thermo Fisher Scientific | Cat# PA5-63266; RRID:AB_2646731 | (1:1000) |
| Antibody | Anti-MDMX (mouse monoclonal) | Sigma-Aldrich | Cat# M0445; RRID:AB_532256 | (1:1000) |
| Antibody | Anti-p21 Waf1/Cip1 (12D1) (rabbit monoclonal) | Cell Signaling Technology | Cat# 2947; RRID:AB_823586 | (1:1000) |
| Antibody | Anti-⍺-actinin (HRP) (rabbit monoclonal) | Cell Signaling Technology | Cat# 12413; RRID:AB_2797903 | (1:1000) |
| Antibody | Anti-GAPDH (HRP) (rabbit monoclonal) | Cell Signaling Technology | Cat# 8884; RRID:AB_11129865 | (1:2000) |
| Antibody | Anti-nucleophosmin (mouse monoclonal) | Abcam | Cat# ab10530; RRID:AB_297271 | (1:500) |
| Antibody | Anti-Phospho-Histone H2A.X (Ser139) (20E3) (rabbit monoclonal) | Cell Signaling Technology | Cat# 9718; RRID:AB_2118009 | (1:250) |
| Antibody | Goat anti-mouse IgG (H+L) Cross-Adsorbed Secondary Antibody, Alexa Fluor 488 | Thermo Fisher Scientific | Cat# A-11001; RRID:AB_2534069 | (1:500) |
| Antibody | Goat anti-rabbit IgG (H+L) Highly Cross-Adsorbed Secondary Antibody, Alexa Fluor 594 | Thermo Fisher Scientific | Cat# A-11037; RRID:AB_2534095 | (1:500) |
| Antibody | Anti-GAPDH (HRP) (rabbit monoclonal) | Cell Signaling Technology | Cat# 8884; RRID:AB_11129865 | (1:2000) |
| Antibody | Goat anti-mouse IgG, Light chain specific (HRP) | Jackson ImmunoResearch Laboratories, Inc | Cat# 115-035-174; RRID:AB_2338512 | (1:5000) |
| Antibody | Goat anti-rabbit IgG, HRP-linked antibody | Cell Signaling Technology | Cat# 7074; RRID:AB_2099233 | (1:5000) |
| Recombinant DNA reagent | lentiCas9-Blast | PMID:25075903 | Addgene plasmid# 52962; RRID:Addgene_52962 | |
| Recombinant DNA reagent | psPAX2 | Addgene | Addgene plasmid# 12260; RRID:Addgene_12260 | |
| Recombinant DNA reagent | pMD2.G | Addgene | Addgene plasmid# 12259; RRID:Addgene_12259 | |
| Recombinant DNA reagent | Human GeCKOv2 CRISPR Knockout Pooled Library (A+B) in lentiGuide-PURO | PMID:25075903 | Addgene plasmid# 1000000048 | |
| Recombinant DNA reagent | lentiGuide-PURO | PMID:25075903 | Addgene plasmid# 52963; RRID:Addgene_52963 | |
| Commercial assay or kit | cOmplete, EDTA-free, Protease Inhibitor Cocktail | Roche | Cat# 11873580001 | |
| Commercial assay or kit | PhosSTOP | Roche | Cat# 4906837001 | |
| Commercial assay or kit | Pefabloc SC | Roche | Cat# 11429868001 | |
| Commercial assay or kit | TURBO DNase (2 U/µL) | Invitrogen | Cat# AM2238 | |
| Commercial assay or kit | RNase I, E. coli | Lucigen | Cat# N6901K | |
| Commercial assay or kit | SUPERaseIn RNase Inhibitor | Invitrogen | Cat# AM2694 | |
| Commercial assay or kit | TRIzol Reagent | Invitrogen | Cat# 15596018 | |
| Commercial assay or kit | SYBR Gold Nucleic Acid Gel Stain | Invitrogen | Cat# S11494 | |
| Commercial assay or kit | T4 Polynucleotide Kinase | New England BioLabs | Cat# M0201S | |
| Commercial assay or kit | T4 RNA Ligase 2, truncated K227Q | New England BioLabs | Cat# M0351S | |
| Commercial assay or kit | SuperScript III Reverse Transcriptase | Invitrogen | Cat# 18080085 | |
| Commercial assay or kit | Random Hexamers | Invitrogen | Cat# N8080127 | |
| Commercial assay or kit | CircLigase II ssDNA Ligase | Lucigen | Cat# CL9021K | |
| Commercial assay or kit | LD-Dithiothreitol | MilliporeSigma | Cat# D9779 | |
| Commercial assay or kit | Iodoacetamide | MilliporeSigma | Cat# I1149 | |
| Commercial assay or kit | o-Phosphoric acid, 85% | Fisher Scientific | Cat# A260-500 | |
| Commercial assay or kit | Water, Optima LC/MS Grade | Fisher Scientific | Cat# W6-4 | |
| Commercial assay or kit | Methanol, Optima LC/MS Grade | Fisher Scientific | Cat# A456 | |
| Commercial assay or kit | Triethylammonium bicarbonate buffer | MilliporeSigma | Cat# T7408 | |
| Commercial assay or kit | Trypsin Gold, Mass Spectrometry Grade | Promega | Cat# V5280 | |
| Commercial assay or kit | Formic Acid, LC/MS Grade | Thermo Scientific Pierce | Cat# 28905 | |
| Commercial assay or kit | Acetonitrile, Optima LC/MS Grade | Fisher Scientific | Cat# A955-1 | |
| Commercial assay or kit | Phusion High Fidelity DNA polymerase | New England BioLabs | Cat# M0530S | |
| Commercial assay or kit | BsmBIv2 | New England BioLabs | Cat# R0739S | |
| Commercial assay or kit | DNase I (RNase-free) | New England BioLabs | Cat# M0303S | |
| Commercial assay or kit | RNA Clean and Concentrator-25 | Zymo Research | Cat# R1017 | |
| Commercial assay or kit | RNasin Ribonuclease Inhibitor | Promega | Cat# N2515 | |
| Commercial assay or kit | SYBR Safe DNA Gel Stain | Invitrogen | Cat# S33102 | |
| Commercial assay or kit | Click-iT Cell Reaction Buffer Kit | Invitrogen | Cat# C10269 | |
| Commercial assay or kit | Neon Transfection System 10 µL Kit | Thermo Scientific | Cat# MPK1096 | |
| Commercial assay or kit | Gene Knockout Kit v2 – human – RPL22 | Synthego | NA | |
| Commercial assay or kit | Negative Control, Scrambled sgRNA#1, mod-sgRNA | Synthego | NA | |
| Commercial assay or kit | ProLong Gold Antifade Mountant | Thermo Fisher Scientific | Cat# P36934 | |
| Commercial assay or kit | Lipofectamine 3000 Transfection Reagent | Invitrogen | Cat# L3000075 | |
| Commercial assay or kit | QuantiGene Plex panel | Thermo Fisher Scientific | NA | |
| Commercial assay or kit | QuantiGene Sample Processing Kit for cultured cells | Thermo Fisher Scientific | Cat# QS0100 | |
| Commercial assay or kit | QuantiGene Plex Assay kits | Thermo Fisher Scientific | Cat# QP1013 | |
| Commercial assay or kit | Pierce BCA Protein Assay Kit | Thermo Scientific | Cat# PI23225 | |
| Commercial assay or kit | Clarity Western ECL Substrate | Bio-Rad | Cat# 1705061 | |
| Commercial assay or kit | Qubit RNA High Sensitivity Assay Kit | Invitrogen | Cat# Q32852 | |
| Commercial assay or kit | Direct-zol RNA Miniprep | Zymo Research | Cat# R2050 | |
| Commercial assay or kit | RiboCop rRNA Depletion Kit V1.2 | Lexogen | Cat# 037.24 | |
| Commercial assay or kit | Quick-DNA MidiPrep Plus Kit | Zymo Research | Cat# D4075 | |
| Commercial assay or kit | NEBNext High Fidelity 2X PCR Master Mix | New England BioLabs | Cat# M0541L | |
| Commercial assay or kit | Zymo-Spin V Columns with Reservoir | Zymo Research | Cat# C1016-25 | |
| Commercial assay or kit | NucleoSpin Gel and PCR Clean-up | Macherey-Nagel | Cat# 740609.250 | |
| Commercial assay or kit | Gibson Assembly Master Mix | New England BioLabs | Cat# E2611S | |
| Commercial assay or kit | NucleoBond Xtra Maxi EF | Macherey-Nagel | Cat# 740424.10 | |
| Commercial assay or kit | Q5 DNA Polymerase | New England BioLabs | Cat# M0491S | |
| Commercial assay or kit | Taq DNA Polymerase with Standard Taq Buffer | New England BioLabs | Cat# M0273S | |
| Commercial assay or kit | SYBR Safe DNA Gel Stain | Invitrogen | Cat# S33102 | |
| Commercial assay or kit | KAPA SYBR Fast qPCR Master Mix (2×) | Roche | Cat# 07959397001 | |
| Commercial assay or kit | CellTiter-Glo Luminescent Cell Viability Assay | Promega | Cat# G7572 | |
| Chemical compound, drug | Blasticidin S Hydrochloride Powder | Research Products International | Cat# B12200-0.05 | |
| Chemical compound, drug | DMSO | Sigma | Cat# D2650 | |
| Chemical compound, drug | C6 | PMID:30865883 | N/A | |
| Chemical compound, drug | C16 | PMID:31858797 | N/A | |
| Chemical compound, drug | 2’-Azido-2’-deoxycytidine | Biosynth | Cat# NA05412 | |
| Chemical compound, drug | Actinomycin D | Cayman Chemical Company | Cat# 11421-10mg | |
| Chemical compound, drug | MB 680R DBCO | Vector Laboratories | Cat# CCT-1462 | |
| Chemical compound, drug | Cycloheximide | Research Products International | Cat# C81040-1.0 | |
| Chemical compound, drug | OPP (O-propargyl-puromycin) | Invitrogen | Cat# C10459 | |
| Chemical compound, drug | Hoechst 33342 | Thermo Fisher Scientific | Cat# H3570 | |
| Chemical compound, drug | Alexa Fluor 647 Azide, Triethylammonium Salt | Invitrogen | Cat# A10277 | |
| Chemical compound, drug | Cycloheximide | Sigma | Cat# C4859-1ML | |
| Chemical compound, drug | Nutlin-3a | Cayman Chemical Company | Cat# 18585 | |
| Chemical compound, drug | Rapamycin | MedChem Express | Cat# HY-10219 | |
| Chemical compound, drug | Pinometostat | Cayman Chemical Company | Cat# 16175 | |
| Chemical compound, drug | Harmine | Sigma-Aldrich | Cat# 286044 | |
| Chemical compound, drug | Mivebresib | Cayman Chemical Company | Cat# 21033 | |
| Chemical compound, drug | Venetoclax | Cayman Chemical Company | Cat# 16233 | |
| Chemical compound, drug | Etoposide | Cayman Chemical Company | Cat# 12092 | |
| Chemical compound, drug | Olaparib | Cayman Chemical Company | Cat# 10621 | |
| Chemical compound, drug | VE-821 | Cayman Chemical Company | Cat# 17587 | |
| Chemical compound, drug | Pemrametostat | Selleck Chemicals | Cat# S8664 | |
| Chemical compound, drug | Alvespimycin | Cayman Chemical Company | Cat# 11036 | |
| Software, algorithm | R | The R Foundation | RRID:SCR_001905 | https://www.r-project.org |
| Software, algorithm | drc | Ritz et al., 2015; Ritz and Streibig, 2021 | NA | https://github.com/DoseResponse/drc |
| Software, algorithm | CHOPCHOP | Labun et al., 2019 | RRID:SCR_015723 | https://chopchop.cbu.uib.no |
| Software, algorithm | count_spacers.py | Joung et al., 2017; Joung, 2017 | NA | https://github.com/fengzhanglab/Screening_Protocols_manuscript/blob/master/design_targeted_library.py |
| Software, algorithm | SynergyFinder Plus | Zheng et al., 2022 | RRID:SCR_019318 | https://synergyfinder.org/ |
| Software, algorithm | PASWR | Ugarte et al., 2015; Arnholt, 2022 | NA | https://github.com/cran/PASWR |
| Software, algorithm | cutadapt | Martin, 2011 | RRID:SCR_011841 | https://github.com/marcelm/cutadapt/ |
| Software, algorithm | sabre | NA | RRID:SCR_011843 | https://github.com/najoshi/sabre |
| Software, algorithm | bowtie2 | Langmead and Salzberg, 2012 | RRID:SCR_016368 | https://github.com/BenLangmead/bowtie2 |
| Software, algorithm | STAR | Dobin et al., 2013 | RRID:SCR_004463 | https://github.com/alexdobin/STAR |
| Software, algorithm | UMI-tools | Smith et al., 2017 | RRID:SCR_017048 | https://github.com/CGATOxford/UMI-tools |
| Software, algorithm | BEDTools | Quinlan and Hall, 2010 | RRID:SCR_006646 | https://github.com/arq5x/bedtools2 |
| Software, algorithm | Xtail | Xiao et al., 2016; xryanglab, 2016 | NA | https://github.com/xryanglab/xtail |
| Software, algorithm | riboWaltz | Lauria et al., 2018 | RRID:SCR_016948 | https://github.com/LabTranslationalArchitectomics/riboWaltz |
| Software, algorithm | featureCounts | Liao et al., 2014 | RRID:SCR_012919 | http://bioconductor.org/packages/release/bioc/html/Rsubread.html |
| Software, algorithm | DESeq2 | Love et al., 2014 | RRID:SCR_015687 | https://bioconductor.org/packages/release/bioc/html/DESeq2.html |
| Software, algorithm | MAGeCK | Li et al., 2014; Li and Song, 2022 | NA | https://sourceforge.net/p/mageck/wiki/Home/ |
| Software, algorithm | Maxquant | Cox and Mann, 2008 | RRID:SCR_014485 | https://cox-labs.github.io/coxdocs/maxquant_instructions.html |
| Software, algorithm | Andromeda | Cox et al., 2011 | NA | https://cox-labs.github.io/coxdocs/andromeda_instructions.html |
| Software, algorithm | Msstats | Choi et al., 2014 | RRID:SCR_014353 | https://msstats.org/ |
| Software, algorithm | fgsea | Korotkevich et al., 2021 | RRID:SCR_020938 | https://bioconductor.org/packages/release/bioc/html/fgsea.html |
| Software, algorithm | Biorender | NA | RRID:SCR_018361 | https://biorender.com |
| Software, algorithm | PyMOL | NA | RRID:SCR_000305 | https://pymol.org/2/ |
| Software, algorithm | rMATS | Shen et al., 2014 | RRID:SCR_013049 | https://rnaseq-mats.sourceforge.net |
| Software, algorithm | Molecular Signatures Database | Liberzon et al., 2011 | RRID:SCR_016863 | https://www.gsea-msigdb.org/gsea/msigdb/index.jsp |
| Software, algorithm | Universal Protein Resource | Bateman et al., 2021 | RRID:SCR_002380 | https://www.uniprot.org |
| Software, algorithm | FlowJo | NA | RRID:SRC_008520 | https://www.flowjo.com/solutions/flowjo |
| Software, algorithm | Empiria Studio | LI-COR | RRID:SCR_022512 | https://www.licor.com/bio/empiria-studio/ |
| Software, algorithm | NIS-Elements AR 5.42.03 64-bit | Nikon Instruments | RRID:SCR_014329 | https://www.nikoninstruments.com/Products/Software |
| Software, algorithm | Fiji | Fiji/ImageJ | RRID:SCR_002285 | http://fiji.sc |
| Other | S-Trap Micro Columns | ProtiFi | Cat# C02-micro-80 | |
| Other | Jupiter 3 um C18 300A, Bulk packaging | Phenomenex | Cat# 04A-4263 | |
| Other | Molex Polymicro Capillary 100 um × 363 um | Fisher Scientific | Cat# 50-110-8623 | |
| Other | Neon Transfection System | Thermo Fisher Scientific | Cat# MPK5000 | |
| Other | Luminex FLEXMAP 3D System | Invitrogen | Cat# APX1342 | |
| Other | 4–20% Mini-PROTEAN TGX Precast Gel | Bio-Rad | Cat# 4561096 | |
| Other | Amersham Protran Western Blotting Membranes, Nitrocellulose | Cytiva | Cat# GE10600001 | |
| Other | C1000 Touch Thermal Cycler Chassis | Bio-Rad | Cat# 1841100 | |
| Other | CFX96 Optical Reaction Module for Real-Time PCR System | Bio-Rad | Cat# 1845097 | |
| Other | ChemiDoc Imaging System | Bio-Rad | Cat# 17001401 | |
| Other | Thick-wall Polycarbonate Tubes, 13 × 51 mm | Beckman-Coulter | Cat# 349622 | |
| Other | Novex TBE-Urea Gels 15%, 12 well | Invitrogen | Cat# EC68852BOX | |
| Other | Costar Spin-X Centrifuge Tube Filters | Corning | Cat# CLS8162 | |
| Other | Novex TBE Gels, 8%, 15 well | Invitrogen | Cat# EC62155BOX | |
| Other | GloMax Explorer Multimode Microplate Reader | Promega | Cat# GM3500 | |
| Other | Orbitrap Exploris 480 Mass Spectrometer | Thermo Scientific | Cat# BRE725533 |
Additional files
Download links
A two-part list of links to download the article, or parts of the article, in various formats.
Downloads (link to download the article as PDF)
Open citations (links to open the citations from this article in various online reference manager services)
Cite this article (links to download the citations from this article in formats compatible with various reference manager tools)
Ribosome subunit attrition and activation of the p53–MDM4 axis dominate the response of MLL-rearranged cancer cells to WDR5 WIN site inhibition
eLife 12:RP90683.
https://doi.org/10.7554/eLife.90683.3


