Translational regulation enhances distinction of cell types in the nervous system
- Frontier Research Institute for Interdisciplinary Sciences, Tohoku University, Japan
- Graduate School of Life Sciences, Tohoku University, Japan
- Faculty of Advanced Engineering, Tokyo University of Sciences, Japan
- RNA Systems Biochemistry Laboratory, RIKEN Cluster for Pioneering Research, Wako, Japan
- Department of Computational Biology and Medical Sciences, Graduate School of Frontier Sciences, The University of Tokyo, Japan
Figures
Figure 1
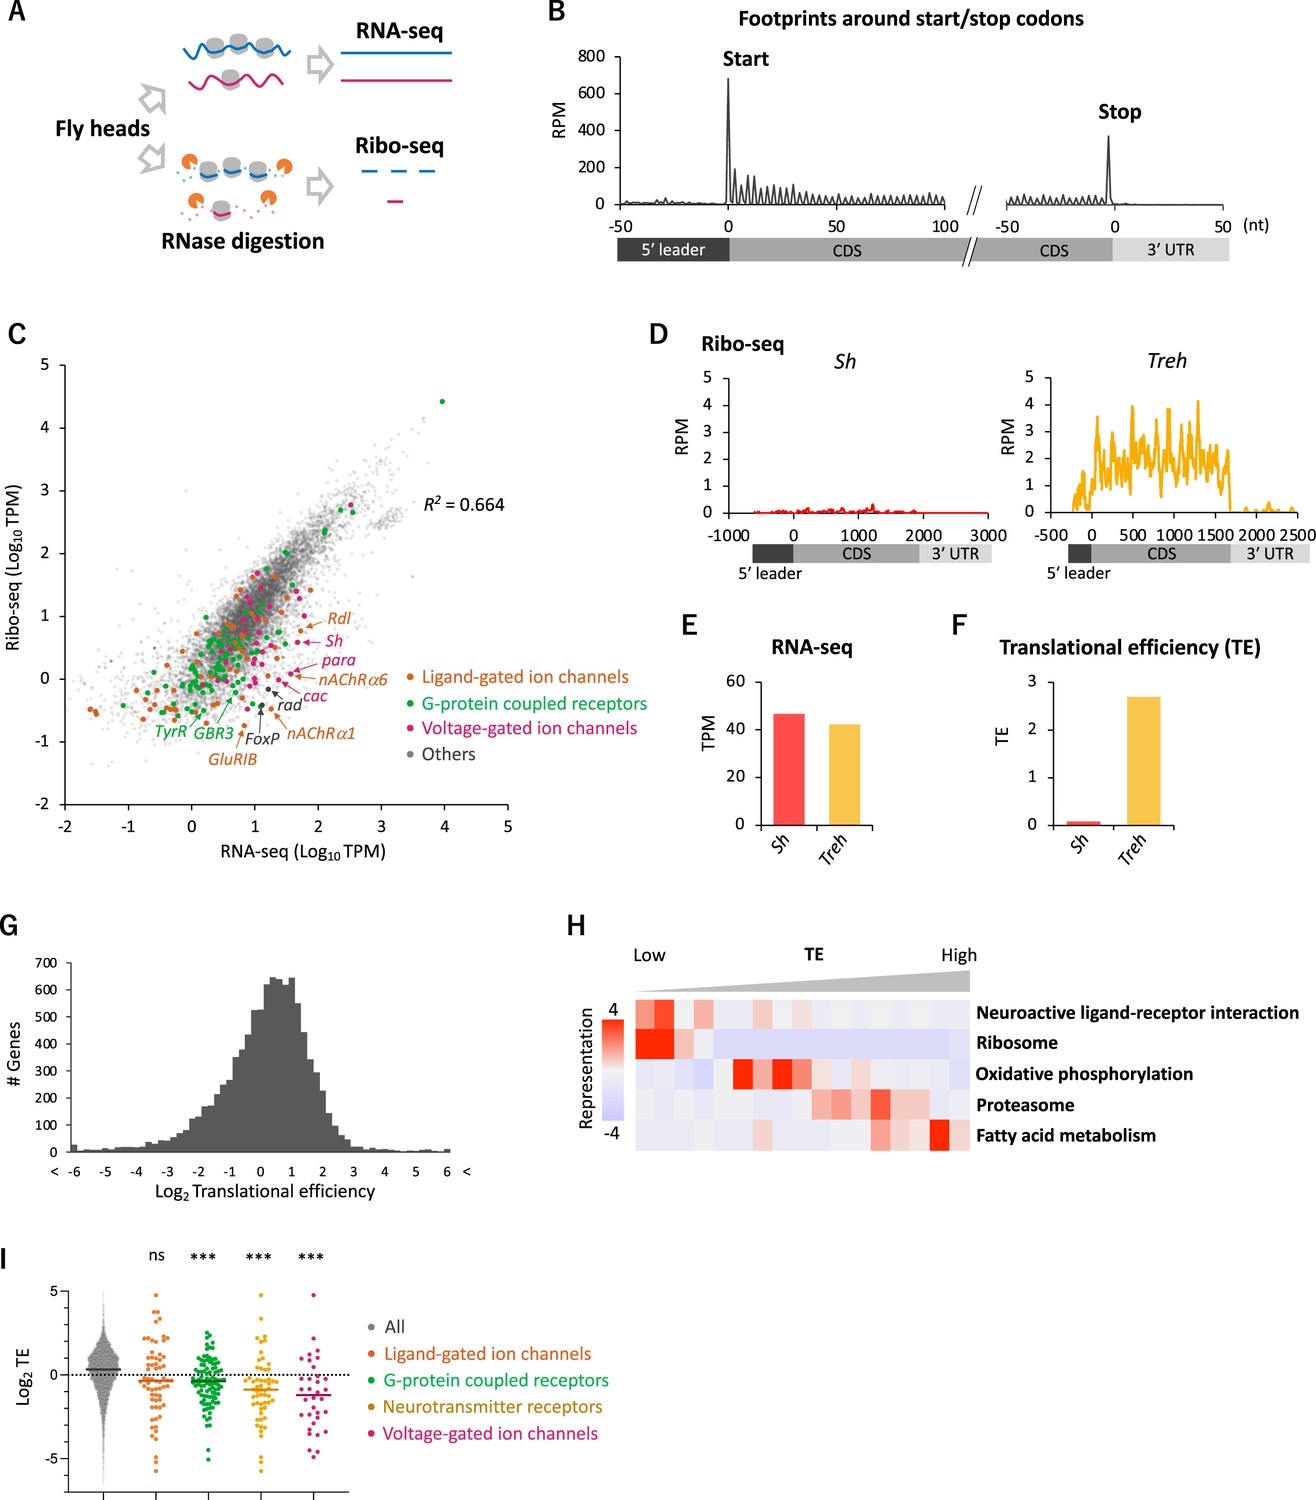
Comparative transcriptome-translatome analyses in the Drosophila head.
(A) Schematics. Fly head lysate is digested with RNase I for Ribo-seq, while not for RNA-seq. Resultant short fragments or the whole mRNA are reverse-transcribed and sequenced. (B) Meta-genome ribosome distribution (estimated P-sites of the 21-nt fragments), relative to the annotated start and stop codons. RPM: reads per million. (C) Scatter plots of mRNA reads (x-axis, TPM: transcripts per million) and ribosome footprints on coding sequences (CDS) (y-axis, TPM). Several neuron-related genes are highlighted with colors and arrows. The squared Pearson’s correlation coefficient (R2) is indicated. (D–F) Ribosome footprints (D), mRNA level (E), and translational efficiency (TE) (F) of Shaker-RB (Sh) and Trehalase-RA (Treh). TE is calculated as ribosome footprints on CDS (TPM) divided by the mRNA level (TPM). (G) Histogram of TE. The bin size is 0.2 in the unit of log 2. In total, 9611 genes with at least one read in both Ribo-seq and RNA-seq are plotted. (H) Kyoto Encyclopedia of Genes and Genomes (KEGG) pathways enrichment analysis, visualized by iPAGE (Goodarzi et al., 2009), based on TE. The 9611 genes are ranked and binned according to TE (left to right: low to high), and over- and under- representation is tested. The presented KEGG pathways show p-values less than 0.0005. (I) TE of transcripts in the denoted Gene Ontology terms. Bars represent the median. ns: p>0.05; ***p<0.001; in the Dunn’s multiple-comparisons test, compared to the ‘all’ group.
Figure 2 with 4 supplements
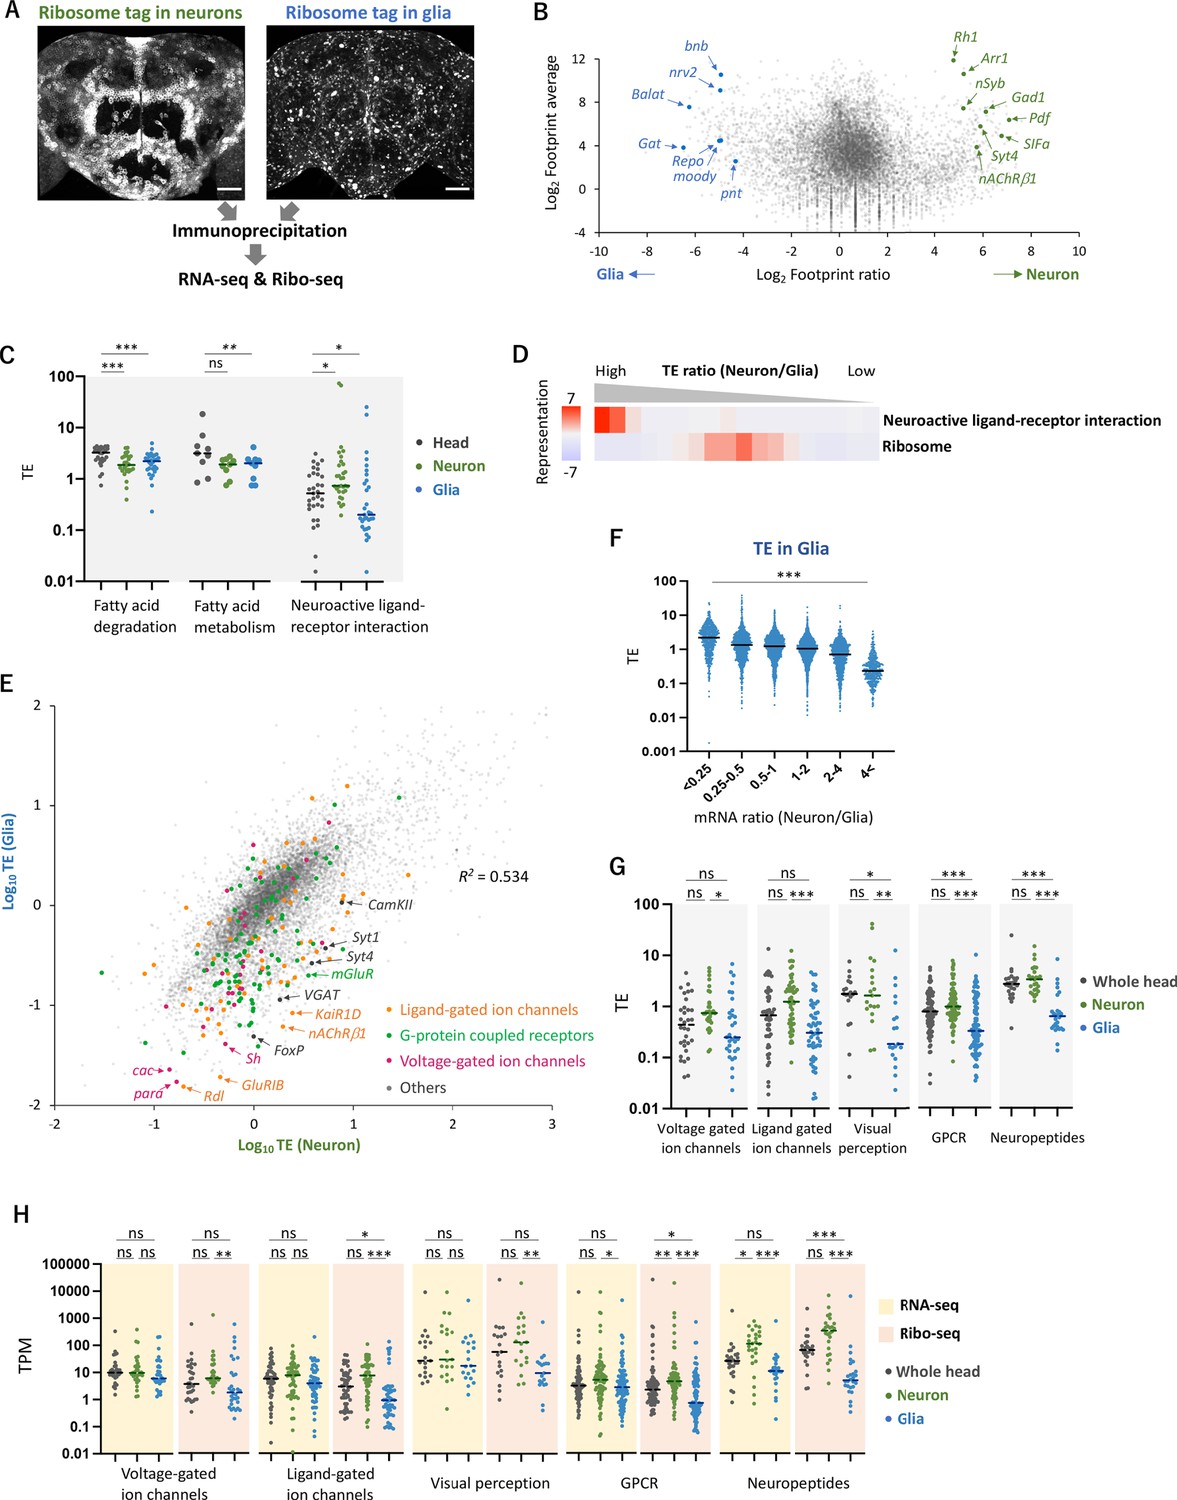
Cell-type-specific Ribo-seq and RNA-seq reveal differential translational regulations.
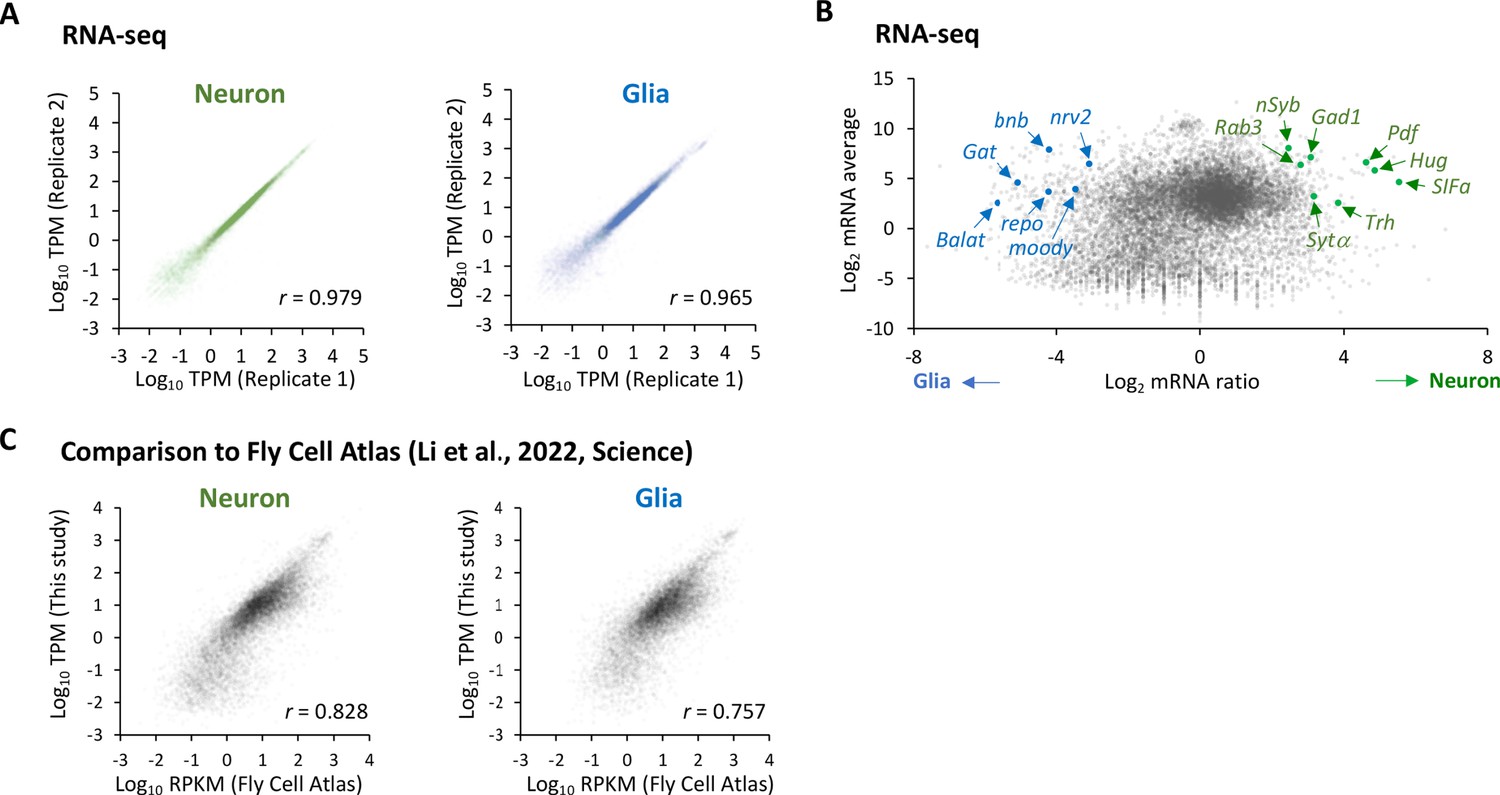
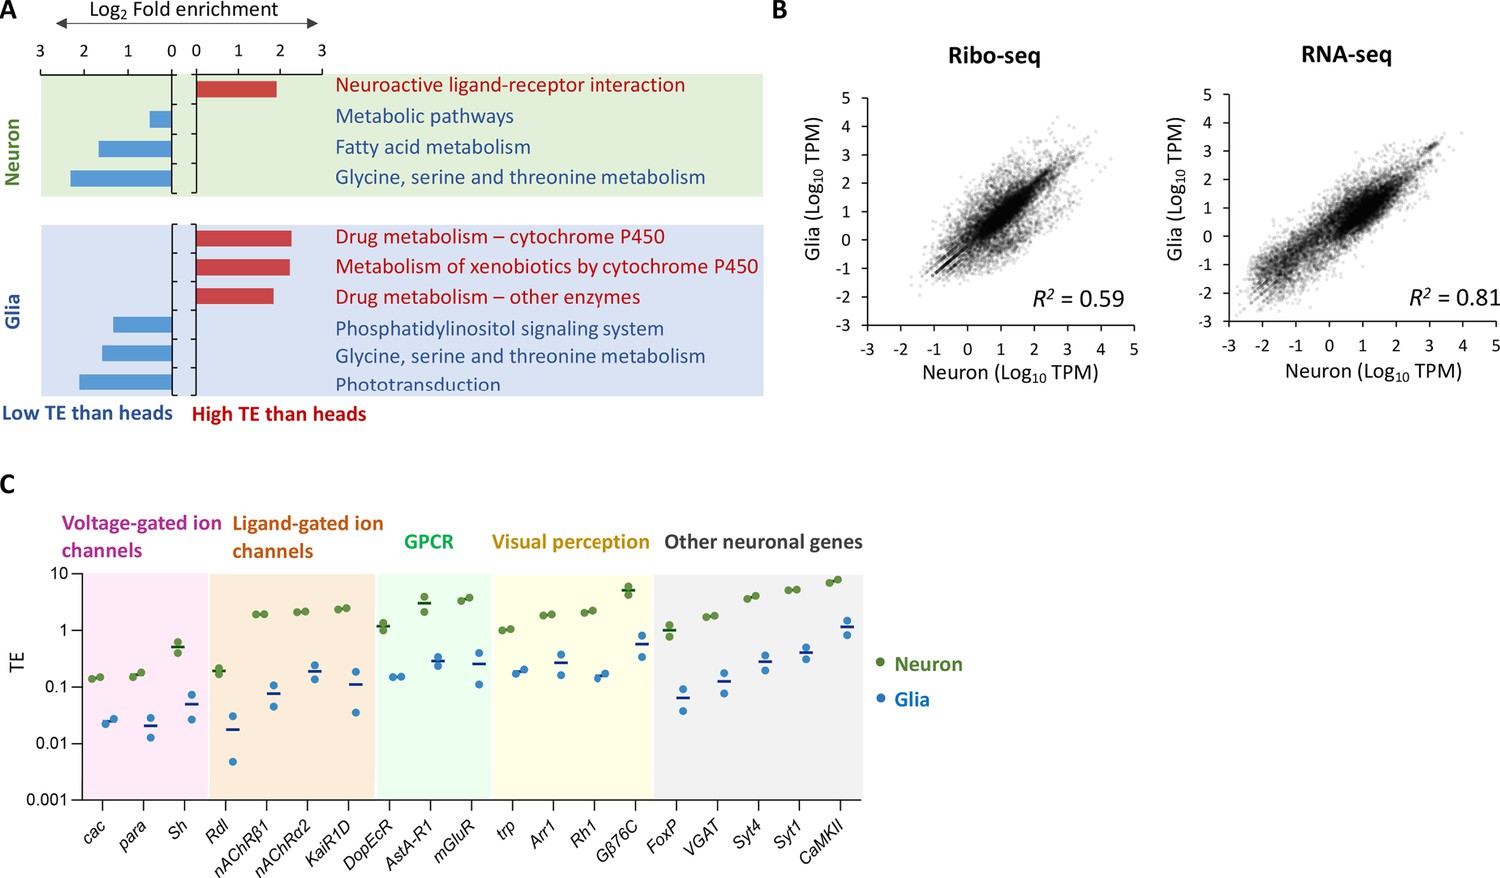
(A) Schematics. FLAG-tagged ribosome protein L3 (RpL3::FLAG) is expressed in neurons (nSyb-GAL4) or in glial cells (repo-GAL4). RNA-seq and Ribo-seq are performed following immunoprecipitation. Whole brain images of the exogenously expressed RpL3::FLAG are shown. Scale bars: 50 µm. (B) The MA plot of ribosome footprints on coding sequences (CDS) among neurons and glia. Each gene is plotted according to the fold change (x-axis) and the average (y-axis) in the unit of log2. Several marker genes are highlighted with green (neuron) or blue (glia). (C) Translational efficiency (TE) of genes in the denoted Kyoto Encyclopedia of Genes and Genomes (KEGG) pathways in the whole head (black), neurons (green), or in glia (blue). Genes with transcripts per million (TPM) > 1 in the RNA-seq dataset are plotted. Bars represent the median. *p<0.05, **p<0.01, ***p<0.001, Dunn’s multiple-comparisons test. (D) KEGG pathway enrichment analysis based on the ratio of TE in neurons to in glia. All genes with at least one read in both cell types (total 9732 genes) are ranked and binned according to the neuron-to-glia ratio (left to right: high to low), and over- and under-representation is tested. The presented KEGG pathways show p-values less than 0.0005. (E) Scatter plot of TE in neurons (x-axis) and in glia (y-axis). The squared Pearson’s correlation coefficient (R2) is indicated. (F) TE in glia plotted according to the ratio of mRNA expression in neurons compared to glia. ***p<0.001, Kruskal–Wallis test. All the 7933 genes showing TPM > 1 in RNA-seq are analyzed. (G) TE of transcripts, showing at least one read, in the indicated Gene Ontology (GO) terms. Bars represent the median. **p<0.01, ***p<0.001, Dunn’s multiple-comparisons test. (H) Read counts of genes (TPM) in the indicated GO terms in RNA-seq (yellow) and in Ribo-seq (pink). The gray, green, and blue dots indicate the read counts in the whole head, neurons, and glial cells, respectively. ns: p>0.05, **p<0.01, ***p<0.001, Dunn’s multiple-comparisons test.
Figure 2—figure supplement 1
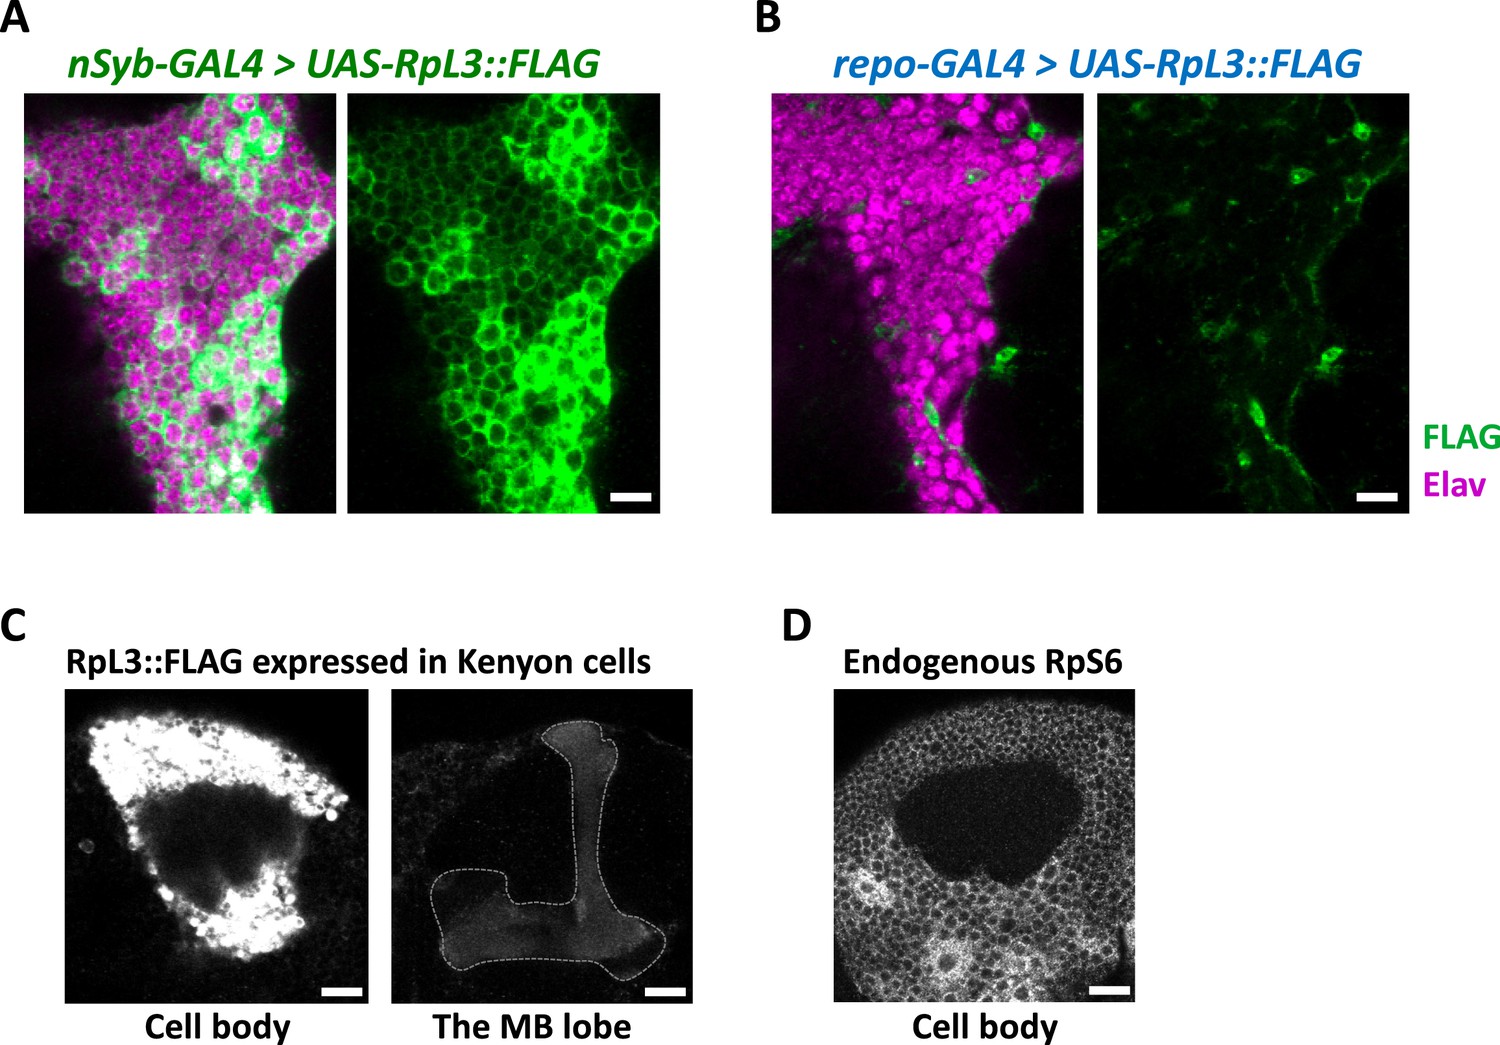
Cell-type-specific ribosome profiling.
(A, B) Immunohistochemical signal of the FLAG-tagged RpL3 protein (green) and the neuronal marker elav protein (magenta) of the indicated genotypes. Sliced confocal images of the cortical regions adjacent to the antennal lobe are shown. Scale bars: 10 µm. (C) Immunohistochemical signal of the FLAG-tagged RpL3 protein in Kenyon cells, driven by MB010B. The mushroom body lobe is outlined by the dotted line. Scale bars: 20 µm. (D) Immunohistochemical signal of the endogenous RpS6 protein in the wild-type brain. Cortical region of the posterior side containing Kenyon cells are shown. Scale bar: 20 µm.
Figure 2—figure supplement 2
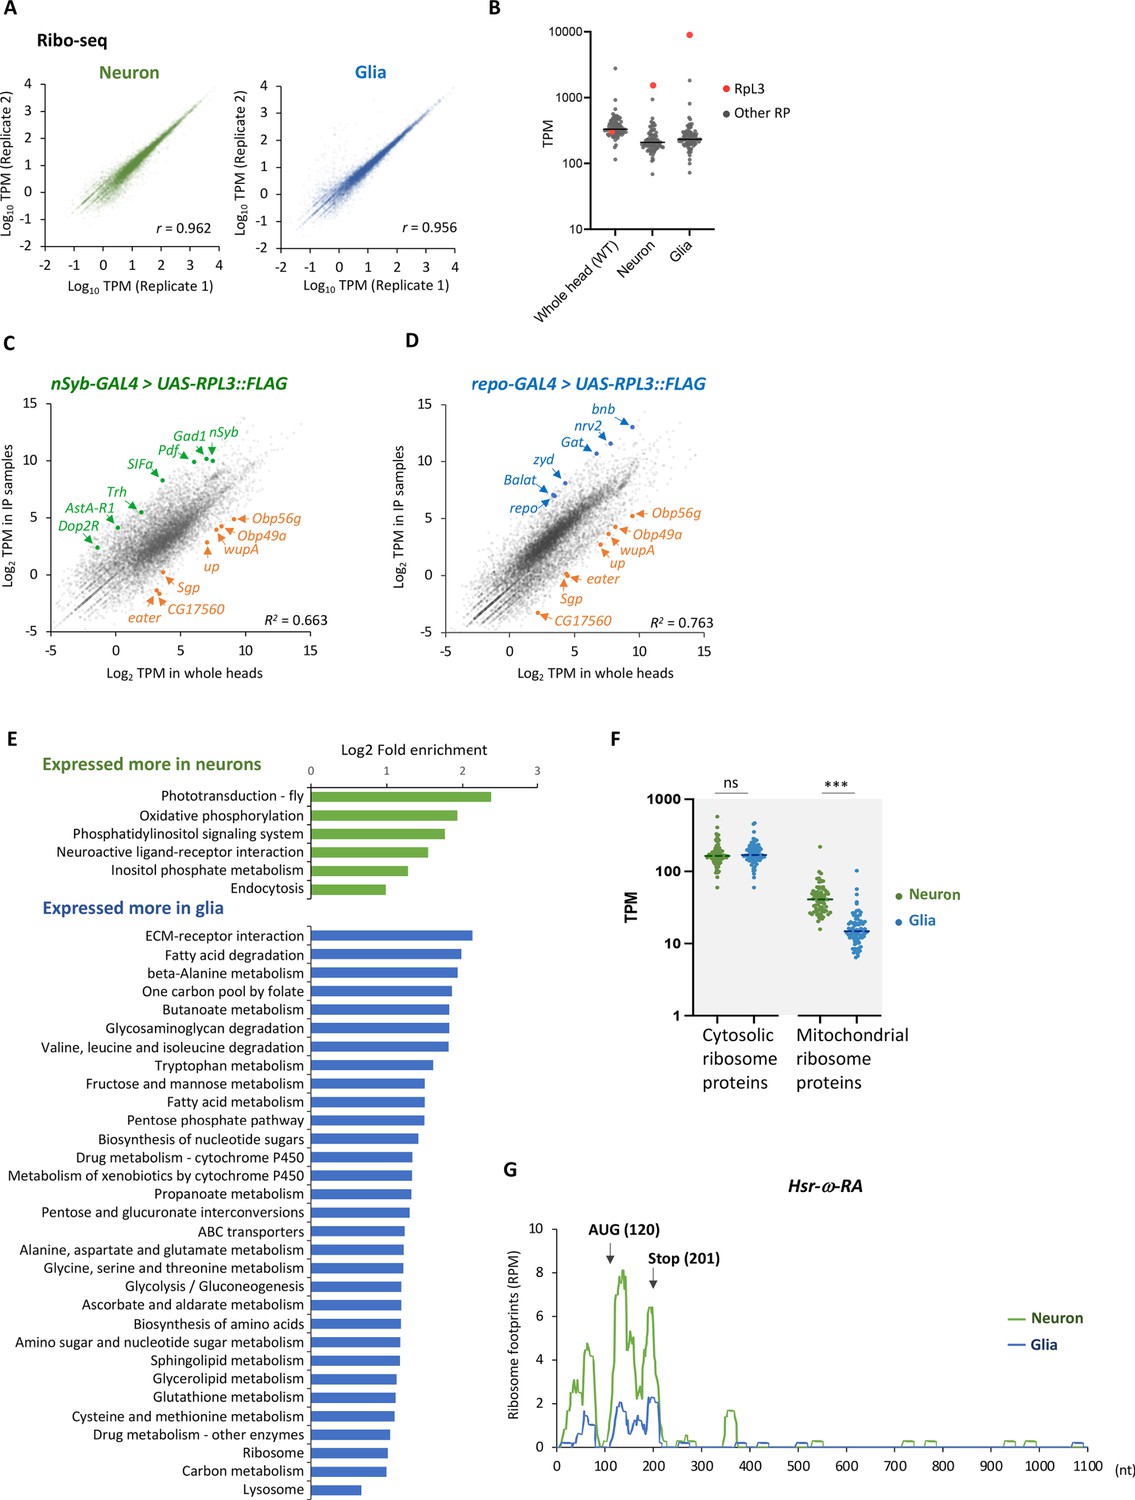
Cell-type-specific ribosome profiling.
(A) Correlation plots among the biological replicates in the cell-type-specific ribo-seq (transcripts per million [TPM]). The squared Pearson’s correlation coefficient (R2) is indicated. (B) Reads on the cytosolic ribosome proteins in the whole head sample (wild type), neurons, or the glial cells. The red and gray points represent the TPM of RpL3 and the other ribosome proteins, respectively. Note that RpL3::FLAG is overexpressed in the neuron and the glia samples so that the reads are from both the endogenous and exogenous RpL3. (C, D) Ribosome footprints in immunoprecipitated (y-axis) and the whole head (x-axis) samples from the indicated genotypes are plotted (TPM). Enrichment of neuronal (green) or glial (blue) marker genes and depletion of markers for other cell types (orange), including muscles (wupA and up), fat bodies (Sgp and CG17560), hemocytes (eater), and auxiliary cells (Obp56g and Obp49a), are highlighted. The squared Pearson’s correlation coefficient (R2) is indicated. (E) Kyoto Encyclopedia of Genes and Genomes (KEGG) pathways enrichment analysis on differentially expressed genes among neuronal and glial cells. 1853 or 1657 genes are expressed significantly more in neurons or in glia, respectively (DEseq, FDR < 0.05), and the enrichment is tested using Database for Annotation, Visualization, and Discovery (DAVID) (Dennis et al., 2003). KEGG pathways showing p-values less than 0.005 are shown. (F) Ribosome footprints (TPM) on coding sequences (CDS) of cytosolic or mitochondrial ribosome proteins in neurons or in glia. ns: p>0.05, ***p<0.001, Mann–Whitney test of ranks. (G) Ribosome footprints on Hsr-ω-RA (CR31400) in neurons (green) or in glia (blue). A putative open-reading frame (ORF), consisting of 81 bases, is indicated with arrows.
Figure 2—figure supplement 3
Cell-type-specific RNA-seq.
(A) Correlation plots among the biological replicates in the cell-type-specific RNA-seq. The squared Pearson’s correlation coefficient (r) is indicated. (B) The MA plot of RNA-seq from neurons and glia. Each transcript is plotted based on the fold change (x-axis) and the average (y-axis) in the unit of log2. Several marker genes are highlighted with green (neuron) or blue (glia).
Figure 2—figure supplement 4
Translational efficiency in neurons, glial cells, and the whole heads.
(A) Fold enrichment of genes that are translationally enhanced or suppressed in neurons (top) or in glia (bottom) compared to the whole heads. Genes with transcripts per million (TPM) > 1 in RNA-seq are categorized as translationally enhanced if their translational efficiency (TE) in neurons or in glia is more than twice the TE in the whole head, or as suppressed if their TE in neurons or in glia is less than half of that in the whole head. Kyoto Encyclopedia of Genes and Genomes (KEGG) enrichment analysis is performed using Database for Annotation, Visualization, and Discovery (DAVID) (Dennis et al., 2003). KEGG pathways with p<0.005 are shown. (B) Correlation plot among neurons (x-axis) and glia (y-axis), with the RNA-seq read counts (left, TPM) and the ribo-seq read counts on coding sequences (CDS) (right, TPM). The squared Pearson’s correlation coefficient (R2) is indicated. (C) Translational efficiency of representative neuronal genes in the indicated Gene Ontology (GO) terms shown in Figure 2G and H (green: neurons; blue: glia). The bars represent the mean of the two biological replicates.
Figure 3 with 2 supplements
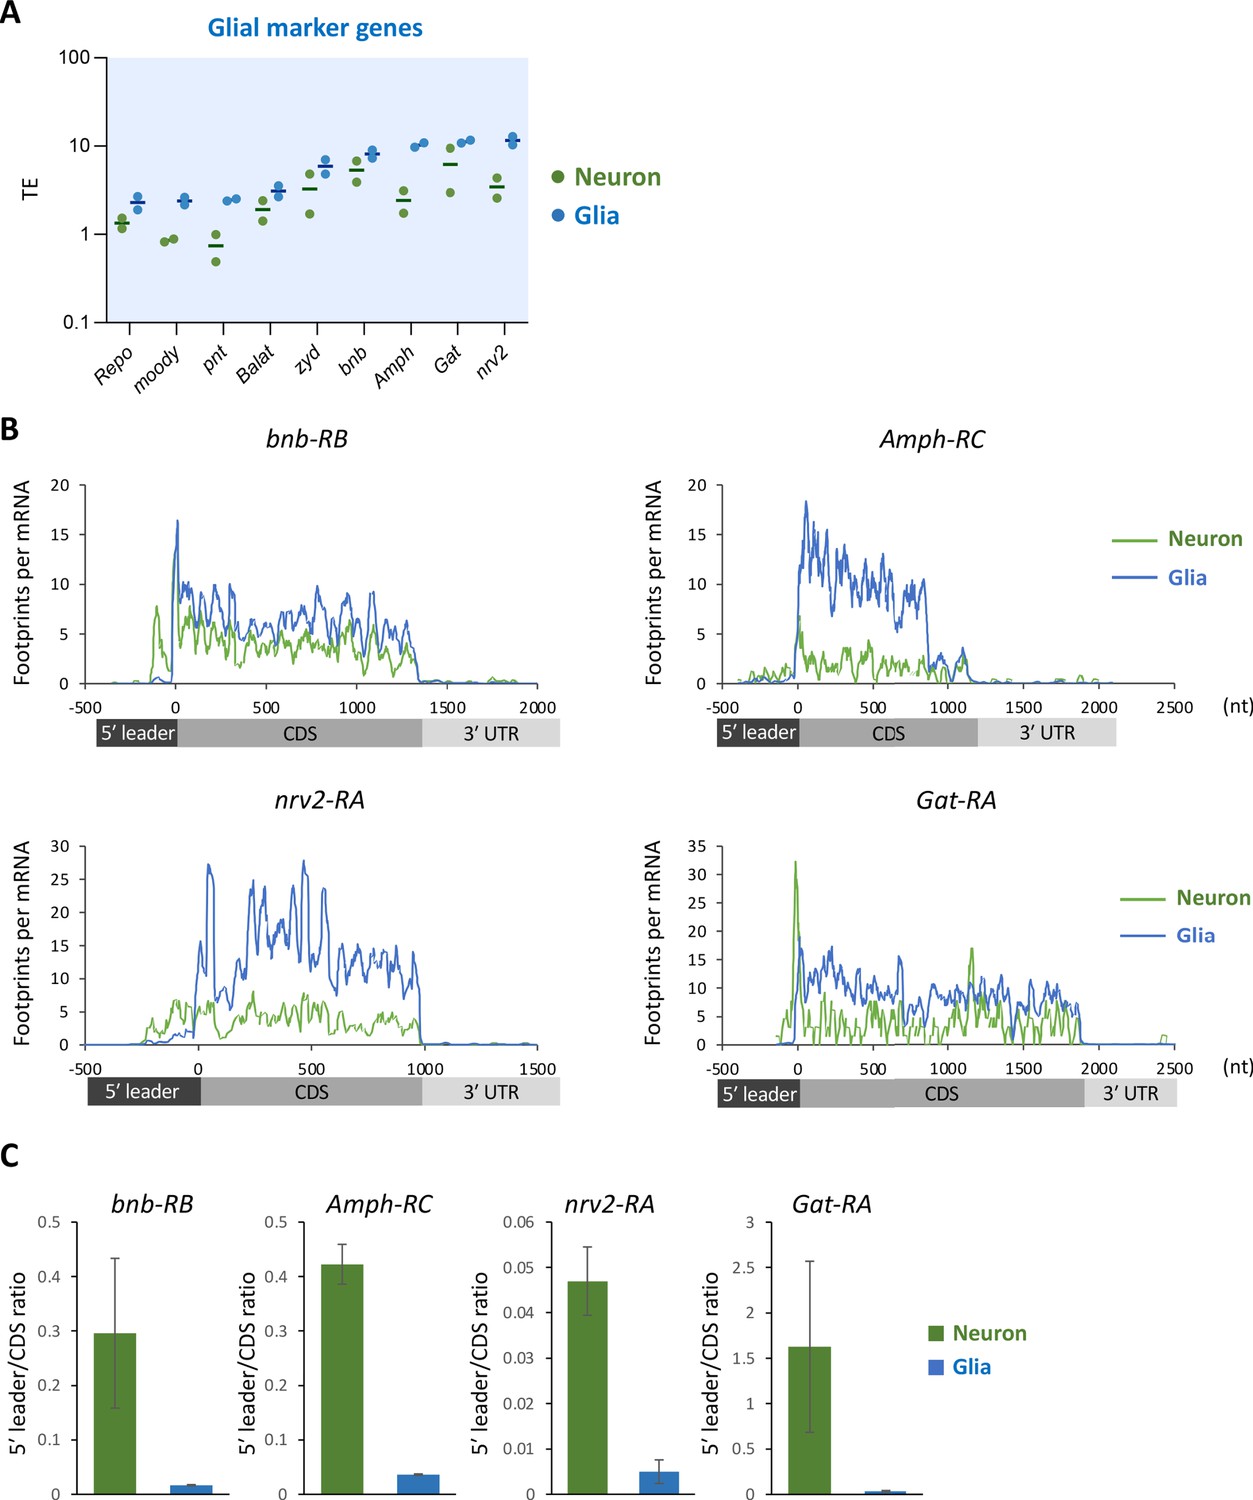
Ribosome stalling on the 5′ leaders of differentially translated transcripts (DTTs) in glia.
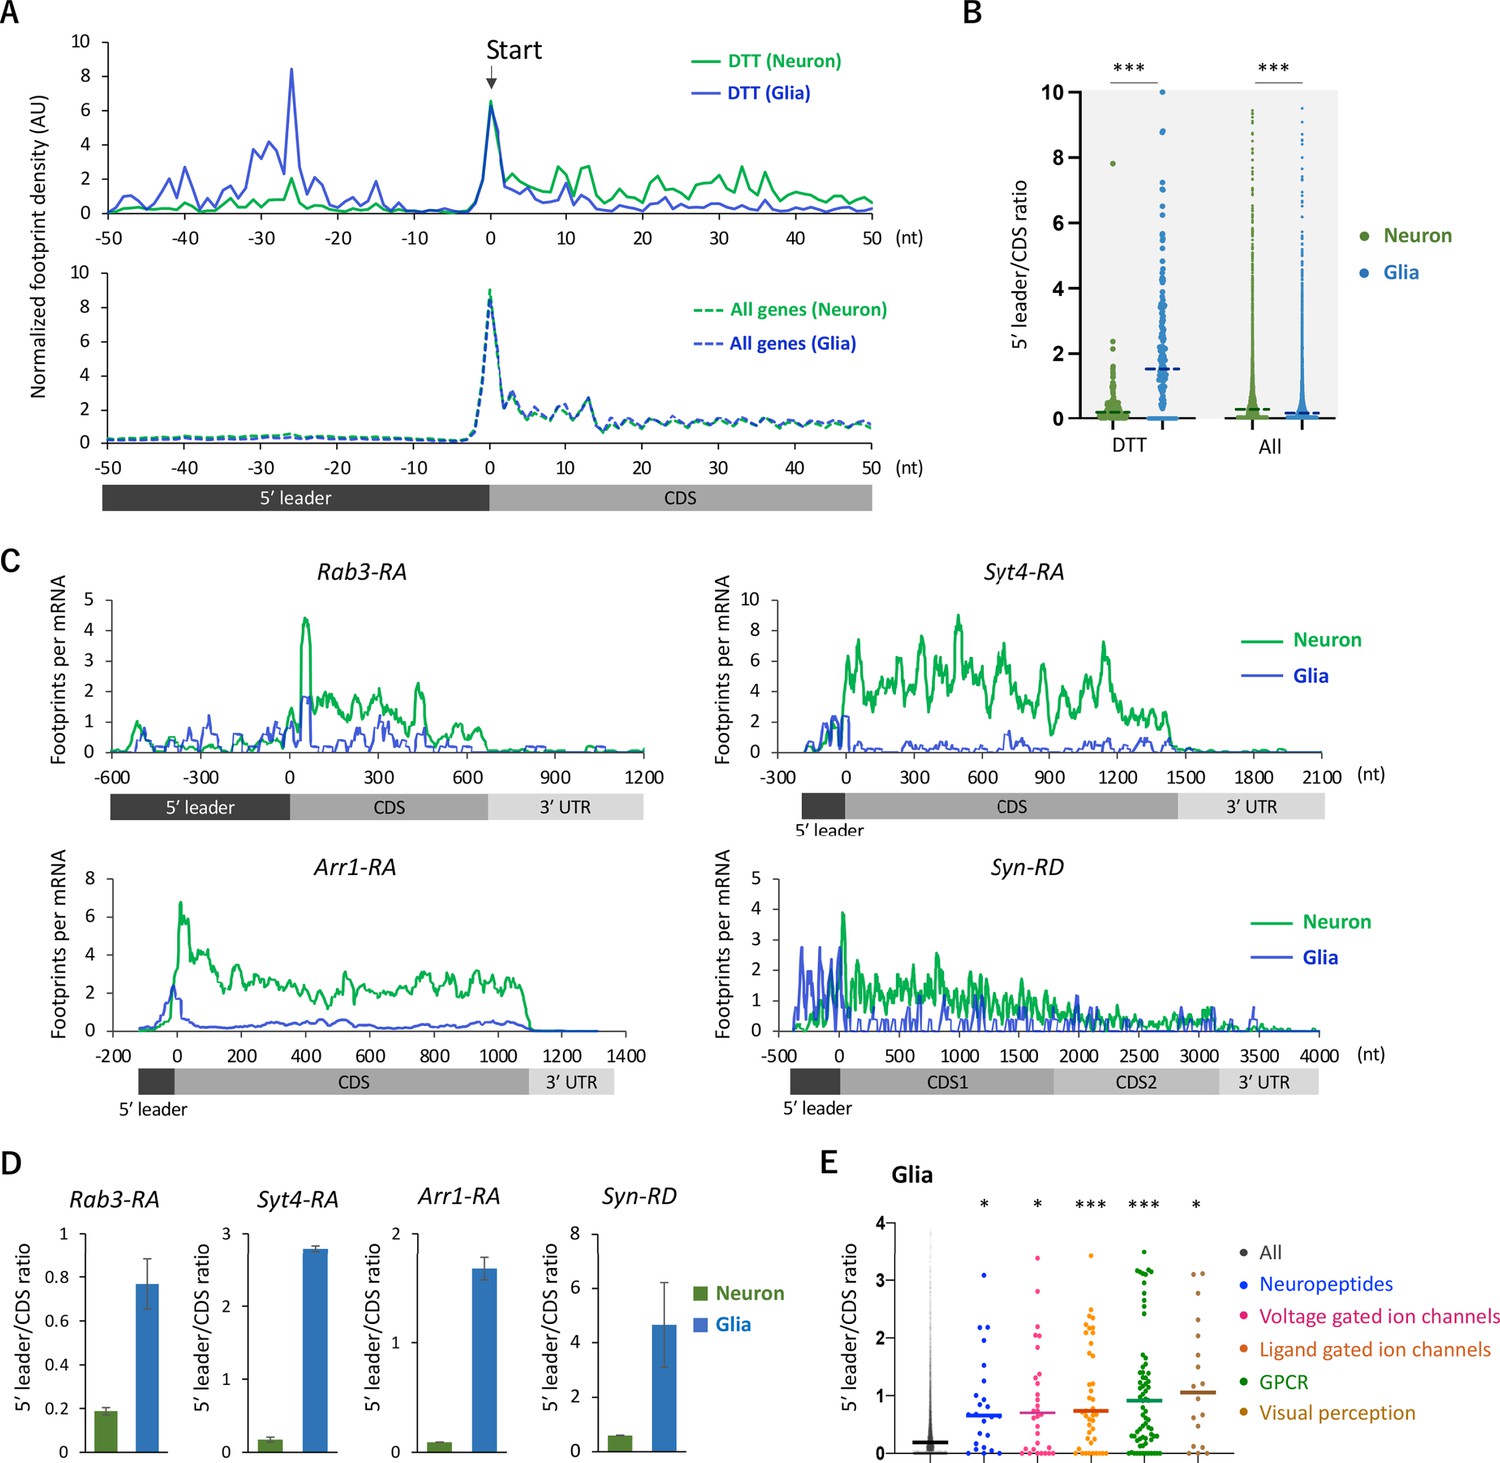
(A) Ribosome distribution (estimated P-sites) on the 161 DTTs around the start codons (solid lines; start ±50 nt). These DTTs are defined as transcripts showing more than 10 times higher translational efficiency (TE) in neurons compared to glia. The dotted lines in the bottom graph indicate the genome-wide distribution. All the transcripts showing transcripts per million (TPM) > 1 in RNA-seq both in neurons and glia are considered (7933 genes in total), and the height is normalized by the total reads on this region. (B) Ratio of ribosome density on 5′ leader (TPM) to coding sequences (CDS) (TPM) of the 161 DTTs or of all transcripts in neurons (green) or in glia (blue). The bars represent the median. ***p<0.001, Mann–Whitney test of ranks. (C) Distribution of ribosome footprints on the representative neuronal transcripts. Ribosome footprints (reads per million [RPM]) normalized by the mRNA level (TPM) are shown. Note that Syn-RD harbors a stop codon in the CDS but a fraction of ribosomes skip it, generating two annotated open-reading frames (ORFs) (CDS1 and CDS2) (Klagges et al., 1996). (D) Ratio of ribosome density on 5′ leader to CDS (mean ± standard error of mean of the biological replicates). (E) Ratio of ribosome density on 5′ leader to CDS on transcripts in the indicated Gene Ontology (GO) terms in glia. *p<0.05, ***p<0.001, Dunn’s multiple-comparisons test compared to the ‘all’ group.
Figure 3—figure supplement 1
Ribosome stall at the initiation codons in neurons.
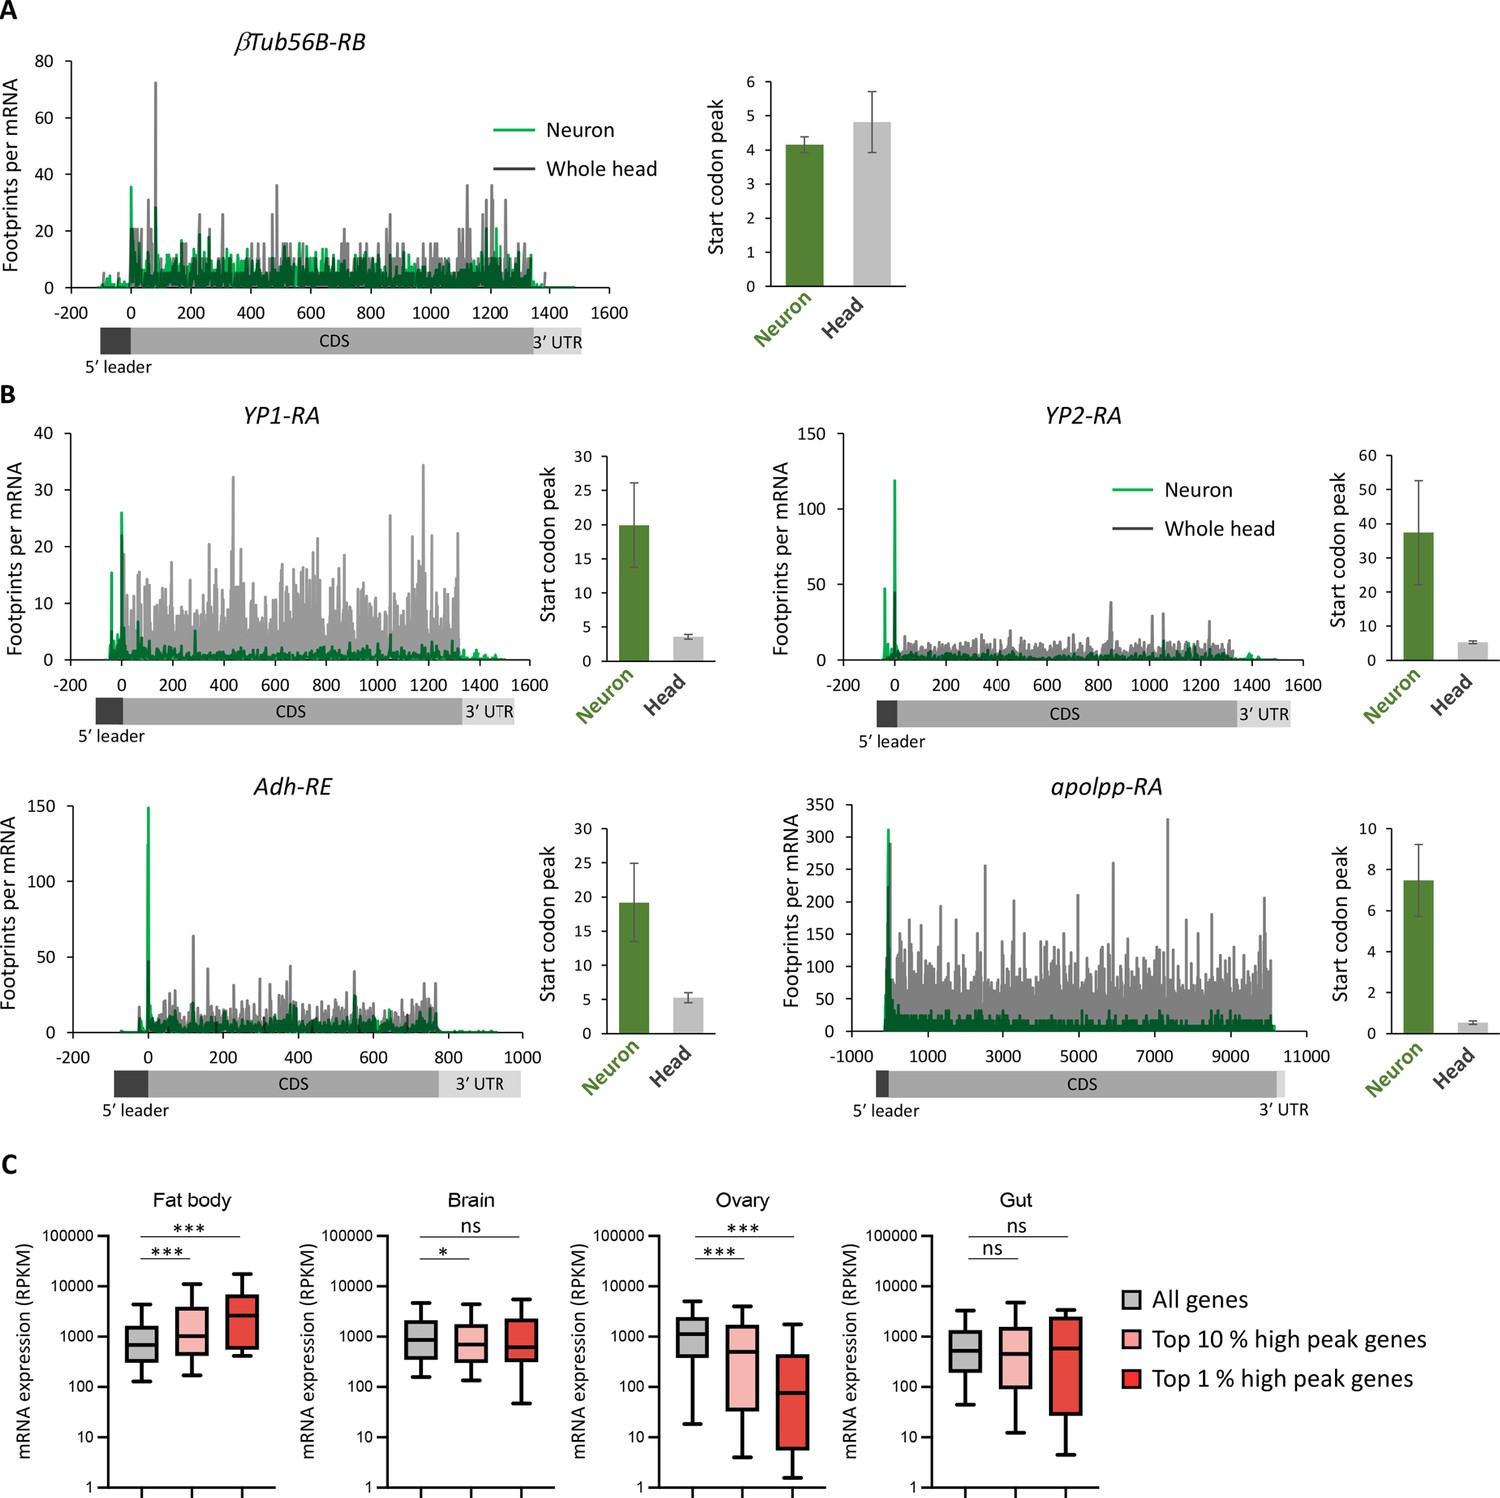
(A, B) Ribosome distribution (P-sites, reads per million [RPM]), normalized by the mRNA level (transcripts per million [TPM]), on a house keeping gene, β-tubulin at 56D (A) or genes highly expressed in fat bodies (B) (Dobson et al., 2018). Green and gray lines indicate the distribution in neurons and the whole head, respectively. Start codon peak, calculated as footprints around the start codon (TPM, ±2 bases) normalized by the TPM in the whole coding sequence, is plotted. Bars and error bars: mean and standard error of mean. (C) All genes showing TPM > 5 (Ribo-seq, coding sequences CDS) are grouped according to the rank of start codon peak in neurons (top 10% and 1%). mRNA level in the indicated tissues, measured in Dobson et al., 2018, is plotted (box and whiskers represent 25–75 and 5–95 percentile, respectively). ns:>0.05, *<0.05, ***<0.001, Dunn’s multiple-comparisons test.
Figure 3—figure supplement 2
Translational suppression of glial marker genes in neurons.
(A) Translational efficiency (TE) of the major glial marker genes in neurons (green) or in glia (blue). The bars represent the mean of the two biological replicates. (B) Ribosome distribution (P-sites, reads per million [RPM]), normalized by the mRNA level (transcripts per million [TPM]). Green and gray lines indicate the distribution in neurons and the whole head, respectively. Green and blue lines indicate the distribution in neuronal and glial cells, respectively. (C) Ratio of ribosome density on 5′ leader to coding sequences (CDS) (mean ± standard error of mean of the biological replicates).
Figure 4 with 1 supplement
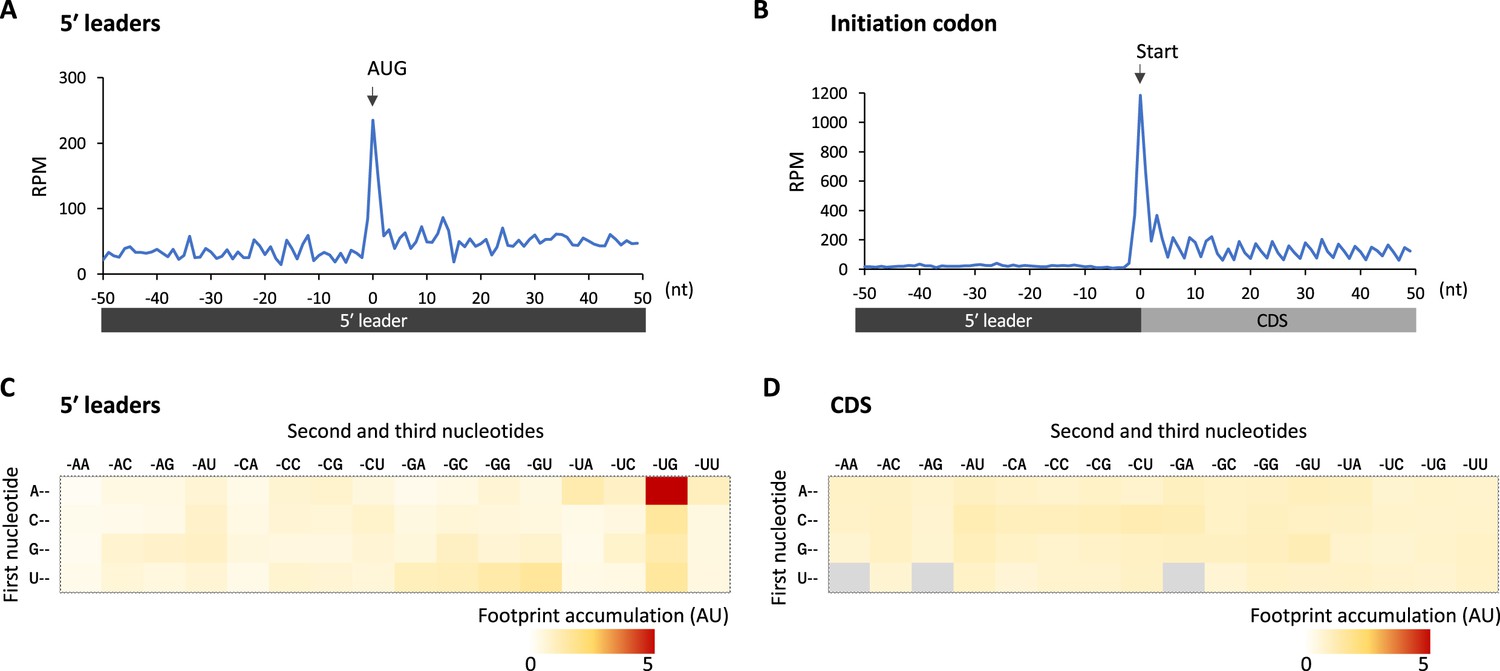
Footprint accumulation on upstream AUG in glia.
(A) Meta-genome ribosome distribution (estimated P-sites of the 32-nt fragments) around the upstream AUG codons in glia. (B) Meta-genome ribosome distribution (estimated P-sites of the 32-nt fragments) around the annotated start codons in glia. (C) Footprint accumulation on 5′ leader in glia, defined as the number of ribosome footprints (estimated P-sites) on each codon normalized by the average on the surrounding (–50 to +50) regions. (D) Footprint accumulation inside the annotated coding sequences (CDS) in glia. Annotated in-frame codons except the start and the stop codons are considered. AU: arbitrary unit.
Figure 4—figure supplement 1
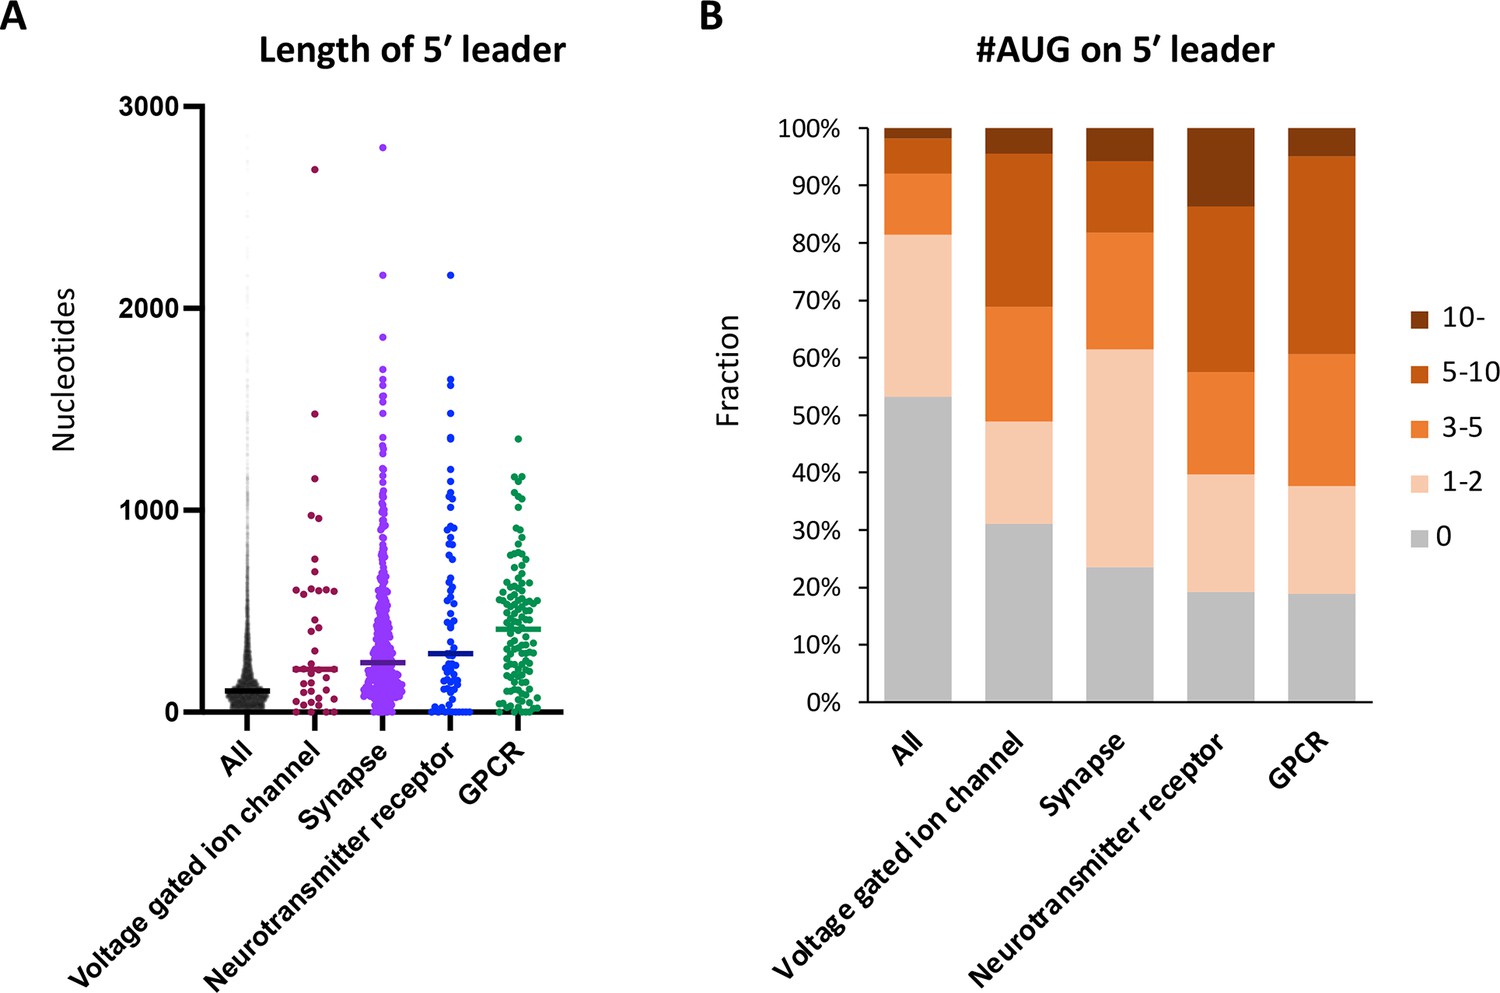
Neuronal transcripts harbor long 5′ UTR containing numerous upstream open-reading frames (uORFs).
(A) Length of 5′ UTR of the transcripts in the indicated Gene Ontology (GO) terms. The bars represent the median length. (B) Proportion of transcripts in the indicated GO terms, based on the number of upstream AUG codons in their 5′ UTR.
Figure 5 with 1 supplement
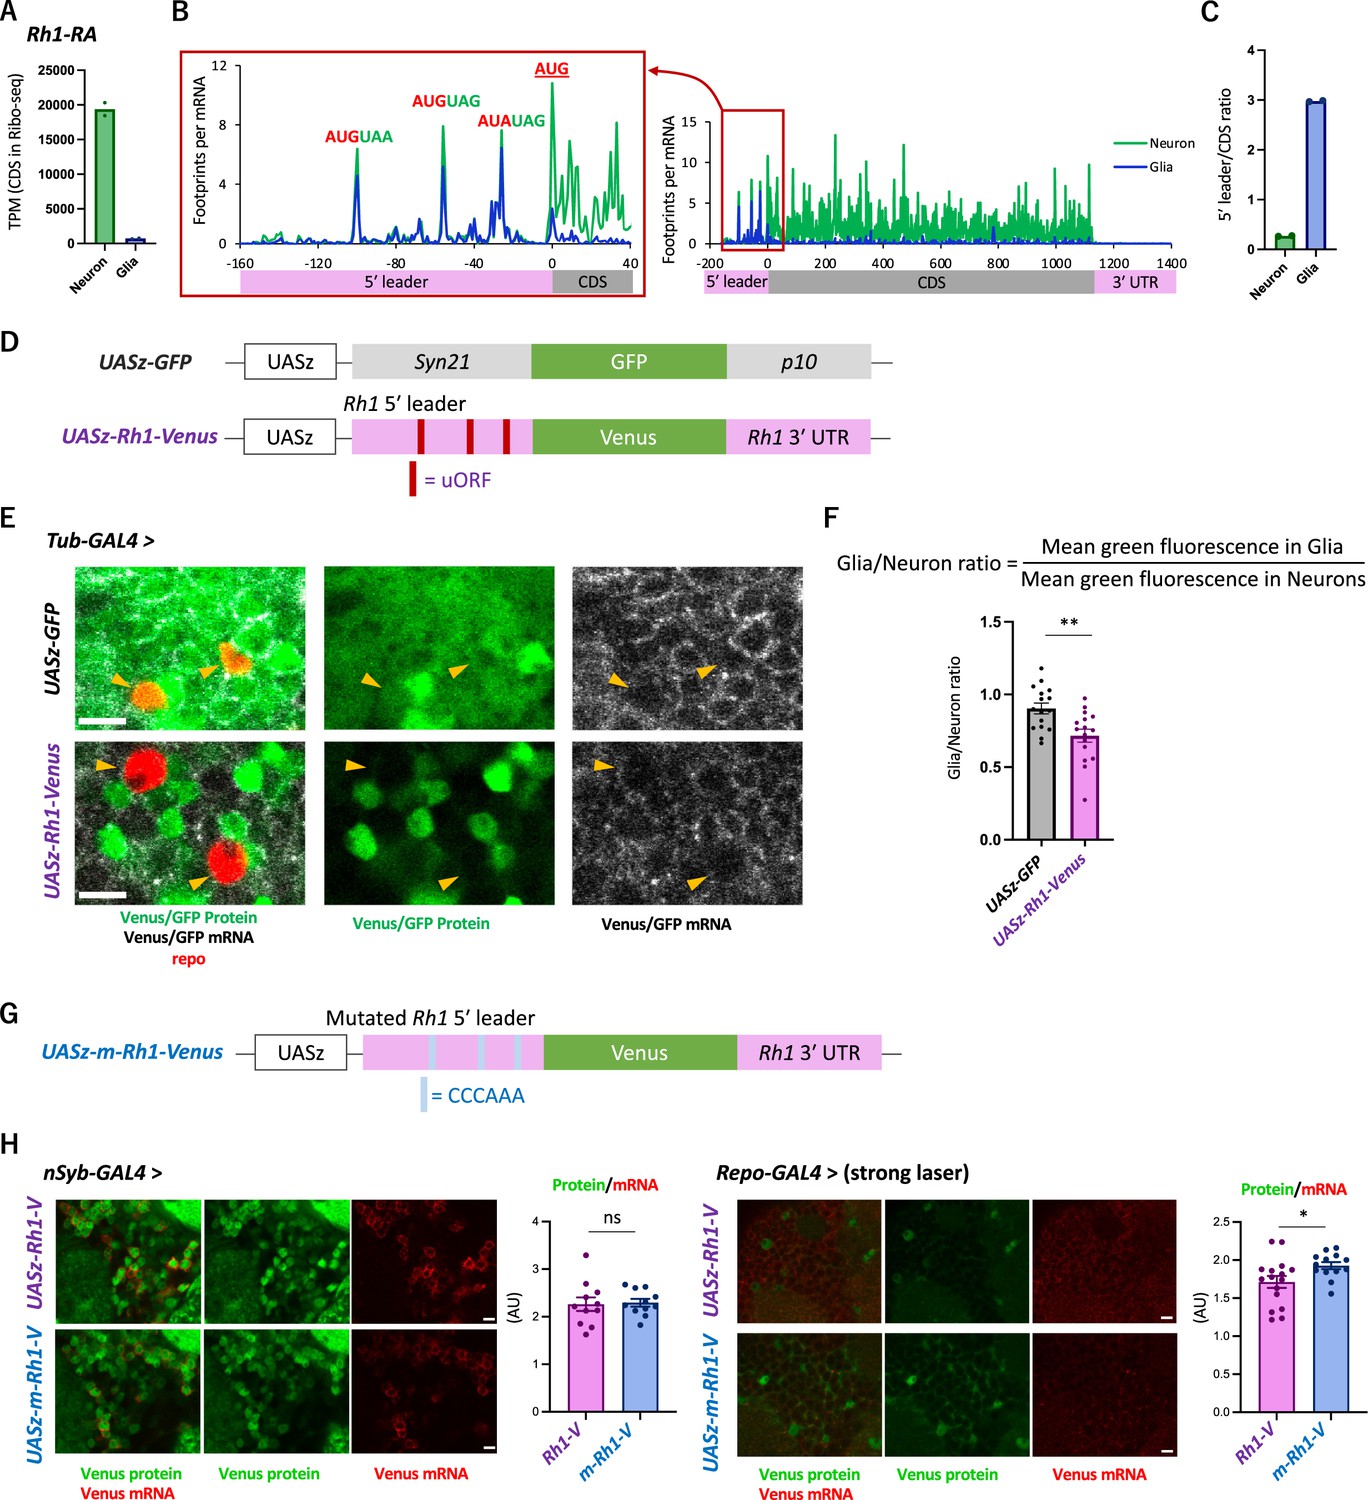
The transgenic Rh1-Venus reporter reveals differential translation in neuronal and glial cells.
(A) Reads on coding sequences (CDS) of Rh1-RA in Ribo-seq. (B) Ribosome distribution (estimated P-sites) on Rh1-RA in neurons (green) and in glia (blue), with 0 on the x-axis indicating the start codon of the CDS. Six-base upstream open-reading frames (ORFs), consisting of consecutive start (or the near-cognate) and stop codons, are highlighted. Note that footprints are normalized by the mRNA level (transcripts per million [TPM]). (C) Ratio of ribosome density on 5′ leader (TPM) to CDS (TPM) in neurons (green) or in glia (blue). The bars and the dots represent the median and individual data points, respectively. (D) Schematics of the control (UASz-GFP) or the Rh1 (UASz-Rh1-Venus) reporter. For the Rh1 reporter, 5′ leader and 3′ UTR sequences of Rh1-RA are fused to CDS of the Venus fluorescent protein. For the control reporter, synthetic 5′ leader sequences (syn21) and viral p10 terminator are fused to GFP (DeLuca and Spradling, 2018). Note that both reporters contain the same promoter (UASz) (DeLuca and Spradling, 2018) and are inserted onto the identical genomic locus (attP40). (E) Expression of the Rh1- or the control reporters driven by Tubulin-GAL4. Sliced confocal images of the cortical regions next to the antennal lobe are shown. Green: EGFP or Venus fluorescent signal. Red: immunohistochemical signal of repo protein as a glial marker. Gray: EGFP or Venus mRNA. Orange arrowheads indicate glial cells marked by the repo expression. Scale bars: 5 µm. (F) Quantification of the green fluorescent intensity in glial nuclei, normalized by the fluorescence in neurons. Glial intensity was measured as mean intensity in the repo-positive pixels, and was normalized by the mean intensity in the repo-negative pixels. **p<0.01, Mann–Whitney test of ranks. (G) Schematics of the mutated Rh1 reporter (m-Rh1). The minimal upstream open-reading frame (uORF) is replaced with CCCAAA. (H) The expression of the Rh1- or m-Rh1- reporters, driven by the nSyb- or the repo- GAL4. Sliced confocal images of the cortical regions next to the antennal lobe are shown. Scale bars: 5 µm. Green: Venus fluorescent signal. Red: Venus mRNA signal. The total protein signal was normalized by the total mRNA signal for each brain. N = 8 (nSub>Rh1), 8 (nSyb>m-Rh1), 16 (repo>Rh1), 13 (repo>m-Rh1). ns: p>0.05, *p<0.05, Mann–Whitney test of ranks.
Figure 5—figure supplement 1
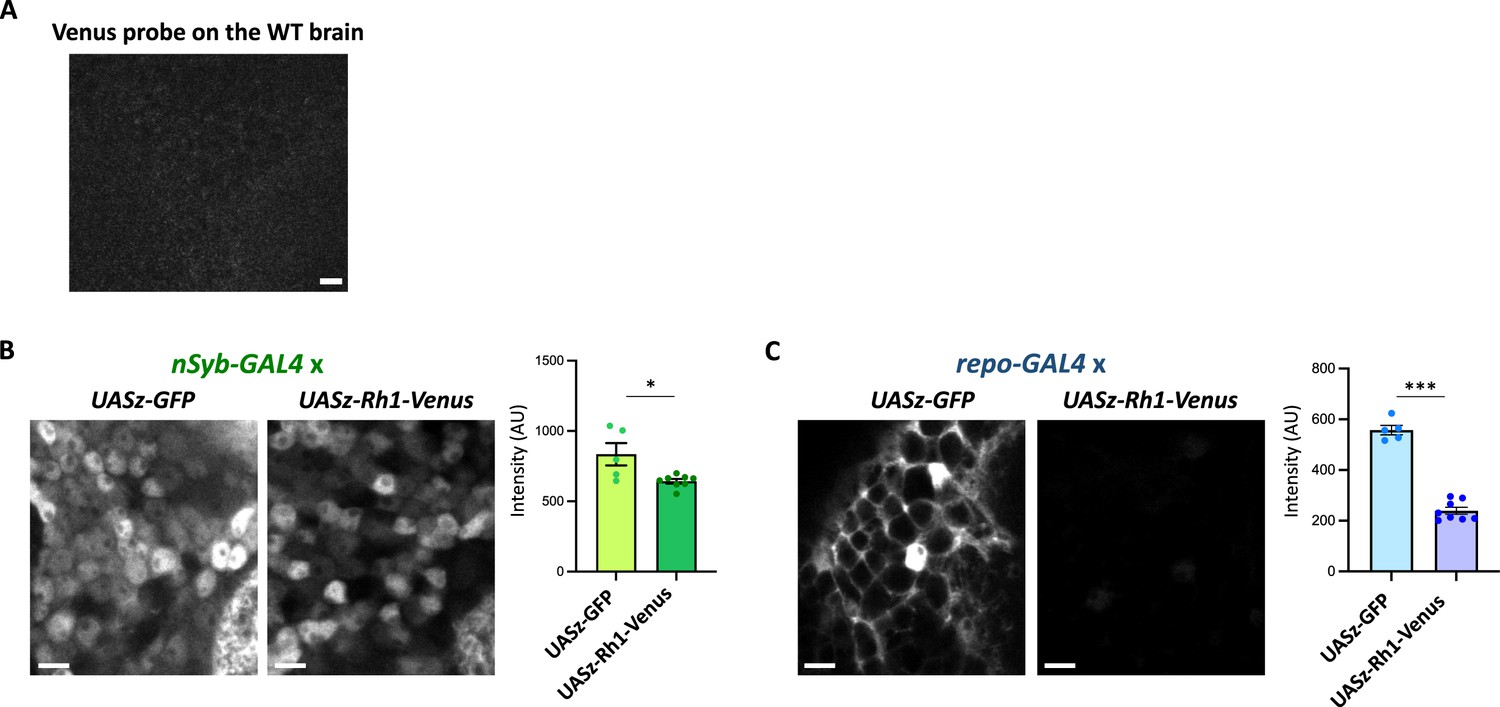
The Rh1 reporter expression in neurons or in glia.
(A) Negative control of the Venus smFISH. The Venus probes were hybridized onto the wild-type brain and scanned with the identical setting to Figure 5E. (B, C) Expression of the Rh1 (UASz-Rh1-Venus) or the control (UASz-GFP) reporter, driven by nSyb-GAL4 (B) or by repo-GAL4 (C). Sliced confocal images of the cortical regions adjacent to the antennal lobe are shown. Scale bars: 5 µm. The average fluorescent intensity is plotted. N = 5 (nSyb>UASz-GFP), 8 (nSyb>UASz-Rh1-Venus), 5 (repo>UASz-GFP), 8 (repo>UASz-Rh1-Venus). *p<0.05, ***p<0.001, Mann–Whitney test of ranks.
Additional files
-
Supplementary file 1
Reads on all the annotated genes in Ribo-seq and RNA-seq (TPM as a unit) and the calculated translational efficiency (TE).
- https://cdn.elifesciences.org/articles/90713/elife-90713-supp1-v1.xlsx
-
Supplementary file 2
Reads on genes included in the Gene Ontology terms shown in Figure 2.
All the genes showing at least one read in all conditions are included.
- https://cdn.elifesciences.org/articles/90713/elife-90713-supp2-v1.xlsx
-
Supplementary file 3
Sequences of the rRNA-depletion oligo, the translation reporters, and the smFISH probes.
- https://cdn.elifesciences.org/articles/90713/elife-90713-supp3-v1.docx
-
MDAR checklist
- https://cdn.elifesciences.org/articles/90713/elife-90713-mdarchecklist1-v1.pdf
Download links
A two-part list of links to download the article, or parts of the article, in various formats.
Downloads (link to download the article as PDF)
Open citations (links to open the citations from this article in various online reference manager services)
Cite this article (links to download the citations from this article in formats compatible with various reference manager tools)
Translational regulation enhances distinction of cell types in the nervous system
eLife 12:RP90713.
https://doi.org/10.7554/eLife.90713.3


