Estimating the true stability of the prehydrolytic outward-facing state in an ABC protein
- Department of Biochemistry, Semmelweis University, Hungary
- HCEMM-SE Molecular Channelopathies Research Group, Hungary
- HUN-REN-SE Ion Channel Research Group, Hungary
Figures
Figure 1
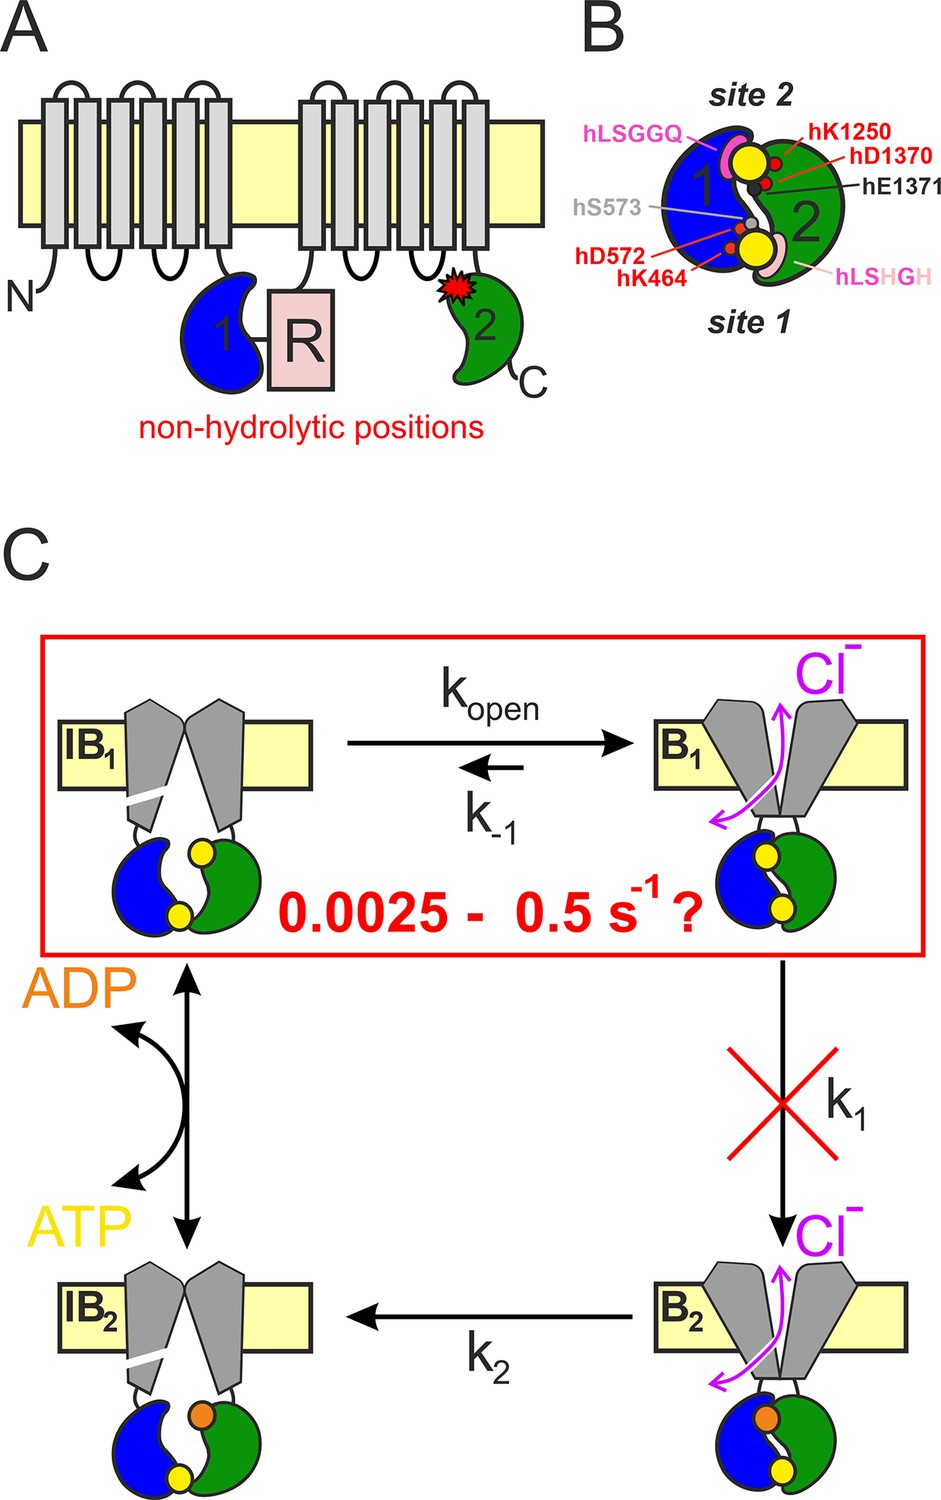
CFTR topology and gating cycle.
(A) Cartoon topology of CFTR. TMD1–2, gray; NBD1, blue; NBD2, green; R-domain, pale red. Red asterisk denotes catalytic site mutations. (B) Cartoon of head-to-tail NBD dimer. Color coding as in (A). ATP, large yellow circles. Site 2 (top): conserved Walker A/B residues, small red circles; catalytic base, small black circle; signature sequence, magenta crescent. Site 1 (bottom): color coding as for site 2, pale residues represent non-conserved substitutions. Residue numbering corresponds to the human CFTR sequence. (C) Schematic gating cycle of phosphorylated CFTR. Flickery closures from states B1 and B2 are not depicted. Disruption of ATP hydrolysis in catalytic site mutants (red cross) reduces gating to reversible IB1 ↔ B1 transitions (red box). Note, that in reality sites 1 and 2 are equally near the membrane, in the cartoons site 2 is depicted as the top and site 1 as the bottom site merely for representation purposes.
Figure 2 with 1 supplement
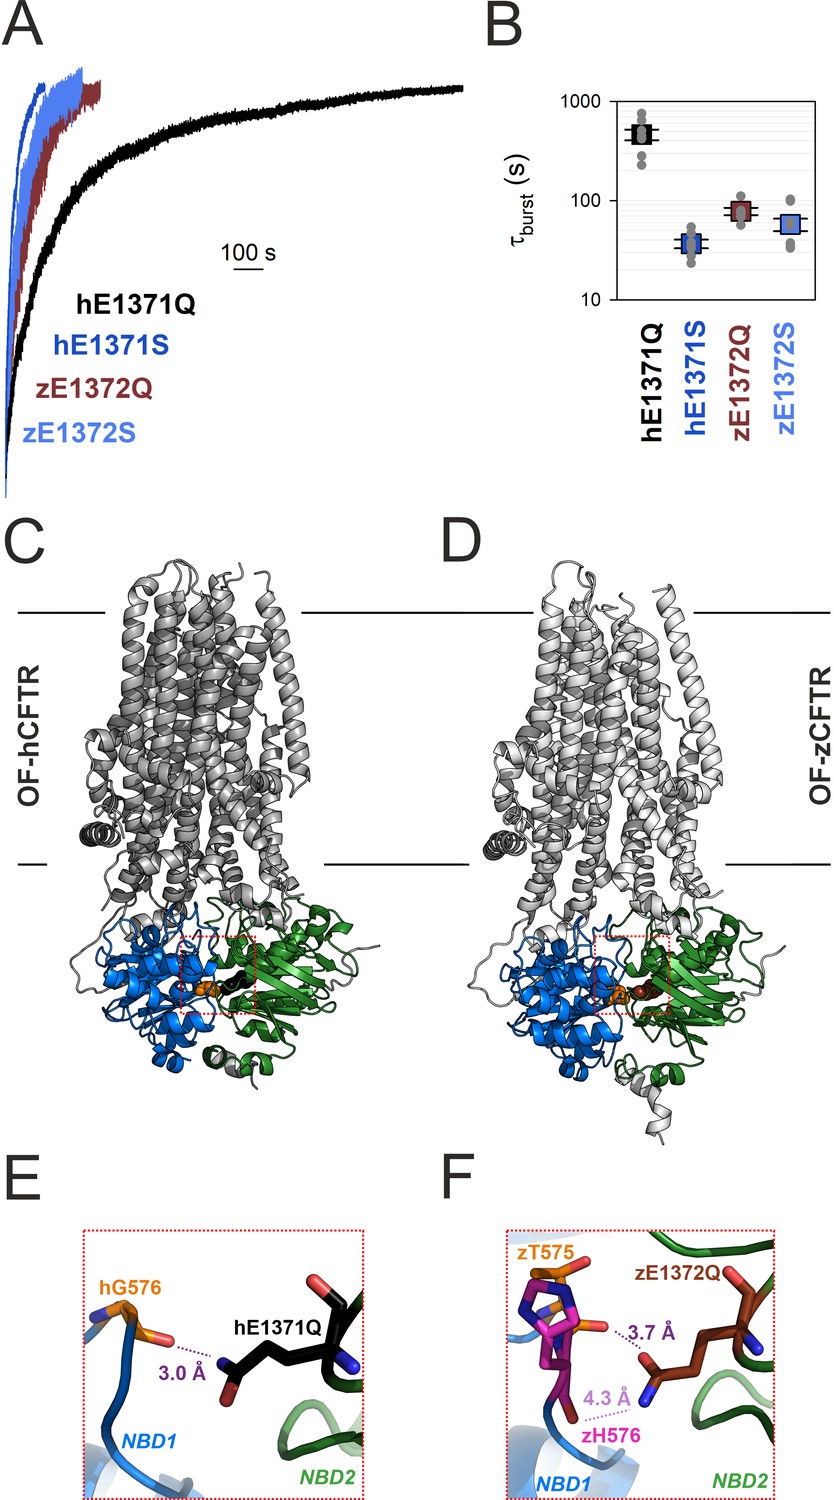
Non-native inter-NBD H-bond in OF E-to-Q mutant hCFTR, but not zCFTR, suggested by cryo-EM structures.
(A) Macroscopic current relaxations upon ATP removal in inside-out patches excised from Xenopus laevis oocytes expressing hE1371Q (black trace), hE1371S (dark blue trace), zE1372Q (brown trace), and zE1372S (light blue trace) CFTR channels. Currents were activated by exposure to saturating ATP, following prior phosphorylation for ~2 min with 300 nM bovine PKA catalytic subunit. Current amplitudes are shown normalized by their steady-state values in ATP (i.e., just before ATP removal), membrane potential (Vm) was −20 to −80 mV. (B) Mean burst durations (in seconds) obtained as the time constants of single-exponential fits to the macroscopic relaxations shown in (A). Data are shown as mean ± standard error of the mean (SEM) from six to nine experiments using a logarithmic ordinate. (A, B) has been adapted from Figures 2A, B, and 3C, D from Simon and Csanády, 2023. (C, D) Cryo-EM structures of hCFTR-E1371Q (PDBID: 6msm) and zCFTR-E1372Q (PDBID: 5w81) in the OF conformation. Color coding as in (A), positions hG576/zT575 (orange), hQ1371 (black), and zQ1372 (brown) are shown in spacefill. Red dotted squares identify regions expanded in panels (E, F). (E, F) Close-up views of the regions surrounding the mutated catalytic glutamate side chains (black/brown sticks) in OF hCFTR (E) and zCFTR (F).
Figure 2—figure supplement 1

Experimental electron densities around residues G576 and Q1371 in OF structure of hCFTR E1371Q.
Electron densities (gray mesh, EMD-9230) and atomic model (sticks, PDBID: 6msm) of residues hG576 and hQ1371 in OF hCFTR-E1371Q.
Figure 3
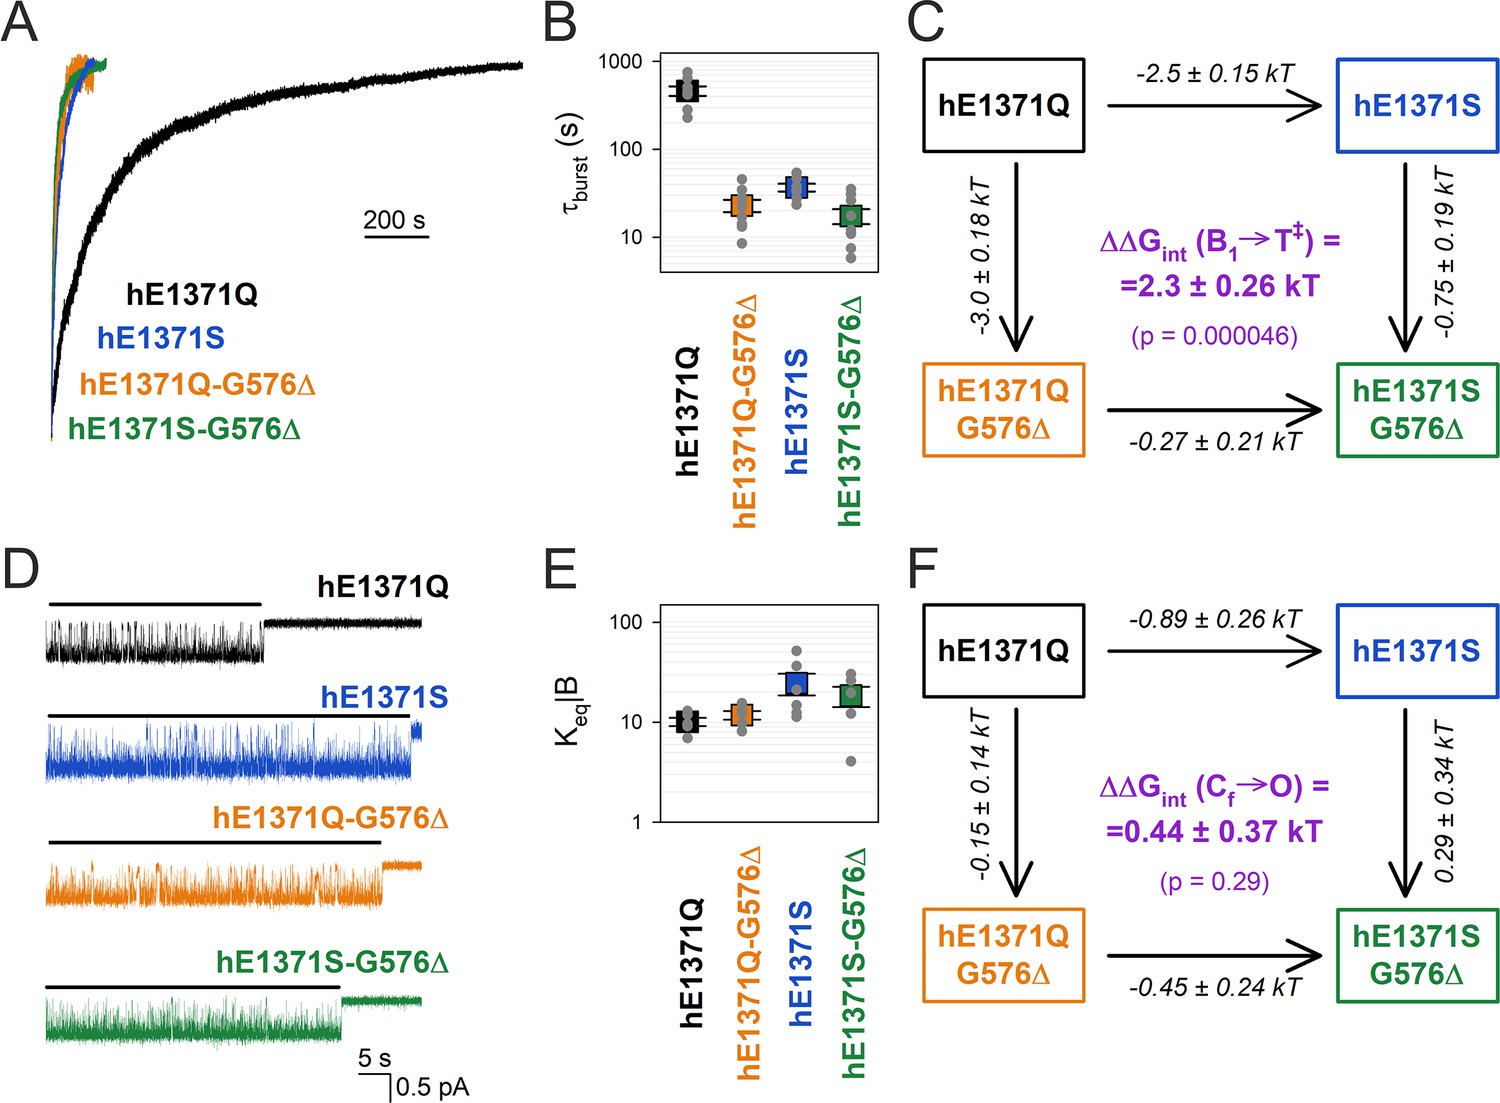
Strong coupling between positions 576 and 1371 of hCFTR E1371Q in the bursting state.
(A) Macroscopic current relaxations following ATP removal for indicated human CFTR channel mutants (color coded). Inside-out patch currents were activated by exposure of pre-phosphorylated channels to saturating ATP. Current amplitudes are shown normalized by their steady-state values in ATP (i.e., just before ATP removal). Vm was −20 to −80 mV. (B) Relaxation time constants of the currents in (A), obtained by fits to single exponentials. Data are shown as mean ± standard error of the mean (SEM) from seven to nine experiments using a logarithmic ordinate. (C) Thermodynamic mutant cycle showing mutation-induced changes in the height of the free enthalpy barrier for the B1 → IB1 transition (ΔΔG0T‡−B1, numbers on arrows; k, Boltzmann’s constant; T, absolute temperature). Each corner is represented by the mutations introduced into positions Q1371 and G576 of E1371Q-hCFTR. ΔΔGint(B1 → T‡) (purple number) is obtained as the difference between ΔΔG0T‡−B1 values along two parallel sides of the cycle. (D) Currents of last open channels after ATP removal for the indicated human CFTR constructs (color coded). Recordings were done as in panel (A), but on patches with smaller numbers of channels. Membrane potential was −80 mV. Black lines indicate the analyzed segments. (E) Intraburst equilibrium constants obtained by dwell-time analysis for the four human CFTR constructs, plotted on a logarithmic scale. Data are shown as mean ± standard error of the mean (SEM) from five to six experiments. (F) Thermodynamic mutant cycle showing mutation-induced changes in the stability of the O state relative to the Cf state (ΔΔG0O-CF, numbers on arrows; k, Boltzmann’s constant; T, absolute temperature). Each corner of the cycle is represented by the mutations introduced into positions Q1371 and G576 of E1371Q-hCFTR. ΔΔGint(Cf → O) (purple number) is obtained as the difference between ΔΔG0O-CF values along two parallel sides of the cycle.
Figure 4 with 1 supplement
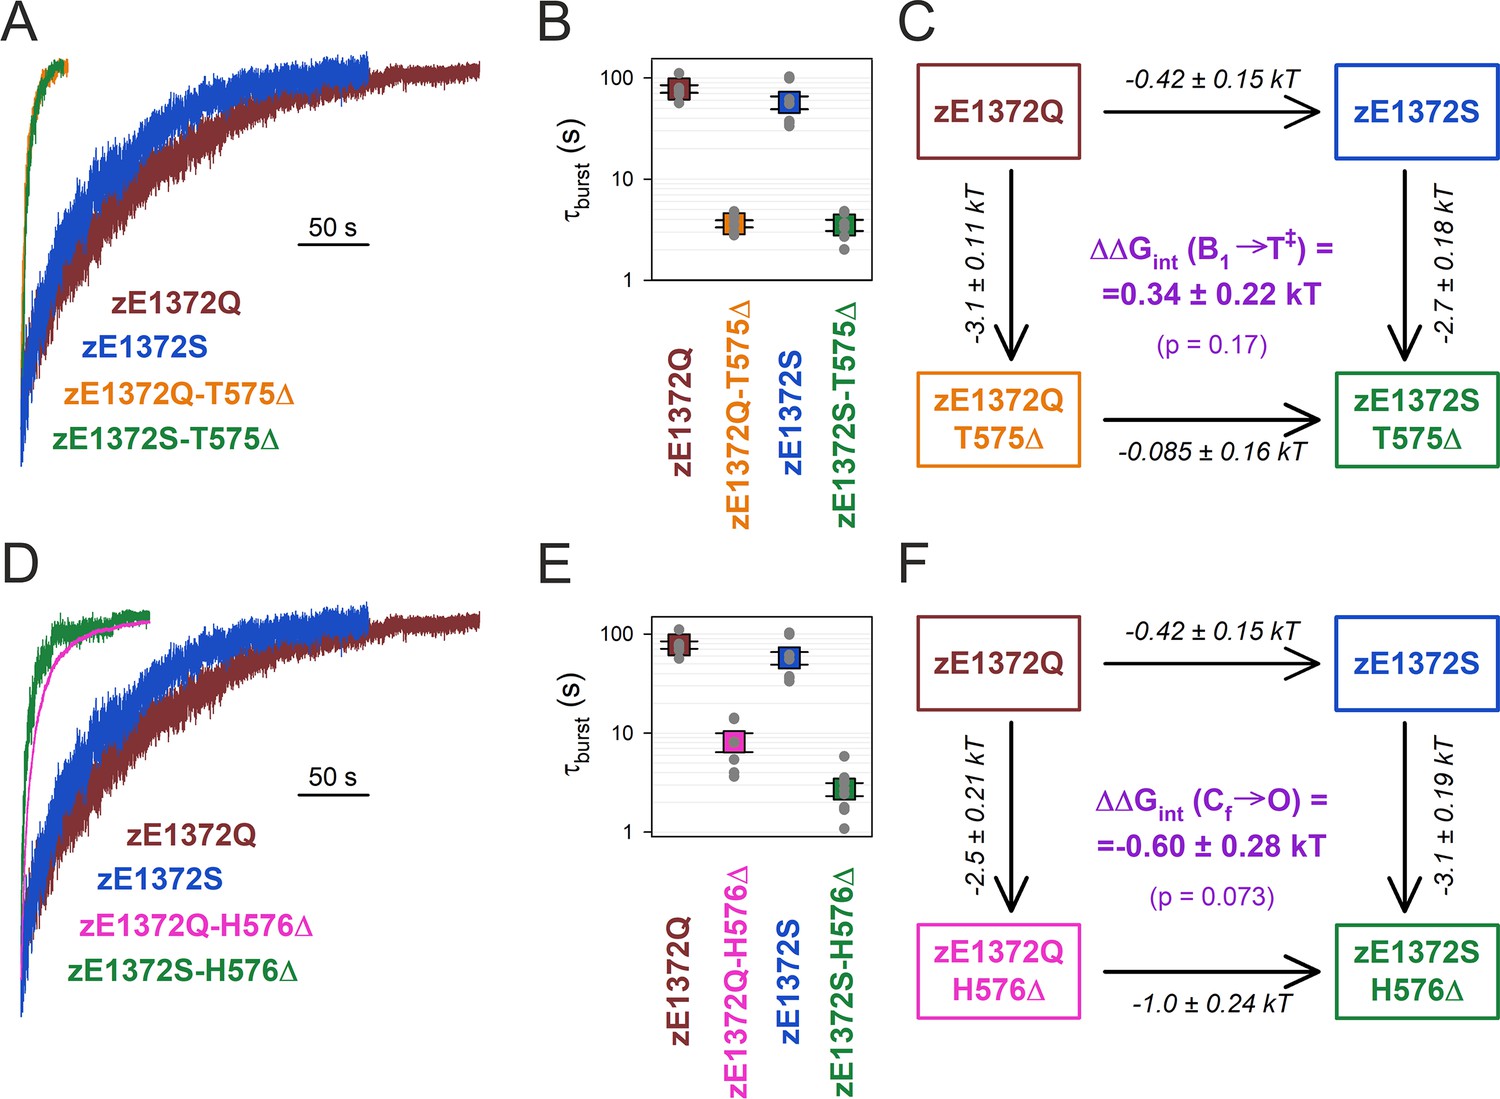
No coupling between positions 575/576 and 1372 of zCFTR E1372Q in the bursting state.
(A, D) Macroscopic current relaxations following ATP removal for indicated zCFTR channel mutants (color coded). Experiments were performed as in Figure 3A, and current amplitudes are shown normalized by their steady-state values in ATP (i.e., just before ATP removal). (B, E) Relaxation time constants of the currents in (A, D), obtained by fits to single exponentials. Data are shown as mean ± standard error of the mean (SEM) from 6 to 10 experiments using a logarithmic ordinate. (C, F) Thermodynamic mutant cycles showing mutation-induced changes in the height of the free enthalpy barrier for the B1 → IB1 transition (ΔΔG0T‡−B1, numbers on arrows; k, Boltzmann’s constant; T, absolute temperature). Each corner is represented by the mutations introduced into positions Q1372 and either T575 (C) or H576 (F) of E1372Q-zCFTR. ΔΔGint(B1 → T‡) (purple number) is obtained as the difference between ΔΔG0T‡−B1 values along two parallel sides of the cycle.
Figure 4—figure supplement 1

Close-up view of the region surrounding the mutated catalytic glutamate side chain (brown sticks) and D-loop residues zT575 (orange sticks) and zH576 (magenta sticks) in the cryo-EM structure of zCFTR-E1372Q, solved in the OF conformation (PDBID: 5w81).
Purple dotted line illustrates suggested H-bond between the zT575 side chain and the backbone carbonyl oxygen of zA1375 (green sticks).
Figure 5 with 1 supplement
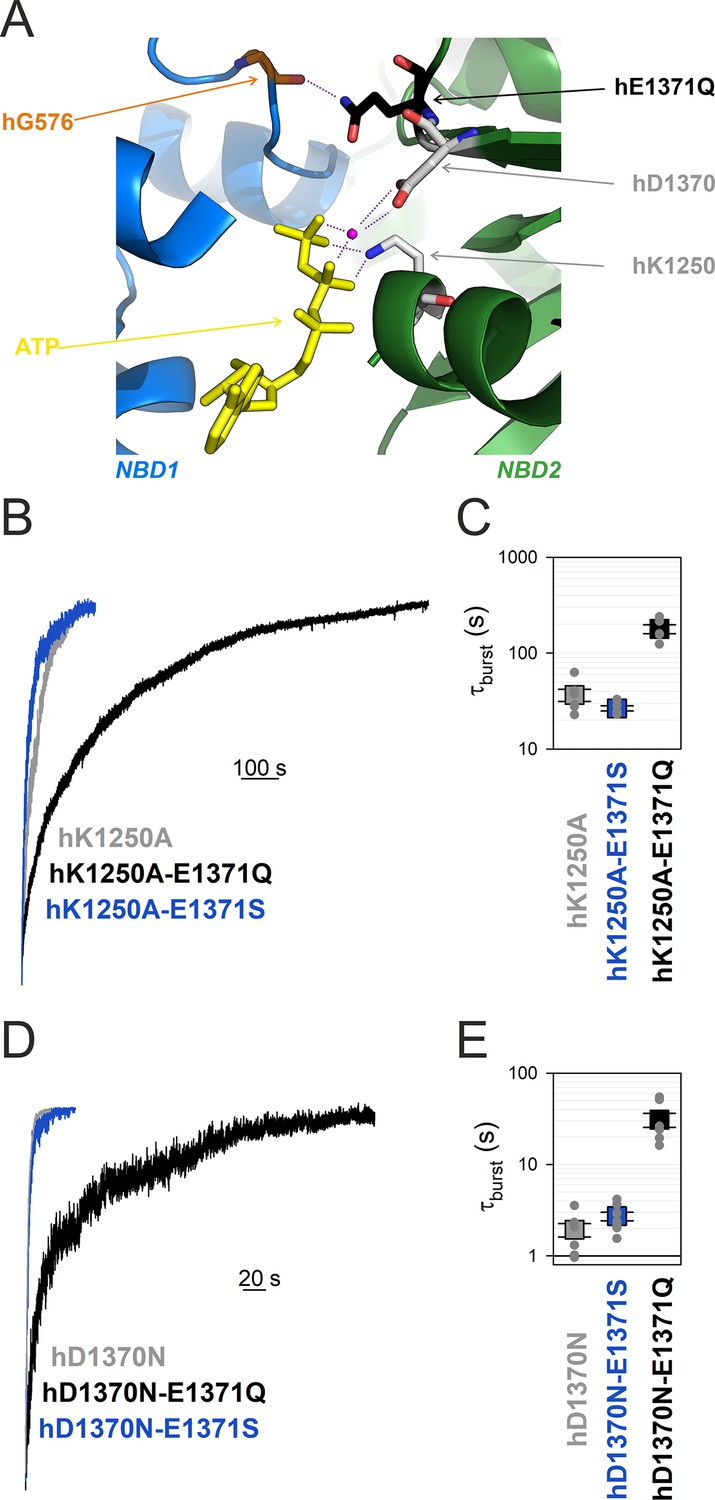
Mutation hE1371Q strongly stabilizes, whereas hD1370N destabilizes, bursts in other non-hydrolytic backgrounds.
(A) Close-up view of the site 2 interface in the OF structure of hCFTR-E1371Q (PDBID: 6msm) highlighting (in sticks) NBD1 D-loop residue hG576 (orange), and NBD2 residues hQ1371 (black), hD1370 (gray), and hK1250 (gray). ATP, yellow sticks; Mg2+, purple sphere. (B, D), Macroscopic current relaxations following ATP removal for indicated CFTR channel mutants (color coded). Experiments were performed as in Figure 3A, and current amplitudes are shown normalized by their steady-state values in ATP (i.e., just before ATP removal). (C, E), Relaxation time constants of the currents in (B, D), obtained by fits to single exponentials, displayed on a logarithmic ordinate. Data show mean ± standard error of the mean (SEM) from five to eight experiments.
Figure 5—figure supplement 1
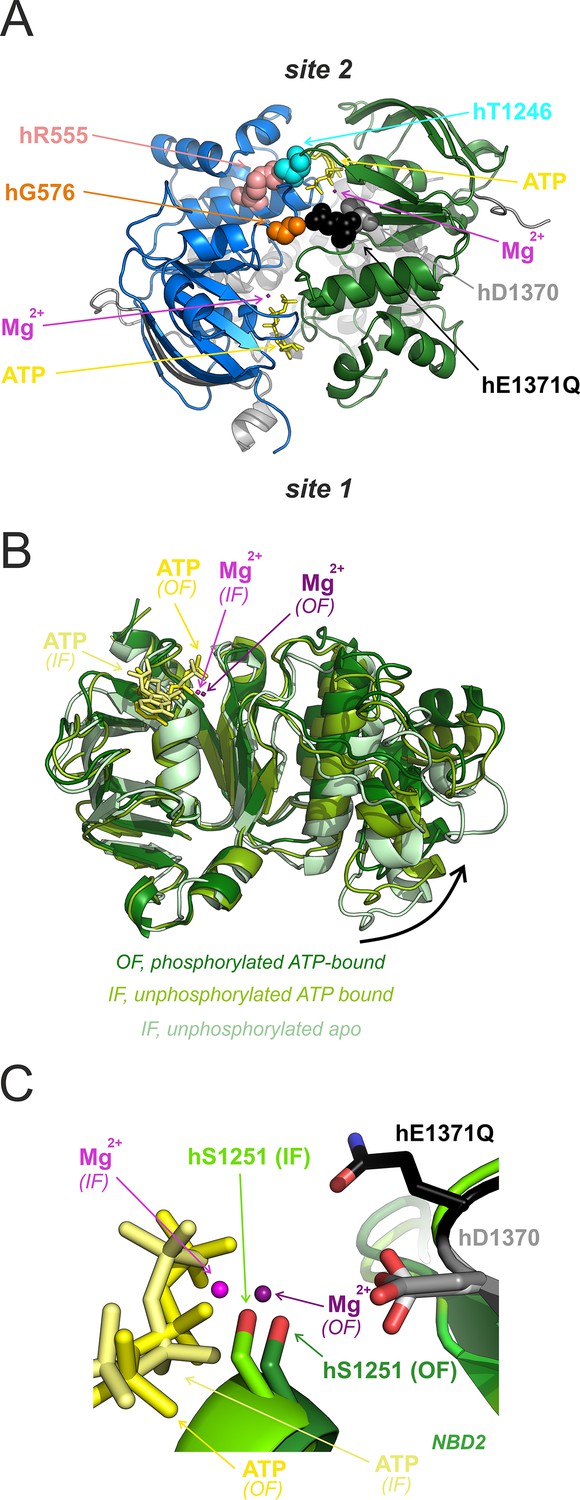
Intra-NBD2 movements associated with ATP binding and tight NBD dimerization.
(A) Location of positions 576, 1370, and 1371 (colored spacefill) relative to composite sites 1 and 2 in the tight hCFTR NBD dimer (PDBID: 6msm). Interacting positions 555 and 1246 (Vergani et al., 2005) are also shown in colored spacefill. (B) NBD2 structures of non-phosphorylated apo IF hCFTR (6uak; light green), non-phosphorylated ATP-bound IF hCFTR (8fzq; medium green), and phosphorylated ATP-bound OF E1371Q-hCFTR (6msm; dark green), aligned through their core subdomains. ATP (shades of yellow), and Mg2+ (shades of purple) of the ATP-bound structures are shown as sticks and spheres, respectively. Note completion of subdomain closure (curved arrow) in the OF structure. (C) Atomic models (sticks and spheres) of ATP (shades of yellow), Mg2+ (shades of purple), and residues D1370 (shades of gray) and S1251 (shades of green) from ATP-bound non-phosphorylated IF WT hCFTR (lighter tones; PDBID: 8fzq) and phosphorylated ATP-bound OF E1371Q hCFTR (darker tones; PDBID: 6msm). The core subdomain of NBD2 from 6msm was aligned with that of 8fzq in Pymol. Residue h1371 (black sticks) is shown only for the OF structure.
Figure 6
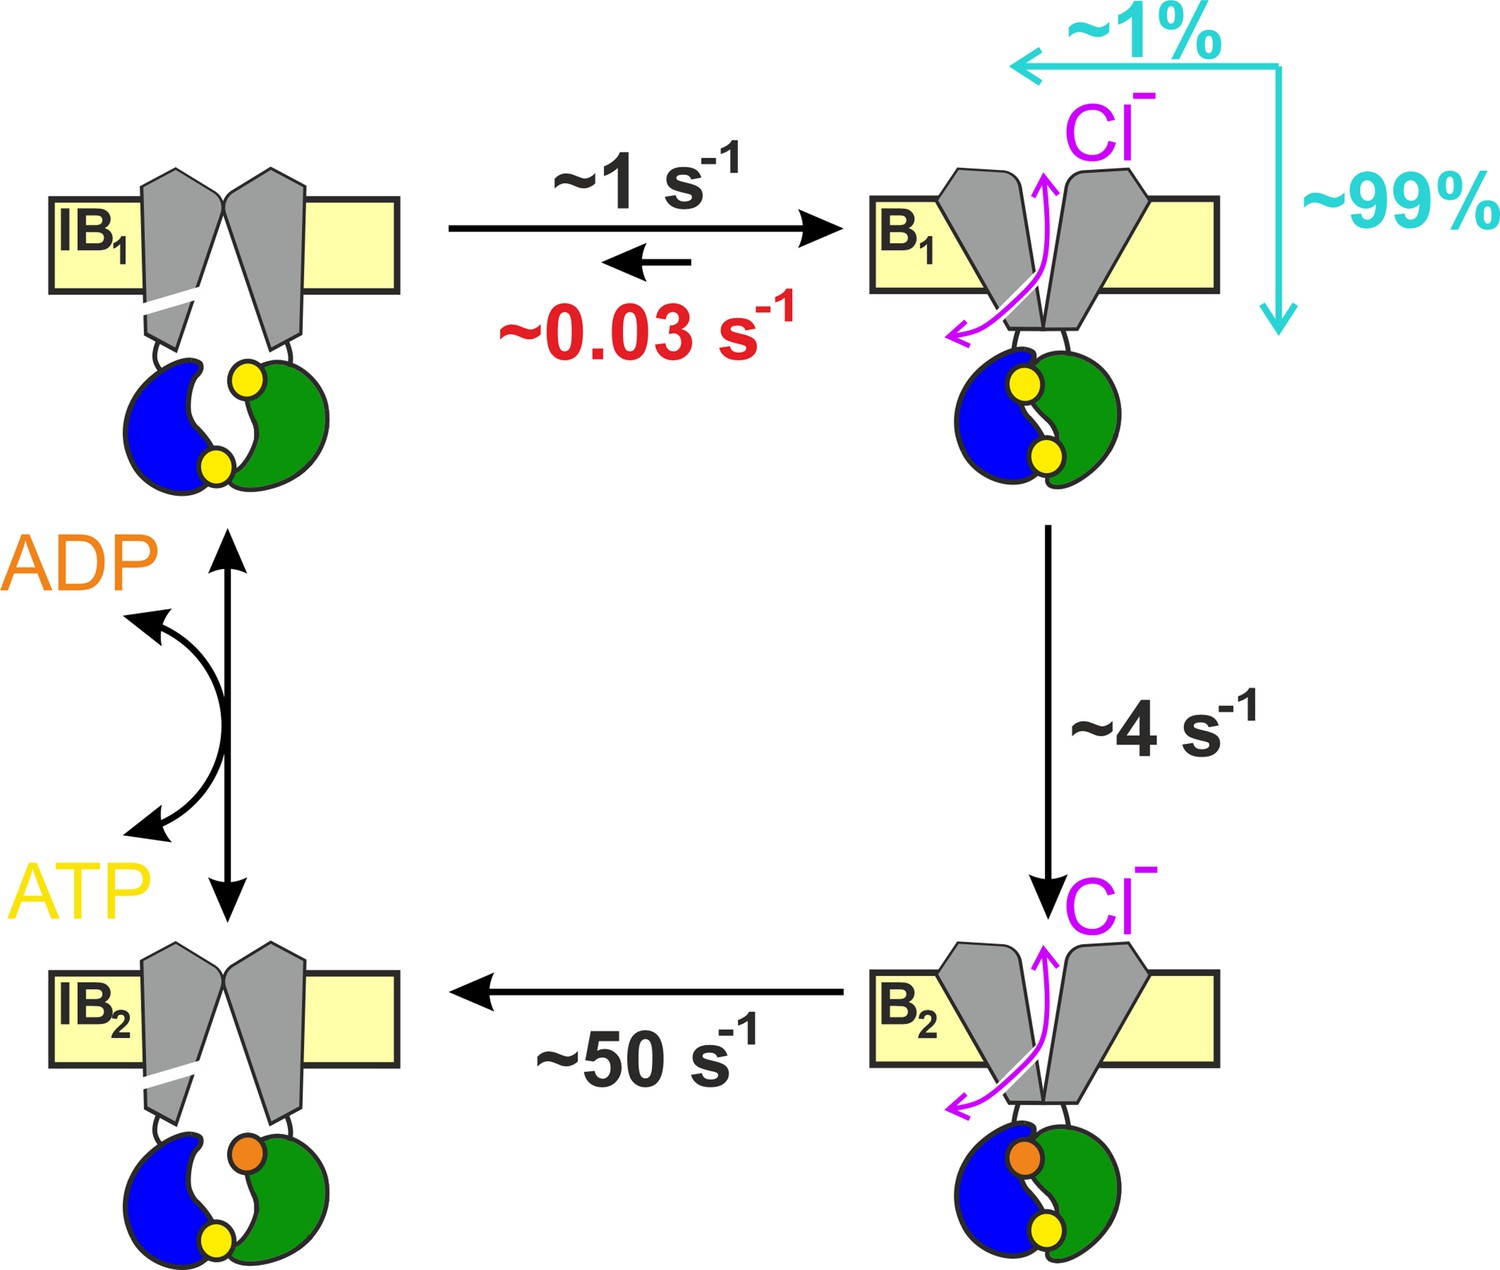
Coupling between bursts and ATP hydrolysis in wild-type (WT) hCFTR.
Quantitative hCFTR gating cycle, color coding as in Figure 1C. Numbers represent estimated microscopic rate constants for prephosphorylated WT hCFTR channels gating in ATP at 25°C, with k−1 (red) established in the present study. Cyan arrows and numbers illustrate the fractions of bursts that are terminated by ATP hydrolysis and non-hydrolytic dissociation of composite site 2, respectively.
Tables
Key resources table
| Reagent type (species) or resource | Designation | Source or reference | Identifiers | Additional information |
|---|---|---|---|---|
| Biological sample (Xenopus laevis) | Xenopus laevis oocytes | European Xenopus Resource Centre | RRID: NXR_0.0080 | - |
| Commercial assay or kit | HiSpeed Plasmid Midi Kit | QIAGEN | 12643 | |
| Commercial assay or kit | QuickChange II Mutagenesis Kit | Agilent Technologies | 200524 | |
| Commercial assay or kit | mMESSAGE mMACHINE T7 Transcription Kit | Thermo Fisher Scientific | AM1344 | |
| Chemical compound, drug | Collagenase type II | Thermo Fisher Scientific | 17101-015 | |
| Chemical compound, drug | Adenosine 5′-triphosphoribose magnesium (ATP) | Sigma-Aldrich | A9187 | |
| Software, algorithm | Pclamp9 | Molecular Devices | RRID: SCR_011323 |
Additional files
Download links
A two-part list of links to download the article, or parts of the article, in various formats.
Downloads (link to download the article as PDF)
Open citations (links to open the citations from this article in various online reference manager services)
Cite this article (links to download the citations from this article in formats compatible with various reference manager tools)
Estimating the true stability of the prehydrolytic outward-facing state in an ABC protein
eLife 12:e90736.
https://doi.org/10.7554/eLife.90736


