Dynamic landscape of the intracellular termini of acid-sensing ion channel 1a
- Department of Physiology and Biophysics, University of Colorado Anschutz Medical Campus, United States
- University of Arizona College of Medicine, United States
Figures
Figure 1 with 1 supplement
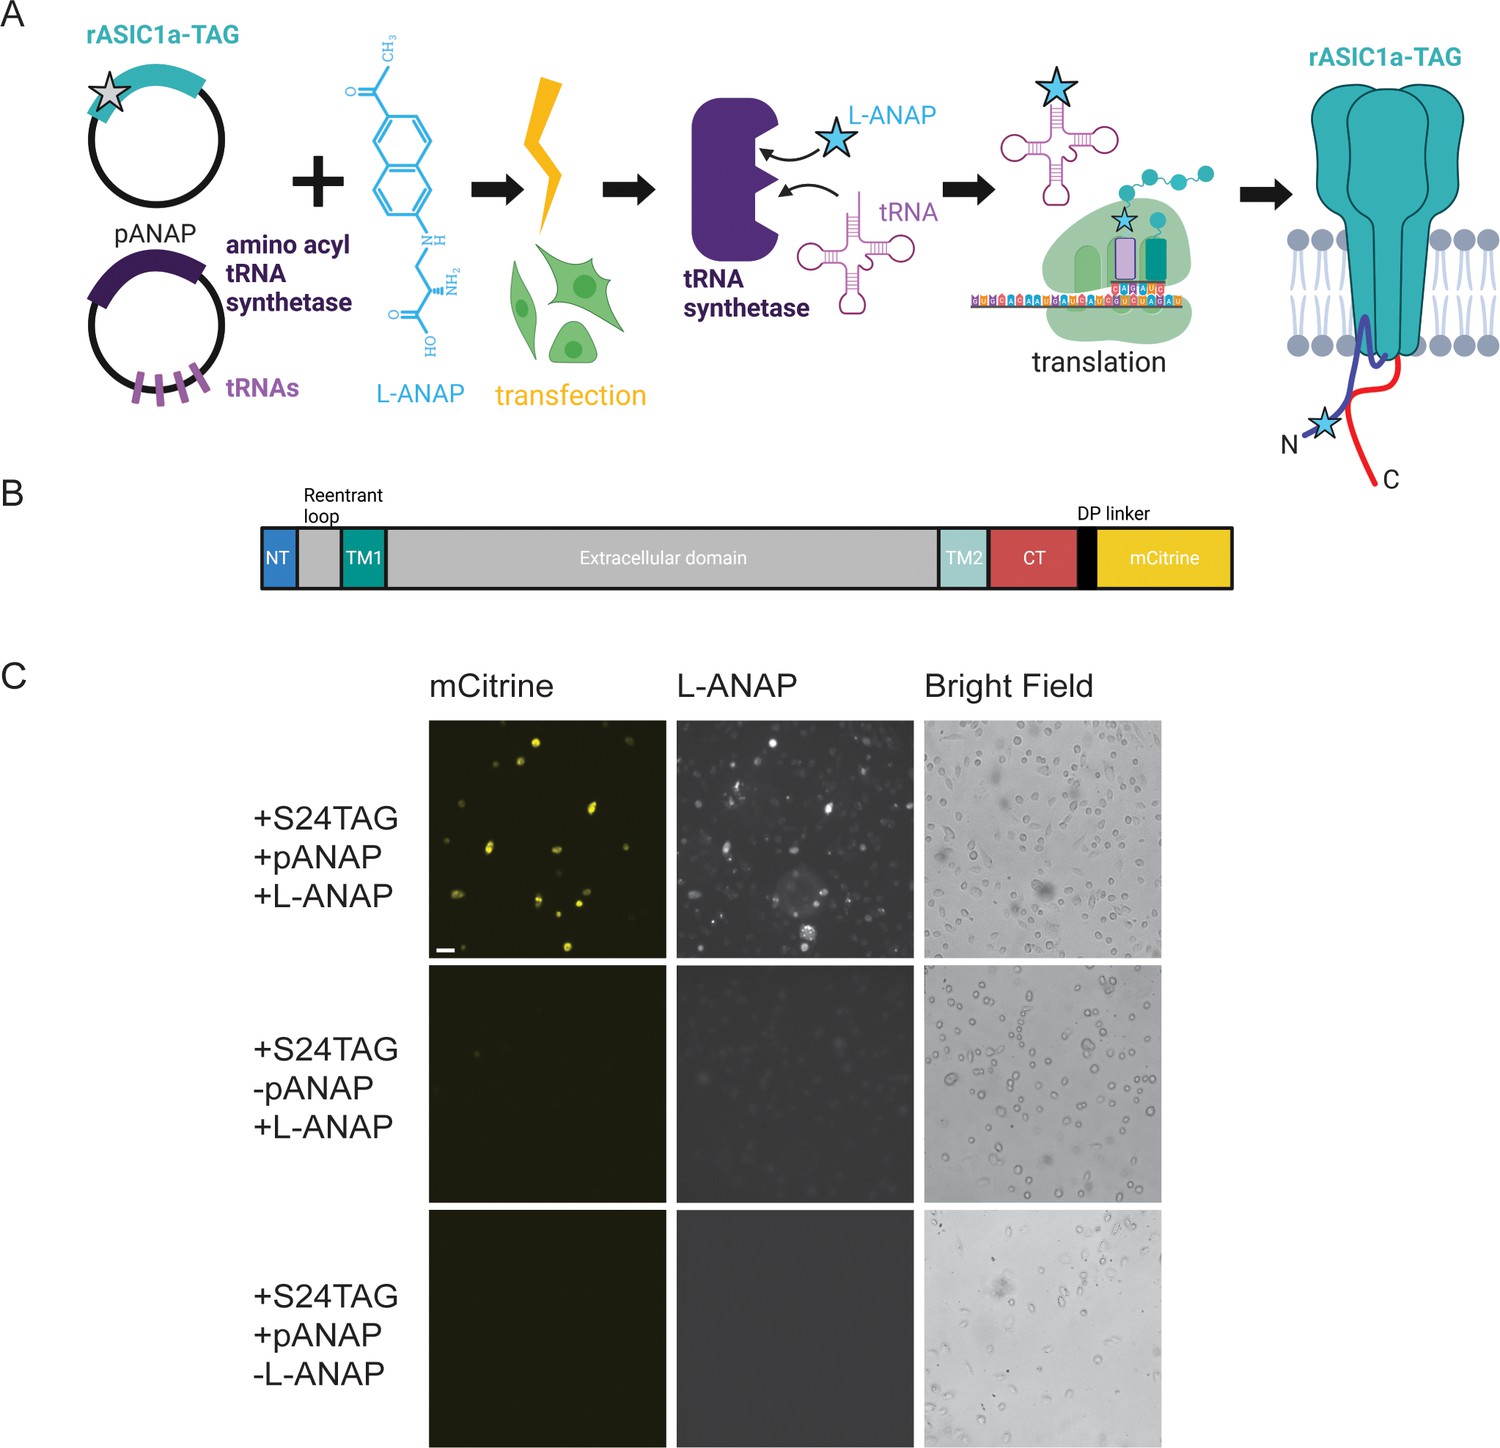
Incorporation of L-ANAP into ASIC1a.
(A) Cartoon schematic illustrating L-ANAP incorporation into rASIC1a using the amber suppression method. Gray star indicates the location of the TAG mutation where L-ANAP can be incorporated when rASIC1a is co-transfected with pANAP and the media is supplemented with free L-ANAP (Created with Biorender.com). (B) Schematic of rASIC1a construct used for tmFRET experiments. Cytosolic N- and C-termini are in blue and red, respectively. mCitrine is conjugated to the C-terminus using a linker based on a loop region in DNA polymerase (DP). (C) Fluorescent and bright field images of rASIC1a-S24TAG expressed in CHO-K1 cells. Left column shows mCitrine fluorescence while the middle columns shows the L-ANAP fluorescence signal. Images were collected either in the presence or absence of L-ANAP and pANAP. Images were collected 24 hr after transfection at 20 x. The scale bar in the top left is 50 μm and applies to all panels in C.
Figure 1—figure supplement 1

DNA sequence for rASIC1a in black with conservative alternative initiation site mutations highlighted in cyan and cysteine to serine mutations highlighted in yellow.
Amino acid translation is above in red.
Figure 2 with 1 supplement
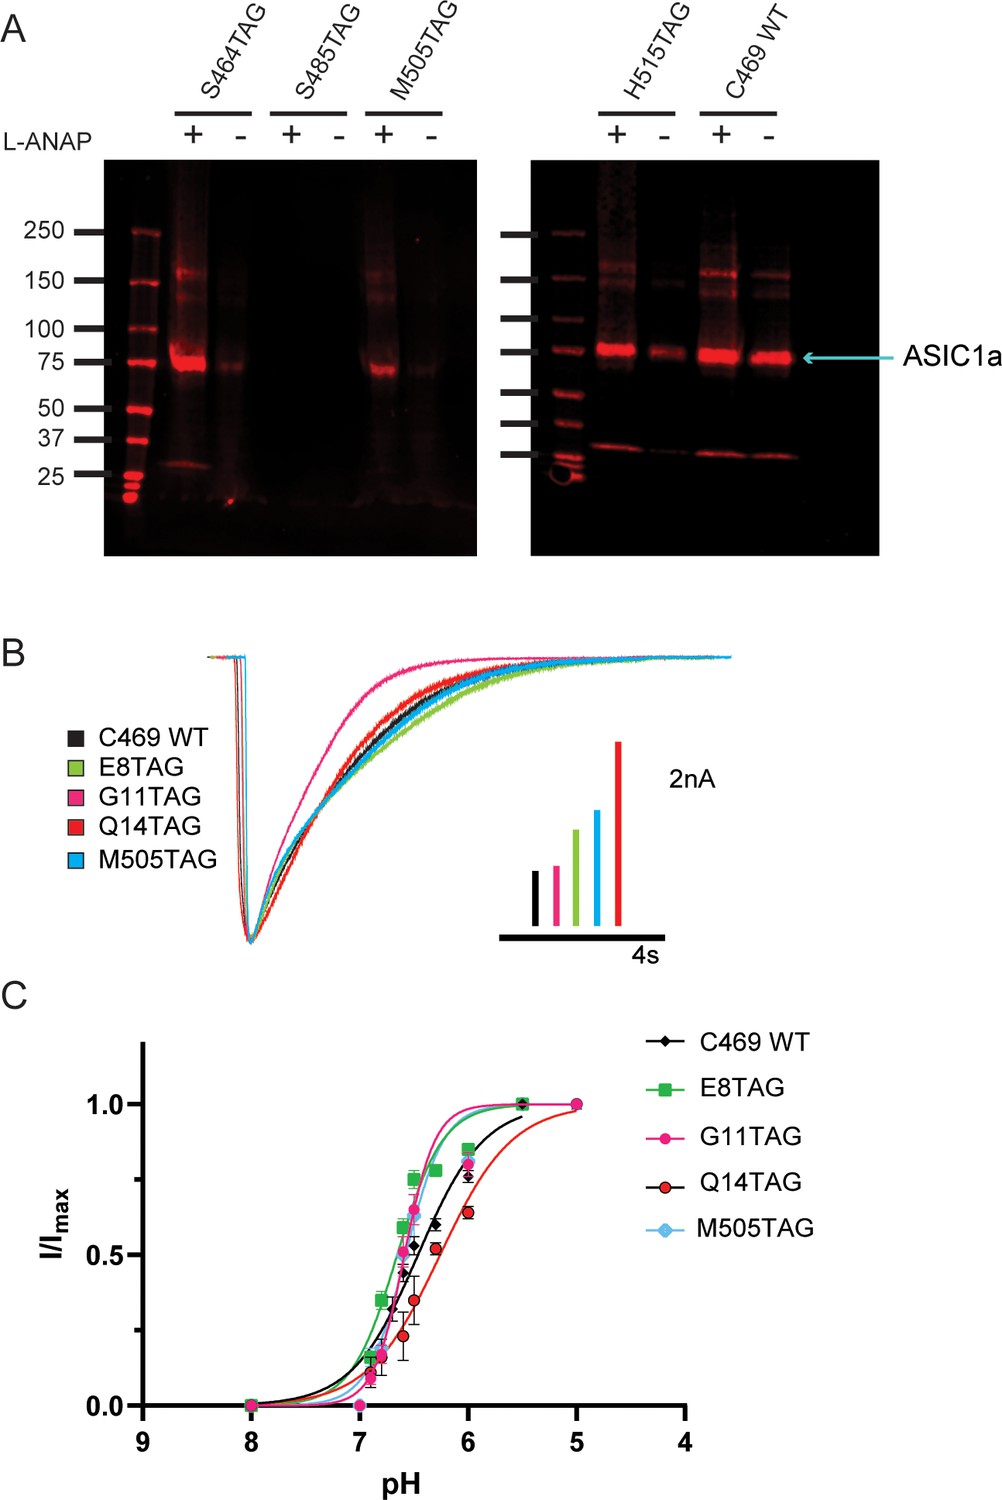
Incorporation of L-ANAP into ASIC1 produces full-length channel with normal pH-dependent gating.
(A) Representative western blots for rASIC1a expressed in CHO-K1 cells with a single TAG mutation at denoted position, blotted with an anti-GFP antibody. Each TAG mutant was cultured both with L-ANAP (10 μM) and without L-ANAP supplementation. Expression of channels with L-ANAP incorporated is seen with bands at ~75 kDa. Higher molecular weight bands are likely channel oligomers (dimer, trimer) and bands below are likely free mCitrine. Neither the higher nor lower bands make up a significant portion of channel expressed. Less protein was loaded in the WT (no TAG) control C469 WT. (B) Representative whole-cell recordings of TAG mutants with single cysteine at C469 (colors) and C469 WT construct (black) elicited by solution switch from pH 8 to pH 5.5. (C) pH dependence of activation for rASIC1a TAG mutants with single cysteine at C469 (colors) and the C469 WT construct (black). Data were fit to a modified Hill equation. Fit results found in Figure 2—figure supplement 1.
-
Figure 2—source data 1
Source data for Figure 2C showing each cells individual fit pH0.5 along with the mean and SEM and P-values.
Significance was determined using 1-way ANOVA with a Dunnet’s post-hoc test for multiple comparisons to a single control.
- https://cdn.elifesciences.org/articles/90755/elife-90755-fig2-data1-v1.xlsx
Figure 2—figure supplement 1
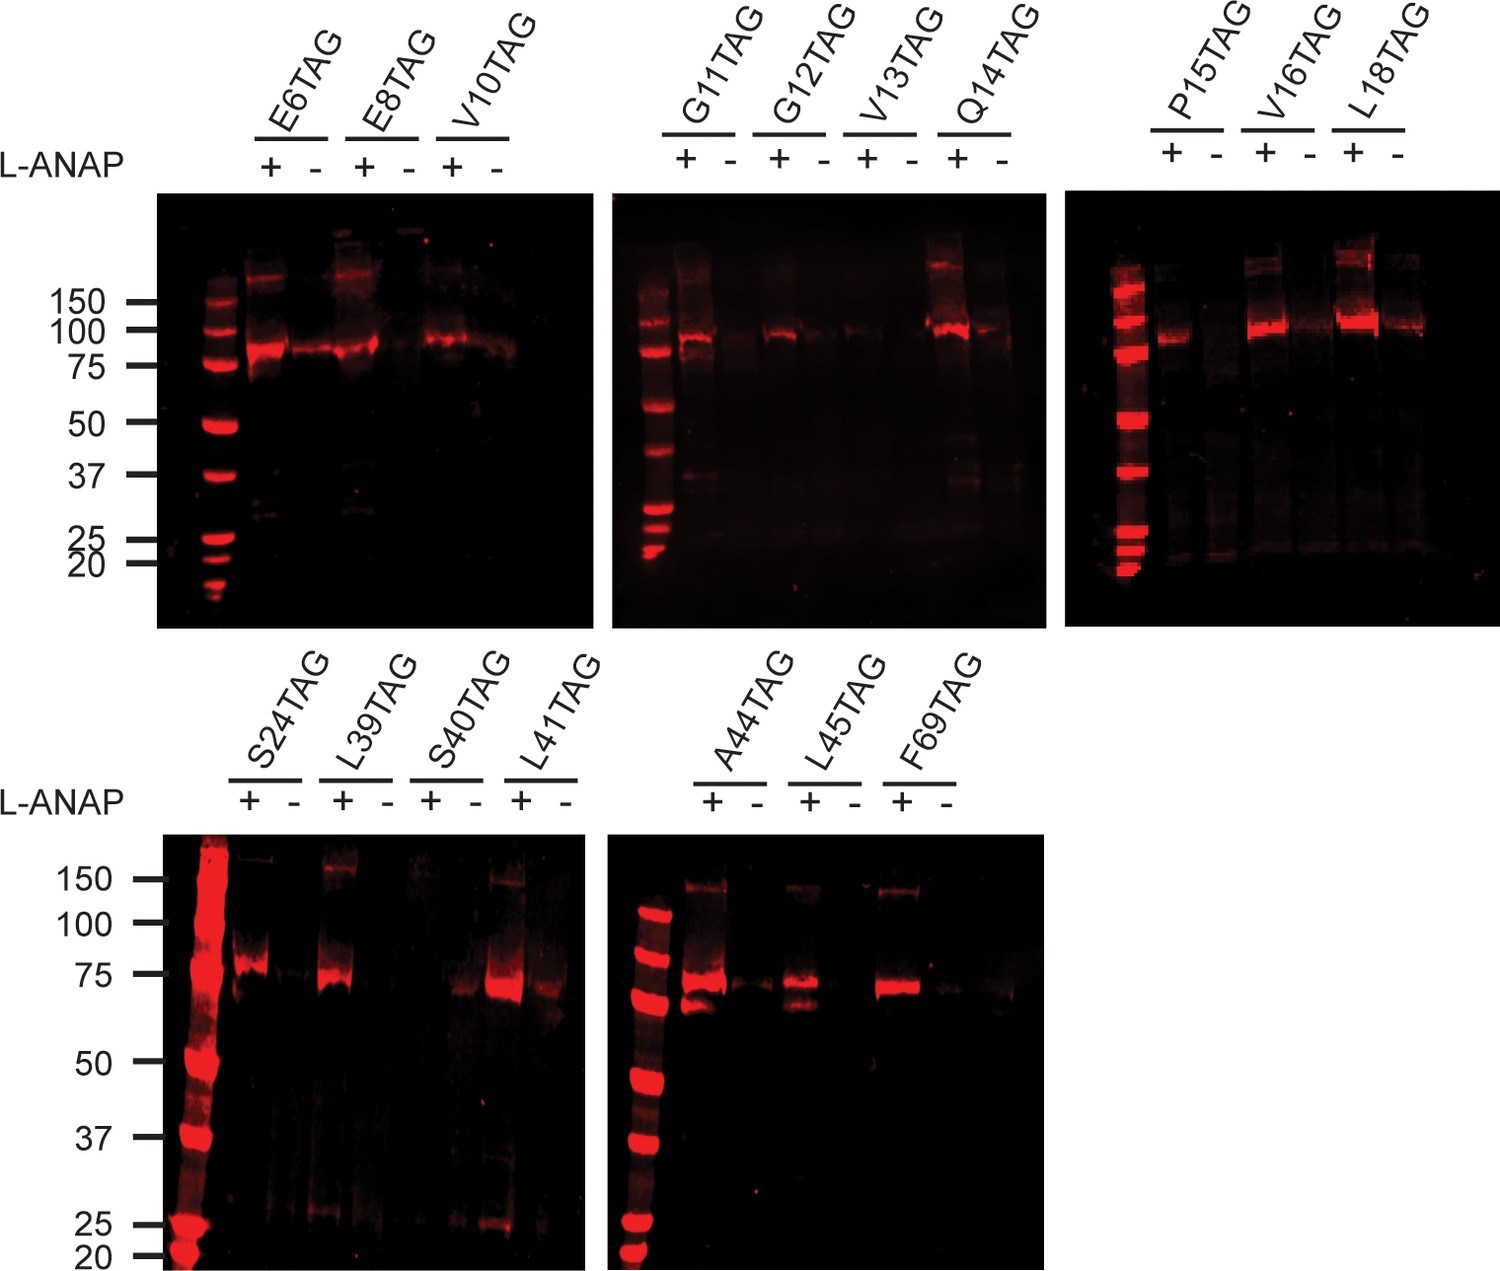
Representative western blots for all TAG mutants created in this study.
Westerns were blotted with an anti-GFP antibody that recognizes the terminal mCitrine. Each TAG mutant was cultured both with L-ANAP (10 μM) and without L-ANAP supplementation. Westerns in this figure were run on Bis-Tris gels, whereas the westerns in Figure 2 were run on Tris-Glycine gels, which results in ASIC running slightly differently between the 2 gel types.
Figure 3 with 1 supplement
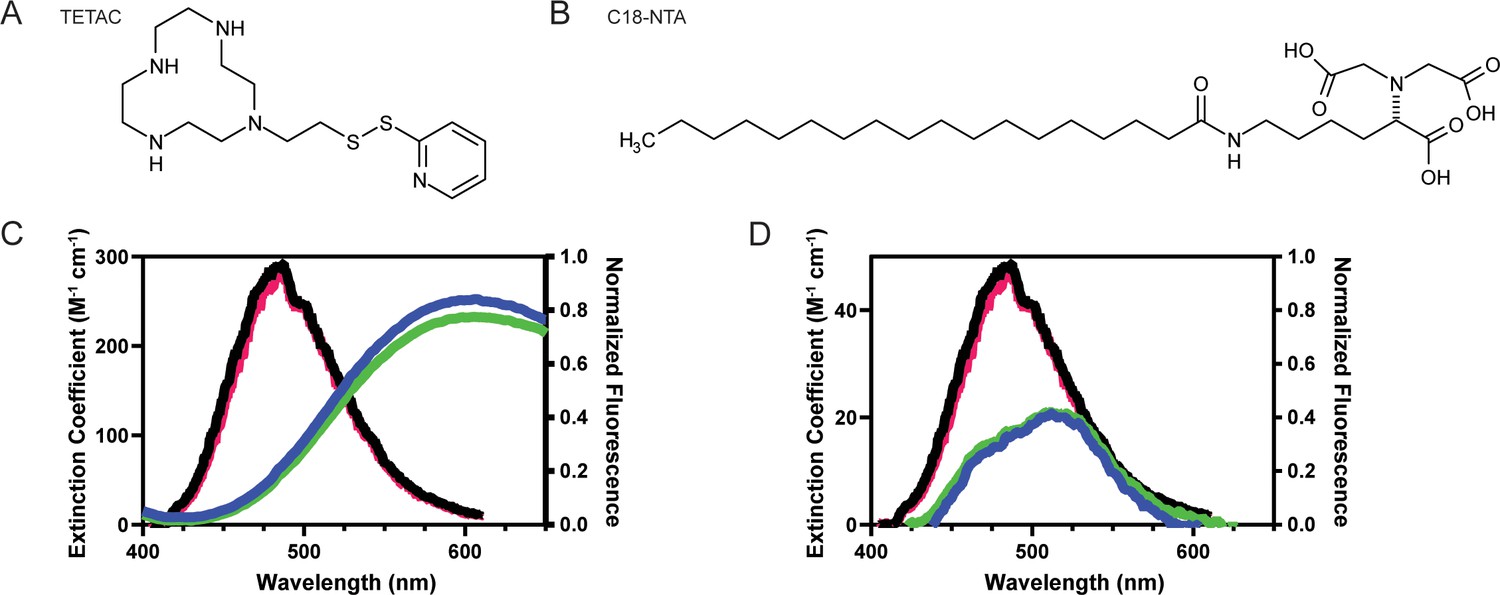
Spectral properties of L-ANAP and Cu2+-TETAC and C18-NTA make both good FRET pairs capable of measuring short distances.
(A) Chemical structure of free TETAC. (B) Chemical structure of C18-NTA. (C) Spectral properties of L-ANAP bound to agarose beads and Cu2+-TETAC. Absorption spectra of TETAC-Cu2+ at pH 8 (blue) and pH 6 (green) were measured and spectral properties plotted along with emission spectra from L-ANAP bound to agarose beads at pH 8 (black) and pH 6 (red). (D) Spectral properties of L-ANAP bound to agarose beads and Co2+-C18-NTA. Absorption spectra of Co2+-C18-NTA at pH 8 (blue) and pH 6 (green) were measured and spectral properties plotted along with emission spectra from L-ANAP bound to agarose beads at pH 8 (black) and pH 6 (red).
Figure 3—figure supplement 1

Spectral properties of Zn2+-TETAC and Zn2+-C18-NTA at pH 8 and pH 6.
(A) Absorbance spectrum (converted to extinction coefficient) shown for Zinc bound to TETAC and C18-NTA. There is no absorbance seen in the visibile spectrum.
Figure 4
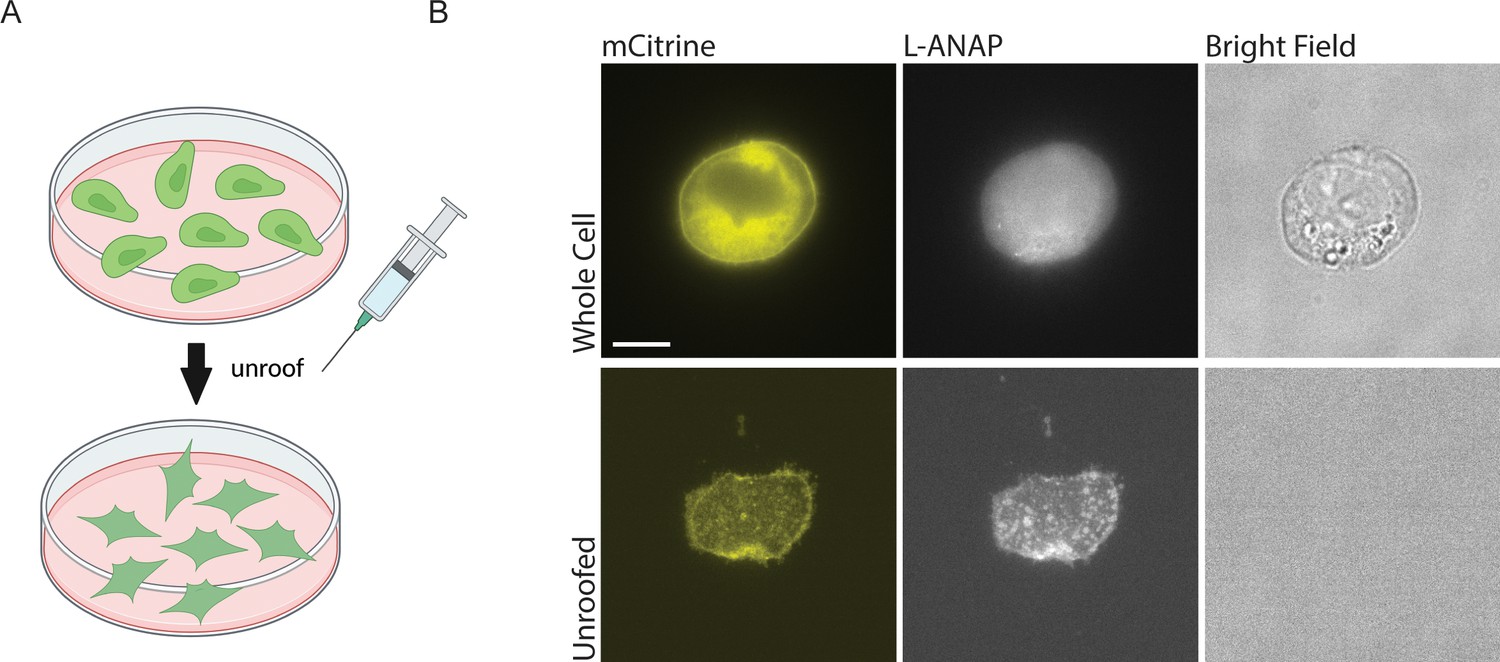
Cell unroofing isolates the plasma membrane for imaging.
(A) Cartoon schematic of unroofing method used. Cultured CHO-K1 cells are washed with DPBS before being subjected to a constant stream of buffer using a needle and syringe to remove the non-adhered portion of the cells (Created with Biorender.com). (B) Representative fluorescent and bright field images at 60 x of whole cell (top) and unroofed (bottom) expressing rASIC1a-G11TAG. The scale bar in the top left is 10 μm and applies to all panels in B.
Figure 5
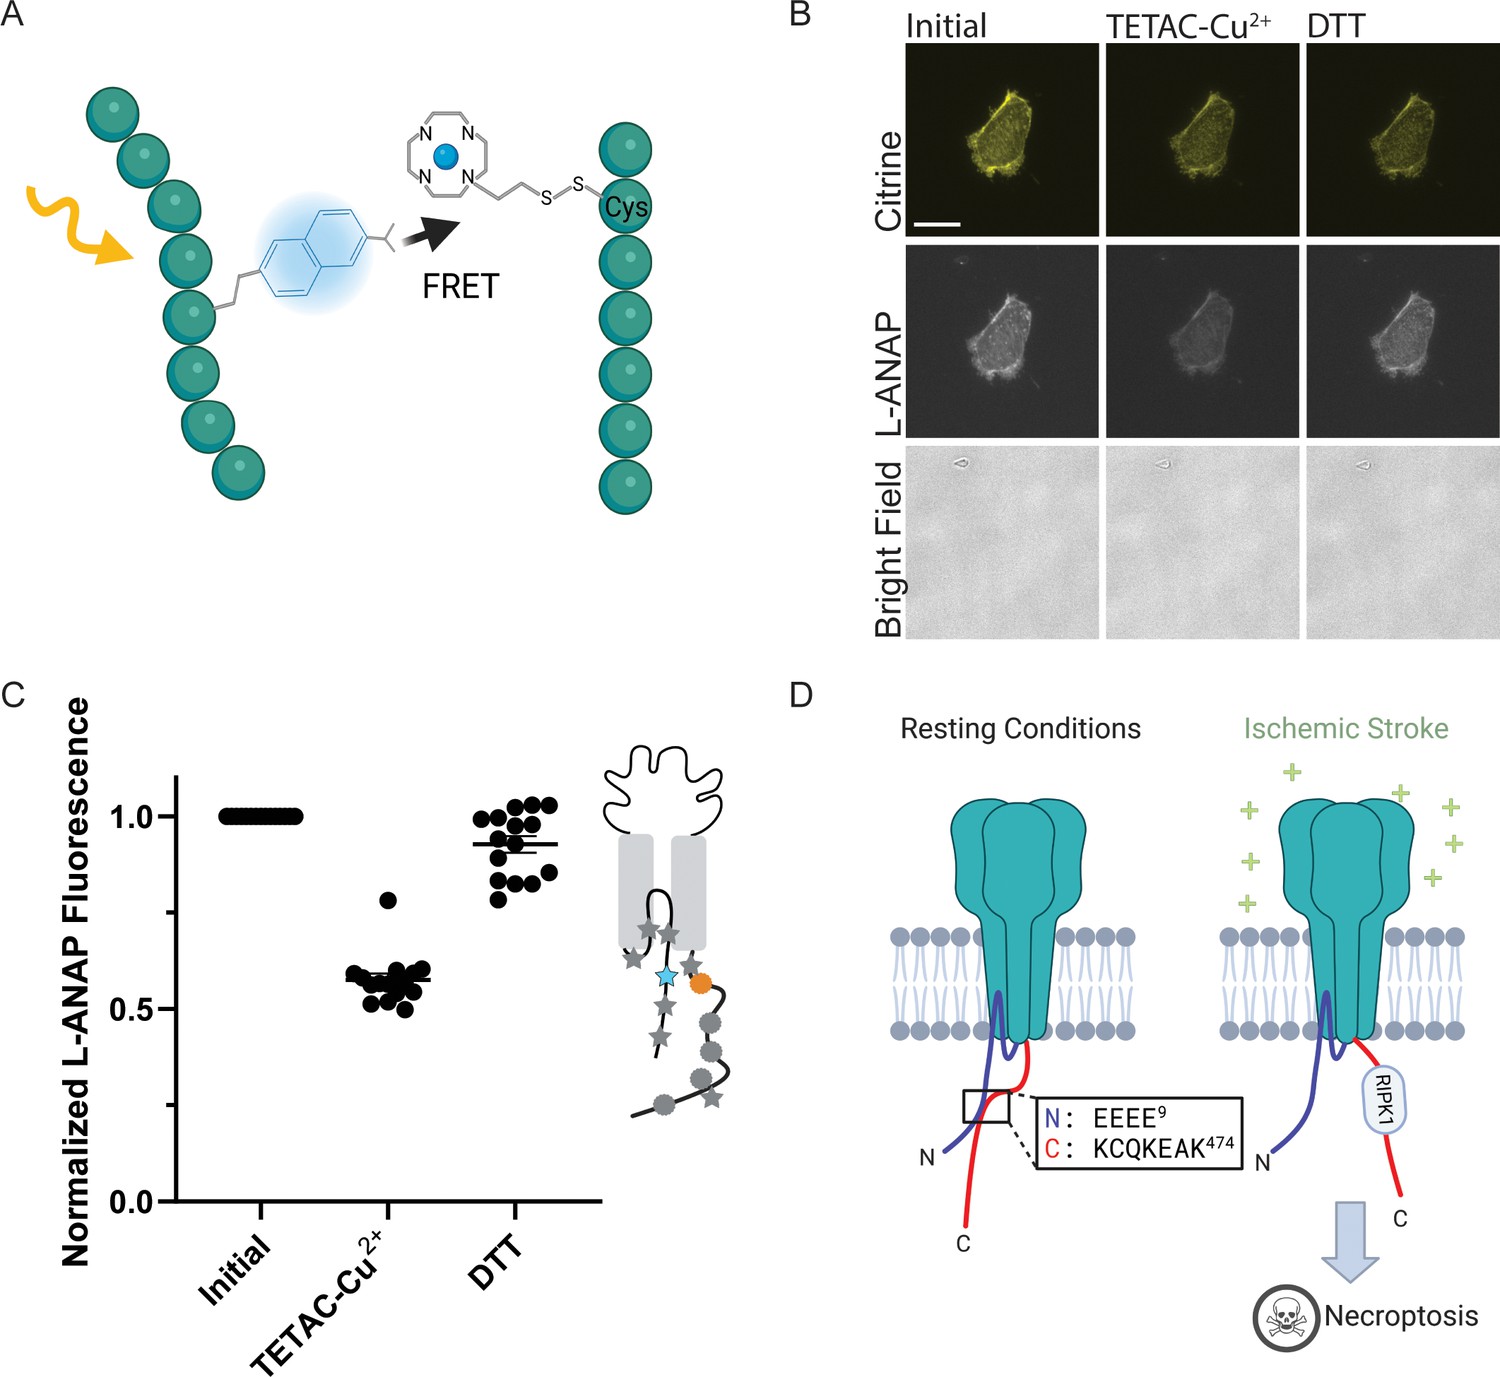
ACCuRET measures short-range distances between the NTD and CTD of ASIC1a.
(A) Cartoon showing the ACCuRET approach (Created with Biorender.com). (B) Representative ACCuRET experiment. Fluorescence and bright field images at 60 x of rASIC1a-Q14TAG at pH 6. In brief, the first image is taken in control buffer at pH 6. This is followed by washing on TETAC preloaded with Cu2+ and then washout of the excess Cu2+-TETAC. The second image is then taken which shows a decrease in L-ANAP fluorescence indicative of FRET. Finally, Cu2+-TETAC is removed by adding DTT and the final image is taken where the L-ANAP fluorescence is restored. mCitrine bleaches across all three images and the bright field is blank, indicating the cell is successfully unroofed. The scale bar in the top left is 10 μm and applies to all panels in B. (C) Normalized FRET efficiency for example experiment in B. Signals are normalized to fluorescence before addition of metal ions. The inset cartoon shows the position of L-ANAP denoted by a blue star and the single cysteine denoted by an orange circle. Grey symbols represent other positions that are mutated in this study in order to show the relative position mutated in this example. In this instance, L-ANAP is incorporated at Q14 and the single cysteine in the C-terminus is at position C469. (D) Cartoon illustrating the current hypothesis of the orientation between the NTD and CTD at rest (left) and after prolonged acidosis (right). The inset sequence shows the putative interaction between the intracellular domains.
Figure 6
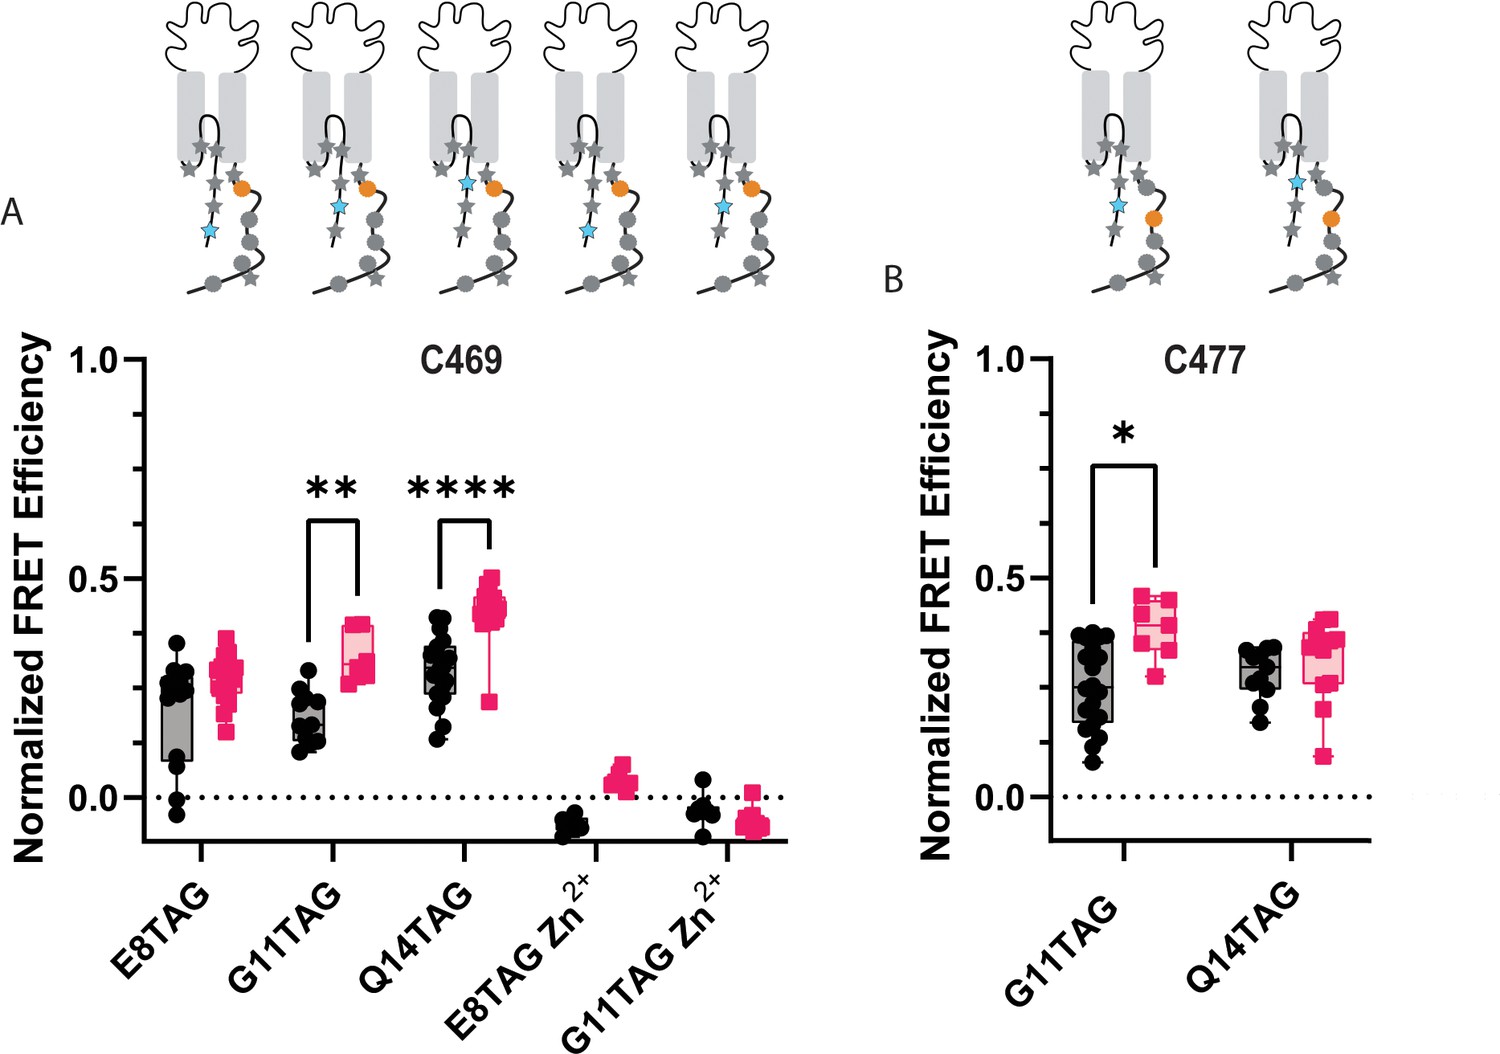
ACCuRET reveals the NTD and CTD likely do not form a complex at rest.
(A) Normalized FRET efficiency between L-ANAP on the NTD and Cu2+-TETAC at position C469 at pH 8 (black) and pH 6 (red). FRET efficiencies, SEM, N and calculated distances are summarized in Table 2. Zn2+-TETAC negative control for positions E8 and G11 shows that the changes in signal measured with Cu2+-TETAC are due the presence of Cu2+ and not due to any other changes. (B) Normalized FRET efficiency between L-ANAP on the NTD and Cu2+-TETAC at position C477 at pH 8 (black) and pH 6 (red). The inset cartoons show the position of L-ANAP denoted by a blue star and the single cysteine denoted by an orange circle. Box and whisker plot with whiskers ranging from minimum to maximum values and the bottom and top edges of the box denoting the 25th and 75th quartiles, respectively. Statistical significance shown using two-way ANOVA with Tukey’s multiple comparisons test are denoted between relevant comparison using appropriate asterisks. Ns indicates p>0.05, * indicates p≤0.05, ** indicates p≤0.01, *** indicates p≤0.001, **** indicates p≤0.0001. 6<N<21 for conditions shown here. Table 2 and source data show exact N for each condition.
-
Figure 6—source data 1
P-Values of relevant comparisons between NTD TAG positions with cysteine at C469 and C477 at pH 8 and pH6.
P values were calculated using a two-way ANOVA with Tukey’s multiple comparisons test.
- https://cdn.elifesciences.org/articles/90755/elife-90755-fig6-data1-v1.xlsx
Figure 7 with 1 supplement
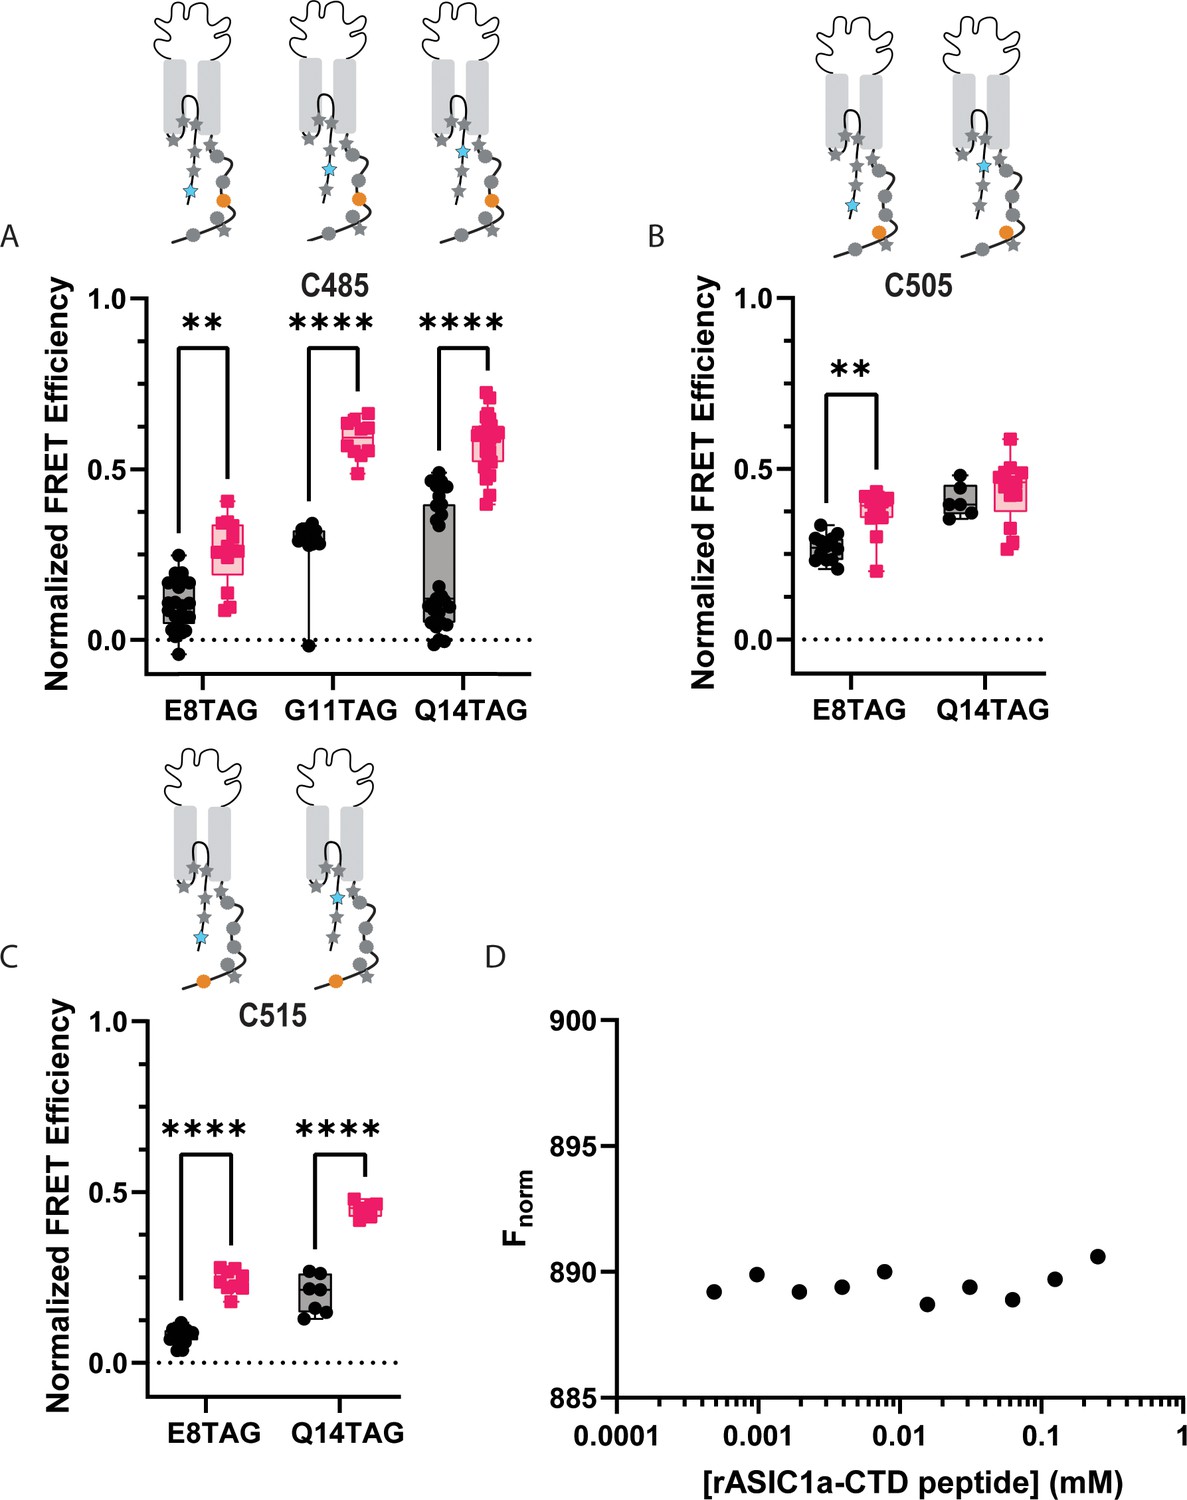
ACCuRET does not suggest an interaction between the NTD and more distal positions on the CTD.
(A) Normalized FRET efficiency between L-ANAP on the NTD and Cu2+-TETAC at position C485 at pH 8 (black) and pH 6 (red). FRET efficiencies, SEM, N and calculated distances are summarized in Table 2. (B) Normalized FRET efficiency between L-ANAP on the NTD and Cu2+-TETAC at position C505 at pH 8 (black) and pH 6 (red). (C) Normalized FRET efficiency between L-ANAP on the NTD and Cu2+-TETAC at position C515 at pH 8 (black) and pH 6 (red). (D) Representative binding curve for peptides of the NTD and CTD generated using MST. No indication of binding up to 250 μM. Box and whisker plot with whiskers ranging from minimum to maximum values and the bottom and top edges of the box denoting the 25th and 75th quartiles, respectively. Statistical significance shown using two-way ANOVA with Tukey’s multiple comparisons test are denoted between relevant comparison using appropriate asterisks. Ns indicates p>0.05, * indicates p≤0.05, ** indicates p≤0.01, *** indicates p≤0.001, **** indicates p≤0.0001. 6<N<27 for conditions shown here. Table 2 and source data show exact N for each condition.
-
Figure 7—source data 1
P-Values of relevant comparisons between NTD TAG positions with cysteine at C485, C505, and C515 at pH 8 and pH6.
P values were calculated using a two-way ANOVA with Tukey’s multiple comparisons test.
- https://cdn.elifesciences.org/articles/90755/elife-90755-fig7-data1-v1.xlsx
Figure 7—figure supplement 1
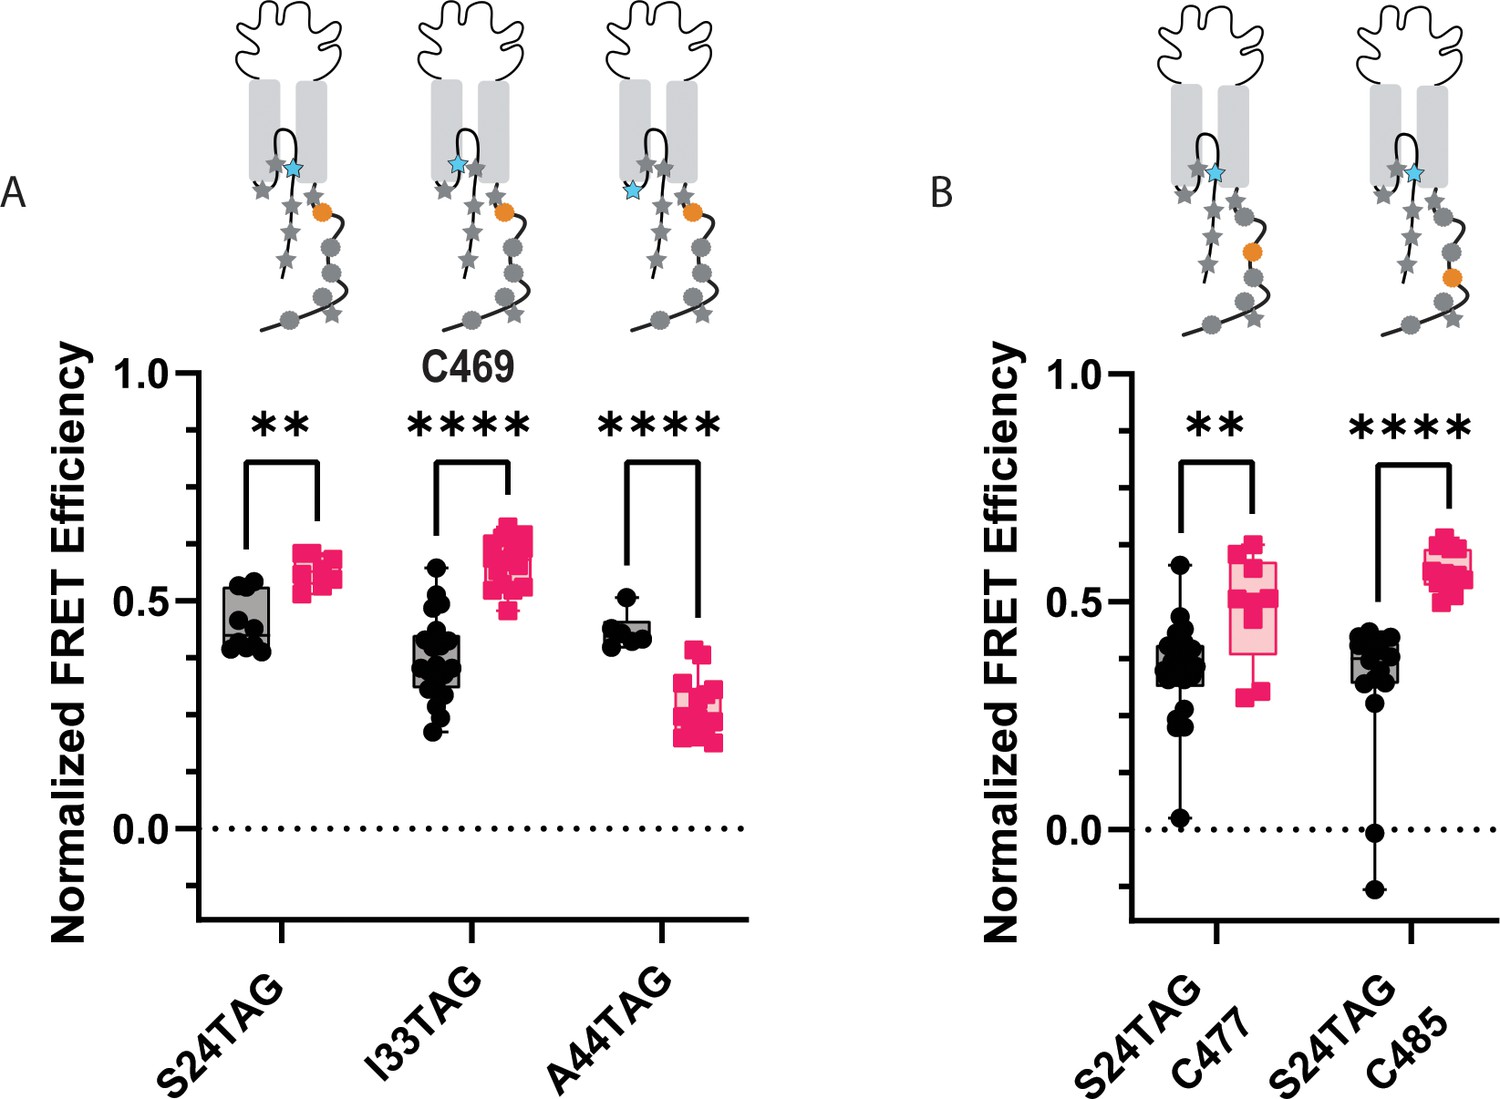
FRET between the reentrant loop and the CTD.
(A) Normalized FRET efficiency between L-ANAP in the reentrant loop and Cu2+-TETAC at position C469 at pH 8 (black) and pH 6 (red). FRET efficiencies, SEM, N and calculated distances are summarized in Table 2. (B) Normalized FRET efficiency between L-ANAP incorporated at S24 and Cu2+-TETAC at either C477 or C485. Box and whisker plot with whiskers ranging from minimum to maximum values and the bottom and top edges of the box denoting the 25th and 75th quartiles, respectively. Statistical significance shown using two-way ANOVA with Tukey’s multiple comparisons test are denoted between relevant comparison using appropriate asterisks. Ns indicates p>0.05, * indicates p≤0.05, ** indicates p≤0.01, *** indicates p≤0.001, **** indicates p≤0.0001. 6<N<21 for conditions shown here. Table 2 and source data show exact N for each condition.
Figure 8
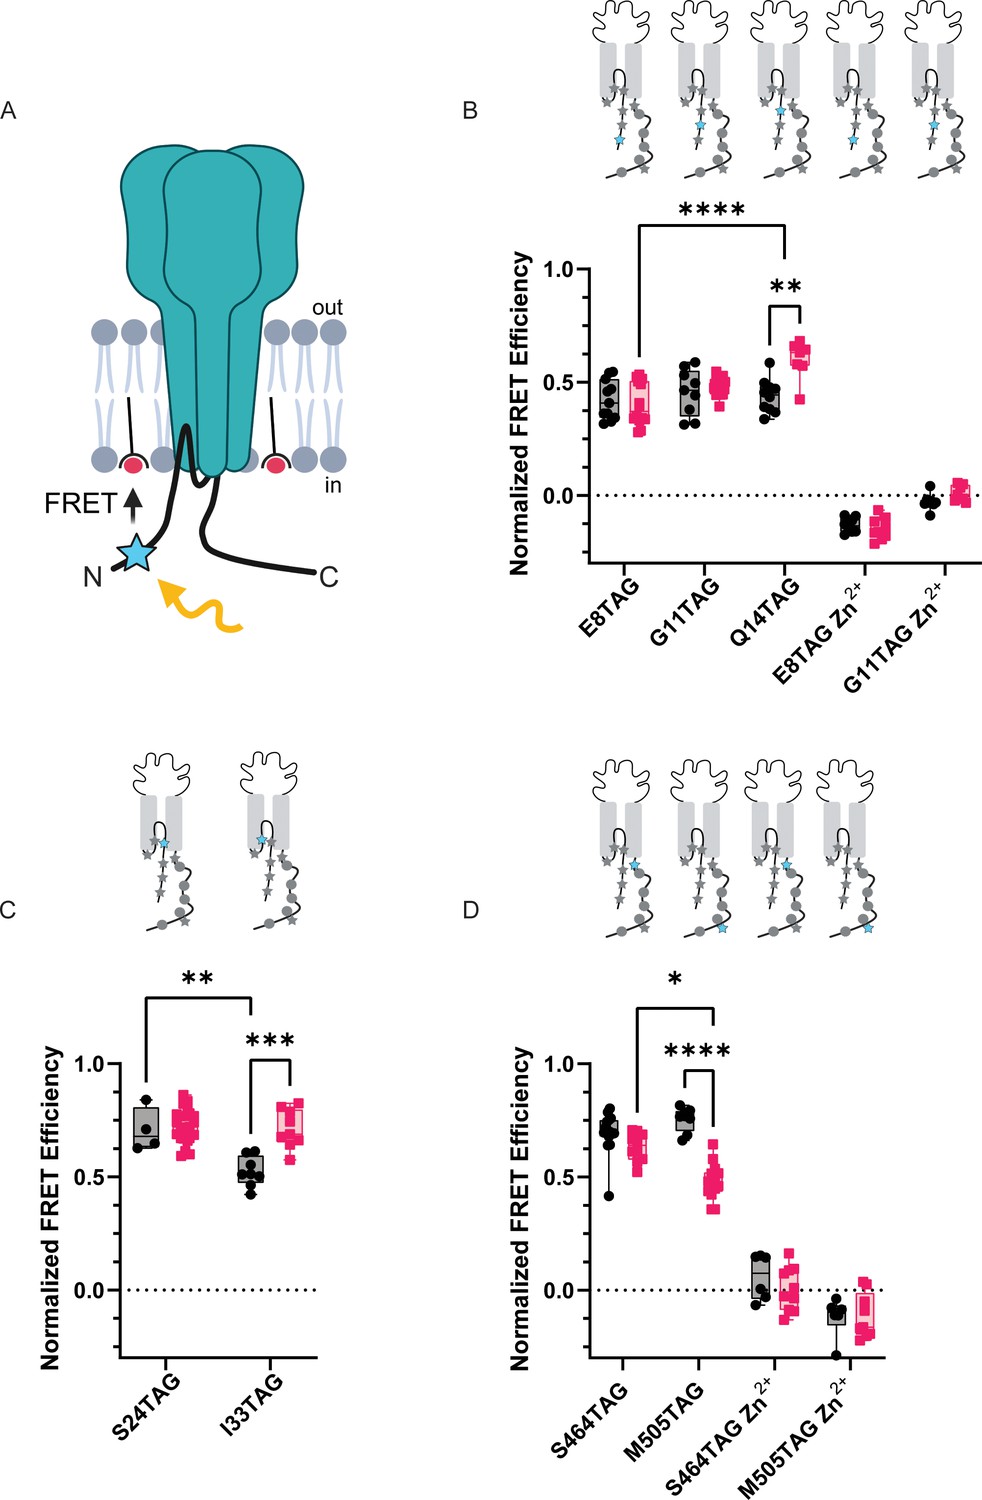
memFRET reveals that the NTD and CTD make frequent sojourns near the plasma membrane.
(A) Cartoon illustrating memFRET in unroofed cells between L-ANAP incorporated into the protein backbone and multiple C18-Co2+ incorporated into the plasma membrane (Created with Biorender.com). (B) Normalized FRET efficiency from memFRET experiments between L-ANAP at two sites in the re-entrant loop very near the plane of the intracellular leaflet of the plasma membrane. (C) Normalized FRET efficiency from memFRET experiments between L-ANAP on the NTD and Co2+-C18-NTA at pH 8 (black) and pH 6 (red). Zn2+-C18-NTA negative control for positions E8TAG and G11TAG shows that the changes in signal measured with Co2+-C18 are primarily due the presence of Co2+ and not to any other changes. (D) Normalized FRET efficiency from memFRET experiments between L-ANAP on the CTD and Co2+-C18-NTA at pH 8 (black) and pH 6 (red). Each data point represents FRET efficiency measured within a single cell at either pH 8 in black or pH 6 in red. FRET efficiencies, SEM, N and calculated distances are summarized in Table 2. Statistical significance shown using two-way ANOVA with Tukey’s multiple comparisons test are denoted between relevant comparison using appropriate asterisks. Ns indicates p>0.05, * indicates p≤0.05, ** indicates p≤0.01, *** indicates p≤0.001, **** indicates p≤0.0001. 6<N<15 for conditions shown here. Table 2 and source data show exact N for each condition.
-
Figure 8—source data 1
p-Values of relevant comparisons between FRET involving the NTD or CTD TAG positions with metal ions in the plasma membrane at pH 8 and pH6.
p Values were calculated using a two-way ANOVA with Tukey’s multiple comparisons test.
- https://cdn.elifesciences.org/articles/90755/elife-90755-fig8-data1-v1.xlsx
Figure 9
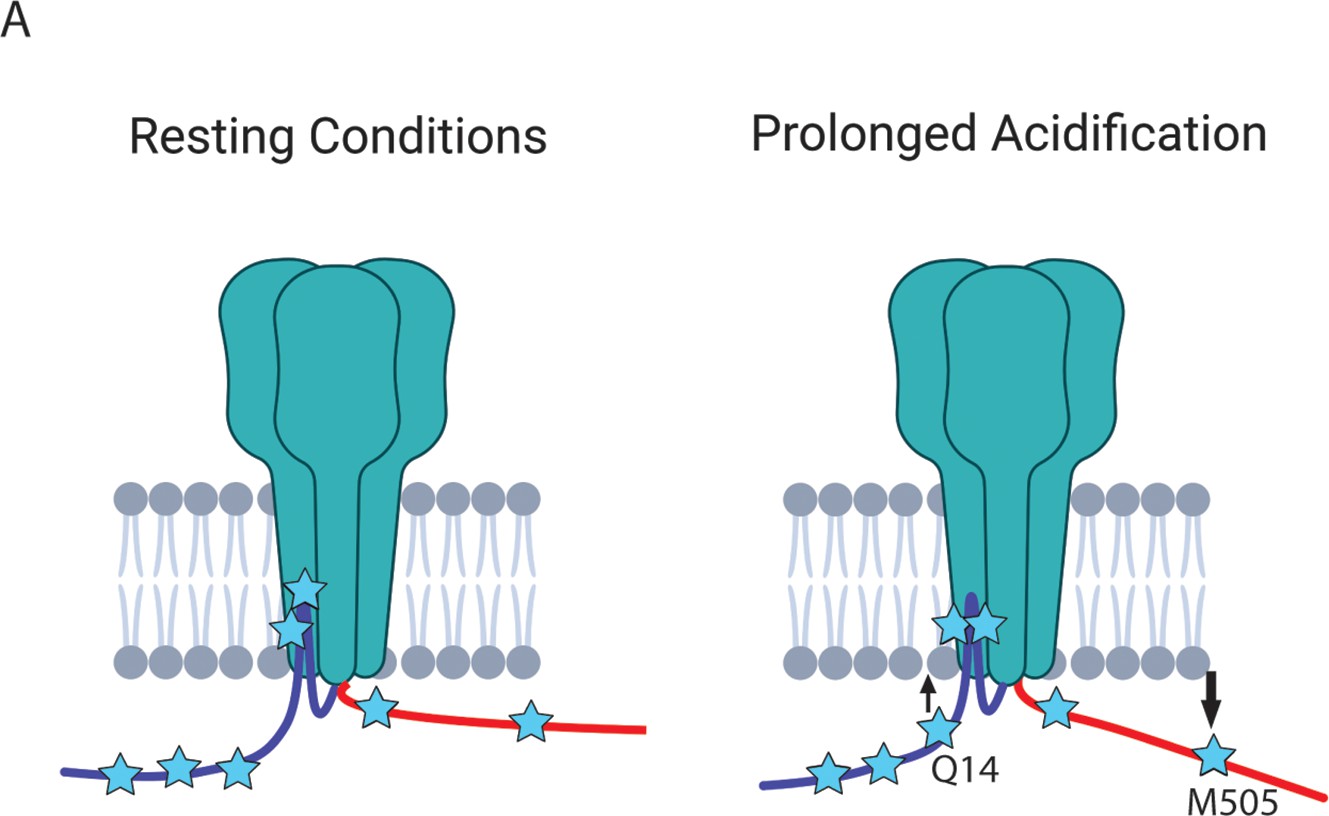
The NTD and CTD of ASIC1a likely do not interact.
(A) Cartoon schematic of axial movements of the N- and C-termini relative to the membrane at rest and prolonged acidification. The proximal NTD moves slightly closer to the membrane while the proximal CTD moves away during acidification.
Tables
Table 1
R0 values calculated for Cu2+-TETAC and Co2+-C18-NTA using Equation 3 at pH 8 and pH 6.
| pH 8 | pH 6 | |
|---|---|---|
| ACCuRET | 17.6 | 17.2 |
| memFRET | 12.4 | 12.6 |
Table 2
Mean normalized FRET efficiency ± SEM for each TAG position relative to each cysteine (ACCuRET) or the membrane (memFRET) measured at pH 8 and pH 6.
Distances were calculated with Equation 4.
| pH 8 | pH 6 | |||||||||
|---|---|---|---|---|---|---|---|---|---|---|
| TETAC Position | TAG position | mean normalized FRET efficiency | SEM | N | Distance (Å) | mean normalized FRET efficiency | SEM | N | Distance (Å) | |
| E8TAG | 0.20 | 0.03 | 13 | 22 | 0.27 | 0.01 | 17 | 20 | ||
| G11TAG | 0.18 | 0.02 | 11 | 23 | 0.32 | 0.02 | 6 | 20 | ||
| Q14TAG | 0.29 | 0.02 | 18 | 20 | 0.43 | 0.02 | 15 | 18 | ||
| C469 | S24TAG | 0.45 | 0.02 | 10 | 18 | 0.57 | 0.01 | 8 | 16 | |
| I33TAG | 0.37 | 0.02 | 21 | 19 | 0.58 | 0.01 | 17 | 16 | ||
| A44TAG | 0.43 | 0.02 | 6 | 19 | 0.27 | 0.02 | 14 | 20 | ||
| G11TAG | 0.26 | 0.02 | 20 | 21 | 0.38 | 0.03 | 7 | 19 | ||
| C477 | Q14TAG | 0.28 | 0.02 | 11 | 21 | 0.31 | 0.03 | 12 | 20 | |
| ACCuRET | S24TAG | 0.35 | 0.02 | 22 | 20 | 0.49 | 0.04 | 9 | 17 | |
| E8TAG | 0.11 | 0.02 | 22 | 25 | 0.26 | 0.03 | 13 | 21 | ||
| C485 | G11TAG | 0.28 | 0.02 | 14 | 21 | 0.59 | 0.02 | 10 | 16 | |
| Q14TAG | 0.21 | 0.04 | 27 | 22 | 0.58 | 0.02 | 23 | 16 | ||
| S24TAG | 0.32 | 0.04 | 16 | 19 | 0.57 | 0.01 | 13 | 16 | ||
| E8TAG | 0.27 | 0.01 | 12 | 21 | 0.37 | 0.02 | 13 | 19 | ||
| C505 | Q14TAG | 0.41 | 0.02 | 6 | 19 | 0.43 | 0.03 | 13 | 18 | |
| E8TAG | 0.08 | 0.01 | 14 | 26 | 0.24 | 0.01 | 9 | 21 | ||
| C515 | Q14TAG | 0.20 | 0.02 | 7 | 22 | 0.45 | 0.01 | 7 | 18 | |
| ACCuRET Zn2+ controls | C469 | E8TAG | –0.06 | 0.01 | 6 | N/A | 0.04 | 0.01 | 8 | N/A |
| G11TAG | –0.03 | 0.01 | 8 | N/A | –0.05 | 0.01 | 10 | N/A | ||
| E8TAG | 0.42 | 0.03 | 11 | 10 | 0.40 | 0.03 | 14 | 11 | ||
| G11TAG | 0.46 | 0.03 | 9 | 10 | 0.48 | 0.01 | 15 | 9 | ||
| N/A | Q14TAG | 0.44 | 0.02 | 10 | 10 | 0.60 | 0.03 | 7 | 6 | |
| S24TAG | 0.74 | 0.04 | 4 | ≤5 | 0.72 | 0.02 | 24 | ≤5 | ||
| memFRET | I33TAG | 0.52 | 0.02 | 8 | 8 | 0.71 | 0.03 | 9 | ≤5 | |
| S464TAG | 0.69 | 0.02 | 15 | ≤5 | 0.63 | 0.02 | 10 | ≤5 | ||
| N/A | M505TAG | 0.75 | 0.02 | 8 | ≤5 | 0.48 | 0.02 | 14 | 9 | |
| MemFRET Zn2+ controls | N/A | E8TAG | –0.13 | 0.01 | 8 | N/A | –0.15 | 0.02 | 9 | N/A |
| G11TAG | –0.03 | 0.01 | 8 | N/A | 0.01 | 0.01 | 9 | N/A | ||
| S464TAG | 0.06 | 0.04 | 6 | N/A | 0.01 | 0.03 | 10 | N/A | ||
| M505TAG | –0.12 | 0.04 | 6 | N/A | –0.12 | 0.03 | 9 | N/A | ||
Key resources table
| Reagent type (species) or resource | Designation | Source or reference | Identifiers | Additional information |
|---|---|---|---|---|
| Cell line (Cricetulus griseus) | CHO-K1 | ATCC | ATCC CCL-61 RRID:CVCL_0214 | |
| Recombinant DNA reagent | pANAP | Addgene: DOI: 10.1021/ja4059553 | Addgene: 48696 | |
| Recombinant DNA reagent | peRF1-E55D | Jason Chin Laboratory, MRC Laboratory of Molecular Biology, DOI: 10.1021/ja5069728 | ||
| Recombinant DNA reagent | rASIC1acDPCitrine.pCMV | Twist Bioscience | ||
| Recombinant DNA reagent | rASIC1acDPCitrine.pCMV TAG and Cysteine mutants | This paper | Primers available upon request | |
| Antibody | Purified Rabbit Anti-GFP, polyclonal | Torrey Pines Biolabs | Torrey Pines Biolabs Cat# TP401 071519, RRID:AB_10013661 | Western blots (1:5000) |
| Antibody | IRDye 680Rd Goat anti-Rabbit IgG, polyclonal | LI-COR Biosciences | LI-COR Biosciences Cat# 926–68071, RRID:AB_10956166 | Western blots (1:15,000) |
| Chemical Compound | 1-(2-pyridin-2-yldisulfanyl)ethyl)–1,4,7,10-tetraazacyclododecane (TETAC) | Toronto Research Chemicals | Toronto Research Chemicals Cat#P991915 | |
| Chemical Compound | N2,N2-bis(carboxymethyl)-N6-(1-oxooctadecyl)-l-lysine, C18-NTA | Toronto Research Chemicals | Toronto Research Chemicals Cat#S686540 | |
| Chemical Compound | L-ANAP-OMe | AsisChem Inc. | AsisChem Inc Cat#0146 | |
| Peptide | rASIC1a C-terminus | LifeTein | ||
| Software, Algorithm | pClamp and clampfit | Molecular Devices | RRID:SCR_011323 | |
| Software, Algorithm | Graphpad Prism 8 | Graphpad | RRID:SCR_002798 | |
| Software, Algorithm | ImageJ | NIH DOI: https://doi.org/10.1038/nmeth.2089 | RRID:SCR_003070 |
Additional files
Download links
A two-part list of links to download the article, or parts of the article, in various formats.
Downloads (link to download the article as PDF)
Open citations (links to open the citations from this article in various online reference manager services)
Cite this article (links to download the citations from this article in formats compatible with various reference manager tools)
Dynamic landscape of the intracellular termini of acid-sensing ion channel 1a
eLife 12:RP90755.
https://doi.org/10.7554/eLife.90755.3


