Secreted dengue virus NS1 from infection is predominantly dimeric and in complex with high-density lipoprotein
- Lee Kong Chian School of Medicine, Nanyang Technological University, Singapore
- NTU Institute of Structural Biology, Nanyang Technological University, Singapore
- Program in Emerging Infectious Diseases, Duke-NUS Medical School, Singapore
- Functional Proteomics Laboratory, Institute of Molecular and Cell Biology, Agency for Science, Technology and Research, Singapore
- Department of Biological Sciences, National University of Singapore, Singapore
- Singapore Centre for Life Sciences, Department of Biochemistry, National University of Singapore, Singapore
- Department of Infectious Diseases, Singapore General Hospital, Singapore
- Yong Loo Lin School of Medicine, National University of Singapore, Singapore
- Saw Swee Hock School of Public Health, National University of Singapore, Singapore
- School of Biological Sciences, Nanyang Technological University, Singapore
- Department of Microbiology and Immunology, National University of Singapore, Singapore
- Institute for Glycomics (G26), Griffith University Gold Coast Campus, Australia
Figures
Figure 1 with 4 supplements
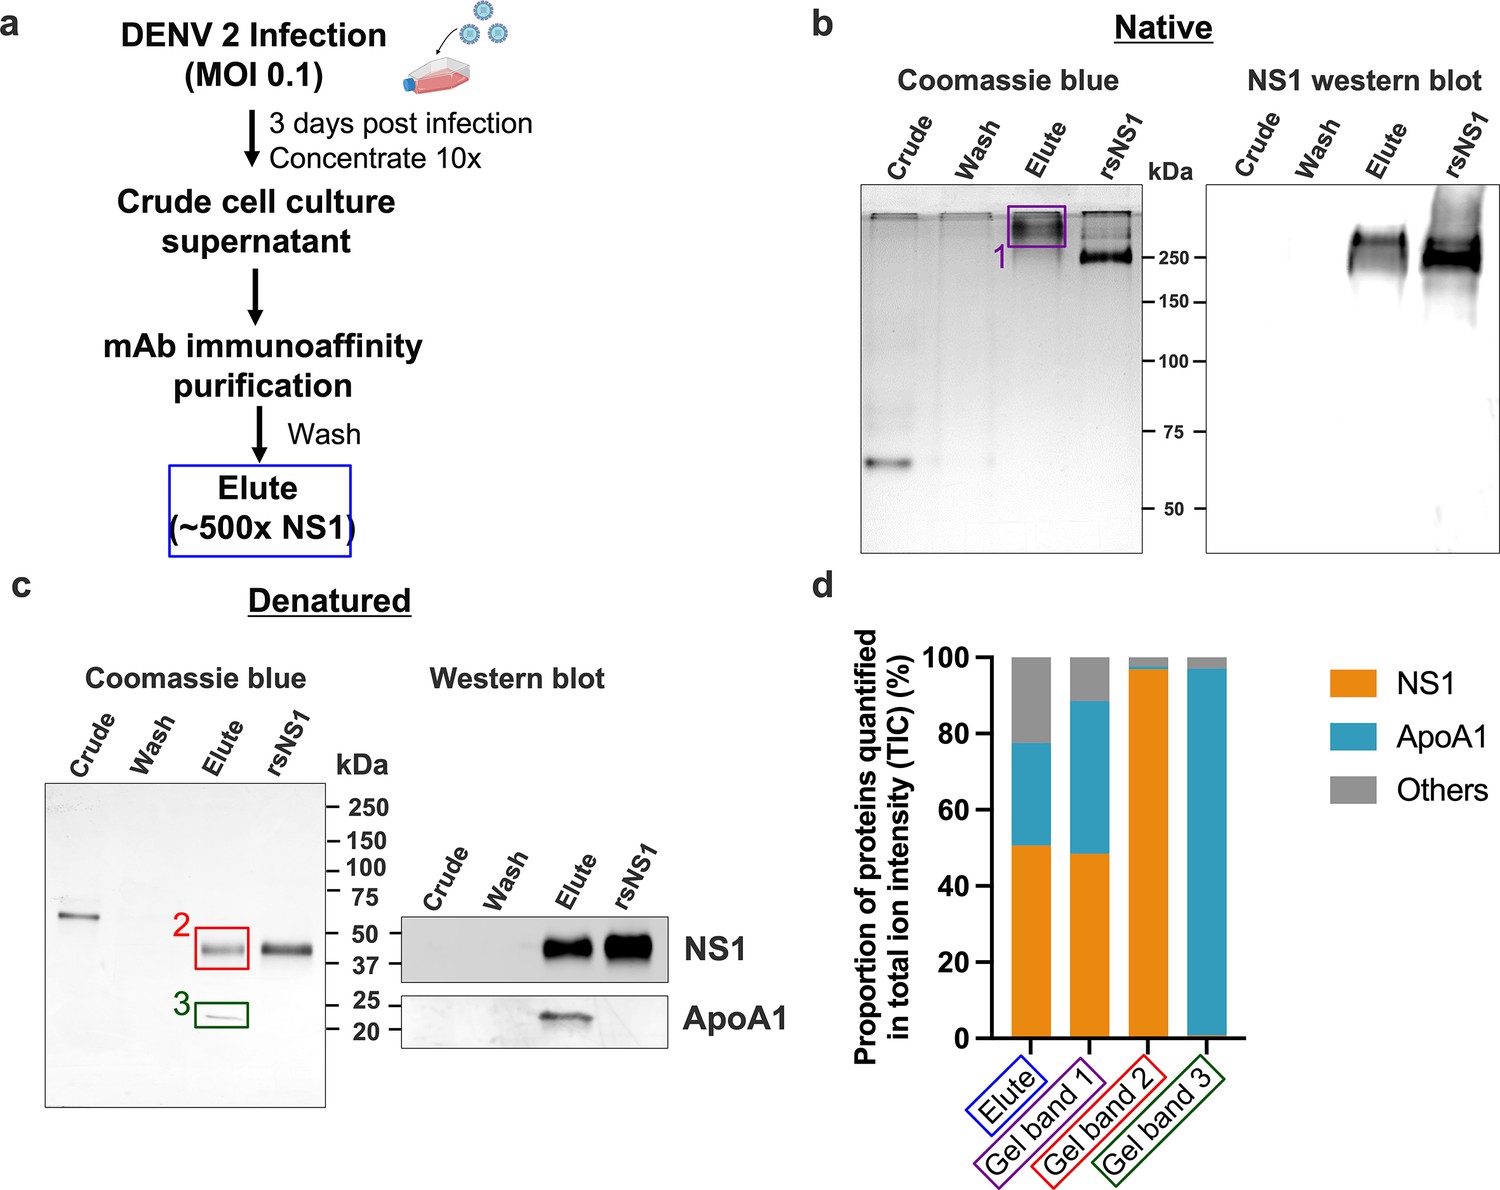
Composition of the secreted NS1 from dengue virus (DENV)-infected Vero cells.
DENV 2 WT cell culture supernatant was filtered, supplemented with protease inhibitor cocktail and 0.05% sodium azide, concentrated using a 100 kDa MWCO Vivaflow cassette and purified using 56.2 anti-NS1 antibody immunoaffinity chromatography. The eluted isNS1wt was dialyzed against PBS, concentrated, and stored at –80°C until further use. (a) Schematic of isNS1 purification to illustrate the samples used for gel analyses. % NS1 is measured by the total amount of NS1 (quantified using the anti-NS1 ELISA kit [Bio-Rad] as a percentage of total protein [quantified using the Bradford assay]) found in each sample. Details of the % enrichment in NS1 along the purification process are as shown in Figure 1—figure supplement 1b. (b) Coomassie blue detection of proteins from crude, wash, and elute immunoaffinity fractions for isNS1wt, with the recombinant sNS1 (rsNS1) obtained from Shu et al., 2022 as a positive control, after separation on a 10% Native-PAGE gel (left). The crude and elute fractions contain 1 µg of total protein. The wash fraction contains approximately 100 ng of total protein in maximum well volume of the gel. The same set of samples were also subjected to a western blot detection of NS1 using 56.2 anti-NS1 antibody after separation on a 10% Native-PAGE (right). The crude and elute fractions contain 500 ng of total protein. The wash fraction contains approximately 100 ng of total protein in maximum well volume of the gel. (c) Coomassie blue detection of proteins from crude, wash, and elute immunoaffinity fractions for isNS1wt and rsNS1 (Shu et al., 2022), after separation on a 4–20% reducing SDS-PAGE gel. The crude and elute fractions contain 1 µg of total protein. The wash fraction contains approximately 100 ng of total protein in maximum well volume of the gel. Similarly, the same set of samples were also subjected to a western blot detection of NS1 and ApoA1 using 56.2 anti-NS1 antibody or ApoA1 antibody (Biorbyt, orb10643), respectively, after separation on a 4–20% reducing SDS-PAGE (right). (d) In-gel protein identification of the purified isNS1wt by liquid chromatography mass spectrometry (LC-MS). Proportion of NS1, ApoA1 and other unidentified proteins quantified in total ion intensity, obtained from the following samples: elute in solution (boxed in blue), 250 kDa gel band (boxed in purple), 50 kDa gel band (boxed in red), and 25 kDa gel band (green). The boxed gel bands are from representative gels showing the different protein species found while the actual gel bands used for protein identification by LC-MS are as shown in Figure 1—figure supplement 2a and b.
-
Figure 1—source data 1
Raw and annotated image for the PAGE gel stained in Coomassie blue.
- https://cdn.elifesciences.org/articles/90762/elife-90762-fig1-data1-v1.pdf
-
Figure 1—source data 2
Raw and annotated image for the western blot analysis (anti-NS1).
- https://cdn.elifesciences.org/articles/90762/elife-90762-fig1-data2-v1.pdf
-
Figure 1—source data 3
Raw and annotated image for the PAGE gel stained in Coomassie blue in Figure 1c.
- https://cdn.elifesciences.org/articles/90762/elife-90762-fig1-data3-v1.pdf
-
Figure 1—source data 4
Raw and annotated image for the western blot analysis (anti-NS1) in Figure 1c.
- https://cdn.elifesciences.org/articles/90762/elife-90762-fig1-data4-v1.pdf
-
Figure 1—source data 5
Raw and annotated image for the western blot analysis (anti-ApoA1) in Figure 1c.
- https://cdn.elifesciences.org/articles/90762/elife-90762-fig1-data5-v1.pdf
Figure 1—figure supplement 1
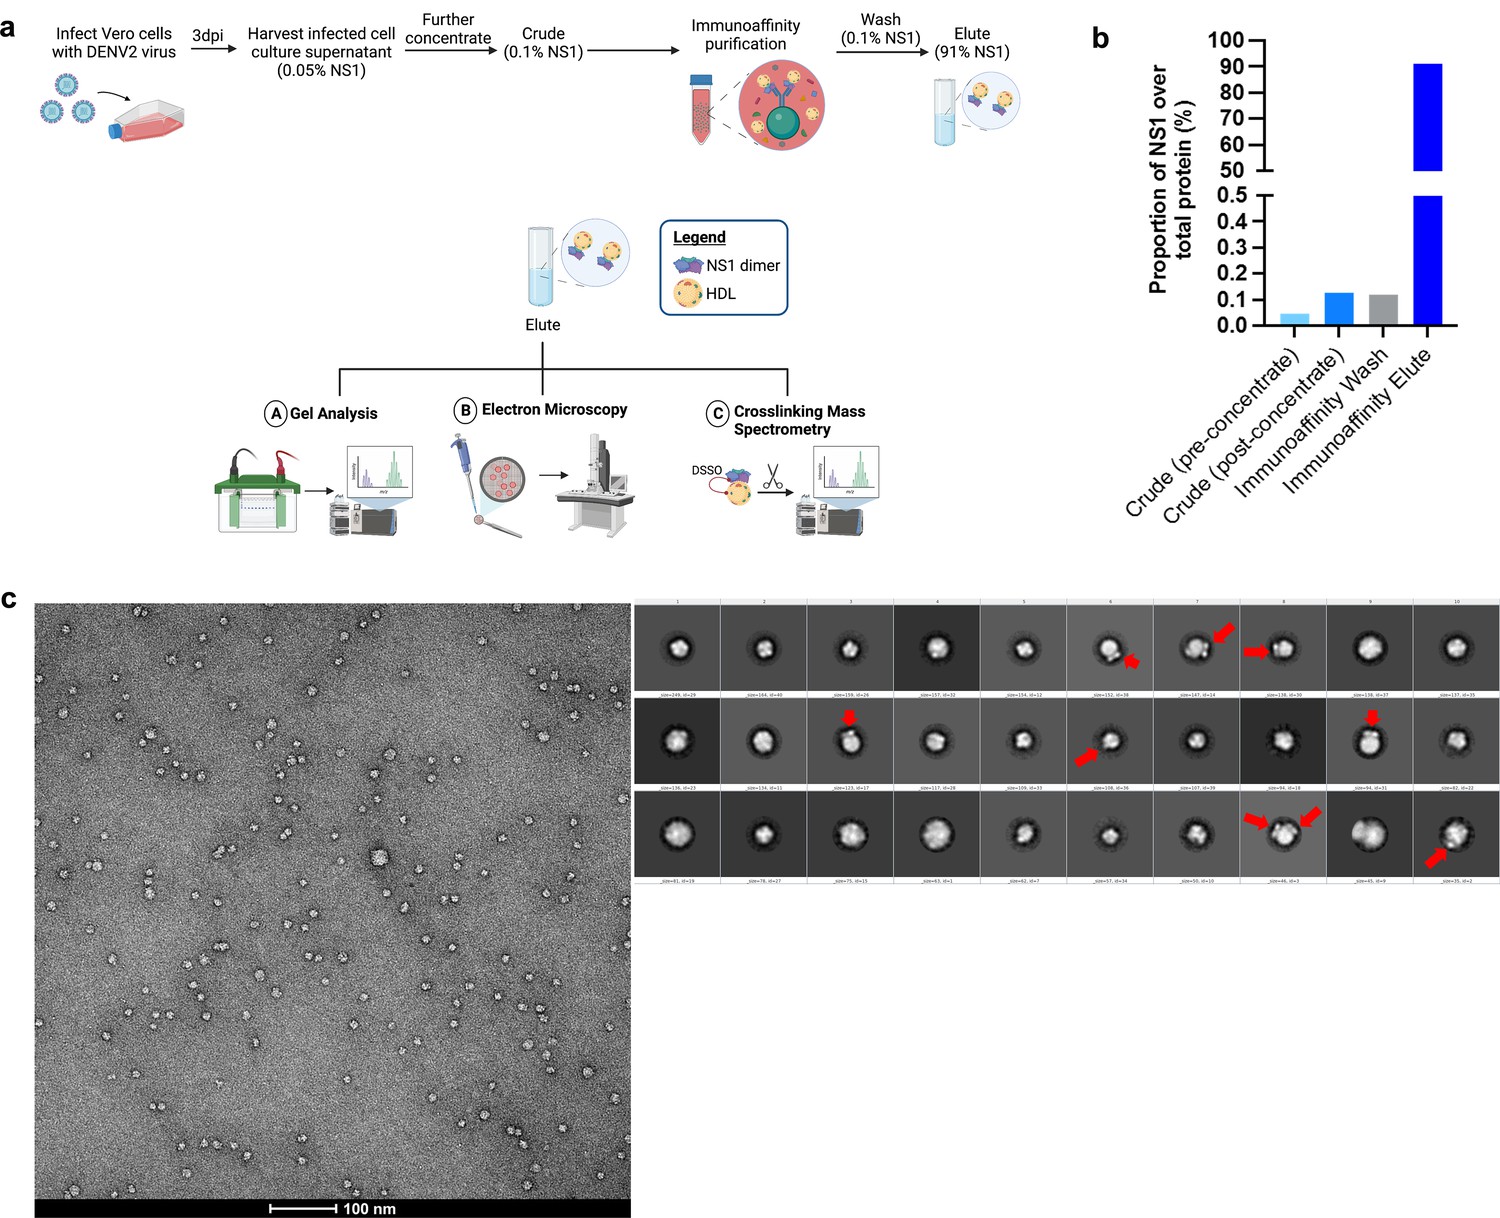
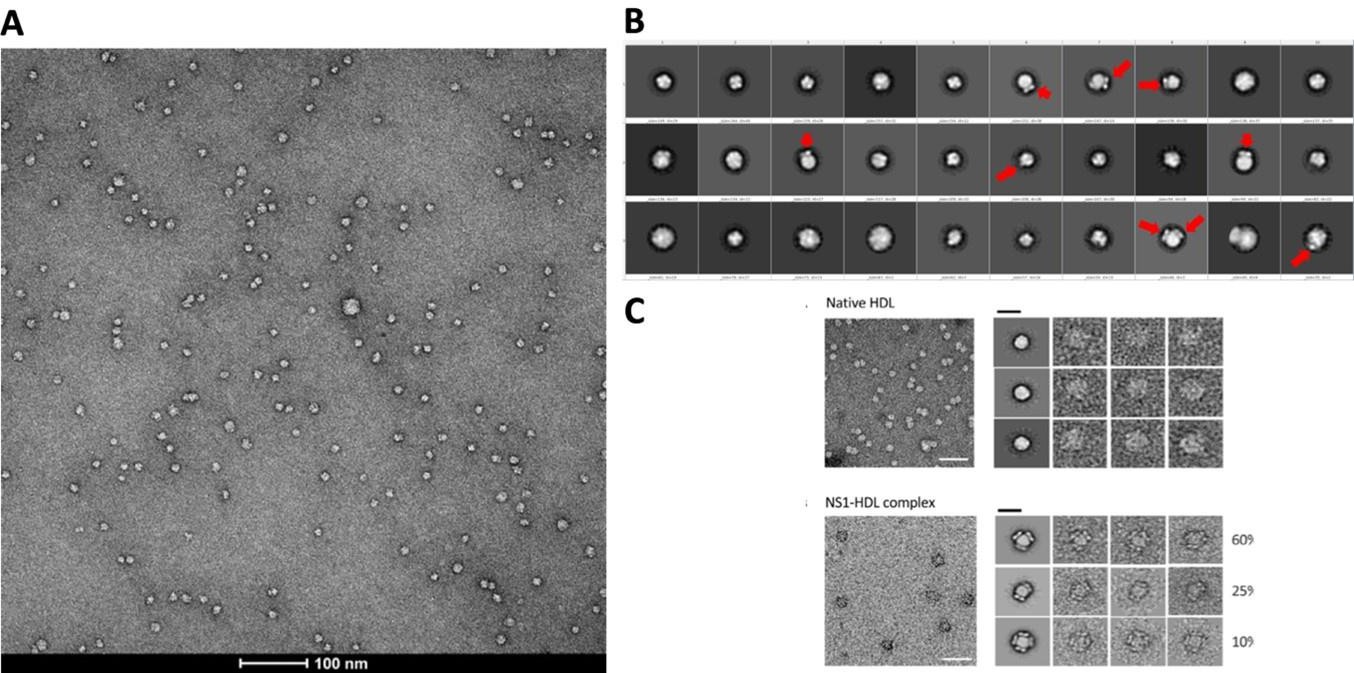
Purification and negative stain electron microscopy screening of in vitro infection-derived sNS1 from infected Vero cells.
(a) Schematic of the isNS1 batch immunoaffinity purification protocol and the downstream analyses used in this article. Infected cell supernatant from Vero cells (either WT or T164S EDEN2) was harvested at 72 hpi, clarified, filtered, supplemented with a protease inhibitor cocktail and 0.05% sodium azide, and finally concentrated using a 100 kDa MWCO Vivaflow cassette attached to a peristaltic pump. isNS1wt or isNS1ts was then batch immunoaffinity purified using the 56.2 anti-NS1 antibody immobilized on the AminoLink resin. The resin was then loaded into a column, washed with at least 10 CV of PBS (pH 7.4), eluted with 0.1 M glycine (pH 2.7), and immediately neutralized with 1 M Tris-HCl (pH 9.0). The eluted protein was then dialyzed against PBS and concentrated using a 100 kDa MWCO Amicon ultracentrifugal unit and stored at –80°C before use. The protein purity was determined via Coomassie blue after separation on a reducing SDS-PAGE. The protein bands observed on the gel were then validated in a western blot against NS1 and ApoA1. Protein quality was also determined via NS1 western blot following separation on a Native-PAGE. Excised bands corresponding to 250 kDa on the Native gel, and 50 kDa and 25 kDa bands on the denatured gel as well as the elute in solution were also subjected to protein identification via liquid chromatography mass spectrometry (LC-MS). Purified isNS1wt and isNS1ts were separately complexed with Fab56.2 and Ab56.2 and analyzed through an analytical size exclusion chromatography to ensure formation of stable complexes for imaging via electron microscopy. Purified isNS1wt and isNS1ts were also crosslinked with disuccinimidyl sulfoxide (DSSO) to determine interaction sites between isNS1 and ApoA1 via LC-MS. (b) Enrichment of NS1 during the immunoaffinity purification process. isNS1wt purification is used as a representative for the isNS1 purification process. The proportion of NS1 over total protein was measured by taking a percentage of the total amount of NS1 measured (using NS1 ELISA) out of the total protein measured (using Bradford assay) in the crude supernatant before concentrating, crude supernatant after concentrating, immunoaffinity PBS wash and finally in the immunoaffinity elute after buffer exchange against PBS and further concentrating. There is an approximately 455-fold enrichment of NS1 from the concentrated crude supernatant to the immunoaffinity elute. (c) Representative negative stain electron micrograph of isNS1 image on a 120 kV FEI Tecnai T12 equipped with an Eagle 4 mega pixel CCD camera. The corresponding 2D classes from the particles picked are shown on the right, red arrows highlighting the NS1 dimer protruding out of the spherical density.
© 2024, BioRender Inc. Figure 1—figure supplement 1a was created using BioRender, and is published under a CC BY-NC-ND license. Further reproductions must adhere to the terms of this license.
Figure 1—figure supplement 2
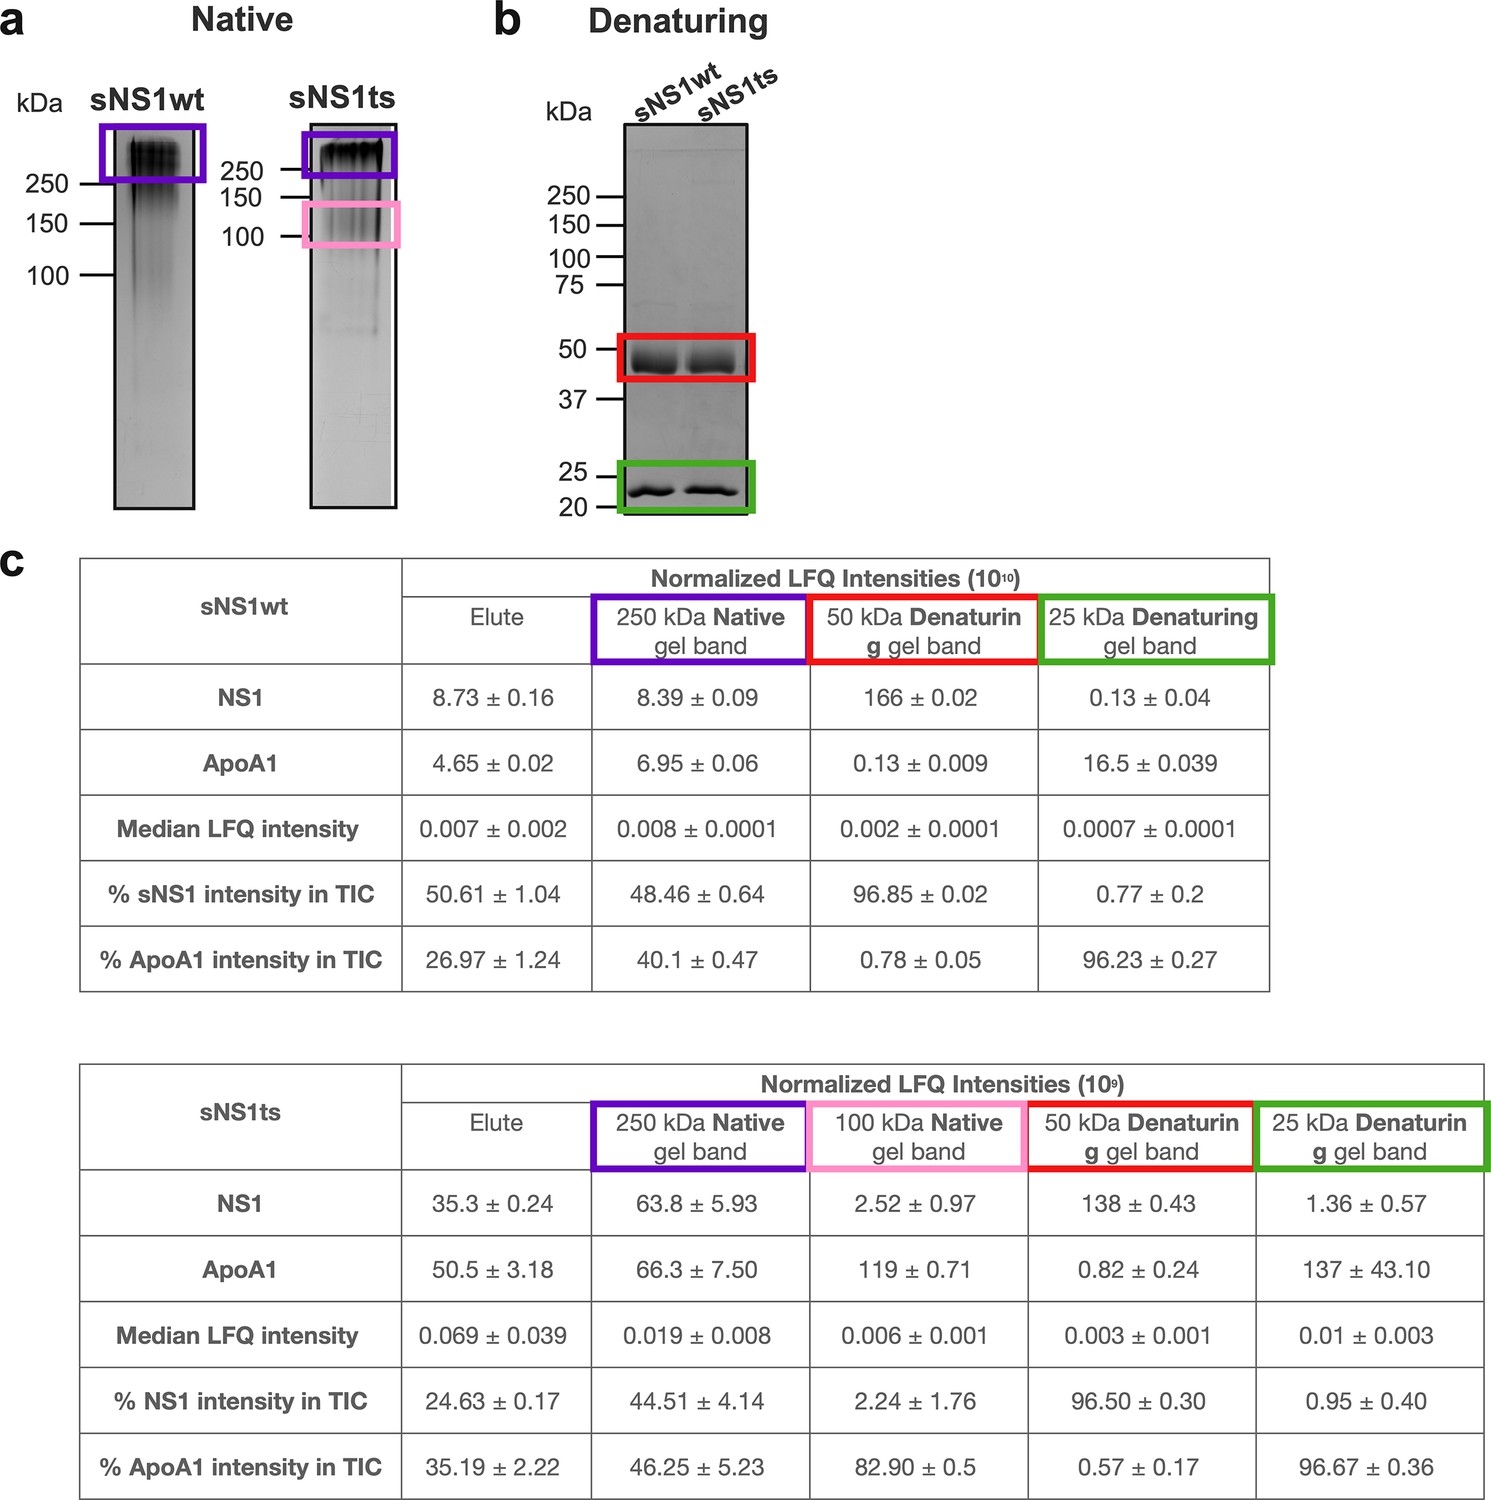
Protein identification analysis of excised gel bands via liquid chromatography mass spectrometry (LC-MS).
(a) Coomassie blue detection of proteins of immunoaffinity-purified isNS1wt and isNS1ts (elute) after separation on a 10% Native-PAGE. The 250 kDa bands (purple) that were present in both isNS1wt and isNS1ts, as well as the 100 kDa band (pink) that was present only in isNS1ts, were excised for protein identification analyses via LC-MS. (b) Coomassie blue detection of proteins of immunoaffinity-purified isNS1wt and isNS1ts (elute) after separation on a 10% reducing SDS-PAGE. The 50 kDa bands (red) and the 25 kDa bands (green) in both isNS1wt and isNS1ts elutes were excised for protein identification analyses via LC-MS. (c) Label-free quantification (LFQ) of NS1, ApoA1 and other unidentified proteins in total ion intensity via LC-MS (n = 3) in the following samples from isNS1wt (top table) and isNS1ts (bottom table): elute in solution, 250 kDa gel band (boxed in purple), 100 kDa gel band (boxed in pink; present only in isNS1ts), 50 kDa gel band (boxed in red), and 25 kDa gel band (green).
-
Figure 1—figure supplement 2—source data 1
Raw and annotated image for the PAGE gel stained in Coomassie blue for isNS1wt.
- https://cdn.elifesciences.org/articles/90762/elife-90762-fig1-figsupp2-data1-v1.pdf
-
Figure 1—figure supplement 2—source data 2
Raw and annotated image for the PAGE gel stained in Coomassie blue for isNS1ts.
- https://cdn.elifesciences.org/articles/90762/elife-90762-fig1-figsupp2-data2-v1.pdf
-
Figure 1—figure supplement 2—source data 3
Raw and annotated image for the SDS-PAGE gel stained in Coomassie blue for isNS1wt and isNS1ts presented in Figure 1—figure supplement 2b.
- https://cdn.elifesciences.org/articles/90762/elife-90762-fig1-figsupp2-data3-v1.pdf
Figure 1—figure supplement 3
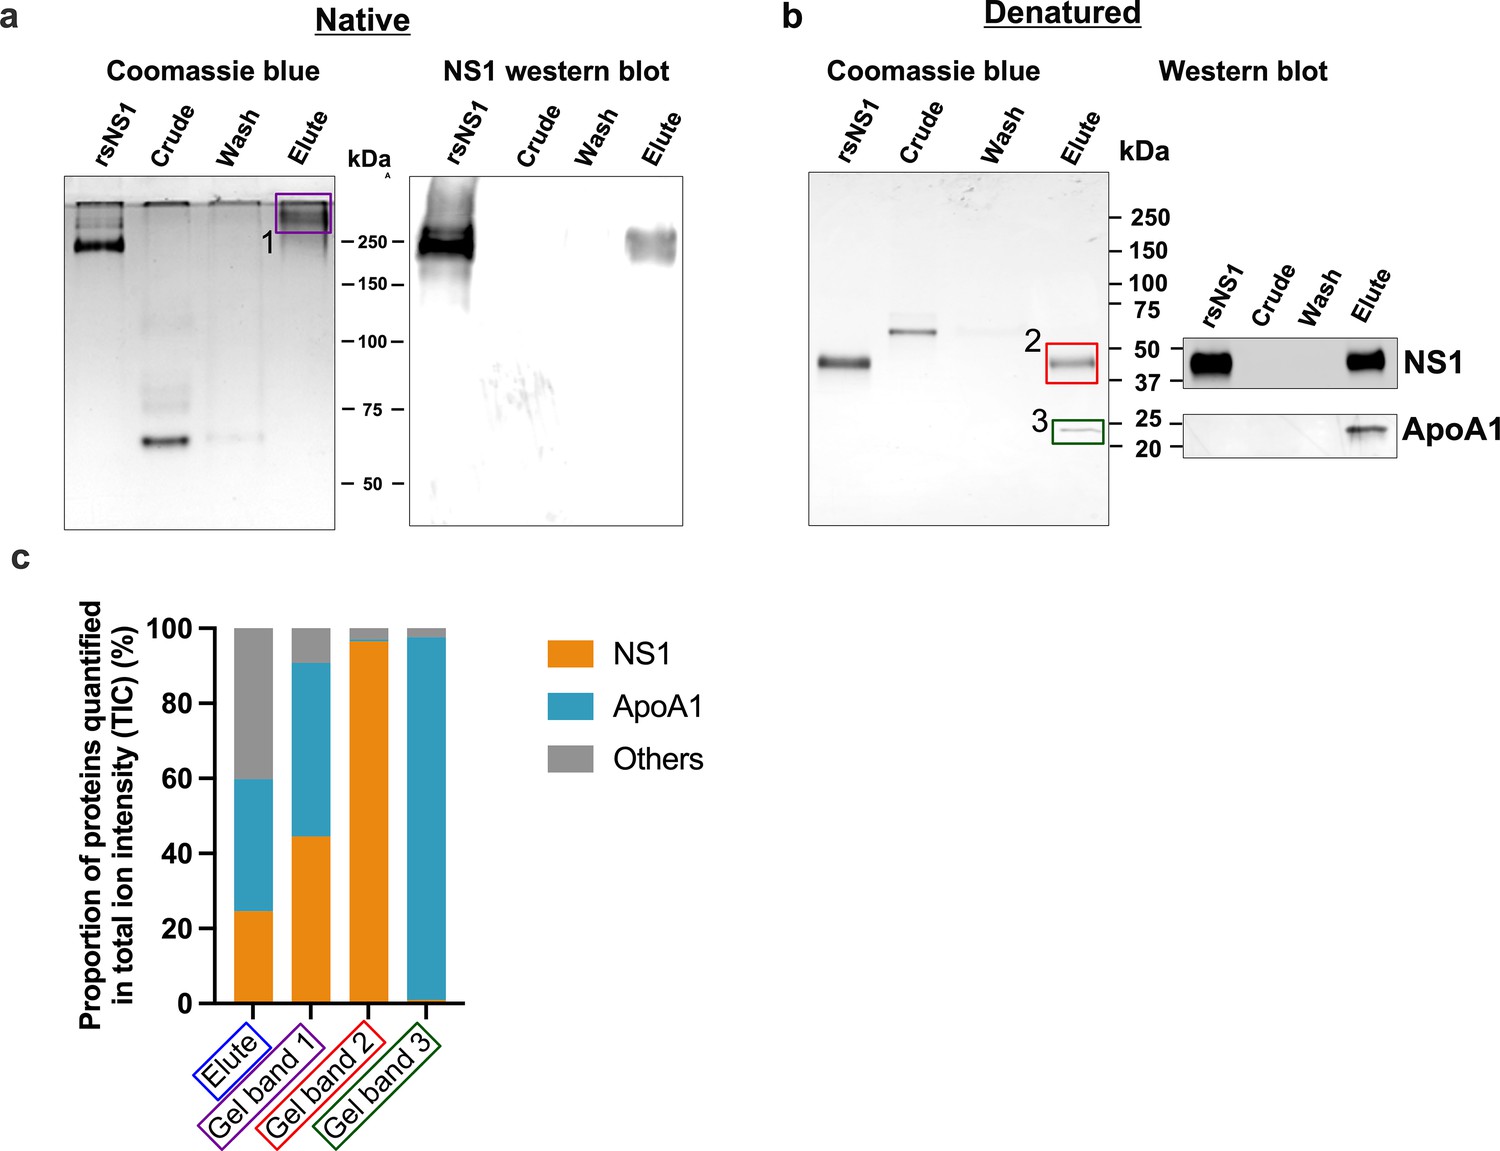
Composition of the secreted isNS1ts from dengue virus (DENV)-infected Vero cells.
(a) Coomassie blue detection of proteins from 1 µg of total protein of crude and elute, and 100 ng of total protein (in maximum well volume) in wash immunoaffinity fractions (low concentration due to large volume), with the recombinant sNS1 (rsNS1) obtained from Shu et al., 2022 as a positive control, after separation on a 10% Native-PAGE gel (left). The same set of samples were also subjected to a western blot detection of NS1 using Ab56.2, in 500 ng of total protein (except for wash where 100 ng in the maximum well volume) after separation on a 10% Native-PAGE (right). (b) Coomassie blue detection of proteins from 1 μg of total protein of crude and elute, and 100 ng of total protein (maximum well volume) in wash immunoaffinity fractions for isNS1ts and rsNS1, after separation on a 4–20% reducing SDS-PAGE gel. 1 µg of total protein in the same set of samples (except for wash where 100 ng in the maximum well volume) were also subjected to a western blot detection of NS1 and ApoA1 using Ab56.2 or ApoA1 antibody (Biorbyt, orb10643), respectively, after separation on a 4–20% reducing SDS-PAGE (right). (c) In-gel protein identification of the purified isNS1ts by liquid chromatography mass spectrometry (LC-MS). Proportion of NS1, ApoA1, and other unidentified proteins quantified in total ion intensity, obtained from the following samples: elute in solution (boxed in blue), 250 kDa gel band (boxed in purple), 50 kDa gel band (boxed in red), and 25 kDa gel band (green). The boxed gel bands are from representative gels showing the different protein species found while the actual gel bands used for protein identification by LC-MS are as shown in Figure 1—figure supplement 2.
Figure 1—figure supplement 4
CryoEM analysis for isNS1ts.
(a) Data analysis workflow and the corresponding number of images and particles. (b) Representative motion-corrected micrograph with black scale bar of 20 nm, 2D classes of the picked particles, and the 3D classes generated from ab initio to refinement stages, with the particle distribution as labeled. Scale bar for 2D classes, 50 Å, as labeled in the figure. (c) Dimensions of a selected 3D map boxed out in panel (b), black bar 100 Å, with its corresponding FSC resolution chart and the heat map of the posterior precision directional distribution as generated in crysosparc4.0 (Punjani et al., 2017).
Figure 2 with 2 supplements
CryoEM analysis of secreted NS1 in complex with antibody Ab56.2.
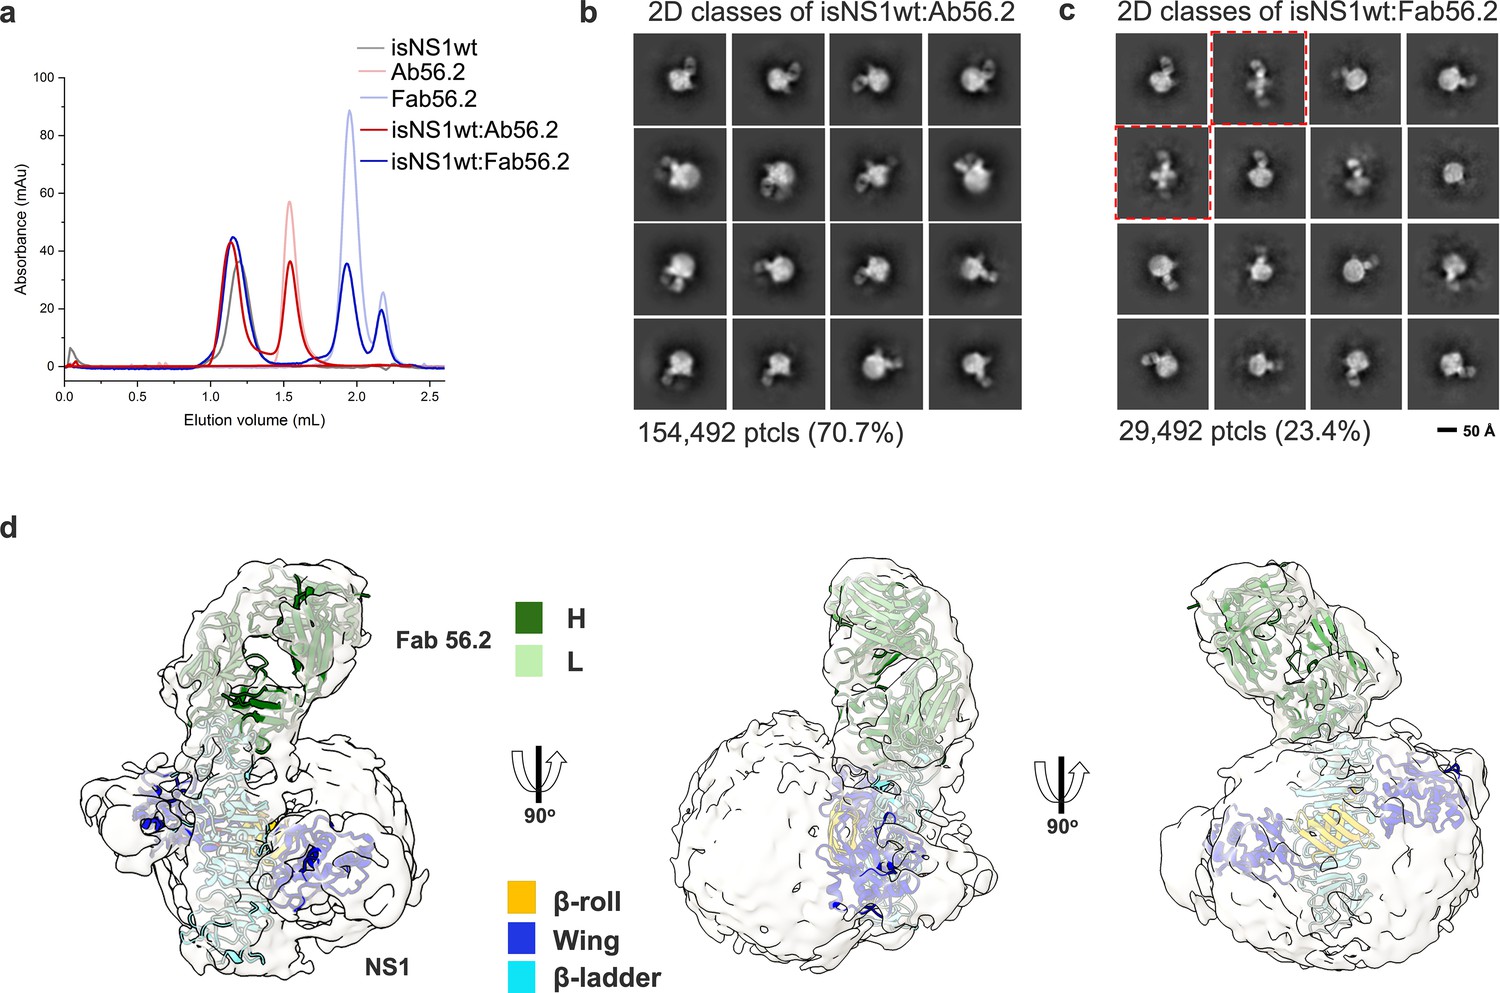
(a) Size-exclusion chromatography was run on a Superdex 200 increase 3.2/300 GL column connected to the ÄKTA purifier with a flow rate of 0.075 mL/min in PBS (pH 7.4) for purified isNS1wt (gray), Ab56.2 (faded red), Fab56.2 (faded blue), isNS1wt:Ab56.2 (red), and isNS1wt:Fab56.2 (blue). A slight leftward shift in elution volume was observed for isNS1wt upon complexing with Ab56.2 and Fab56.2. 2D class averages of (b) isNS1wt:Ab56.2 and (c) isNS1wt:Fab56.2 showing representative sub-class of the Fab56.2:isNS1:HDL particles with black scale bar, 50 Å. The corresponding number of particles and percentages are listed below the respective boxes. Red dashed line boxes highlight two rare views consisting of 1033 particles (3.5%) only seen in isNS1wt:Fab56.2 sample. (d) Model of isNS1wt:Fab56.2 predicted structures rigid body fitted in the cryoEM map of Fab56.2:isNS1:HDL (gray, contoured at 0.14) with correlation value of 0.75 to the fitted regions (map simulated from atoms at 5 Å). isNS1wt is colored by its three domains, namely the β-roll (orange), wing (blue), and β-ladder (cyan). Fab56.2 is colored by its heavy chain (dark green) and light chain (light green).
Figure 2—figure supplement 1
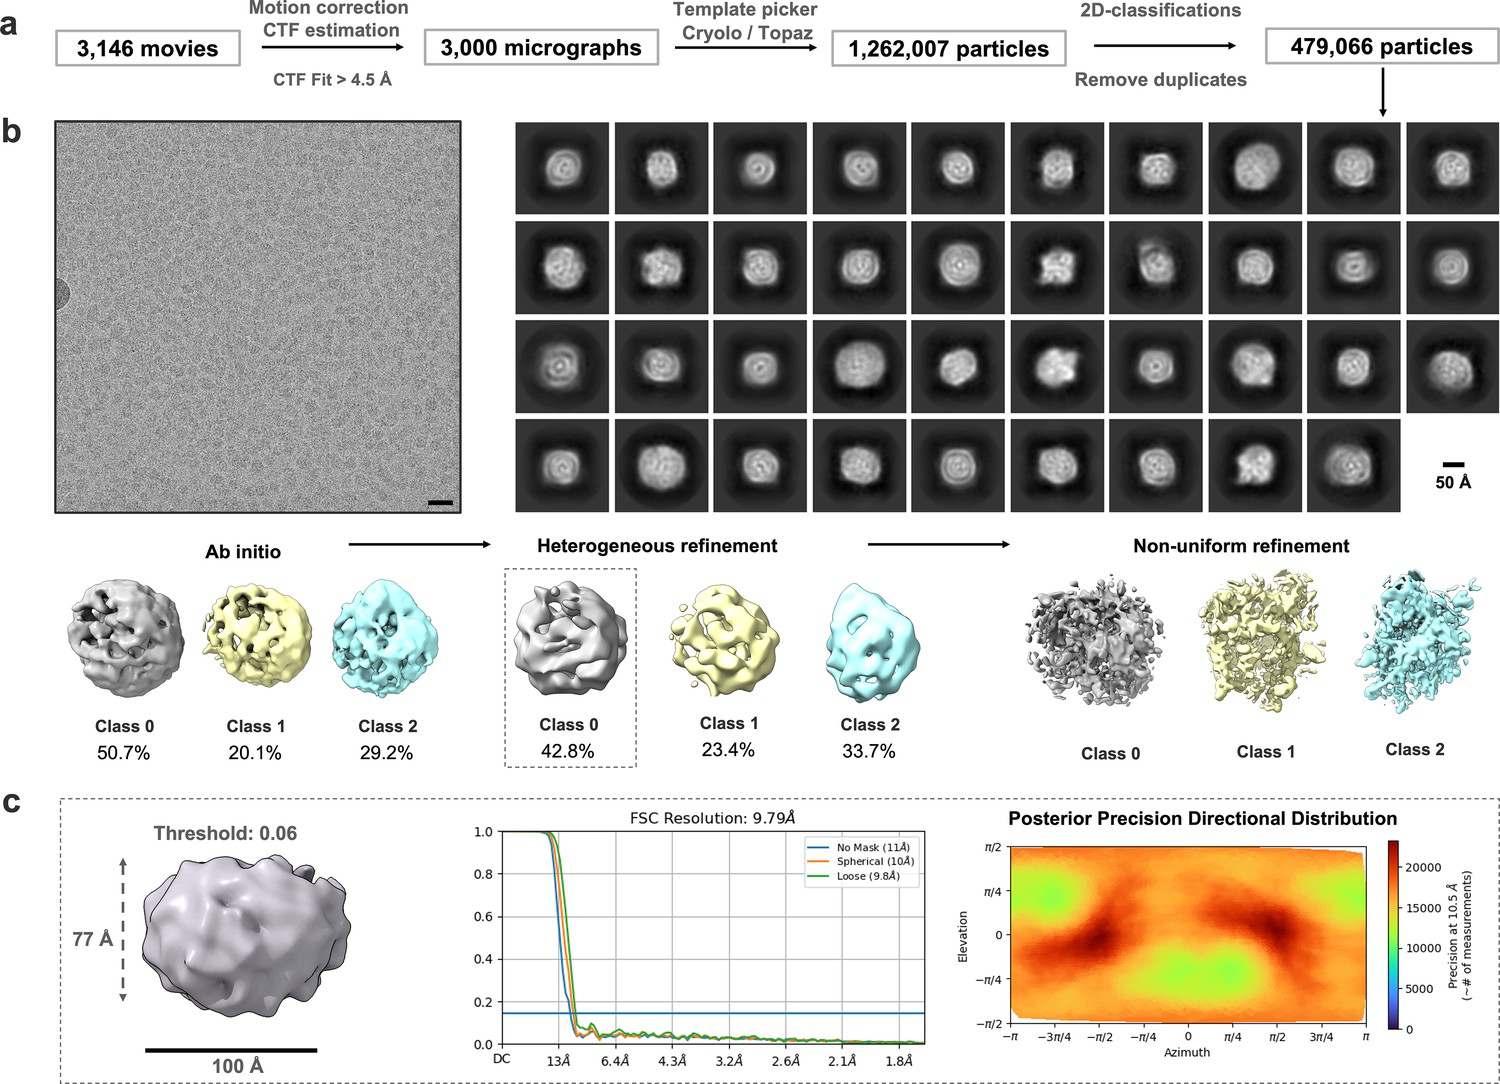
CryoEM analysis for isNS1wt in complex with Ab56.2.
(a) Data analysis workflow and the corresponding number of images and particles. (b) Representative motion-corrected micrograph with black scale bar of 20 nm, 2D classes of the picked particles. Scale bar for 2D classes, 100 Å, as labeled in the figure. (c) Representative 3D classes contoured at 0.06 and its particle distribution as labeled and colored in cyan. Scale bar of 100 Å as shown. (d) Histogram and directional FSC plot with a sphericity of 0.836 out of 1.0 generated using the remote 3DFSC processing server (Tan et al., 2017). The global FSC (red curve) overlaid onto a histogram plot computed from all individual angular FSC values corresponding to ±1 standard deviation of the FSC values within the histogram (green dashed curves). The corresponding posterior precision directional distribution as generated in crysosparc4.0 (Punjani et al., 2017).
Figure 2—figure supplement 2
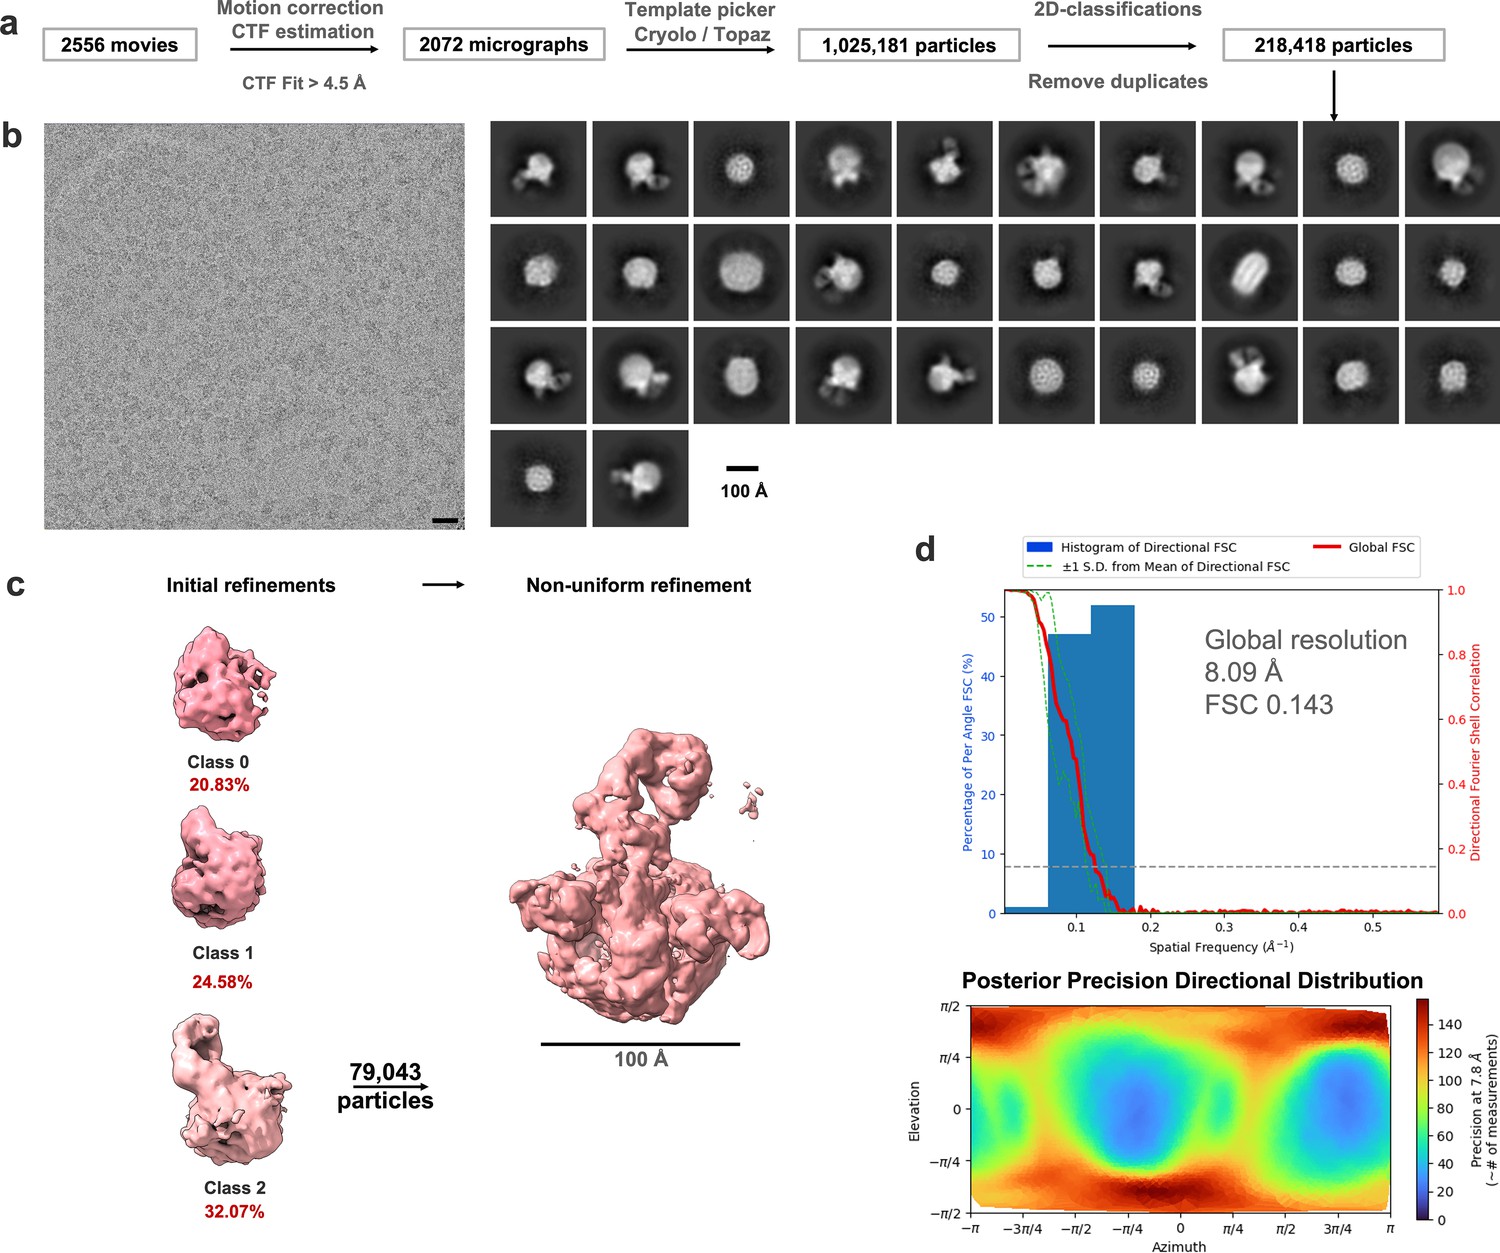
CryoEM analysis for infection-derived isNS1wt:Fab56.2.
(a) Data analysis workflow and the corresponding number of images and particles. (b) Representative motion-corrected micrograph with black scale bar of 20 nm, 2D classes of the overall picked particles, and initial 3D density maps generated from ab initio with the particle distribution as labeled. Scale bar for 2D classes and 3D map, 100 Å, as labeled in the figure. (c) 3D map classes generated from ab initio to refinement stages with the particle distribution as labeled. Refined 3D map for class 2 contoured at 0.1, scale bar of 100 Å. (d) Histogram and directional FSC plot with a sphericity of 0.836 out of 1.0 generated using the remote 3DFSC processing server (Tan et al., 2017). The global FSC (red curve) overlaid onto a histogram plot computed from all individual angular FSC values corresponding to ±1 standard deviation of the FSC values within the histogram (green dashed curves). The corresponding posterior precision directional distribution as generated in crysosparc4.0 (Punjani et al., 2017).
Figure 3 with 1 supplement
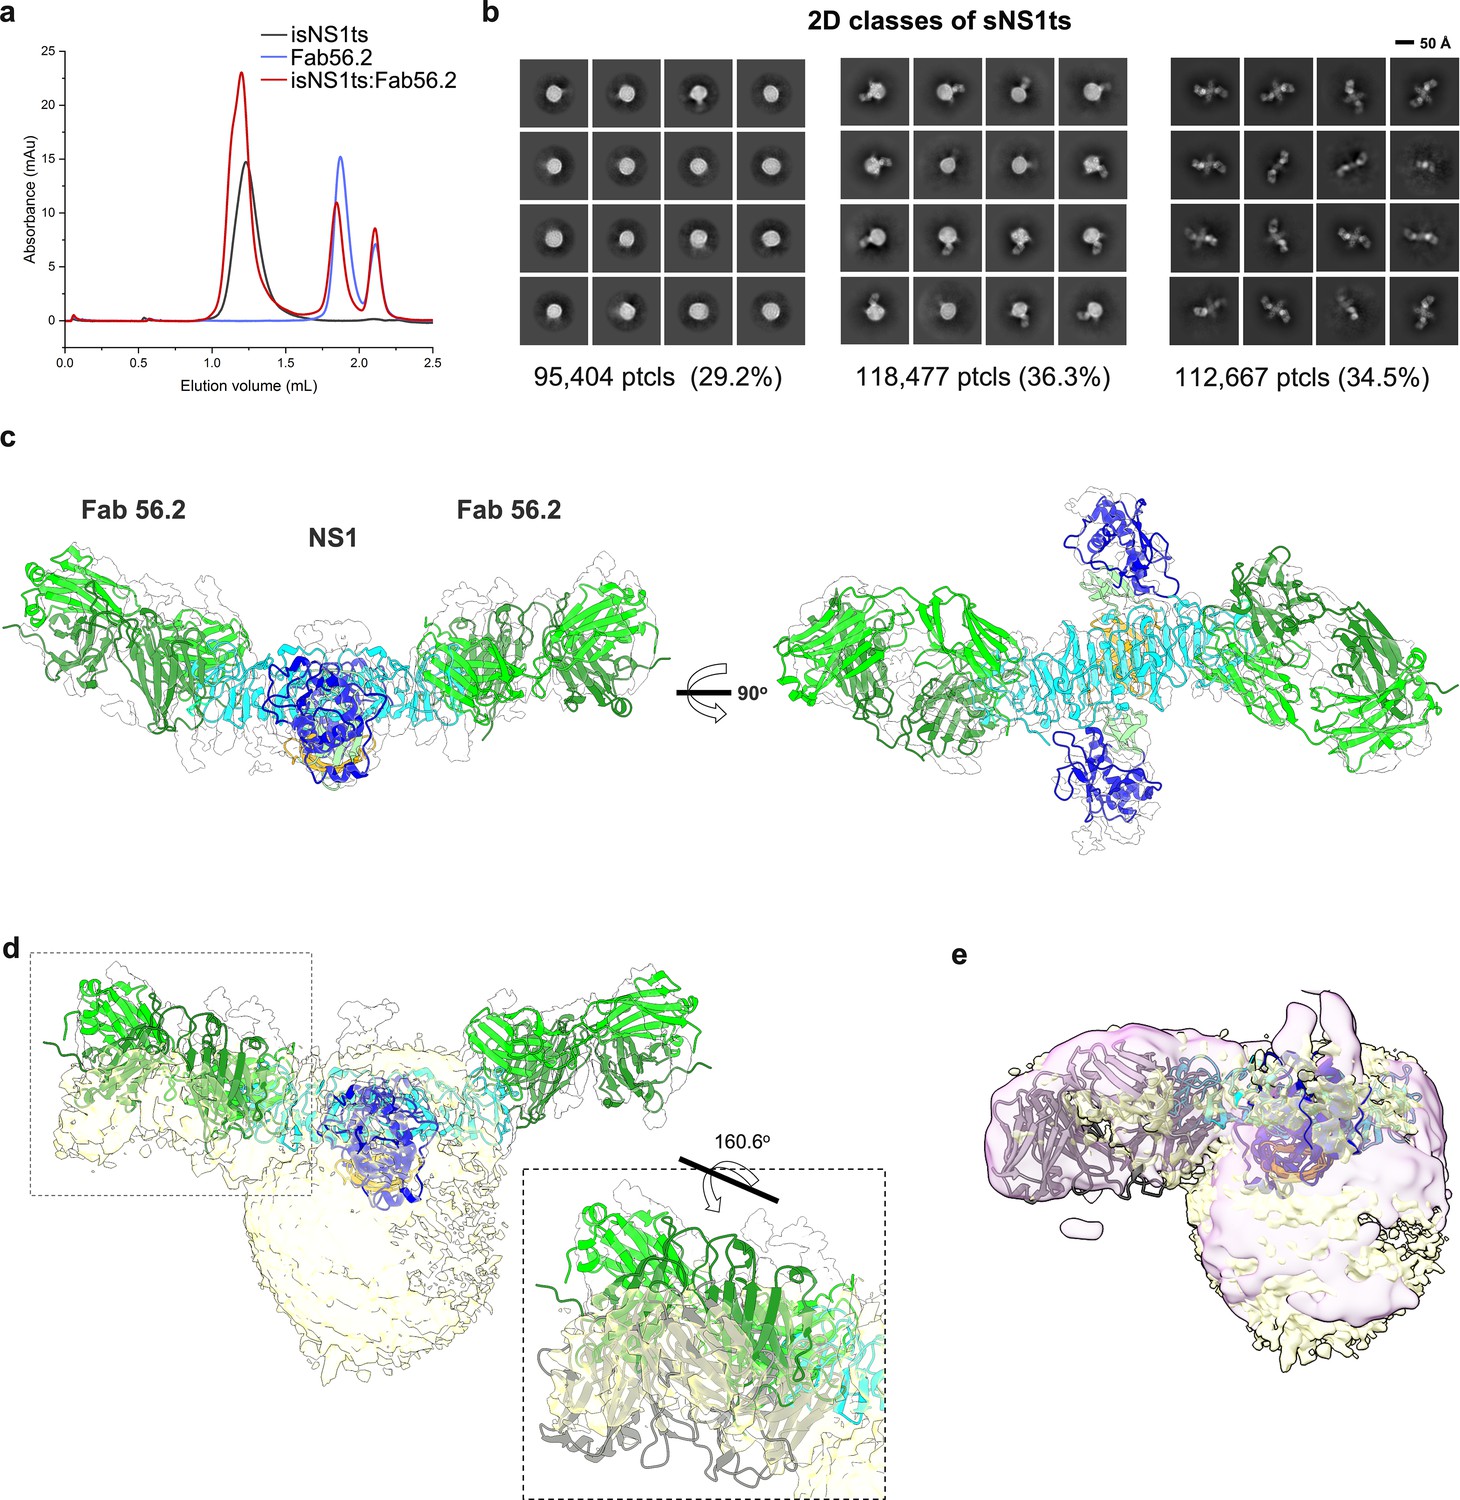
Secreted NS1 forms free dimers in complex with antibody Ab56.2.
(a) Size-exclusion chromatography was run on a Superdex 200 increase 3.2/300 GL column connected to the AKTA purifier with a flow rate of 0.075 mL/min in PBS (pH 7.4) for purified isNS1ts (gray), Fab56.2 (faded blue), and isNS1ts:Fab56.2 (red). A similar leftward shift in elution volume was also observed for isNS1ts upon complexing with Fab56.2. (b) 2D class averages of isNS1ts:Fab56.2 dataset with 326,548 particles picked and separated into three distinct populations, high-density lipoprotein (HDL) spheres, Fab56.2:isNS1:HDL, and free isNS1:Fab56.2. Black scale bar, 50 Å, as indicated. The corresponding number of particles and percentages are listed below the respective boxes. (c) Model of isNS1ts dimer and Fab56.2 predicted structures rigid body fitted in the isNS1ts:Fab56.2 density map (gray, contoured at 0.14) with correlation value of 0.53 (overall, map simulated from atoms at 5 Å). isNS1ts is colored by its three domains, namely the β-roll (orange), wing (blue), and β-ladder (cyan). Fab56.2 is colored by its heavy chain (dark green) and light chain (light green). (d) Density map fitting between isNS1ts:Fab56.2 (gray, contoured at 0.14) to Fab56.2:NS1ts:HDL (yellow, contoured at 0.1) with correlation value of 0.53 (overall) and 0.7137 (on D2NS1 map region only). Inset shows the difference in the pose of Fab from the free NS1 form to the HDL-bound form. (e) Density map fitting between Fab56.2:isNS1wt:HDL (purple, contoured at 0.05) to Fab56.2:NS1ts:HDL (yellow) with correlation value of 0.72 (overall).
-
Figure 3—source data 1
The corresponding PDB models for isNS1ts:Fab56.2 (EMD-36483) and Fab56.2:isNS1ts:HDL (EMD-36480).
- https://cdn.elifesciences.org/articles/90762/elife-90762-fig3-data1-v1.zip
Figure 3—figure supplement 1
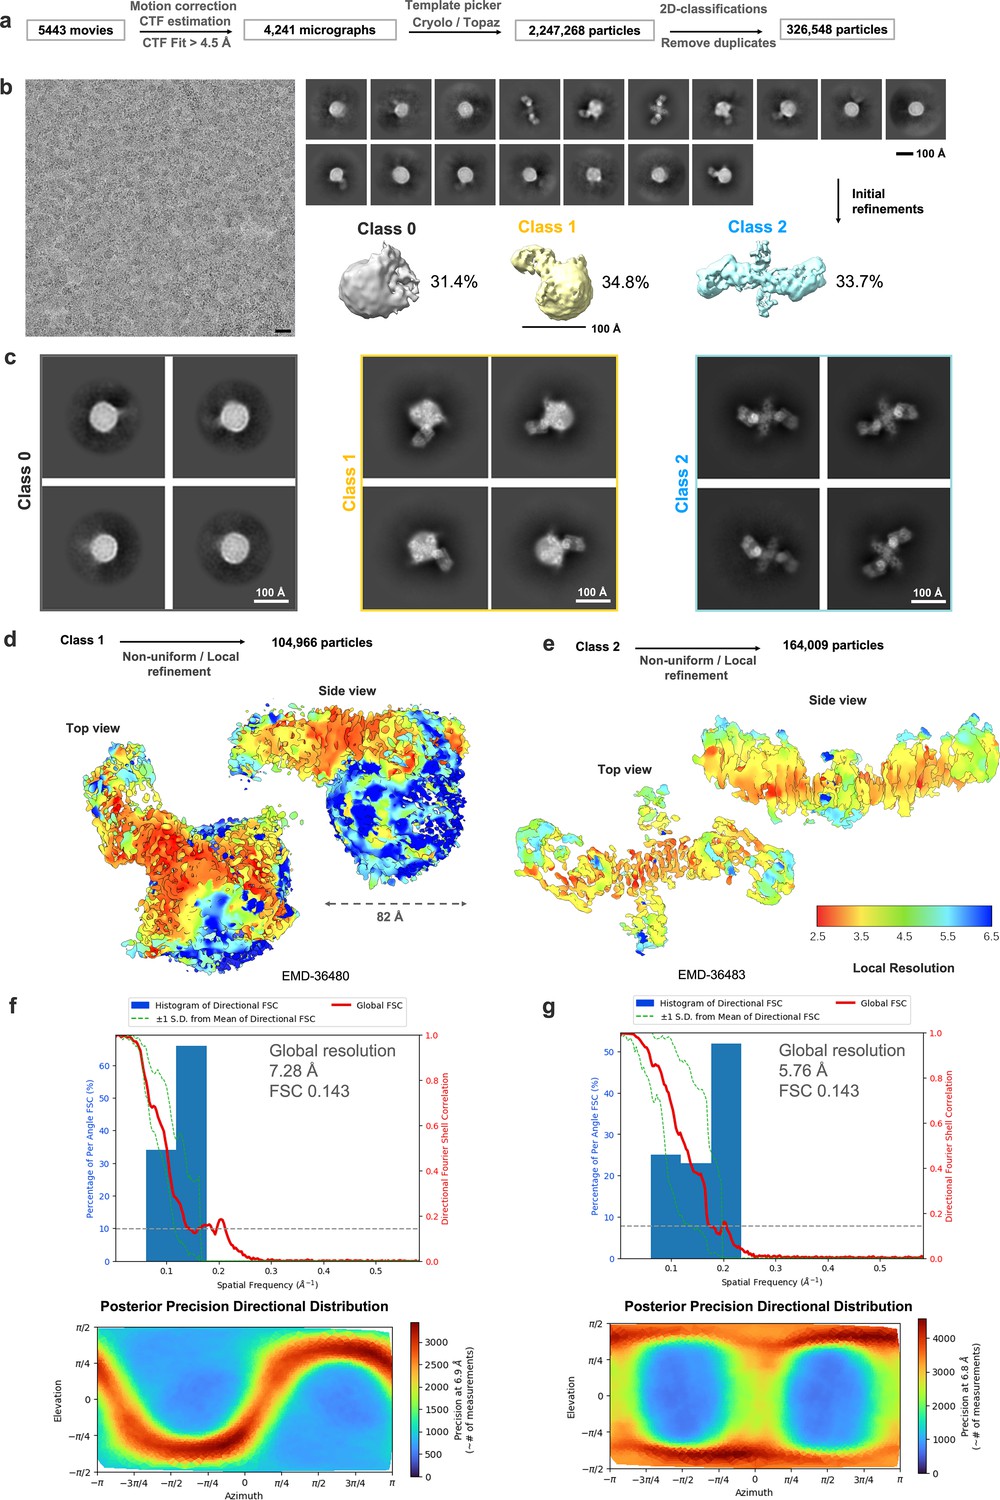
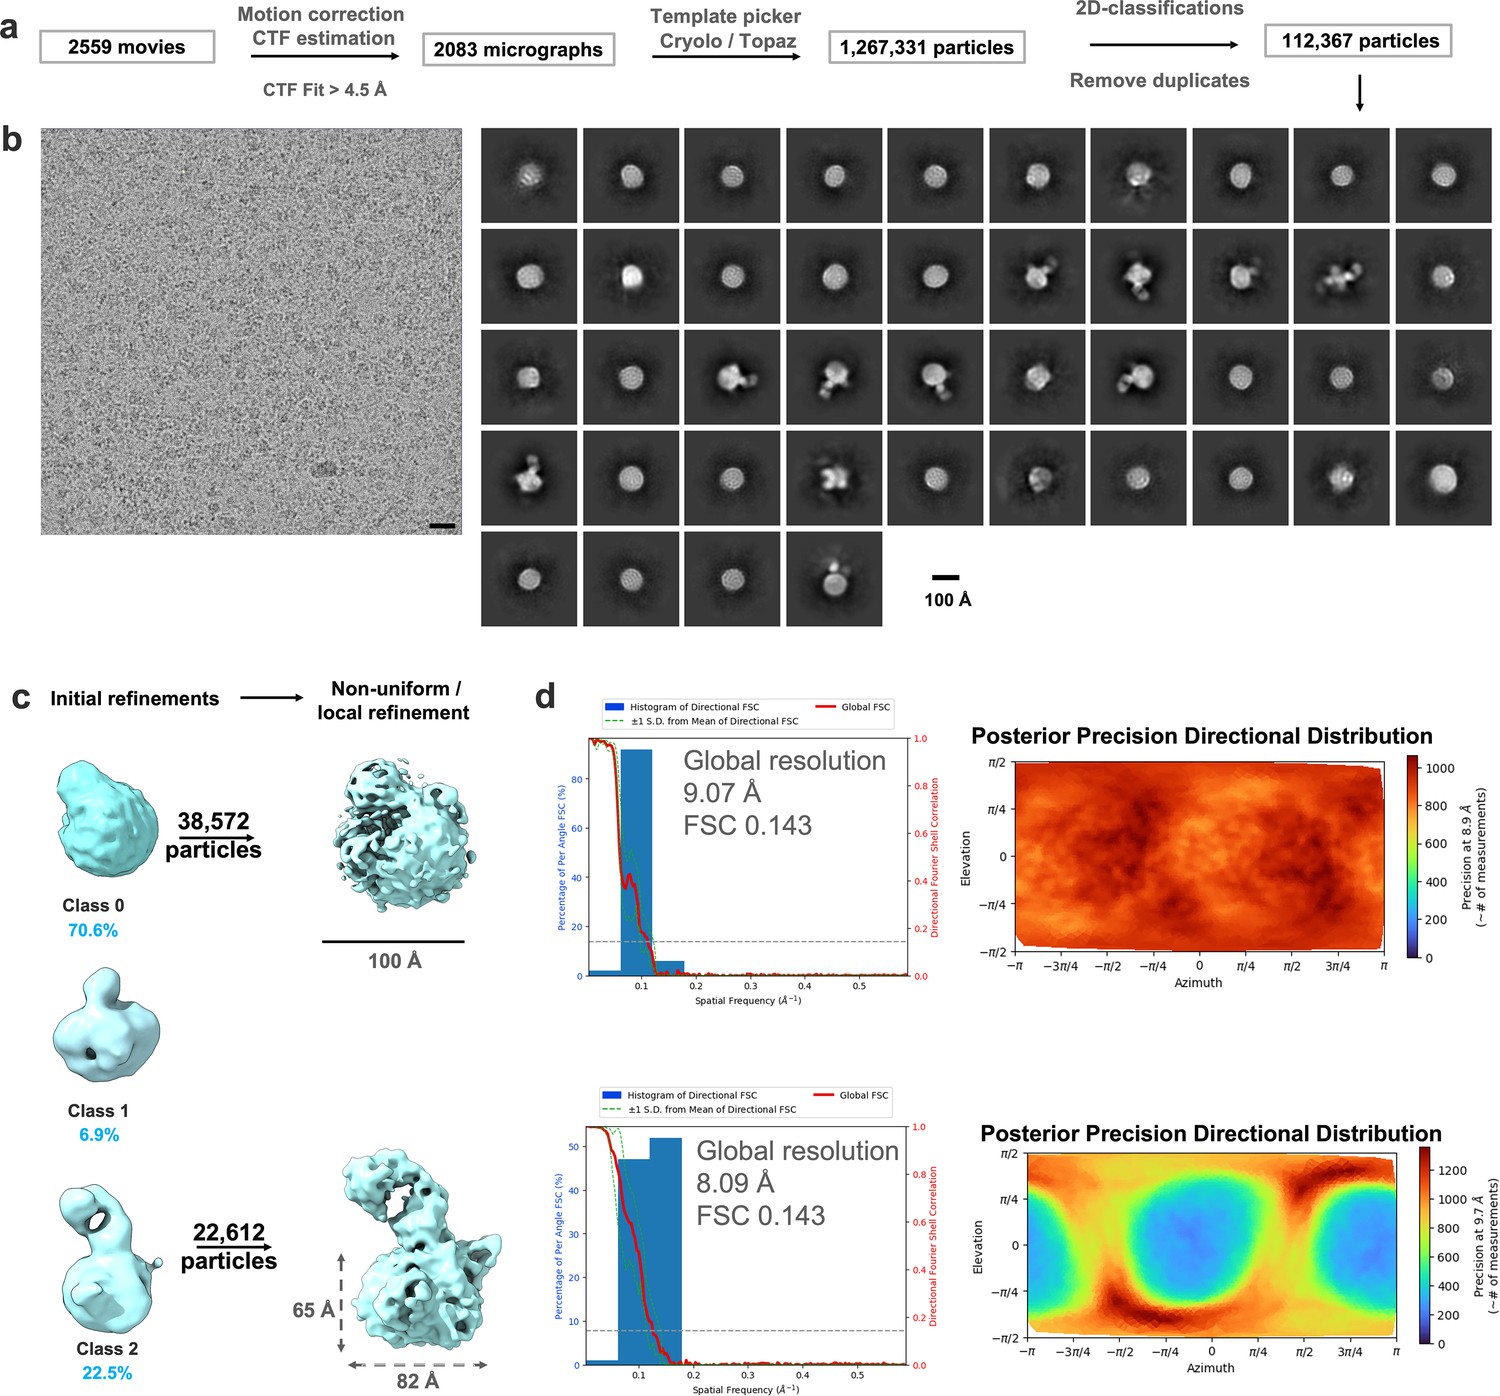
CryoEM analysis for isNS1ts in complex with Fab56.2.
(a) Data analysis workflow and the corresponding number of images and particles. (b) Representative motion-corrected micrograph with black scale bar of 20 nm, 2D classes of the overall picked particles, and initial 3D density maps generated from ab initio with the particle distribution as labeled. Scale bar for 2D classes and 3D map, 100 Å, as labeled in the figure. (c) Representative 2D classes of each 3D classes, white bar 100 Å. Refined 3D map for (d) class 1 (Fab56.2:isNS1ts:HDL; EMDB: 36480) and (e) class 2 (Fab56.2:isNS1ts; EMDB: 36483) are colored by local resolution and contoured at 0.1 and 0.3, respectively. The respective FSC resolution charts and the heat maps of the posterior precision directional distribution were as generated in crysosparc4.0. Histogram and directional FSC plot for (f) class 1 and (g) class 2 with a sphericity of 0.848 and 0.802 out of 1.0 generated using the remote 3DFSC processing server (Tan et al., 2017), respectively. The global FSC (red curve) overlaid onto a histogram plot computed from all individual angular FSC values corresponding to ±1 standard deviation of the FSC values within the histogram (green dashed curves). The corresponding posterior precision directional distribution for class 1 (f, bottom) and class 2 (g, bottom) as generated in crysosparc4.0 (Punjani et al., 2017).
Figure 4 with 2 supplements
Interaction sites of NS1:ApoA1 complex identification by crosslinking mass spectrometry.
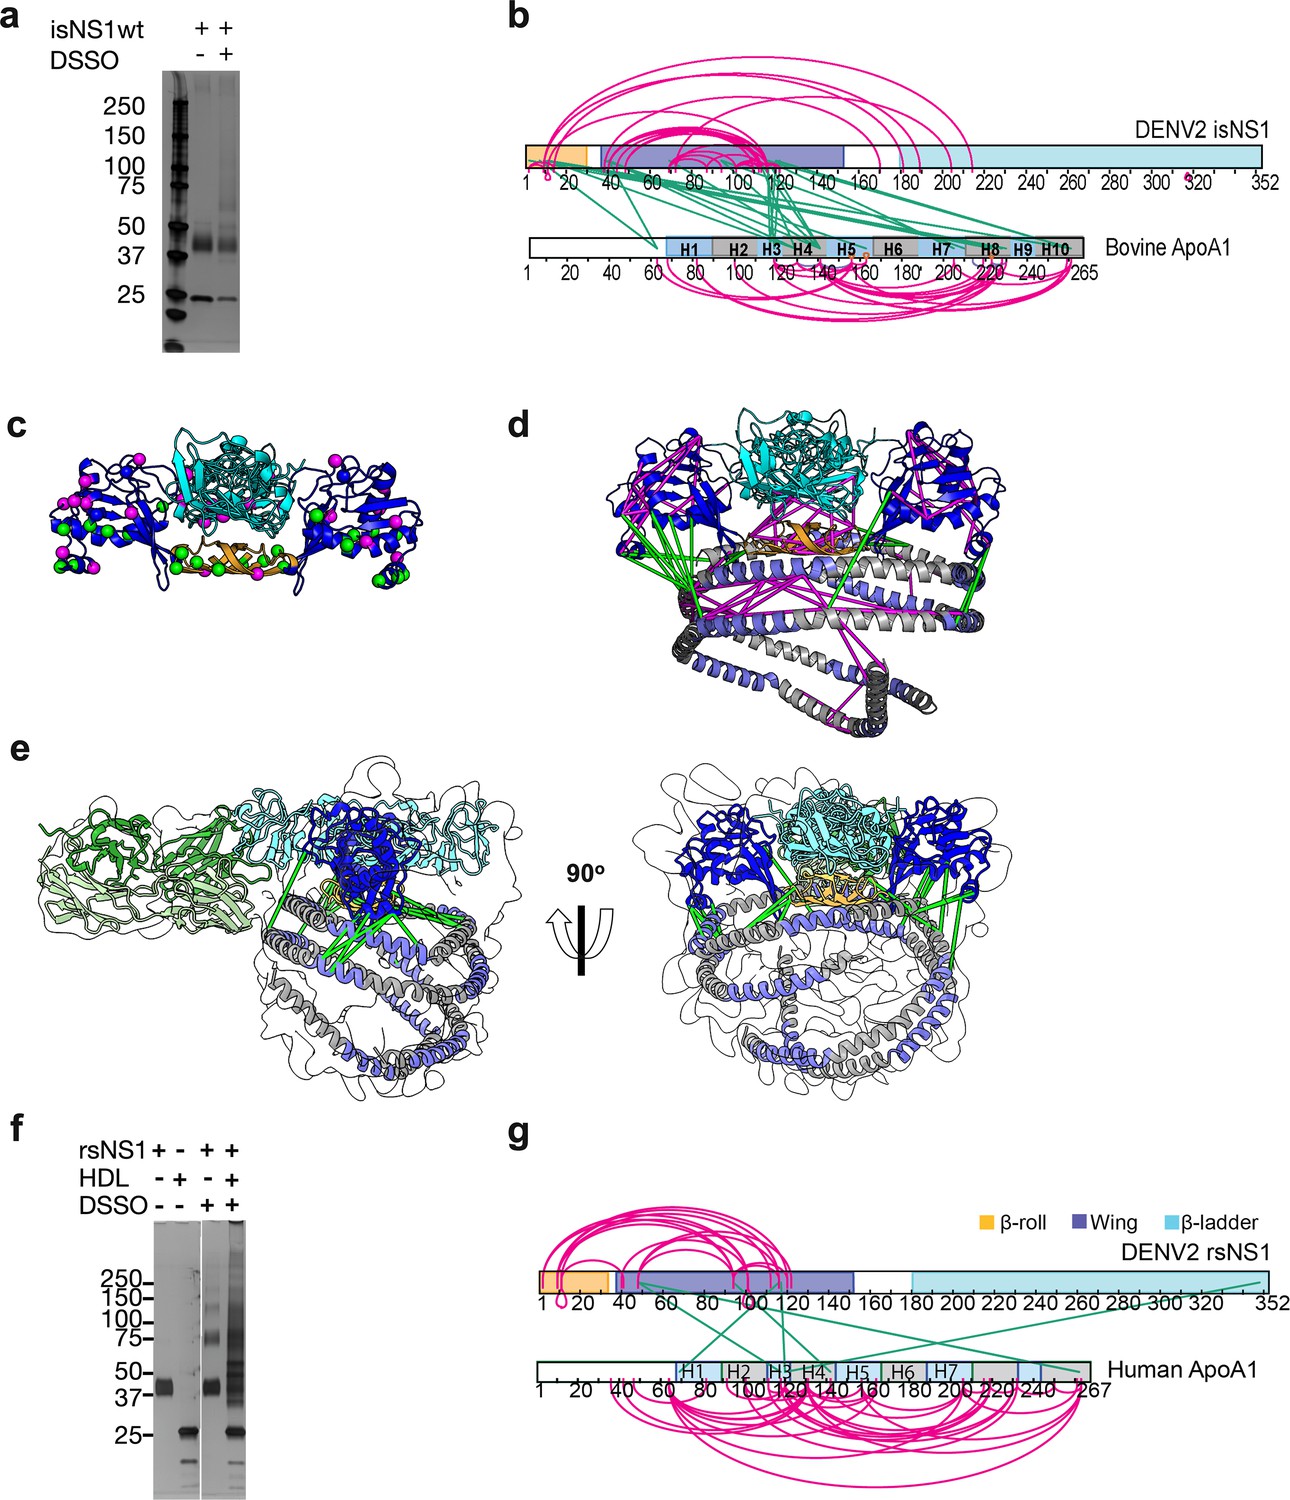
(a) SDS-PAGE analysis of isNS1wt with or without the addition of disuccinimidyl sulfoxide (DSSO) crosslinker. (b) The identified crosslinks are visualized on the NS1 and bovine ApoA1 constructs. The intramolecular (NS1:NS1 and ApoA1:ApoA1) crosslinks are in magenta. The intermolecular NS1:ApoA1 crosslinks are in green. (c) The isNS1 residues that are involved in NS1:NS1 interactions are visualized on the NS1 dimer model. The NS1 cartoon model is colored by its three domains, namely the β-roll (orange), wing (blue), and β-ladder (cyan) with the intramolecular (magenta) and intermolecular (green) crosslinking sites depicted as spheres. (d) The overall model interpretation of NS1:ApoA1 complex within the crosslinker theoretical distance cutoff at <30 Å as depicted. ApoA1 dimer cartoon model with its conserved helices as labeled colored in intervals of gray and light purple. (e) The NS1:ApoA1 dimer model with validated crosslinks was fitted into the cryoEM envelope. (f) SDS-PAGE analysis of crosslinked rsNS1 alone or with human high-density lipoprotein (HDL) (lanes 3–5). Non-crosslinked rsNS1 and human HDL are the control (lanes 1–2). The crosslinked rsNS1 can be seen in higher oligomers (lane 3). (g) Identified crosslinks are mapped on the NS1 and ApoA1 constructs, colored as per panel (b).
-
Figure 4—source data 1
Raw and annotated image for the PAGE gel visualized using silver stain.
- https://cdn.elifesciences.org/articles/90762/elife-90762-fig4-data1-v1.pdf
-
Figure 4—source data 2
Raw and annotated image for the PAGE gel visualized using silver stain.
- https://cdn.elifesciences.org/articles/90762/elife-90762-fig4-data2-v1.pdf
Figure 4—figure supplement 1
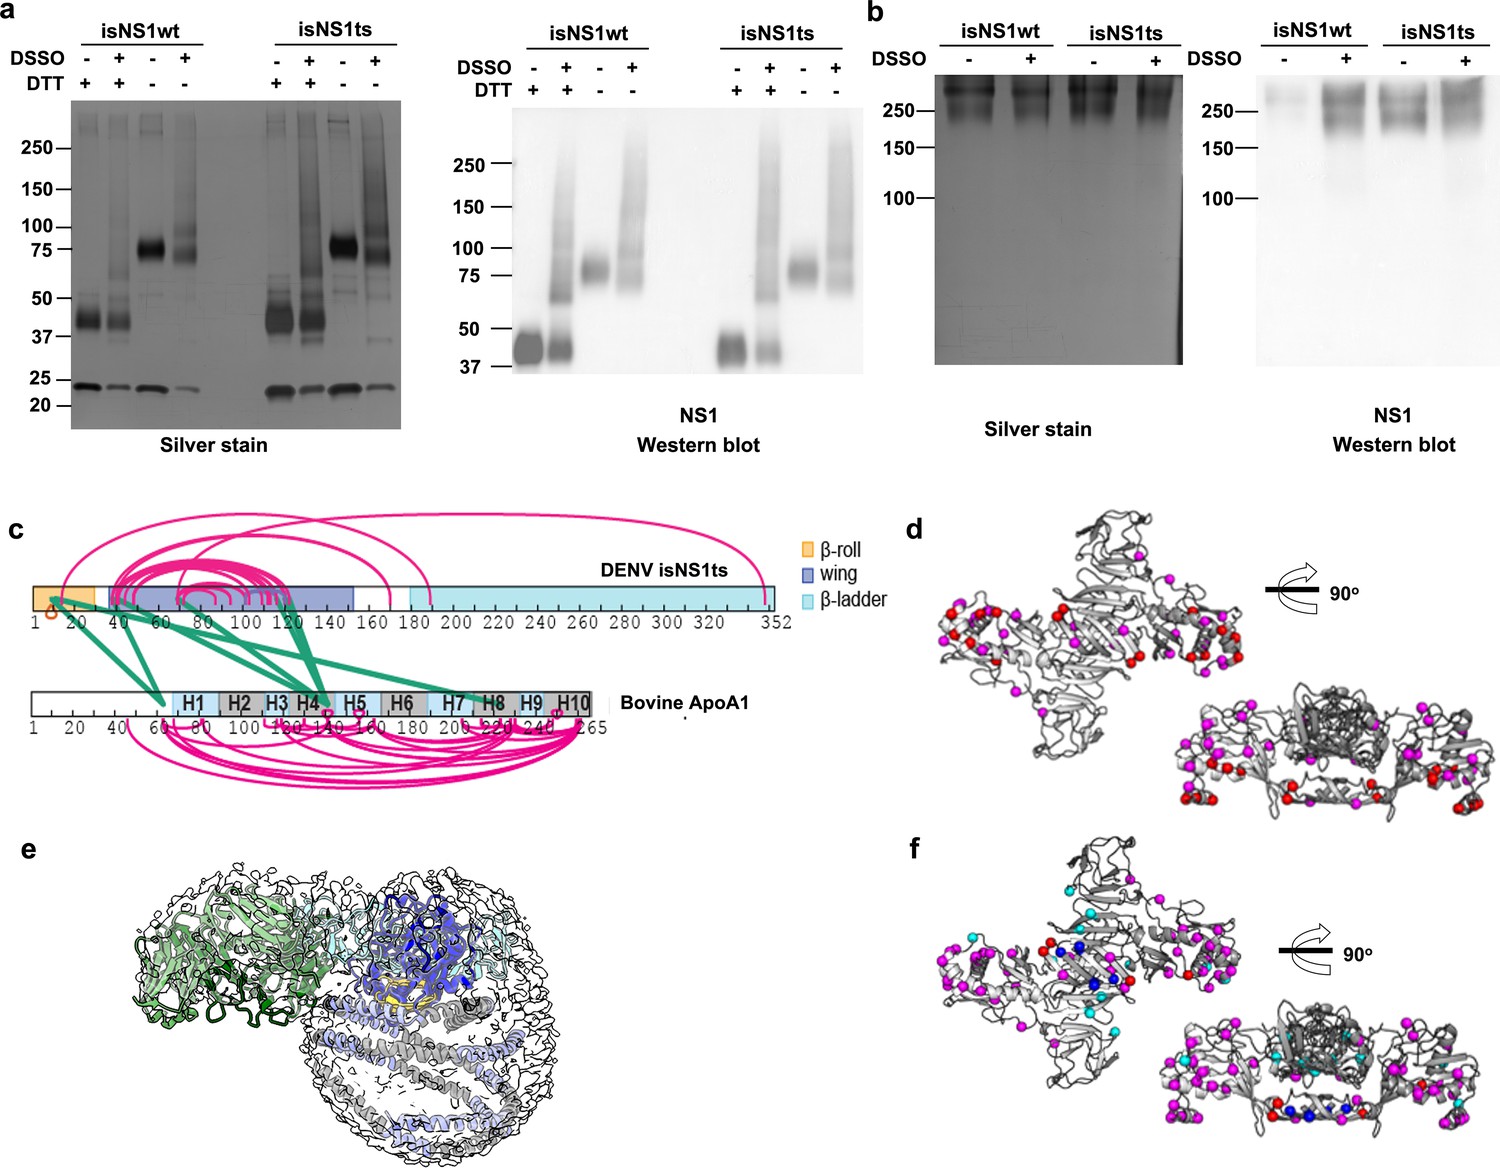
Crosslinking mass spectrometry of sNS1:ApoA1 complex.
2.4 µM of total protein in the purified isNS1wt1complex and 5.8 µM of total protein in the purified isNS1ts complex were crosslinked with disuccinimidyl sulfoxide (DSSO) in an isNS1: DSSO molar ratio of 1:100 for 45 min at room temperature. The crosslinking reaction was then quenched with 20 mM Tris-HCl (pH 8.0) for 15 min at room temperature. Uncrosslinked and crosslinked isNS1wt and isNS1ts were ran under reducing (with DTT) and non-reducing (without DTT) conditions in a SDS-PAGE (a) as well as under Native conditions in a Native-PAGE (b). The gels were subjected to both silver stain and an NS1 western blot to validate NS1 bands seen in the silver-stained gels. (c) The residue map of sNS1ts and ApoA1 showing the intra- (magenta) and inter- (green) molecular crosslinks. The sNS1 β-roll, wing, and β-ladder domains are colored in orange, blue, and cyan. The repeated alpha helices of ApoA1 are colored in alternating gray and light purple. (d) Inter- and intramolecular crosslinks identified for NS1ts:ApoA1 complex. The residues involved in the intramolecular crosslinks are depicted as magenta spheres and those in intermolecular crosslinks are in red. (e) Rigid-body fitting of the overall model into the Fab-isNS1ts-HDL density map in gray and contoured at 0.17. (f) Superimposition between isNS1wt and isNS1ts intra- and intermolecular crosslinks. isNS1ts inter- and intramolecular crosslinks are depicted as magenta and red spheres while the isNS1wt intra- and intermolecular crosslinks are in cyan and blue spheres, respectively.
-
Figure 4—figure supplement 1—source data 1
Raw and annotated image for the western blot analysis (anti-NS1) on an SDS-PAGE gel.
- https://cdn.elifesciences.org/articles/90762/elife-90762-fig4-figsupp1-data1-v1.pdf
-
Figure 4—figure supplement 1—source data 2
Raw and annotated image for the western blot analysis (anti-NS1) on a Native gel.
- https://cdn.elifesciences.org/articles/90762/elife-90762-fig4-figsupp1-data2-v1.pdf
Figure 4—figure supplement 2
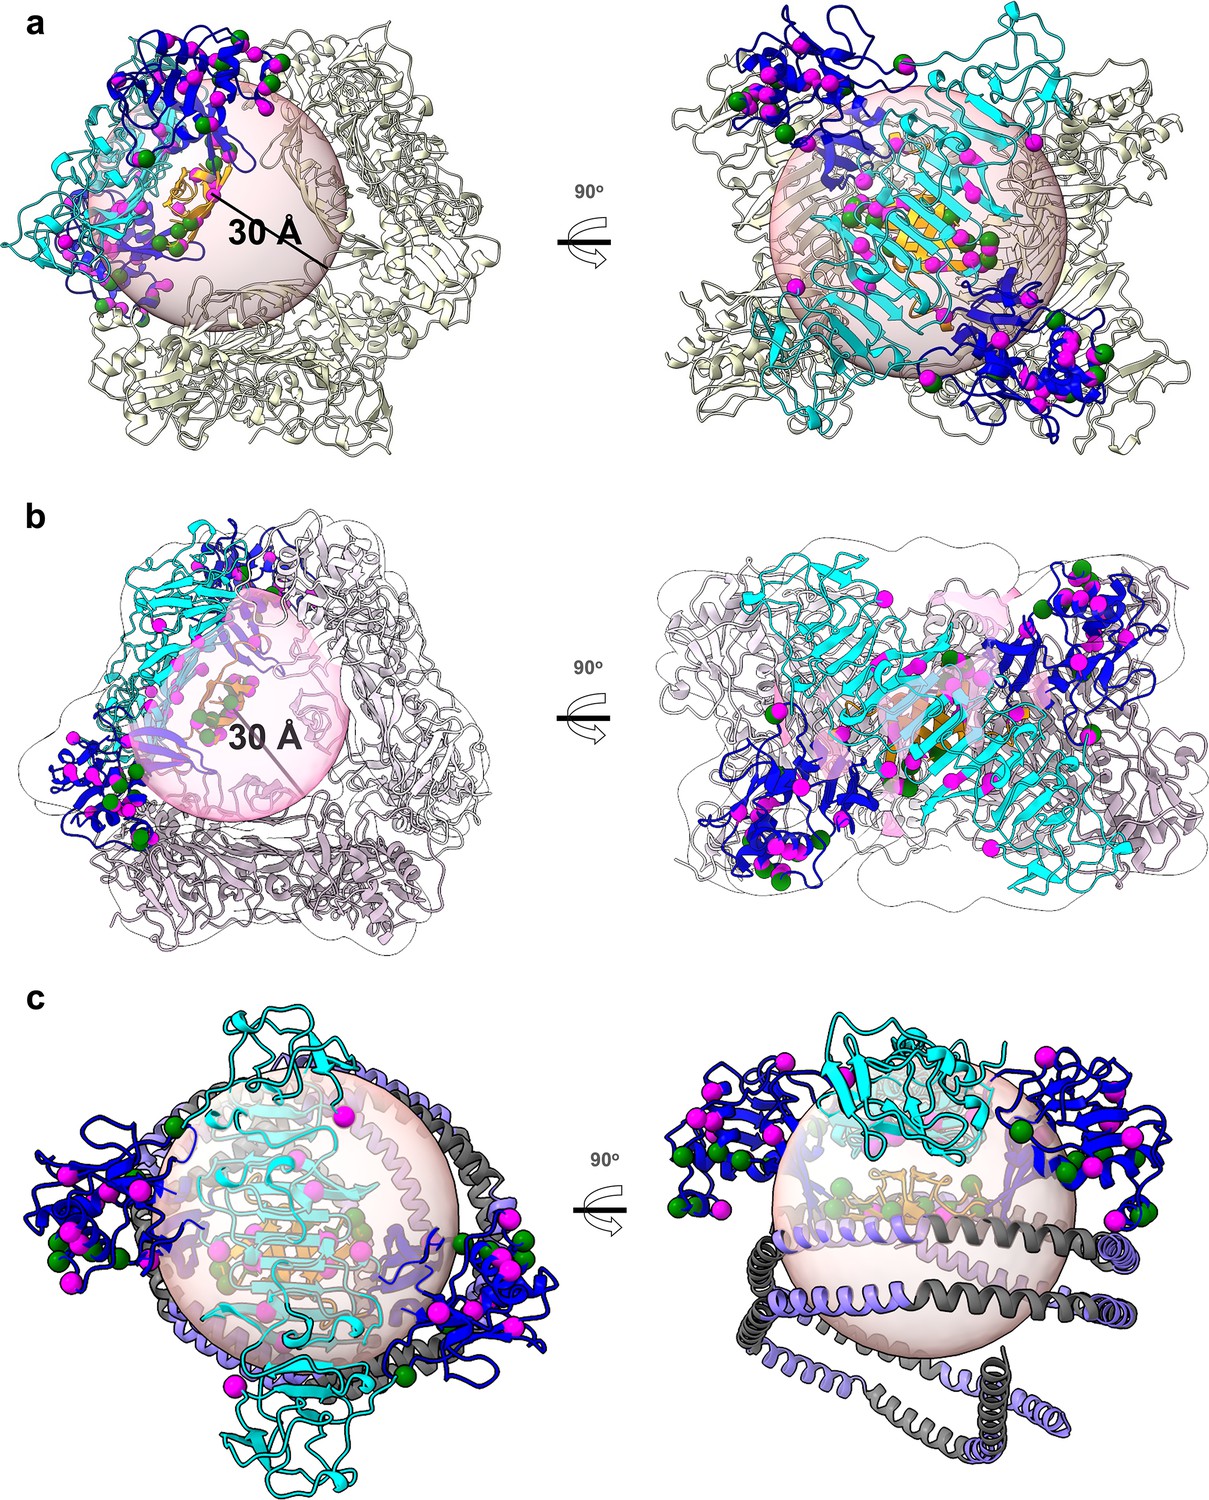
NS1 hexamer and dimer-HDL models with residues identified in intra- and intermolecular crosslinking interactions.
(a) Cartoon representation of isNS1 hexamer due to crystal packing (PDB:4O6B). (b) Cartoon representation of isNS1 hexamer cryoEM model with white transparent map and black outline (EMDB: 32843). The intra- and intermolecular crosslinked residues are in magenta and green spheres. The light orange sphere with 30 Å radius represents the maximum range of crosslink-able Cα atoms from Ser2 from β-roll. (c) Cartoon representation of sNS1 dimer–ApoA1 cryoEM model from this study. For all panels, the top view (left panel) and side view (right panel) with intra- and intermolecular crosslinks residues in magenta and green spheres respectively on one dimer of sNS1. Domains from the sNS1 dimer molecule are colored in orange (β-roll), blue (wing), and cyan (β-ladder). The light orange sphere has a radius of 30 Å and represent the maximum range between the Cα atoms that can be crosslinked to Ser2 residue from β-roll.
Figure 5
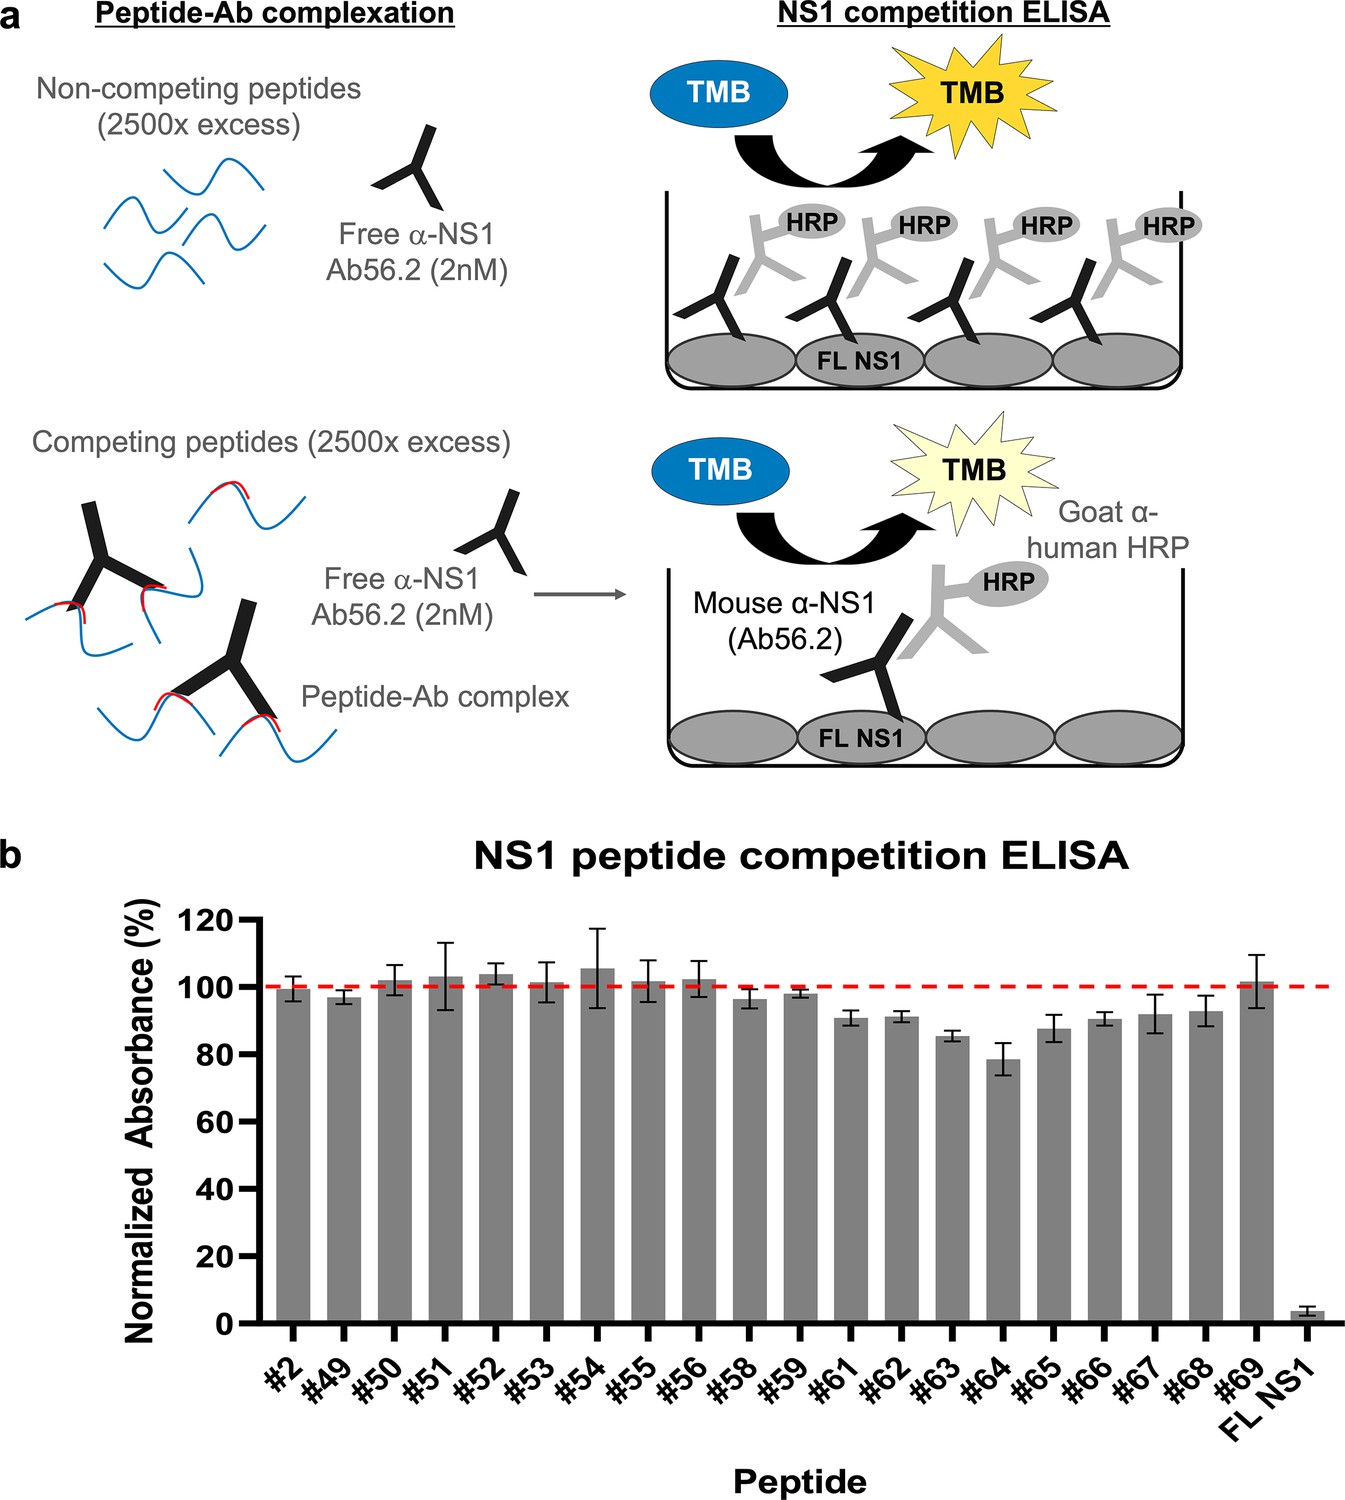
Epitope mapping of Ab56.2 by NS1 peptide competition ELISA.
(a) Schematic of the principle of NS1 peptide competition ELISA to determine the epitope of Ab56.2. NS1 peptides (15-mer, 2500× molar excess) were first incubated with 2 nM of Ab56.2 at room temperature for formation of peptide-Ab complex. The complexation mixture is then added to ELISA plate pre-coated with full length (FL) DENV2 NS1. If the peptides contain epitope that is recognized by Ab56.2, the peptides will compete with the FL NS1 binding to the Ab56.2 in the ELISA plate, resulting in a reduced signal compared to non-competing peptides. (b) Normalized absorbance (%) of Ab56.2 to the FL NS1 in the presence of NS1 15-mer peptides. The absorbance reading is normalized to the signal in the absence of the peptides. FL NS1 protein is used as a positive control for the NS1 peptide competition ELISA assay. Results shown are mean ± SD from two independent experiments. Residue sequences are listed in Table 2. β-roll residues 6–20 (#2) were used as a non-competing peptide and the red-dashed line represents the threshold for determining the competing peptides.
Figure 6 with 1 supplement
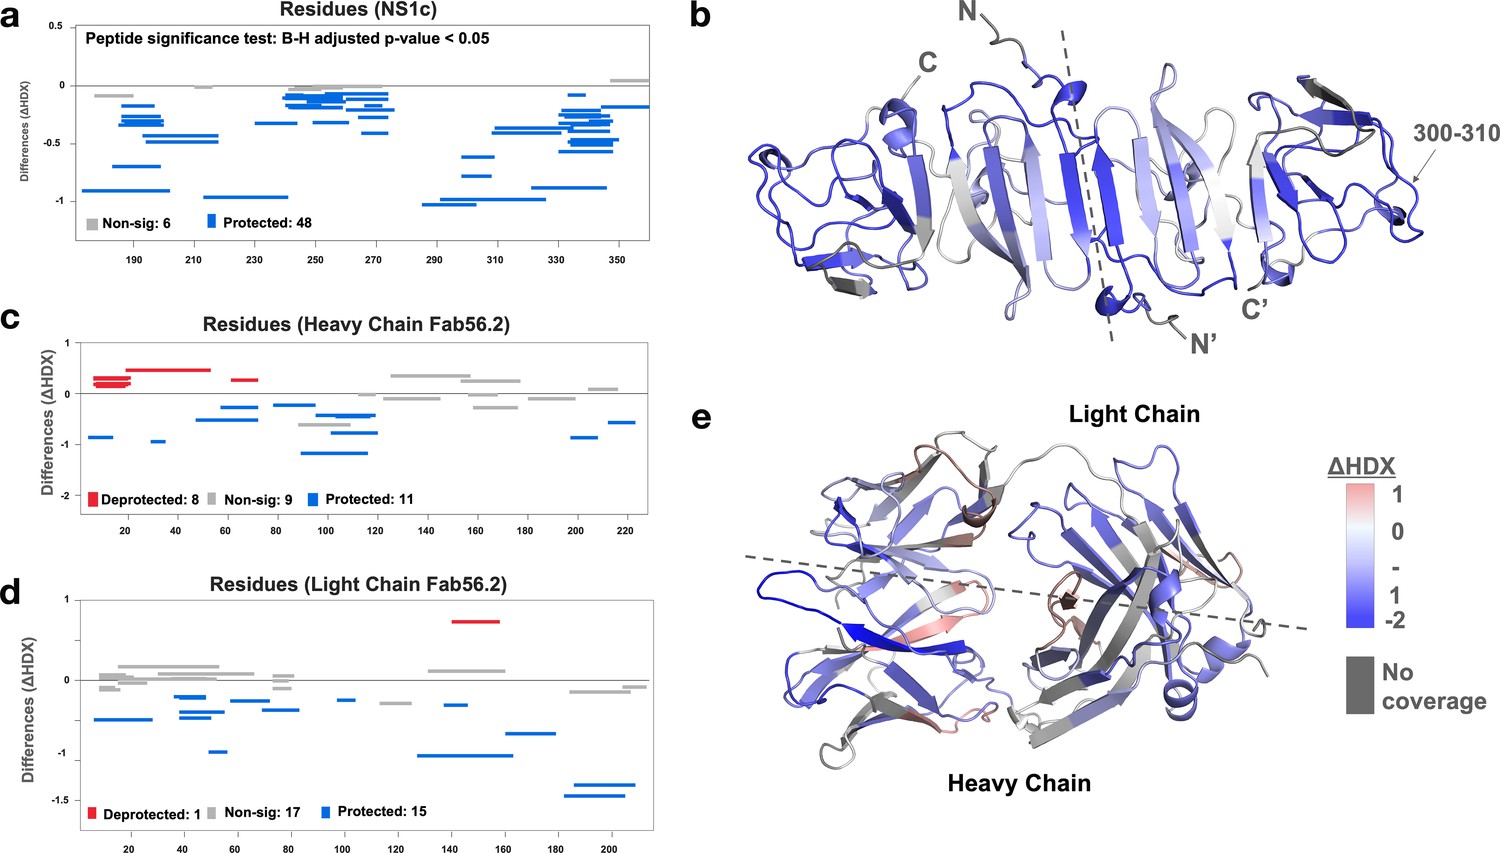
Interaction interface of rsNS1c-Fab562 complex characterized by hydrogen-deuterium exchange mass spectrometry (HDX-MS).
(a) Woods differential plot showing the differences in deuterium exchange (y-axis) between Fab56.2-bound and free rsNS1c protein across various residues (x-axis) at 10 min labeling timepoint. Negative differences indicate protection against deuterium exchange across rsNS1c peptides in the presence of Fab56.2 compared to free rsNS1c. A p-value<0.05 is considered as significance threshold, which identified 6 nonsignificant peptides (gray lines) and 48 protected peptides (blue lines). (b) Cartoon representation of rsNS1c dimer model showing differences in deuterium exchange at 10 min labeling as indicated in key. Dashed line distinguishes the two monomers in the dimer. Peptide spanning residues 300–310 showing the highest protection are indicated. (c, d) Woods differential plot comparing the differences in deuterium exchange of Fab56.2 in the presence and absence of rsNS1c for various peptides of (c) heavy chain and (d) light chain. A p-value<0.05 is considered as significance threshold, which identified deprotected (red lines), nonsignificant, and protected peptides as indicated. (e) Cartoon representation of Fab56.2 model showing deuterium exchange differences at 10 min mapped for Fab56.2-rsNS1c complex as per key. Plots were generated using Deuteros 2.0, while cartoon structures were generated using PyMoL.
Figure 6—figure supplement 1
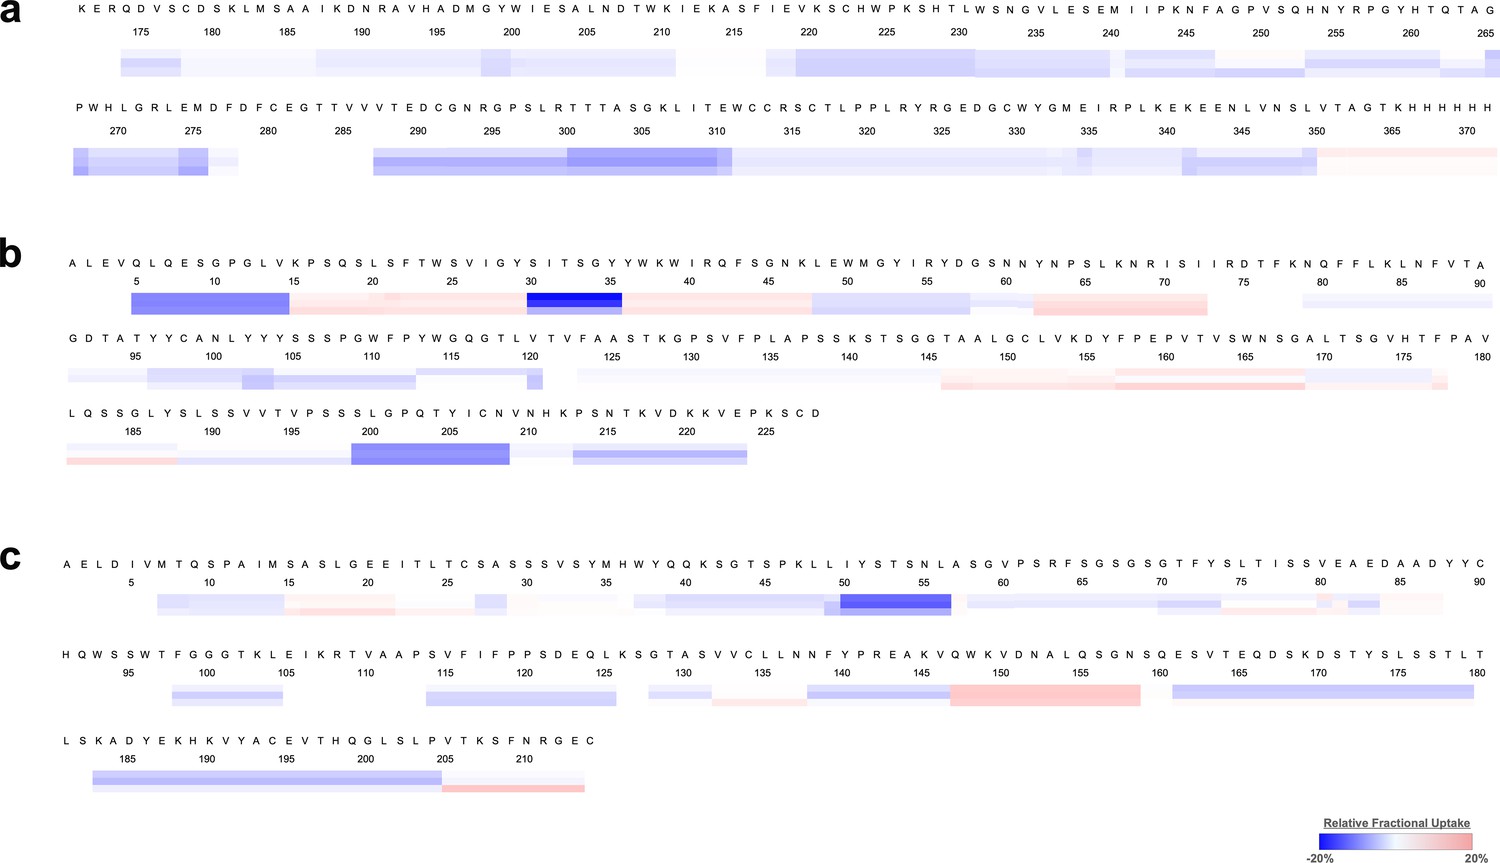
Heat map identified specific residues associated with rsNS1c-Fab562 complex.
Heat maps showing differences in relative fractional deuterium uptake for (a) rsNS1c, (b) heavy, and (c) light chains of Fab56.2. Differences were estimated by considering the deuterium exchange values of overlapping peptides across different clusters within the individual proteins of rsNS1c-Fab56.2 complex. Relative fractional uptake at 1, 10, and 100 min labeling timepoints are shown as individual lines below each residue. Heat map was generated using DynamX 3.0 software.
Figure 7 with 1 supplement
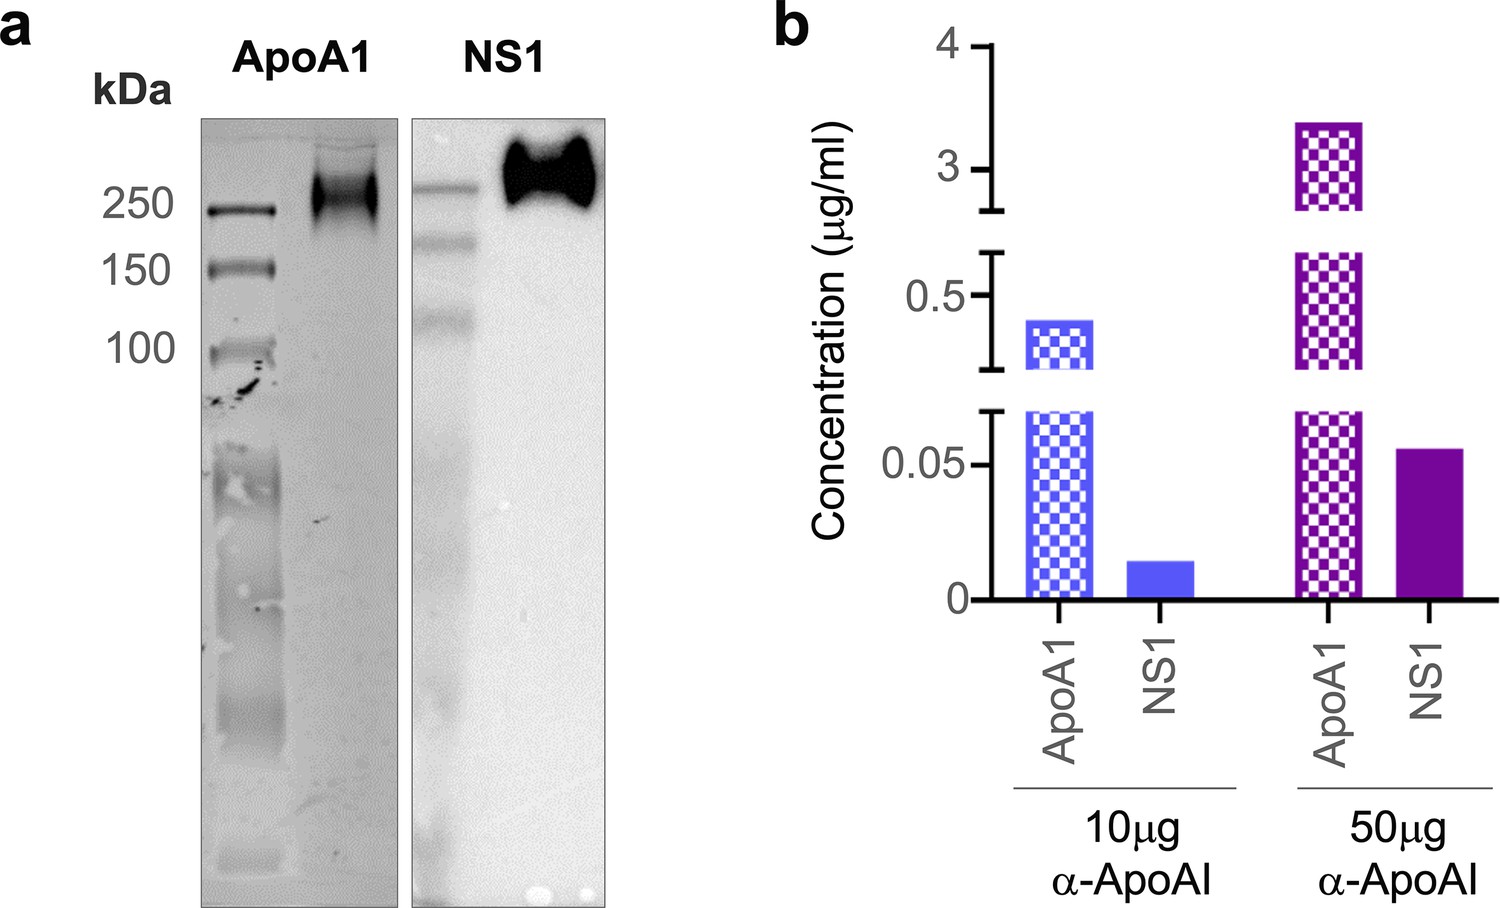
sNS1 associates with ApoA1 in dengue virus (DENV)-infected mouse and human serum.
(a) AG129 mice (n = 10) were infected with DENV2 NS1 T164S mutant virus and the pooled infected sera collected on day 4 post-infection was subjected to sNS1 immunoaffinity purification using anti-NS1 56.2 coupled resin as in Figure 1—figure supplement 1. 2 mg of the purified eluate was then subjected to western blot analysis after separation and transfer from Native-PAGE for detection of ApoA1 and NS1. ApoA1 was detected using the mouse monoclonal anti-ApoA1 clone 513 (Invitrogen, MIA1404) (left panel) and the oligomeric NS1 was detected using anti-NS1 56.2 IgG clone (right panel). (b) Protein AG resin (Pierce) pre-cleared DENV1-infected patient serum (n = 1) from the CELADEN trial (Low et al., 2014) was immunoprecipitated with 10 or 50 mg of rabbit polyclonal anti-ApoA1 antibody (Biorbyt, orb10643) to detect association between ApoA1 and NS1 by ELISA. The amount of ApoA1 and NS1 in the immunoprecipitated sample was determined by human ApoA1 (Abcam, ab189576) and Platelia NS1 Ag (Bio-Rad) ELISAs.
-
Figure 7—source data 1
Raw and annotated image for the western blot analysis (anti-NS1 and anti-apoA1) on a Native gel.
- https://cdn.elifesciences.org/articles/90762/elife-90762-fig7-data1-v1.pdf
Figure 7—figure supplement 1
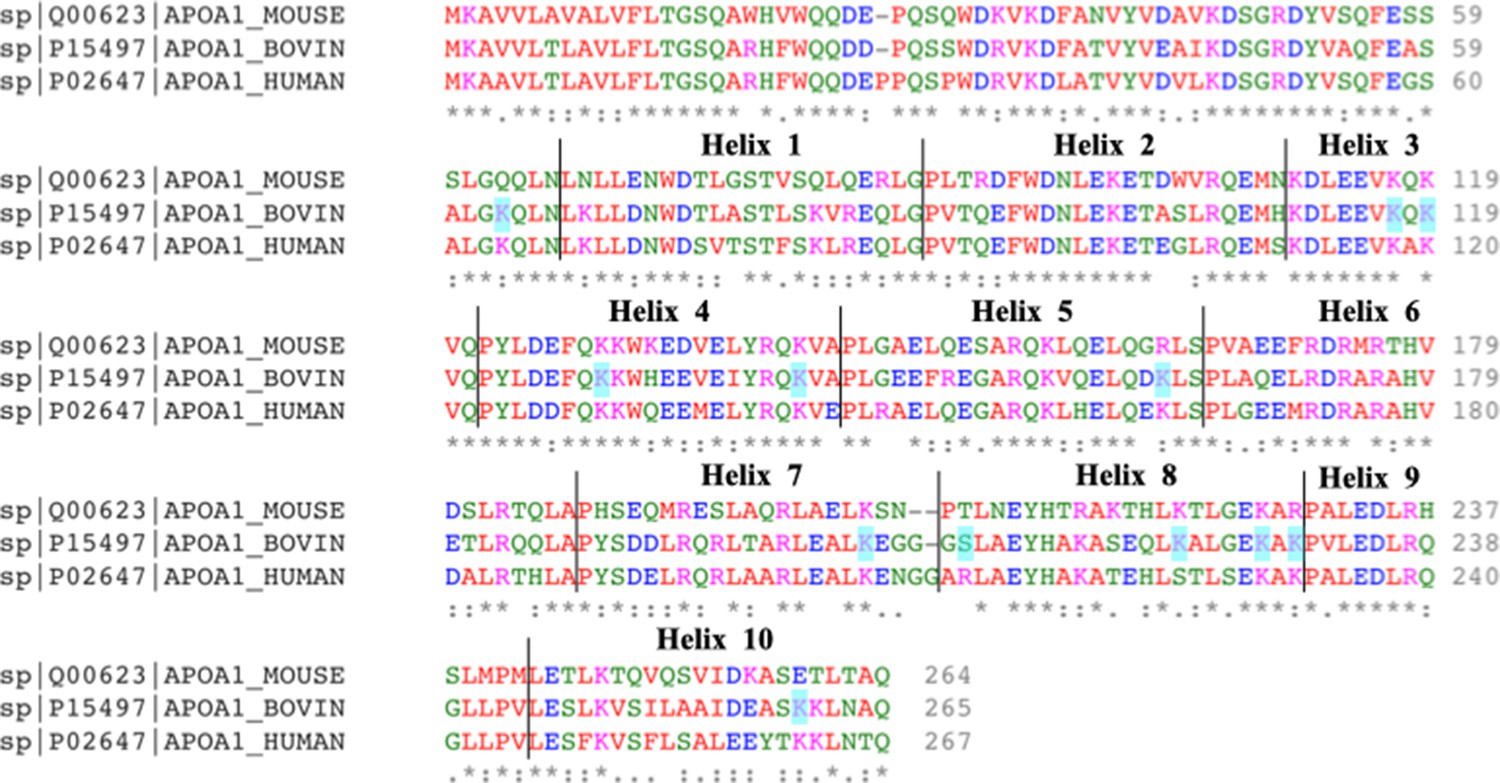
Pairwise sequence alignment of bovine and human ApoA1.
The different helices of ApoA1 are as annotated above the aligned sequences. The residues highlighted in cyan are the crosslinked residues. The asterisk (*) signifies positions that have a fully conserved residue, the colon (:) signifies conservation between groups of strong similar properties (scoring >0.5 in the Gonnet PAM 250 matrix) and the period (.) signifies conservation between groups of weakly similar properties (scoring <0.5 in the Gonnet PAM 250 matrix) while a blank signifies dissimilar residues. Crosslinked residues identified from crosslinking mass spectrometry (XL-MS) are highlighted in cyan. There is a sequence similarity of 78.65% between bovine and human ApoA1, 65.17% between mouse and human ApoA1, and 66.79% between bovine and mouse ApoA1 (calculated by multiple sequence alignment, NCBI protein blast). Generated with Clustal Omega v1.2.4.
Author response image 1
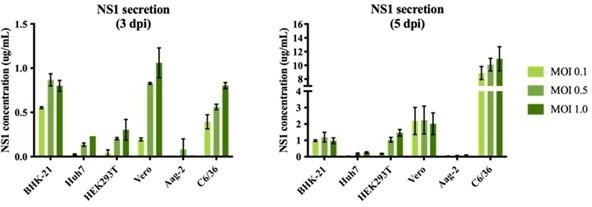
sNS1 secretion in different mammalian and mosquito cell lines after DENV2 infection.
The NS1 secretion level is measured using PlateliaTM Dengue NS1 Ag ELISA kit (Bio-Rad) on day 3 (left) and day 5 (right) post infection respectively.
Author response image 2
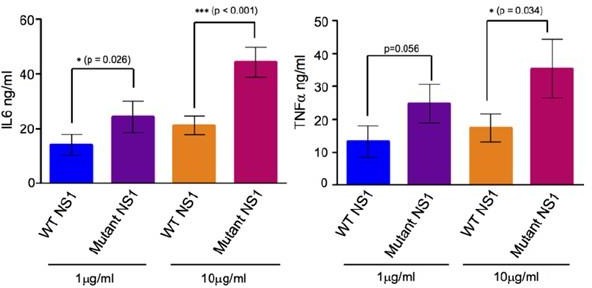
(A) IL6 and (B) TNFa concentrations measured in the supernatants of human PBMCs incubated with either 1µg/ml or 10µg/ml of the BHK-21 immunoaffinity-purified WT and TS mutant sNS1 for 24 hours.
Data is adapted from Chan et al., 2019.
Author response image 3
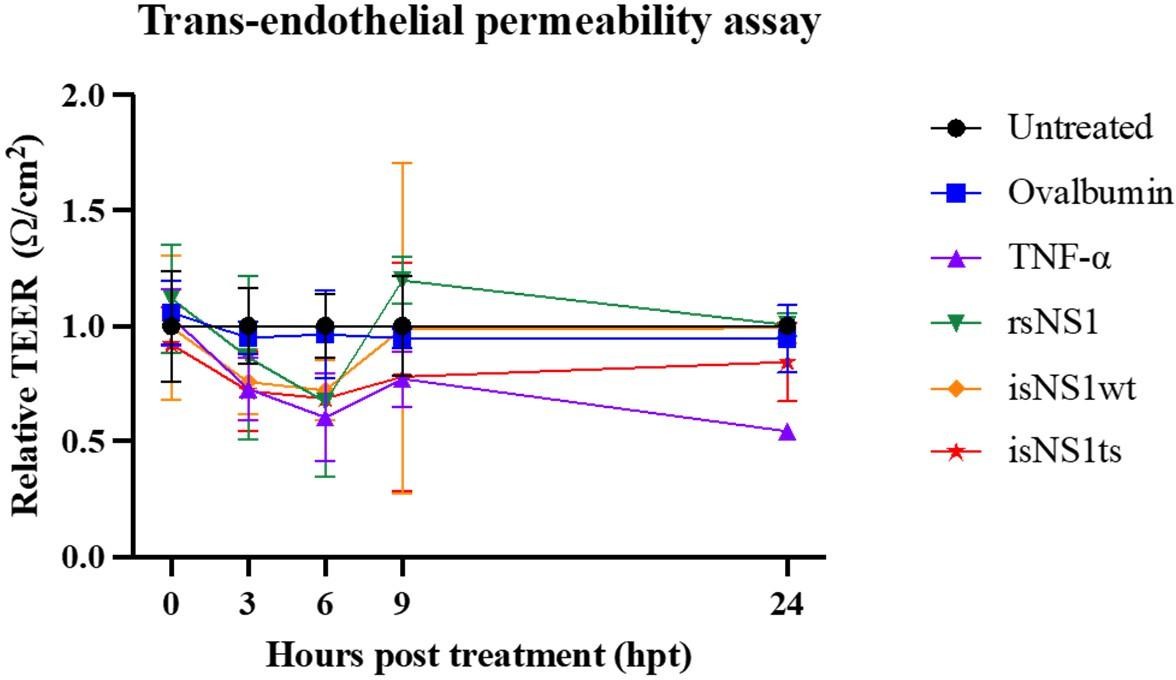
Functional assessment of isNS1wt and isNS1ts on vascular permeability in vitro.
A trans-endothelial permeabilty assay via measurement of the transendothelial electrical resistance (TEER) on human umbilical vascular endothelial cells (hUVEC) was performed, as described previously (Puerta-Guardo et al., 2019, Cell Rep). Ovalbumin serves as the negative control, while TNF-α and rsNS1 serves as the positive controls.
Author response image 4
(A) Representative negative stain micrograph of sNS1wt (B) Representative 2D averages of negative stained isNS1wt. Red arrows indicating the characteristic wing-like protrusions of NS1 inserted in HDL. (C) Data adapted from Figure 2 in Benfrid et al. (2022).
Author response image 5
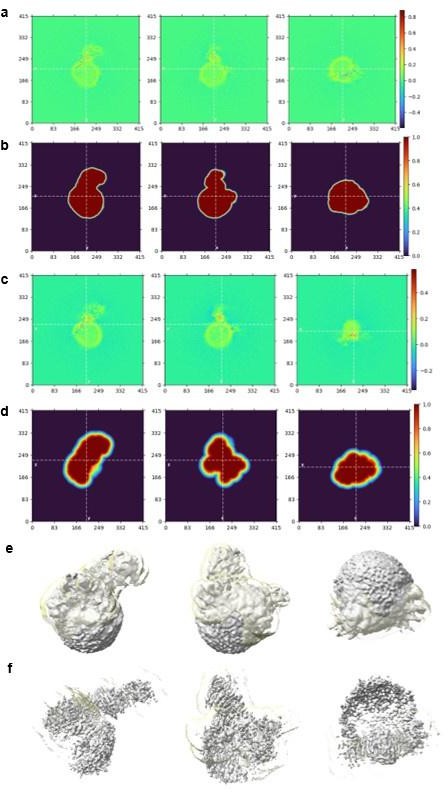
Real Space Slices of map and mask used during Local Refinement for overall structure (a-b) and focused mask on NS1 region (c-d). The corresponding map (grey) contoured at 0.05 (e) and 0.135 (f) in similar orientations as shown for the real space slices of map and masks. The focused mask of NS1 used is colored in semi-transparent yellow. Real Space Slices of map and mask are generated during data processing in Cryosparc 4.0 and the map figures were prepared using ChimeraX.
Tables
Table 1
CryoEM data collection statistics.
| isNS1ts | isNS1wt:Ab56.2 | isNS1wt:Fab56.2 | isNS1ts:Fab56.2 | |
|---|---|---|---|---|
| Grid type | gAU | gAU | gAU | gAU |
| Microscope | Titan Krios G3 | |||
| Voltage (keV) | 300 | |||
| Camera | Gatan K2 | Gatan K2 | Gatan K2 | Gatan K3 |
| Magnification (nominal) | 165,000 | 165,000 | 165,000 | 105,000 |
| Pixel size (Å/pixel) | 0.85 | 0.85 | 0.85 | 0.858 |
| Total electron dose (e-/Å2) | 53 | 53 | 70 | 60 |
| Exposure rate (e-/Å2/s) | 8.8 | 8.8 | 7 | 10.2 |
| Number of frames | 40 | 40 | 50 | 50 |
| Defocus range (μm) | 1.2–2.0 | 1.2–2.0 | 1.0–1.8 | 0.7–1.5 |
| Automation software | EPU | SerialEM | ||
| Energy filter slit width | 20 eV | |||
| Micrographs collected (no.) | 3146 | 2556 | 2559 | 5443 |
| Micrographs post-clean (no.) | 3000 | 2072 | 2090 | 4241 |
Table 2
EDEN2 NS1 peptides used in epitope mapping.
Residues in red are the difference compared to DENV2 16681. Peptides 57 and 60 (aa residues 281–295 and 296–310, respectively) failed the QC check, no peptide made.
| Peptide # | AA residues # | AA residues |
|---|---|---|
| 2 | 6–20 | VSWKNKELKCGSGIF |
| 49 | 241–255 | MIIPKNFAGPVSQHN |
| 50 | 246–260 | NFAGPVSQHNYRPGY |
| 51 | 251–265 | VSQHNYRPGYHTQTA |
| 52 | 256–270 | YRPGYHTQTAGPWHL |
| 53 | 261–275 | HTQTAGPWHLGRLEM |
| 54 | 266–280 | GPWHLGRLEMDFDFC |
| 55 | 271–285 | GRLEMDFDFCEGTTV |
| 56 | 276–290 | DFDFCEGTTVVVTED |
| 58 | 286–300 | VVTEDCGNRGPSLRT |
| 59 | 291–305 | CGNRGPSLRTTTASG |
| 61 | 301–315 | TTASGKLITEWCCRS |
| 62 | 306–320 | KLITEWCCRSCTLPP |
| 63 | 311–325 | WCCRSCTLPPLRYRG |
| 64 | 316–330 | CTLPPLRYRGEDGCW |
| 65 | 321–335 | LRYRGEDGCWYGMEI |
| 66 | 326–340 | EDGCWYGMEIRPLKE |
| 67 | 331–345 | YGMEIRPLKEKEENL |
| 68 | 336–350 | RPLKEKEENLVNSLV |
| 69 | 341–352 | KEENLVNSLVTA |
Additional files
-
MDAR checklist
- https://cdn.elifesciences.org/articles/90762/elife-90762-mdarchecklist1-v1.docx
-
Supplementary file 1
Raw file of label-free quantification (LFQ) analysis of purified isNS1 proteins using liquid chromatography–mass spectrometry (LC-MS).
- https://cdn.elifesciences.org/articles/90762/elife-90762-supp1-v1.xlsx
-
Supplementary file 2
Raw file of crosslinking mass spectrometry (XL-MS) analysis of purified isNS1 proteins generated from metamorpheus search for both isNS1wt and isNS1ts.
- https://cdn.elifesciences.org/articles/90762/elife-90762-supp2-v1.xlsx
-
Supplementary file 3
Raw file of crosslinking mass spectrometry (XL-MS) crosslink distances between C-alphas when the identfied links are mapped on the predicted and fitted protein models of purified isNS1.
- https://cdn.elifesciences.org/articles/90762/elife-90762-supp3-v1.xlsx
-
Supplementary file 4
Raw file of crosslinking mass spectrometry (XL-MS) analysis of purified isNS1 proteins generated from metamorpheus search for DENV2 rsNS1-ApoA1.
- https://cdn.elifesciences.org/articles/90762/elife-90762-supp4-v1.xlsx
-
Supplementary file 5
Raw file of crosslinking mass spectrometry (XL-MS) crosslink distances between C-alphas when the identfied links are mapped on the different NS1 oligomer models.
- https://cdn.elifesciences.org/articles/90762/elife-90762-supp5-v1.xlsx
-
Supplementary file 6
Raw file of hydrogen-deuterium exchange mass spectrometry (HDX-MS) analysis for different peptides of NS1c in the presence and absence of Fab562 at various labeling times.
- https://cdn.elifesciences.org/articles/90762/elife-90762-supp6-v1.xlsx
Download links
A two-part list of links to download the article, or parts of the article, in various formats.
Downloads (link to download the article as PDF)
Open citations (links to open the citations from this article in various online reference manager services)
Cite this article (links to download the citations from this article in formats compatible with various reference manager tools)
Secreted dengue virus NS1 from infection is predominantly dimeric and in complex with high-density lipoprotein
eLife 12:RP90762.
https://doi.org/10.7554/eLife.90762.3


