Dynamic allosteric networks drive adenosine A1 receptor activation and G-protein coupling
- Global AI Drug Discovery Center, College of Pharmacy and Graduate School of Pharmaceutical Science, Ewha Womans University, Republic of Korea
Figures
Figure 1 with 8 supplements
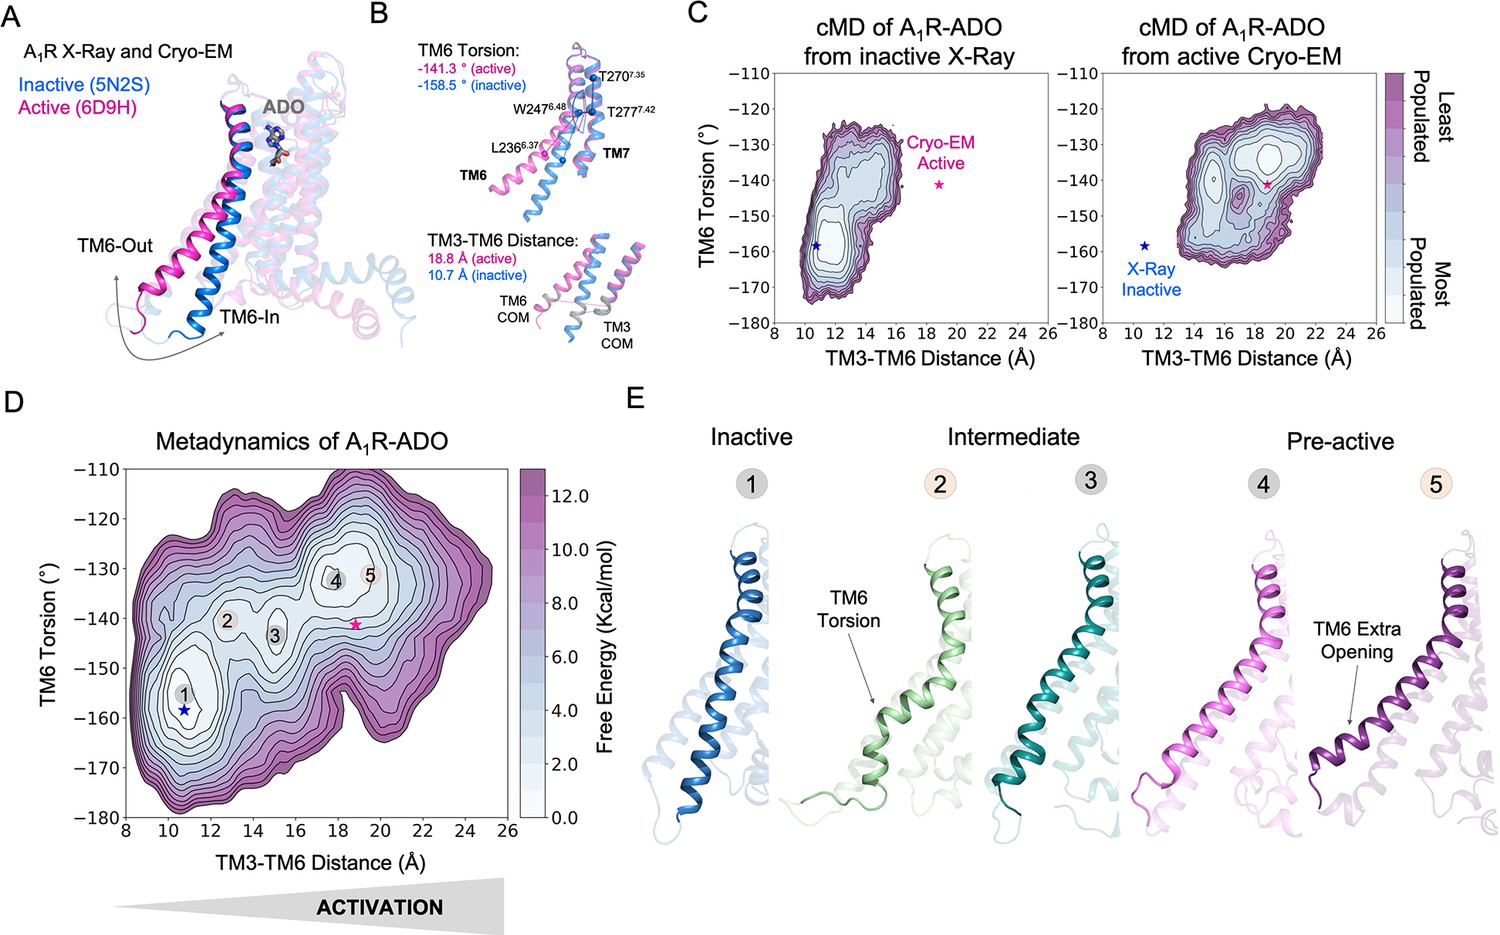
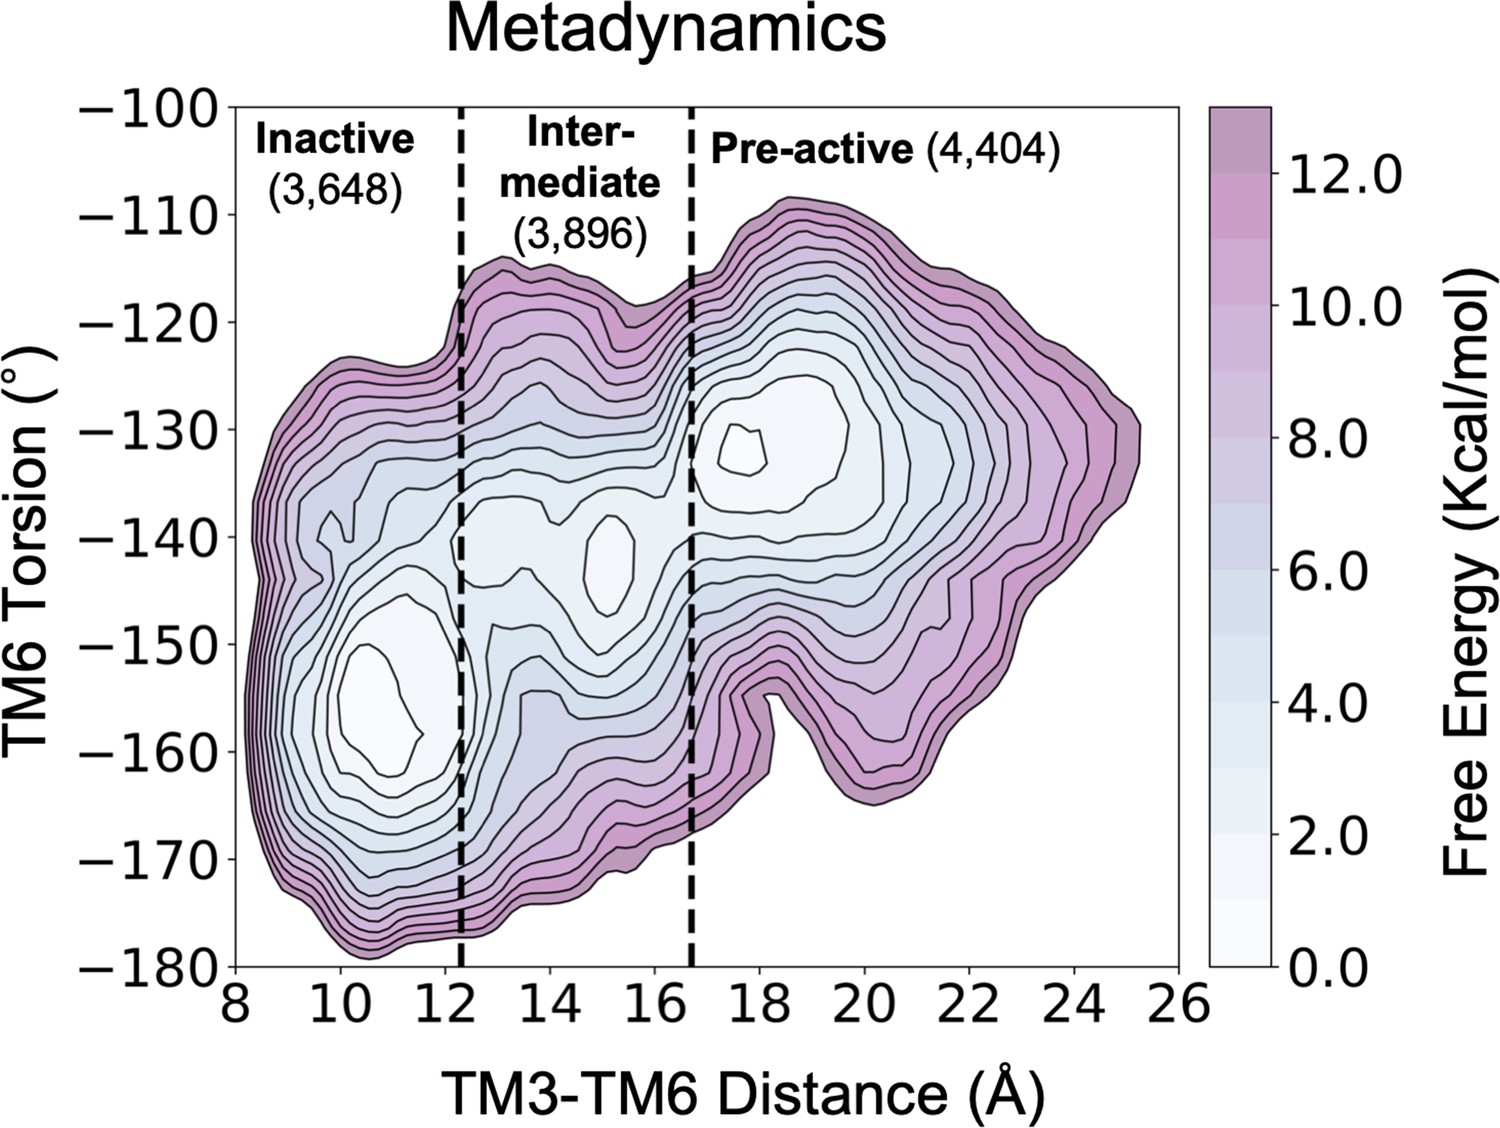
Free energy landscape (FEL) of A1R activation in the presence of adenosine (ADO).
(A) TM6 inward-to-outward conformational transition observed in the inactive (PDB 5N2S) and active (PDB 6D9H) X-Ray and Cryo-EM structures. (B) Features used to follow the TM6 inward-to-outward transition (receptor activation) in this work. The TM6 torsion corresponds to the dihedral angle formed by the alpha carbon atoms of L2366.37, W2476.48, T2777.42, and T2707.35. For the TM3-TM6 intracellular ends distance, we computed the center of mass (COM) distance between the backbone atoms of TM3(Y2266.27, G2276.28, K2286.29, L2306.30, and E2306.31) and TM6(R1053.50, Y1063.51, L1073.52, R1083.53, and V1093.54). The X-ray and Cryo-EM values are also shown. (C) Population analysis obtained from conventional molecular dynamics (cMD) simulations of A1R activation starting from the inactive X-Ray and active Cryo-EM structures, the inactive X-ray and active Cryo-EM coordinates are projected as blue and magenta stars, respectively. (D) Reconstruction of the FEL associated with the A1R activation obtained from metadynamics simulations. The most relevant conformational states are labeled from 1 to 5. Note that the lowest energy states (1,3 and 4) are labeled in gray while the others (2 and 5) are in orange. The X-ray and Cryo-EM coordinates are also projected. (E) Representative structures of the inactive (1), Intermediate (2-3), and Pre-active (4-5) conformational states sampled along A1R-ADO activation.
Figure 1—figure supplement 1
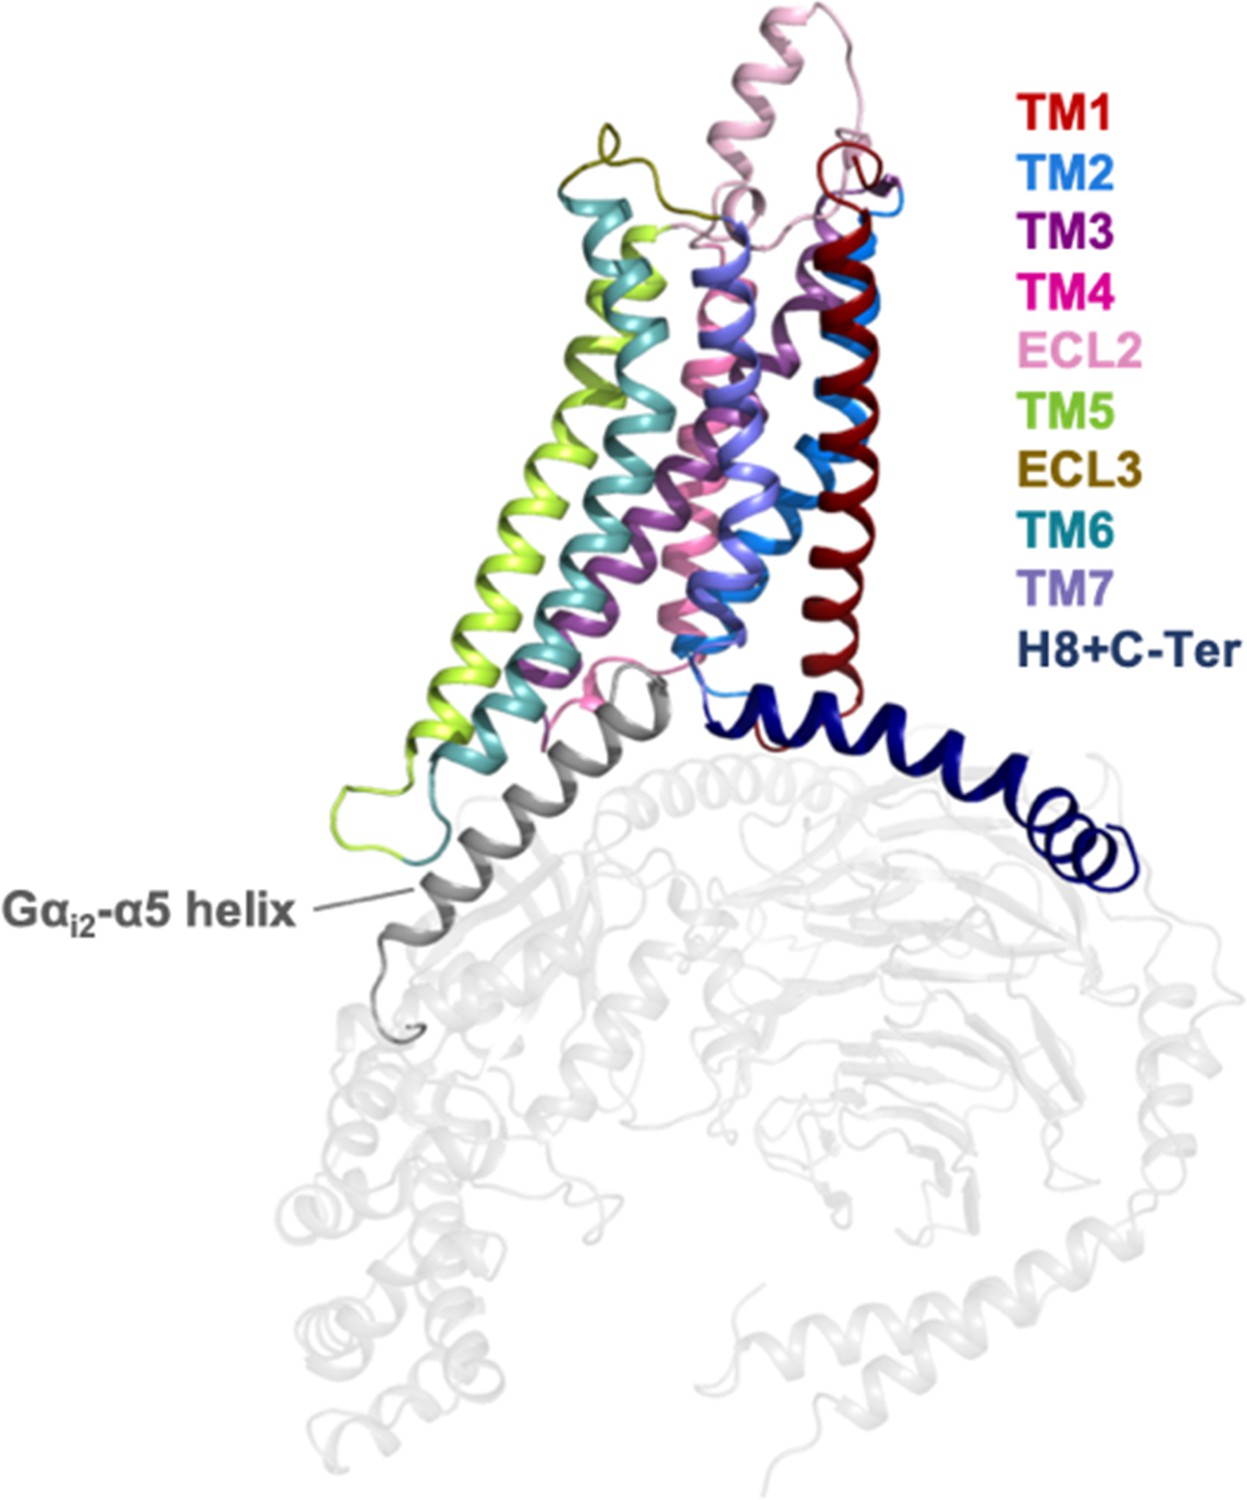
Representation of the A1R receptor in complex with heterotrimeric Gi2 protein (PDB 6D9H).
The helices and loops of the A1R receptor are depicted with different colors while the heterotrimeric Gi2 protein is in gray. The Gαi2-α5 helix that binds into the intracellular cavity of the receptor upon activation is highlighted.
Figure 1—figure supplement 2
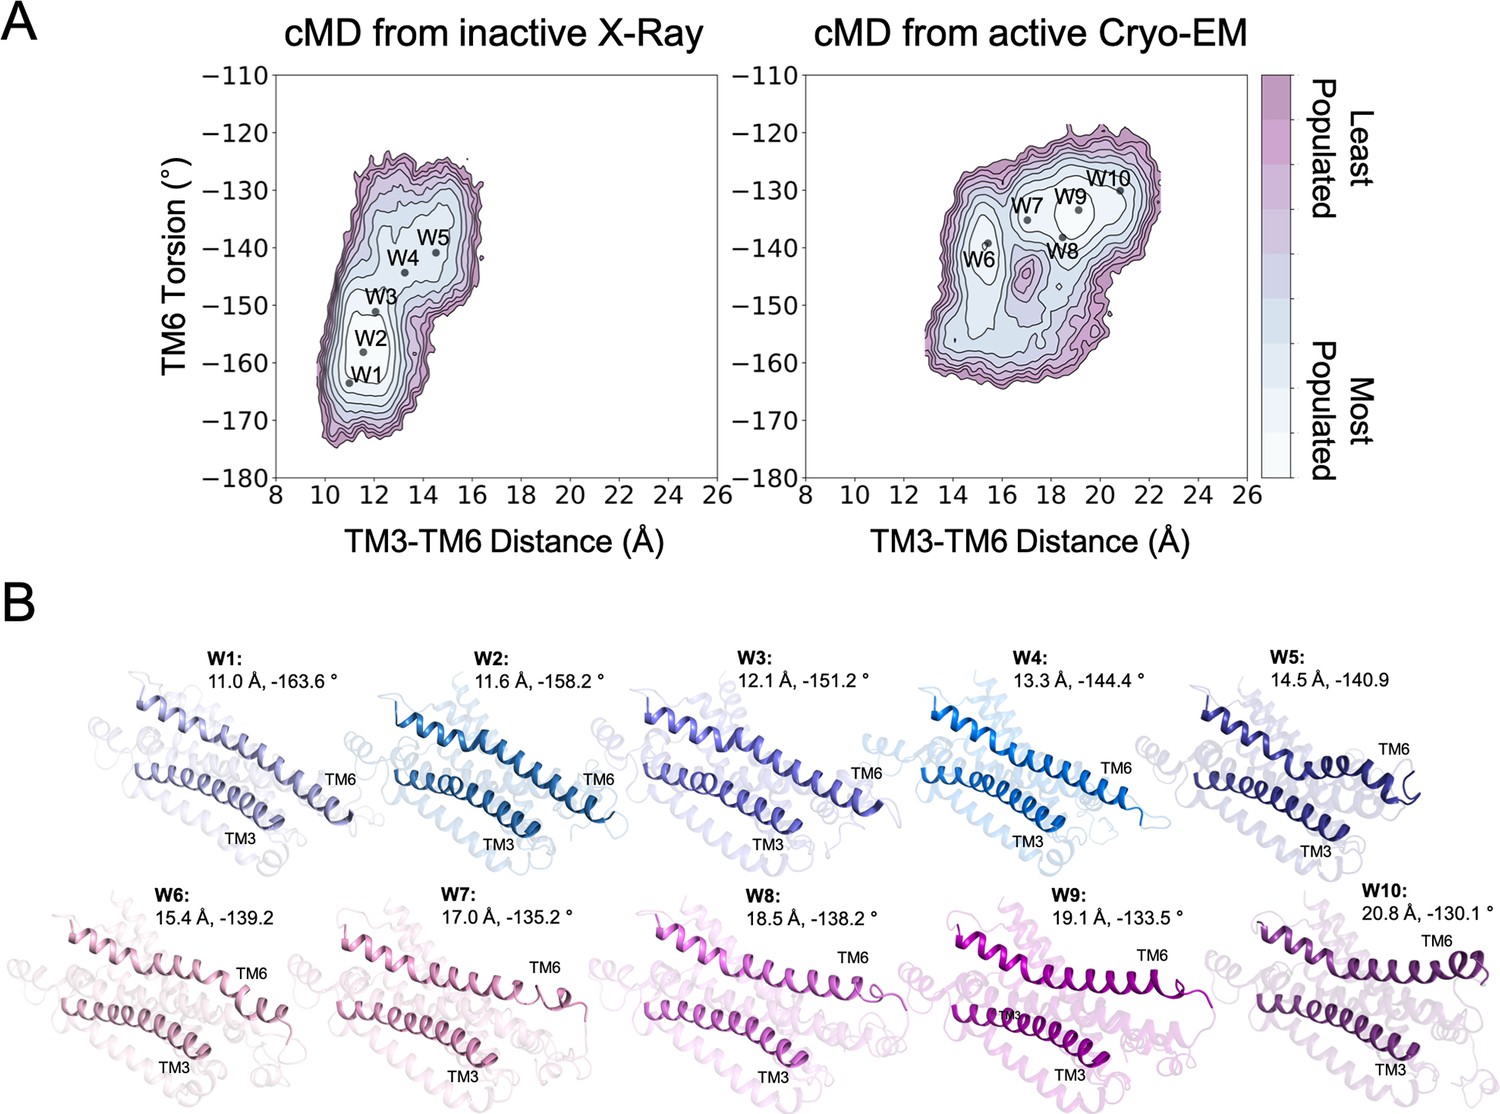
Structures used as starting points for the walker metadynamics simulations.
(A) Population analysis of the A1R activation obtained from conventional molecular dynamics (cMD) simulations starting from the inactive X-Ray and active Cryo-EM structures, the coordinates of the walker structures (W1-10) are projected as black dots. (B) Representation of the walker (W1-10) structures. The CV1 (TM3-TM6 Distance) and CV2 (TM6 Torsion) values are shown. The TM3 and TM6 helices are highlighted.
Figure 1—figure supplement 3
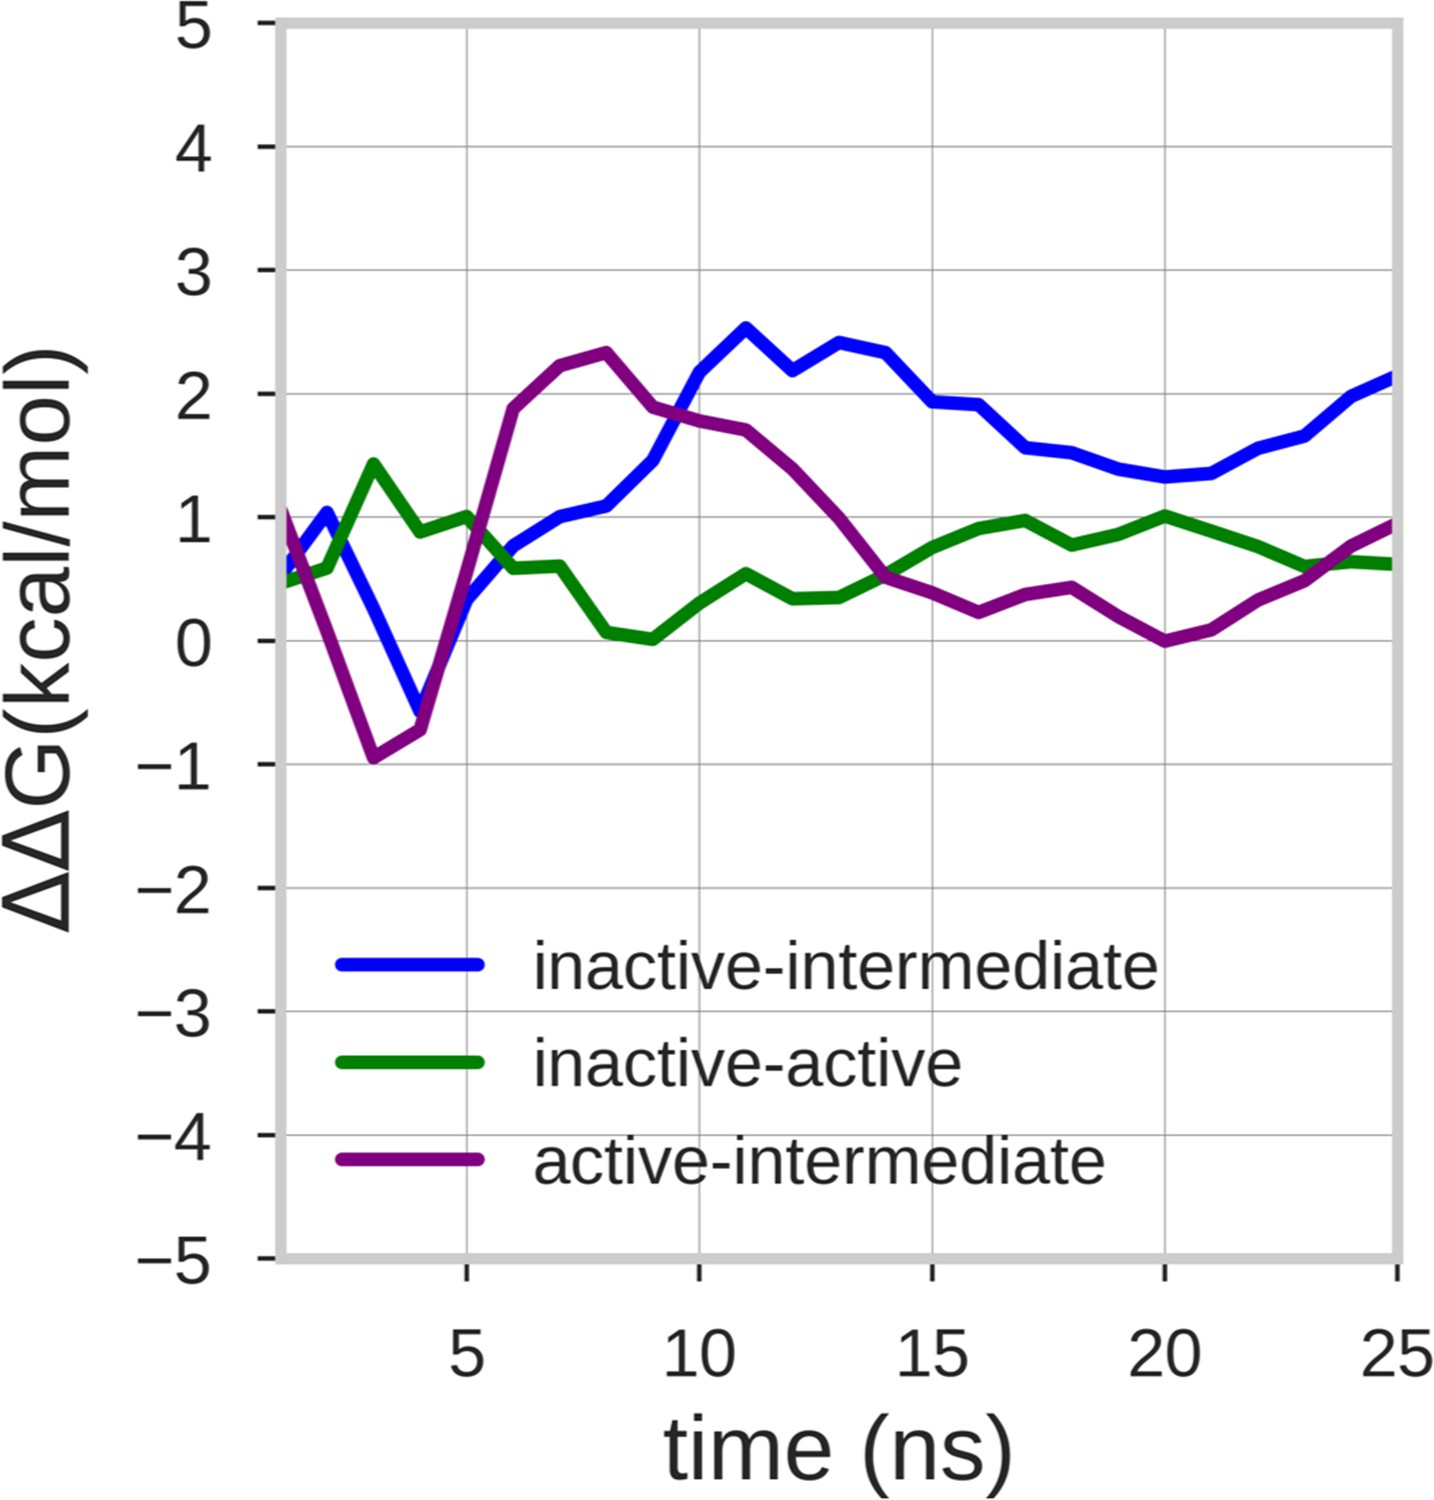
Estimate of the free energy differences between the energy minima of the free energy surface.
The lines represent the mean ΔΔG value of the 10 walker replicas along the simulation time. The energy differences between the inactive-active, inactive-intermediate, and active-intermediate energy minima are depicted in green, blue, and purple, respectively.
Figure 1—figure supplement 4

Evolution of the CV1 (TM3-TM6 Distance) over the simulation time.
(A) Plot showing that the multiple-walkers (W1-10) sampling covers the CV space. (B) For clarity, only two walkers (W1 and W2) are represented.
Figure 1—figure supplement 5
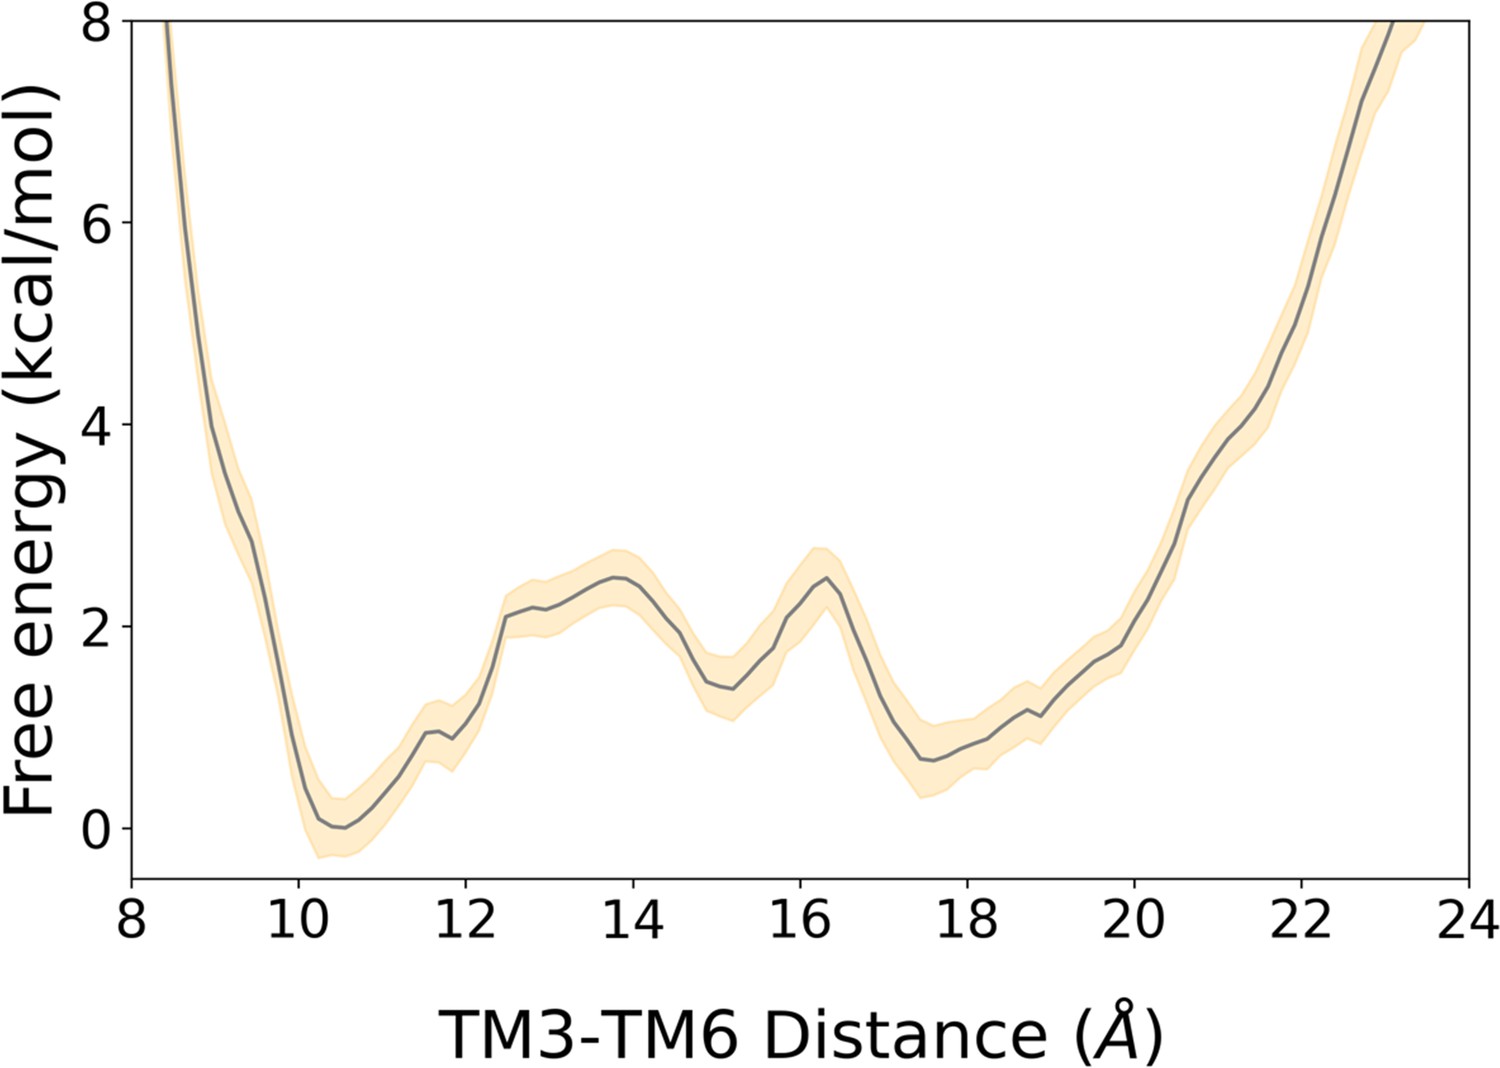
2D free energy landscape of A1R associated with the TM3-TM6 intracellular ends distance and its associated error.
The free energy landscape is represented by a gray line while its associated error corresponds to the yellow-shaded area. The error was estimated using the block averaging technique, as described in the Materials and Methods section.
Figure 1—figure supplement 6
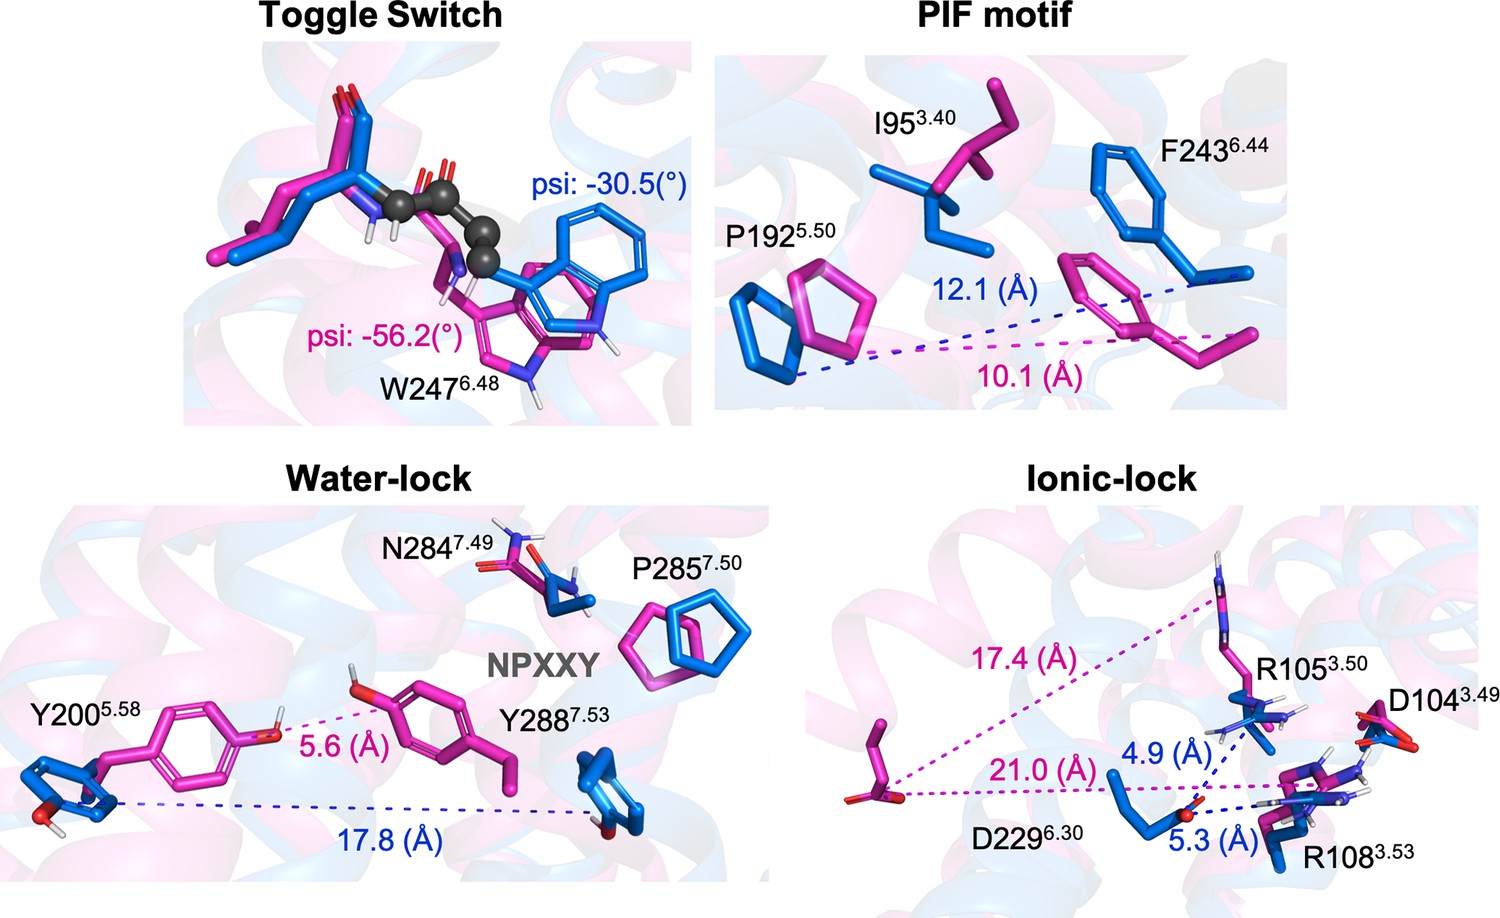
Representation of relevant micro-switches for A1R.
The inactive X-Ray (PDB 5N2S) and active Cryo-EM (PDB 6D9H) structures are displayed in blue and magenta, respectively. The metrics used in this work are highlighted in spheres for the psi dihedral and in dashed lines for the different distances. The values corresponding to both, inactive and active structures are also shown.
Figure 1—figure supplement 7
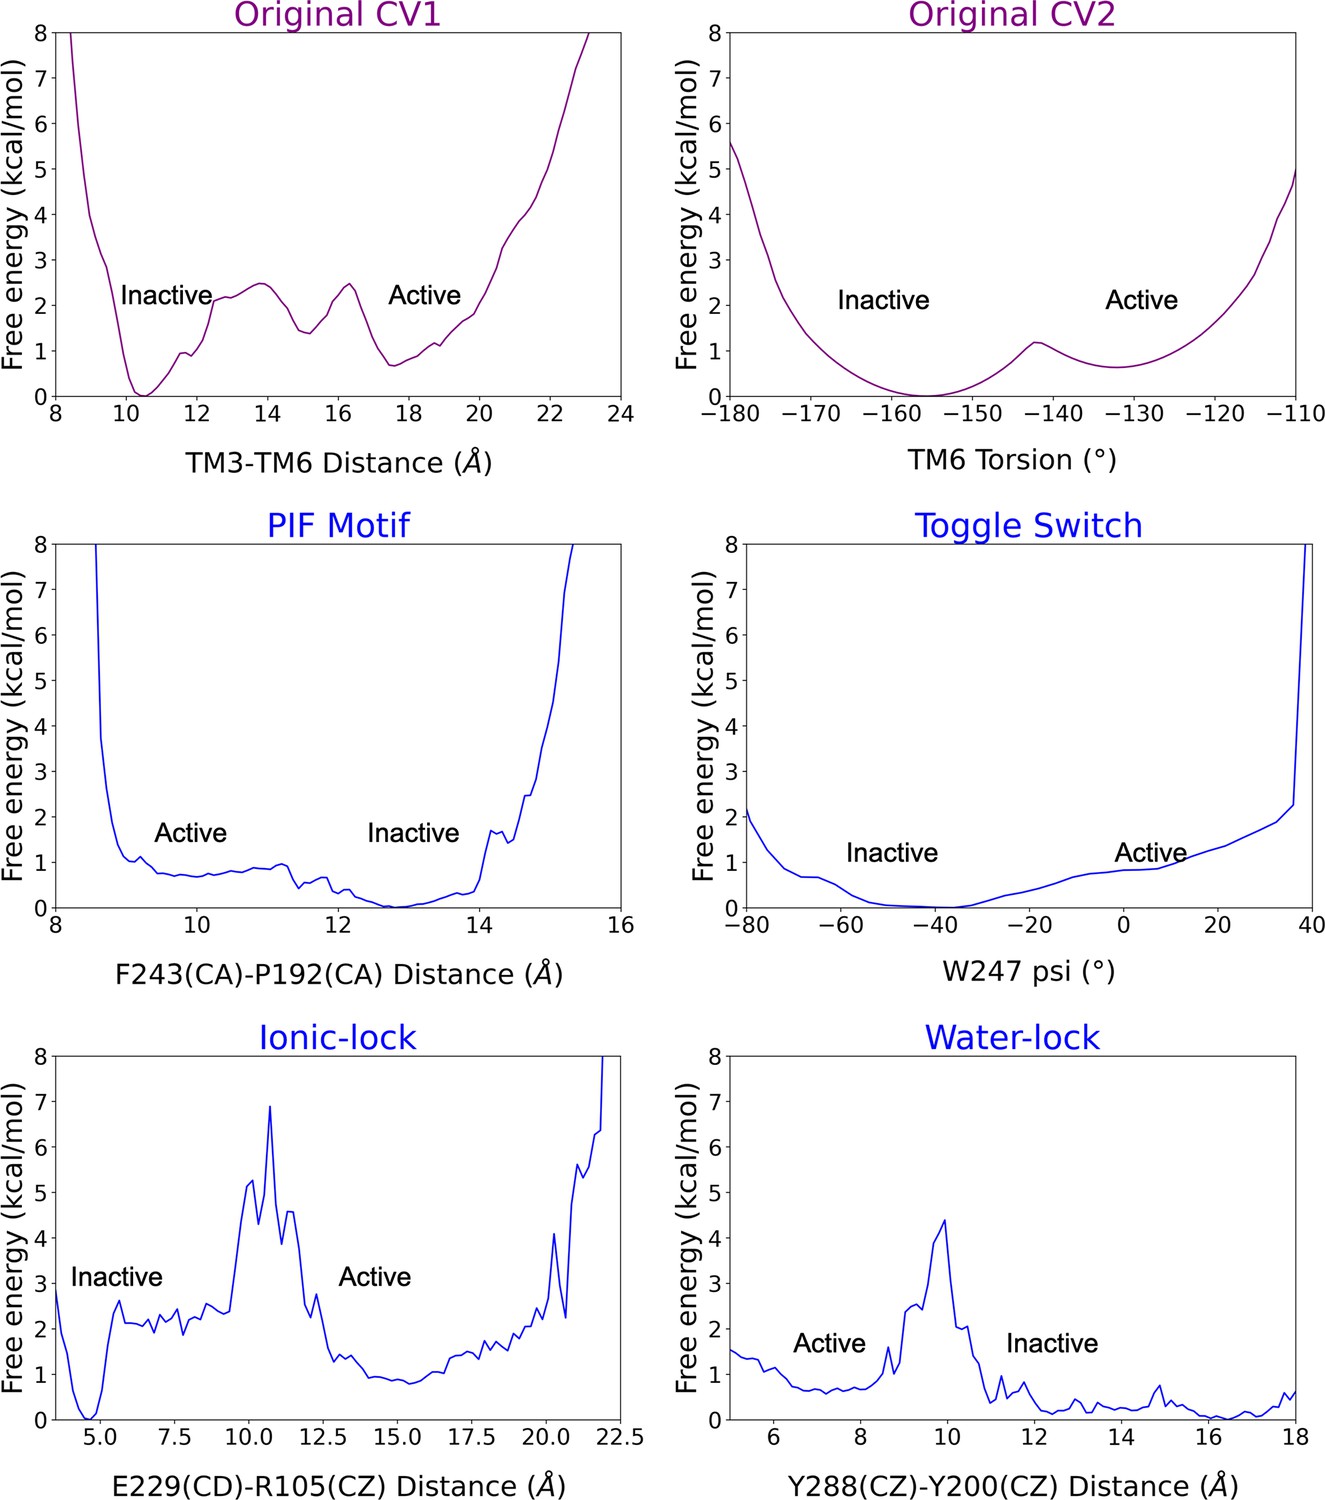
Reweighting of the metadynamics simulations onto 2D free energy profiles.
The original biased collective variables (CVs) are shown in purple while the unbiased CVs (i.e. the micro-switches) are in blue. The inactive and active regions of the CV space are highlighted. Note that CV1 presents a higher contribution to the original energy barrier of activation than CV2. The PIF motif and toggle switch show similar energy barriers to CV2, while the ionic-lock and water lock display higher energy barriers than CV1. Capturing the distinct energy barriers associated with unbiased micro-switches highlights the accuracy of the metadynamics simulations to reproduce the pathway of activation.
Figure 1—figure supplement 8
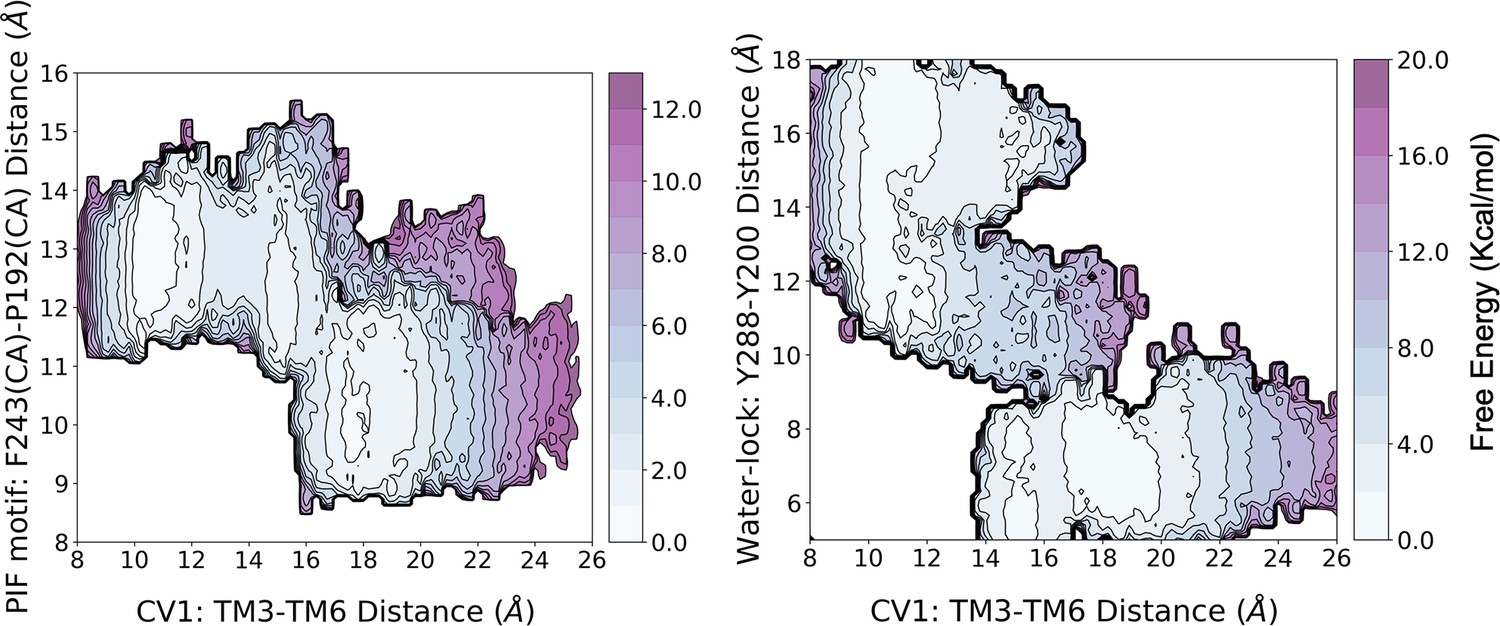
Reweighting of the metadynamics simulations onto 3D free energy profiles.
The reweighting analysis shows that the activation energy barrier associated with the free energy landscape (FEL) of CV1 and the PIF motif is similar to that of the original biased FEL (i.e. CV1 and CV2). However, for the FEL associated with CV1 and the water-lock, the analysis predicts a higher energy barrier of approximately two-fold.
Figure 2 with 1 supplement
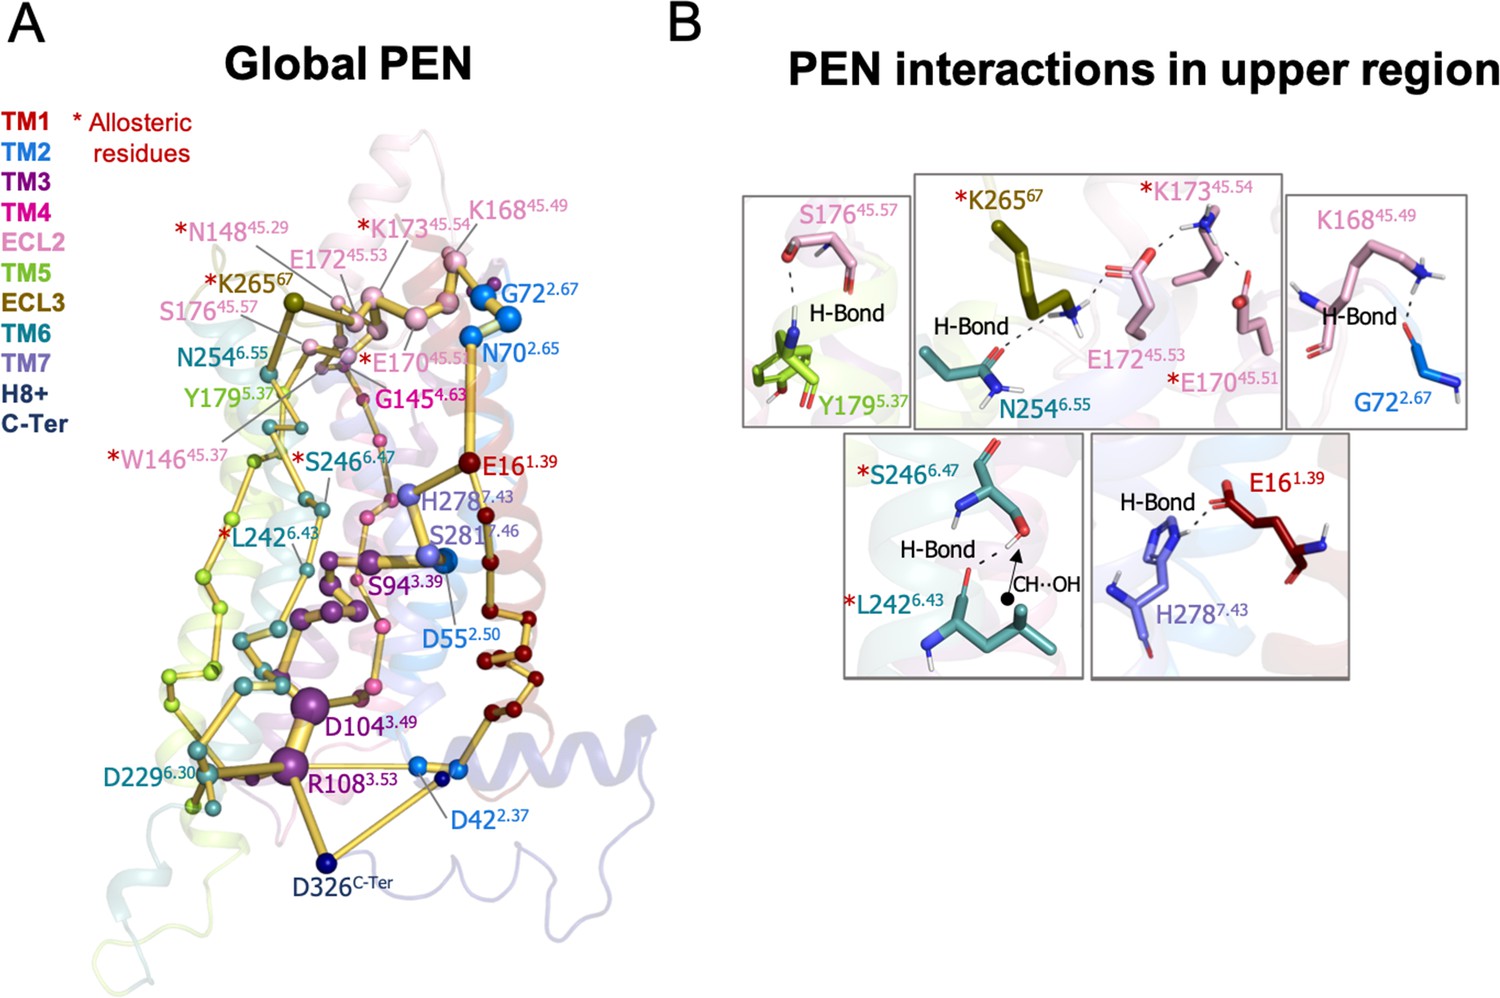
Protein energy networks (PEN) of A1R-ADO conformational ensemble.
The PEN identifies extra and intracellular communication centers together with the allosteric pathways that interconnect them. The PEN residues (nodes) are represented by colored spheres as a function of the receptor region (e.g. TM6 nodes in teal) while the allosteric pathways (edges) as yellow-orange sticks. The size of each edge and node corresponds to their importance for allosteric communication. The experimentally identified allosteric residues captured in the PEN nodes are labeled with a red asterisk. (B) Relevant interactions of the PEN in the upper region of the receptor.
Figure 2—figure supplement 1

Adenosine interactions with protein energy networks (PEN) residues in the A1R-ADO conformational ensemble.
Representative structures from the broad range of conformations sampled by adenosine (ADO) in the metadynamics simulations are shown as gray sticks. The PEN residues (nodes) that perform transient interactions with ADO are represented as colored spheres as a function of the receptor region (e.g. TM6 nodes in teal) while the rest of the nodes as white spheres. Note that the microswitch W247 is identified. The allosteric pathways (edges) are shown as yellow sticks.
Figure 3 with 2 supplements
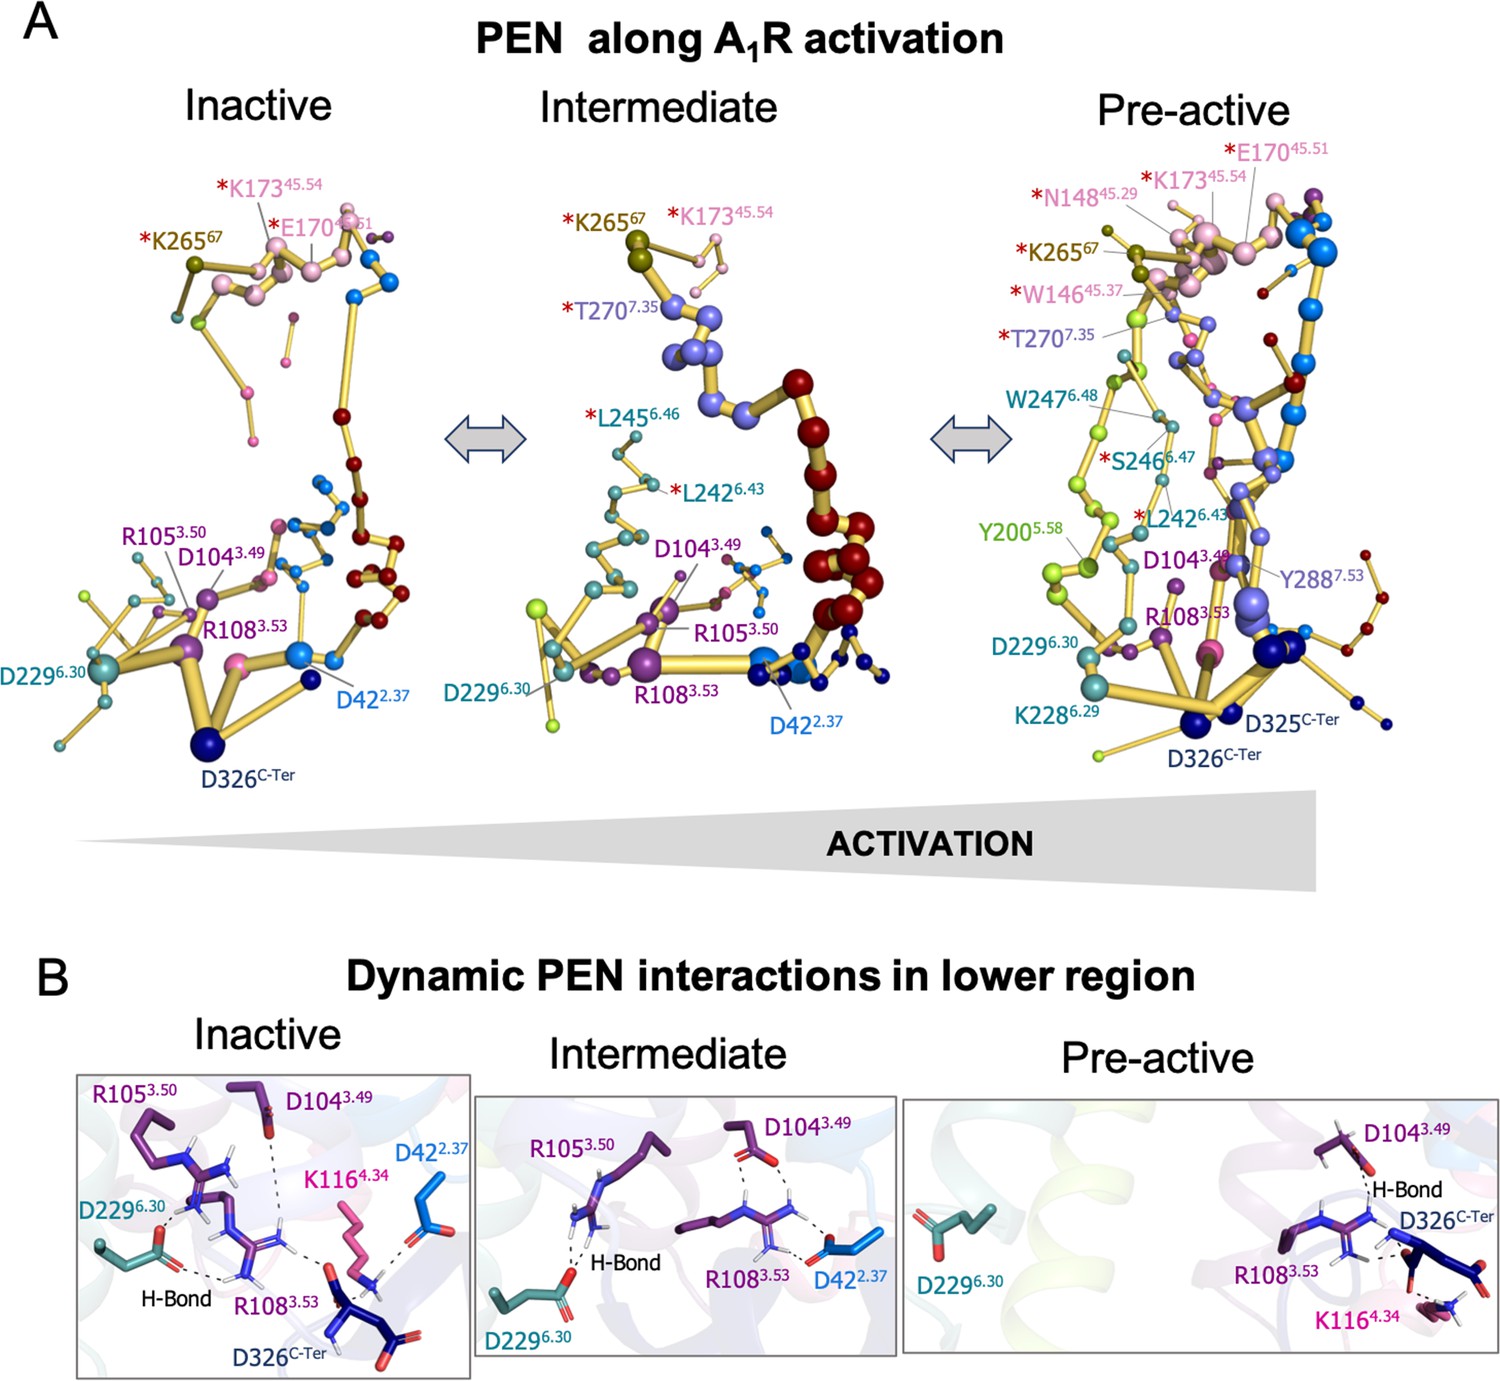
Protein energy networks (PEN) of A1R-ADO in the inactive, intermediate, and pre-active states.
(A) The PEN residues (nodes) are represented by colored spheres as a function of the receptor region (e.g. TM6 nodes in teal) while the allosteric pathways (edges) as yellow-orange sticks. The size of each edge and node corresponds to their importance for allosteric communication. The experimentally identified allosteric residues captured in the PEN nodes are labeled with a red asterisk. The allosteric communication is enhanced along the receptor activation. (B) Relevant interactions found in the PEN of the lower region of the receptor that are altered along activation.
Figure 3—figure supplement 1
Representation of the free energy landscape (FEL) of A1R-ADO activation split into conformational states.
The inactive, intermediate, and pre-active regions of the FEL are separated by black dashed lines. The number of structures associated with each conformational state is also shown.
Figure 3—figure supplement 2

Illustration of the conformational dynamics of the micro-switches along A1R activation.
The histograms corresponding to the inactive, intermediate, and pre-active states are colored blue, green, and pink, respectively. The ionic-lock dynamics reveals that E229-R108 is the strongest interaction between TM6 and TM3 communication in the inactive ensemble, while in the intermediate state, the ionic lock is partially broken, and the strongest interaction shifts from E229-R108 to E229-R105. Notably, the micro-switches exhibit population distributions that follow the progression of the receptor along the activation pathway in a correlated manner.
Figure 4
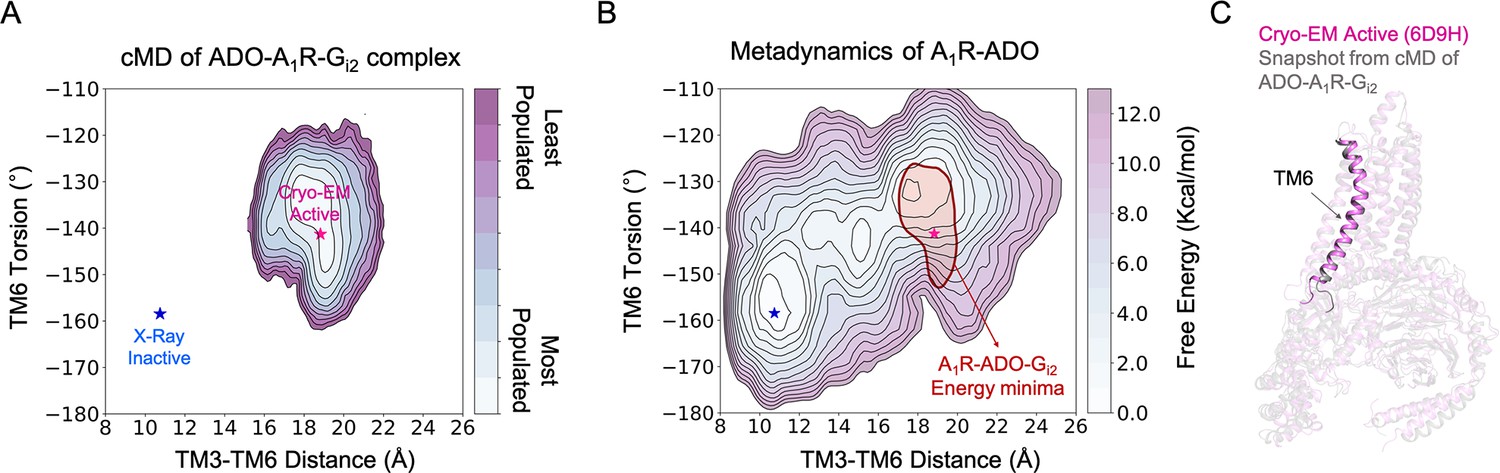
Effect of G-protein binding on the conformational ensemble of A1R-ADO.
(A) Population analysis of A1R activation in the ADO-A1R-Gi2 complex obtained from conventional molecular dynamics (cMD) simulations. The TM6 torsion corresponds to the dihedral angle formed by the alpha carbon atoms of L2366.37, W2476.48, T2777.42, and T2707.35. For the TM3-TM6 intracellular ends distance, we computed the center of mass (COM) distances between the backbone atoms of TM3(Y2266.27, G2276.28, K2286.29, L2306.30, and E2306.31) and TM6(R1053.50, Y1063.51, L1073.52, R1083.53, and V1093.54). The inactive and active X-ray and Cryo-EM coordinates are projected as blue and magenta stars, respectively. (B) Projection of the ADO-A1R-Gi2 energy minima obtained from cMD over the FEL associated with the A1R activation obtained from metadynamics simulations. The ADO-A1R-Gi2 energy minima (depicted in red) is centered on the coordinates of the active Cryo-EM structure. (C) Overlay of the active Cryo-EM structure (PDB 6D9H) and a representative snapshot from the ADO-A1R-Gi2 energy minima.
Figure 5
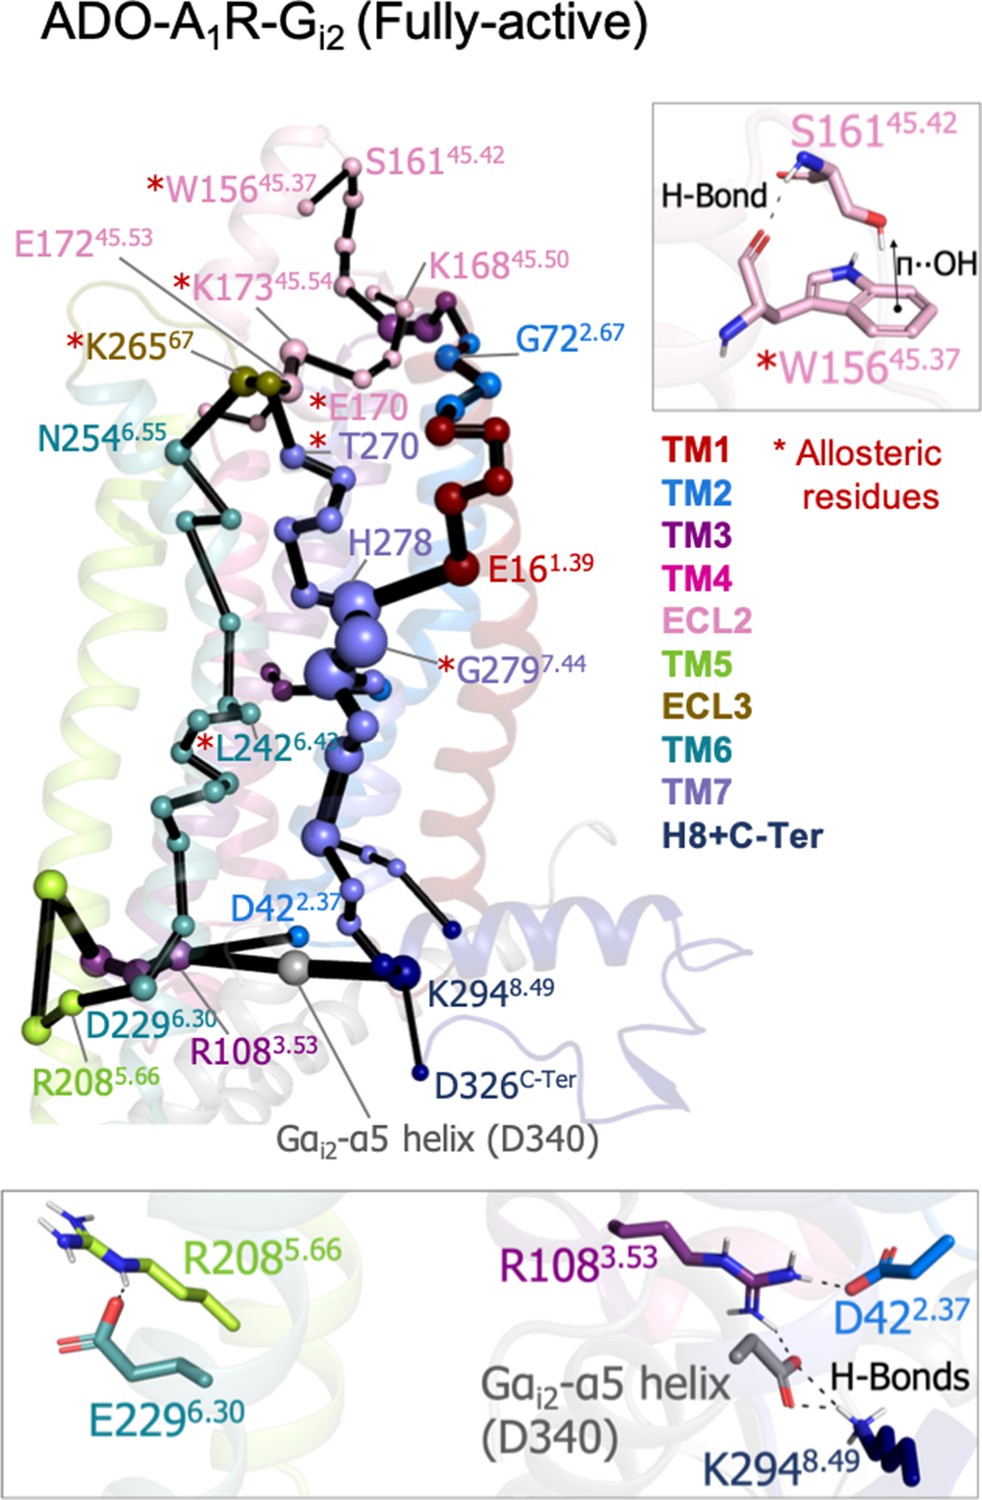
Effect of G-protein binding on A1R-ADO the protein energy networks (PEN) of A1R-ADO.
The PEN residues (nodes) are represented by colored spheres as a function of the receptor region (e.g. TM6 nodes in teal) while the allosteric pathways (edges) as yellow-orange sticks. The size of each edge and node corresponds to their importance for allosteric communication. The experimentally identified allosteric residues captured in the PEN nodes are labeled with a red asterisk. Relevant interactions of the PEN in the upper and lower regions of the receptor are also shown.
Figure 6
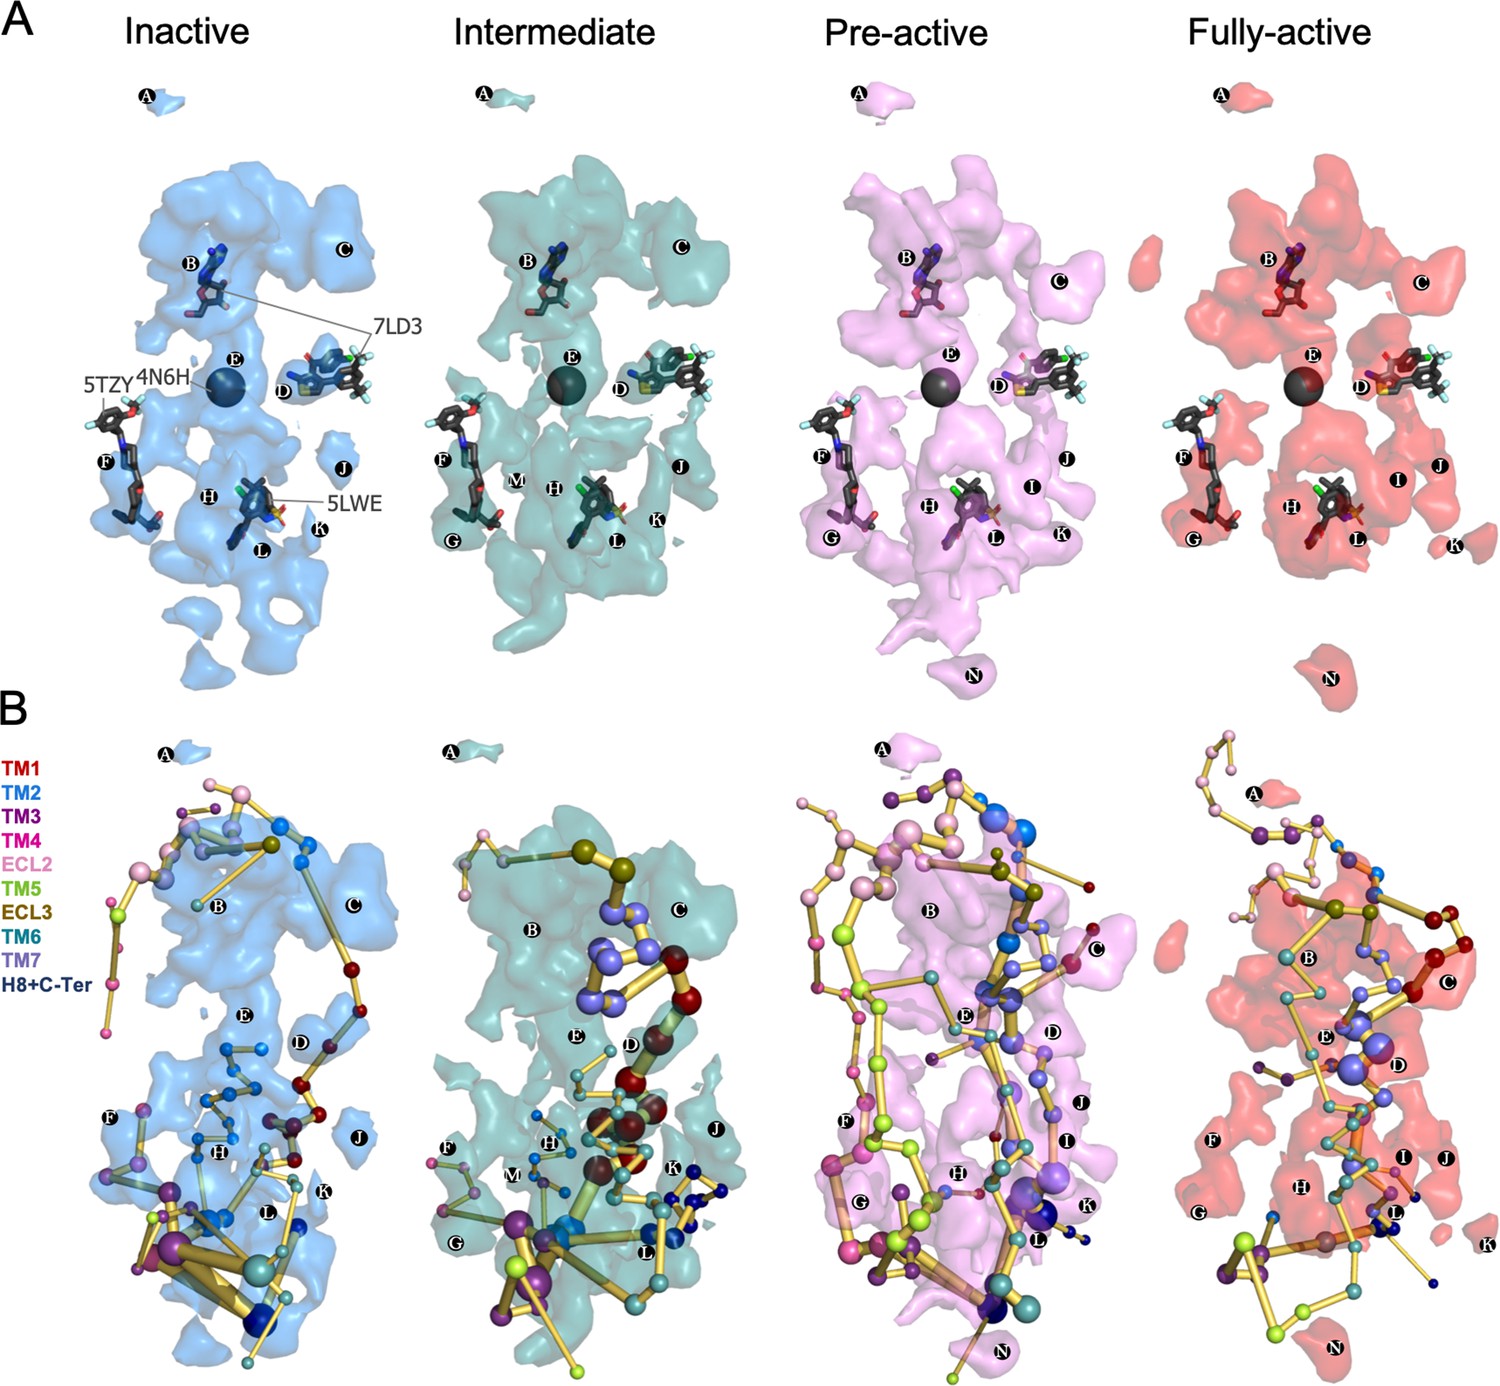
Energy coupling between the transient pockets formed along receptor activation.
(A) Iso-surface representation of the normalized frequency map (set at Φi=0.2 iso-value) obtained from MDPocked in the inactive (blue), intermediate (teal), pre-active (violet), and fully-active (red) ensembles. The transient pockets are labeled from A to N. The allosteric modulators that overlap with the pockets found are shown as dark gray sticks (PDB 7DL3, 5TZY, and 5LWE) and spheres (PDB 4N6H). (B) Overlap of the transient pockets and the protein energy networks (PEN). The PEN residues (nodes) are represented by colored spheres as a function of the receptor region (e.g. TM6 nodes in teal) while the allosteric pathways (edges) as yellow-orange sticks.
Figure 7 with 1 supplement
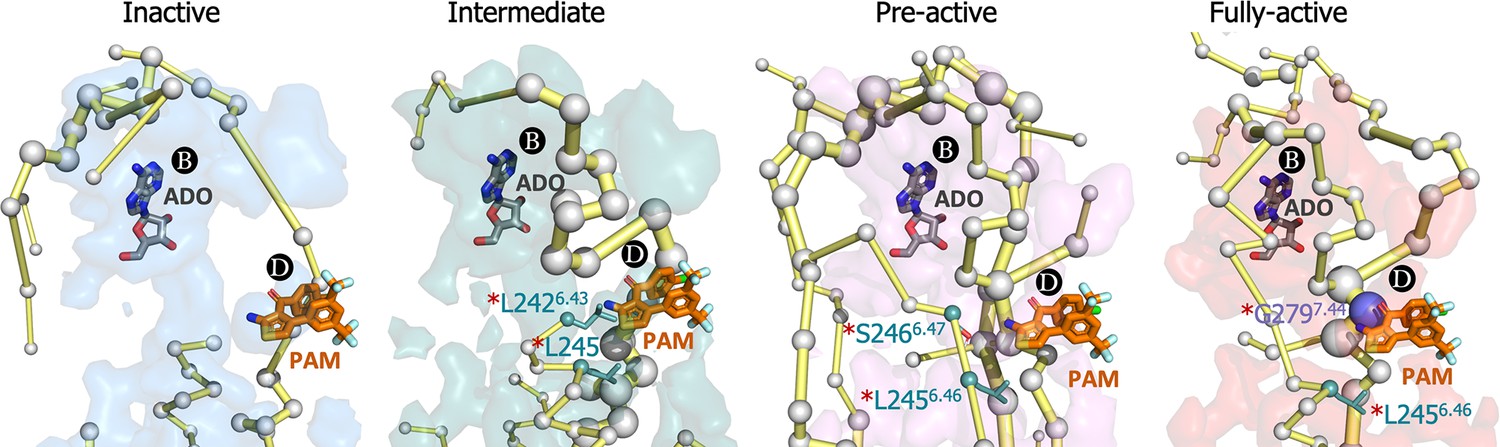
Energy coupling between pocket B and pocket D along receptor activation.
Zoom view of the transient pockets and protein energy networks of the upper region of the receptor. Adenosine (ADO) in pocket B and the MIPS521 positive allosteric modulator (PAM) in pocket D, both aligned from PDB 7LD3, are depicted in gray and orange sticks, respectively. The PEN residues (nodes) are represented by light gray spheres. The size of each edge and node corresponds to their importance for allosteric communication. The experimentally identified allosteric residues located in pocked D that affect the PAM are colored as a function of the receptor region (TM6 nodes in teal and TM7 nodes in purple) and highlighted with a red asterisk. The allosteric pathways (edges) are depicted as yellow-orange sticks.
Figure 7—figure supplement 1

A1R shallow pocket of the MIPS521 positive allosteric modulator (PAM), PDB 7LD3.
The MIPS521 PAM is depicted in orange sticks while its interacting residues are colored as a function of the receptor region (e.g. TM6 nodes in teal). The experimentally identified allosteric residues are highlighted with a red asterisk.
Figure 8 with 1 supplement
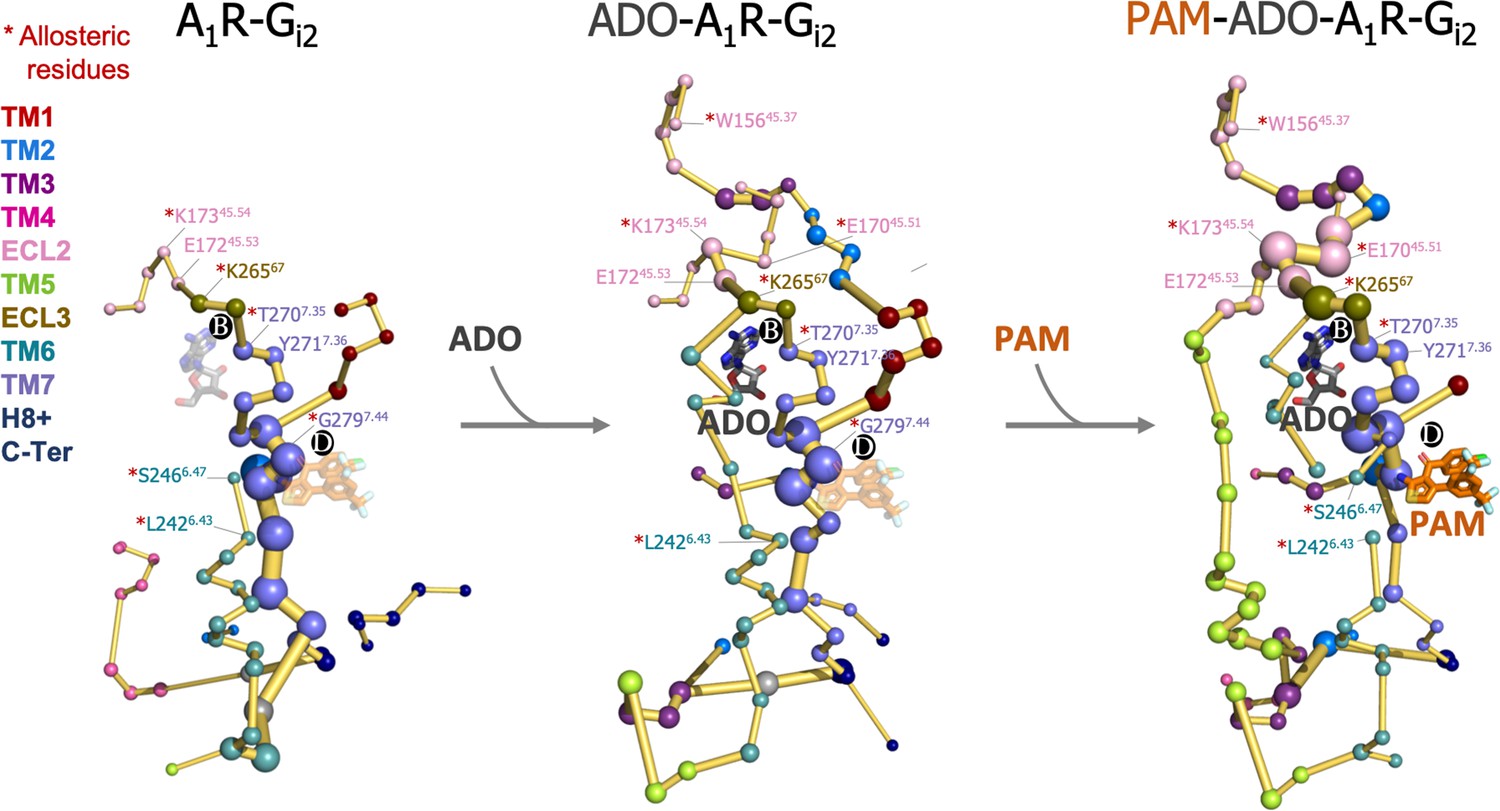
Effect of adenosine (ADO) and MIPS51 positive allosteric modulator (PAM) binding on the protein energy networks (PEN) of A1R-Gi2.
ADO in pocket B and MIPS521 PAM in pocket D, both aligned from PDB 7LD3, are depicted in gray and orange sticks, respectively. Note that ADO and PAM sticks are displayed with transparency in the systems in which they are absent. The PEN residues (nodes) are represented by colored spheres as a function of the receptor region (e.g. TM6 nodes in teal) while the allosteric pathways (edges) as yellow-orange sticks. The size of each edge and node corresponds to their importance for allosteric communication. The experimentally identified allosteric residues captured in the PEN nodes are labeled with a red asterisk.
Figure 8—figure supplement 1
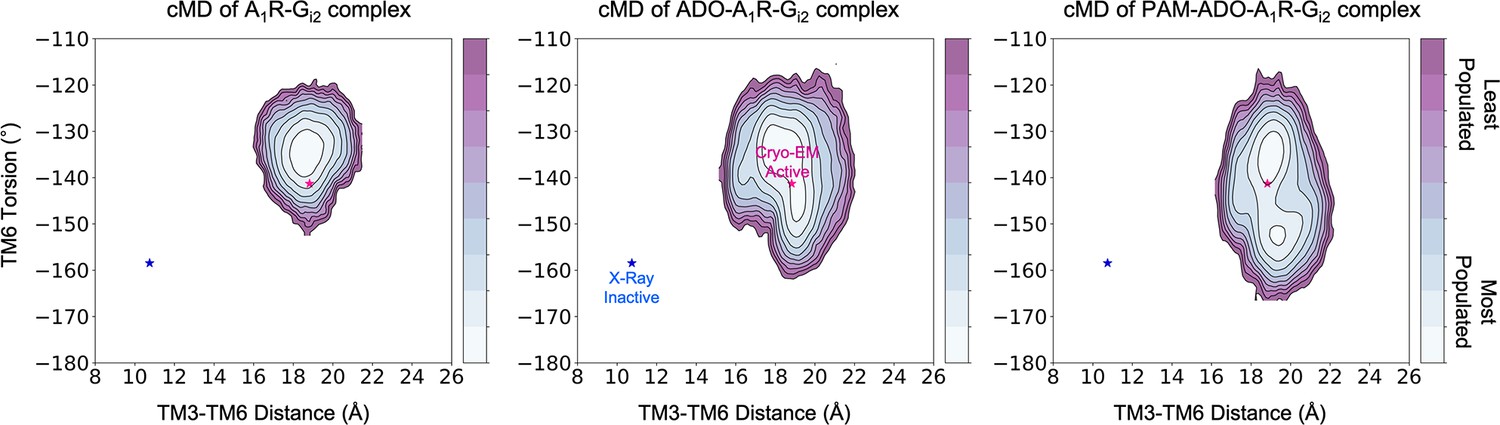
Effect of ADO and MIPS51 PAM on the conformational landscape of A1R in the presence of G-protein.
Population analysis of A1R activation in the A1R-Gi2 (left), ADO-A1R-Gi2 (middle), and PAM- ADO-A1R-Gi2 (right) complexes obtained from conventional molecular dynamics (cMD) simulations. The TM6 torsion corresponds to the dihedral angle formed by the alpha carbon atoms of L2366.37, W2476.48, T2777.42, and T2707.35. For the TM3-TM6 intracellular ends distance, we computed the center of mass (COM) distance between the backbone atoms of TM3 (Y2266.27, G2276.28, K2286.29, L2306.30, and E2306.31) and TM6(R1053.50, Y1063.51, L1073.52, R1083.53, and V1093.54). The inactive and active X-ray and Cryo-EM coordinates are projected as blue and magenta stars, respectively. ADO and PAM induce additional flexibility to the TM6 torsion, which makes the Cryo-EM active coordinates more accessible.
Additional files
-
Supplementary file 1
Transient pockets location and containing PEN residues in all conformational states.
- https://cdn.elifesciences.org/articles/90773/elife-90773-supp1-v2.xlsx
-
MDAR checklist
- https://cdn.elifesciences.org/articles/90773/elife-90773-mdarchecklist1-v2.docx
Download links
A two-part list of links to download the article, or parts of the article, in various formats.
Downloads (link to download the article as PDF)
Open citations (links to open the citations from this article in various online reference manager services)
Cite this article (links to download the citations from this article in formats compatible with various reference manager tools)
Dynamic allosteric networks drive adenosine A1 receptor activation and G-protein coupling
eLife 12:RP90773.
https://doi.org/10.7554/eLife.90773.2


