RIM-BP2 regulates Ca2+ channel abundance and neurotransmitter release at hippocampal mossy fiber terminals
- Graduate School of Brain Science, Doshisha University, Japan
- Department of Pharmacology, Graduate School of Medicine, The University of Tokyo, Japan
- International Research Center for Neurointelligence (WPI-IRCN), The University of Tokyo, Japan
Figures
Figure 1 with 1 supplement
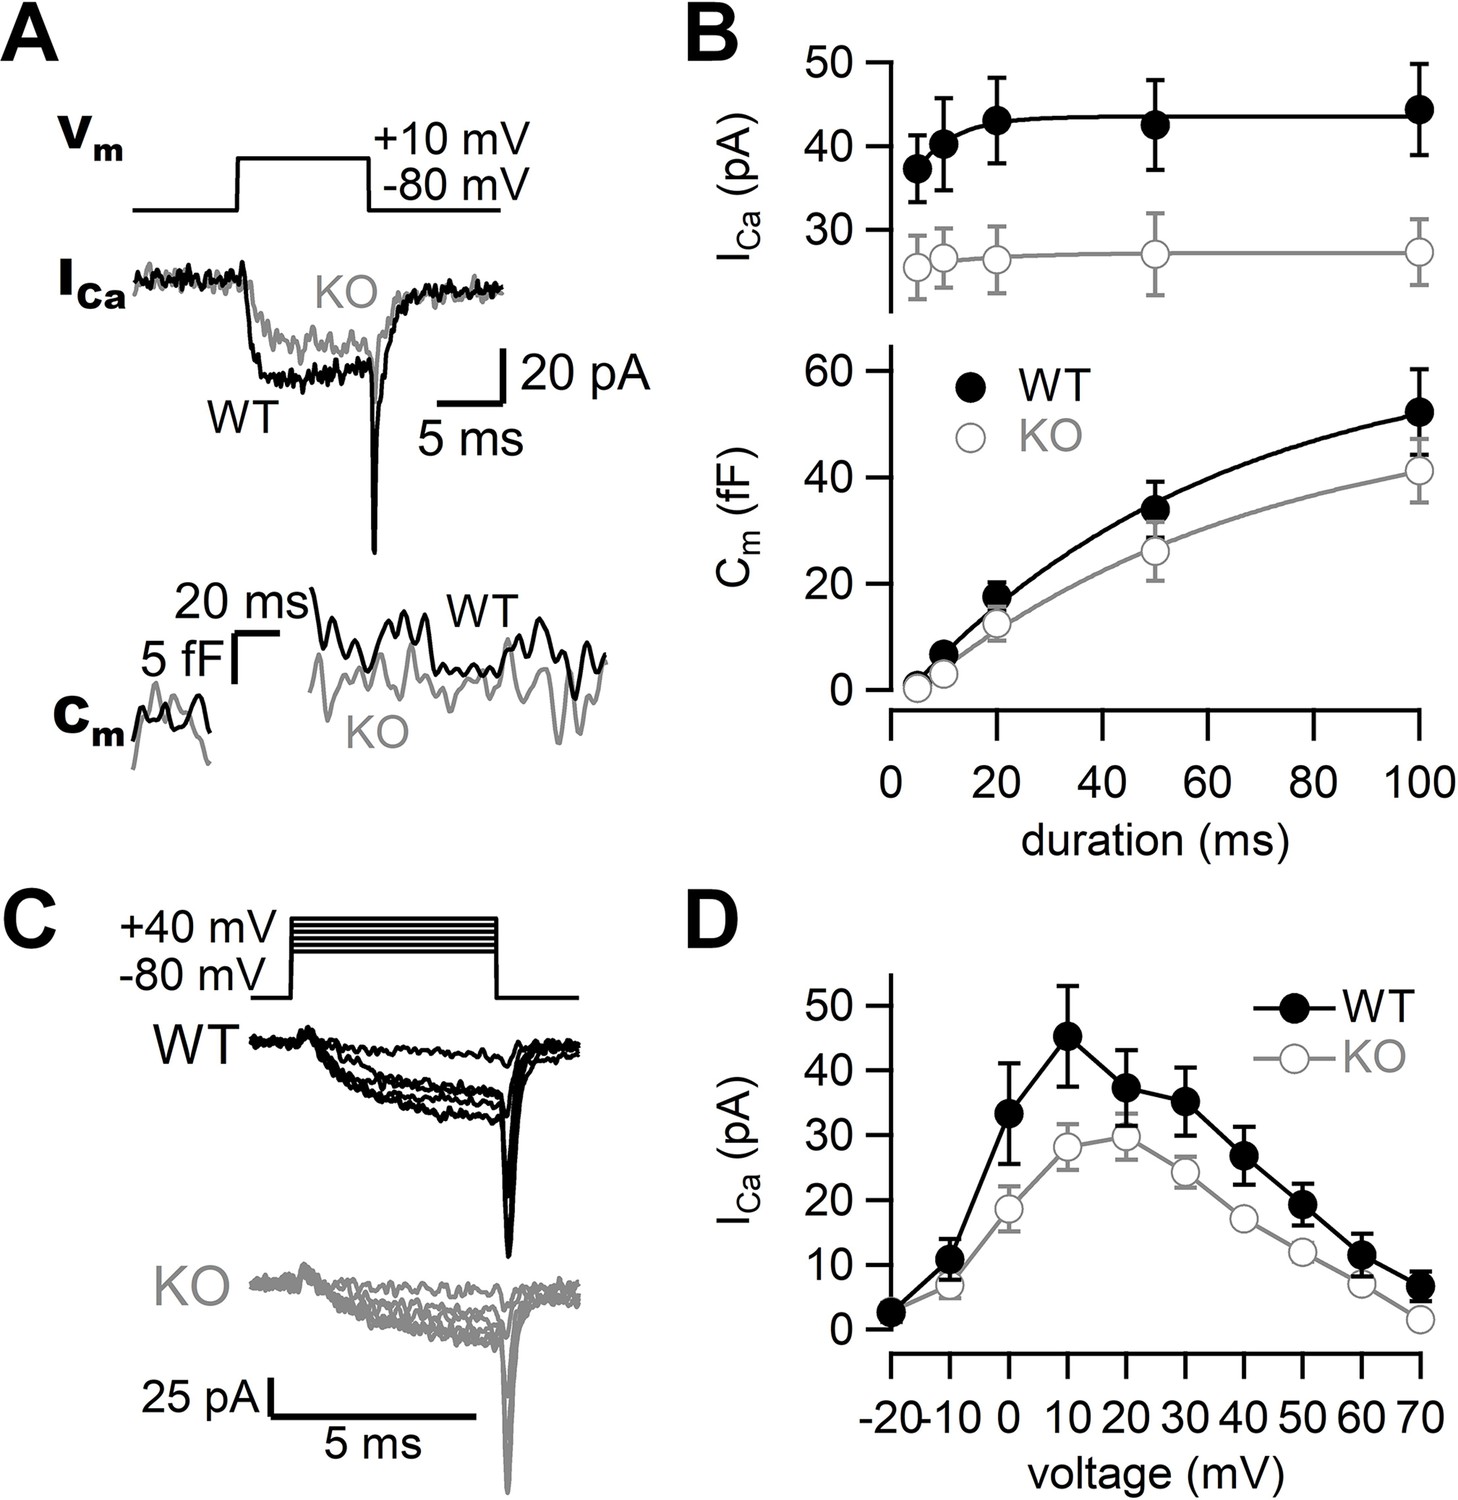
Presynaptic calcium currents and synaptic vesicle release in RIM-BP2 KO mice.
(A) The terminal was depolarized from –80 mV to +10 mV in WT (black) and RIM-BP2 KO (gray) hippocampal mossy fiber boutons. Ca2+ currents (ICa) and membrane capacitance (Cm) in response to a 10 ms pulse (Vm) are shown. (B) Top: the peak Ca2+ currents are plotted against the pulse duration. WT vs KO, p=0.034 (ANOVA). Bottom: the capacitance jumps are plotted against the pulse duration. WT vs KO, p=0.23 (ANOVA). Black filled circles and gray open circles represent the data from WT (n = 9 from eight animals) and RIM-BP2 KO (n = 8 from six animals), respectively. Each data point represents mean ± SEM. (C) Experimental protocol and representative traces for presynaptic Ca2+ current measurements in WT (black) and RIM-BP2 KO (gray) boutons. Terminals were sequentially depolarized for 5 ms with 2 s intervals from –80 mV to +70 mV by 10 mV steps. (D) Current–voltage relationships of peak Ca2+ currents in WT (black filled circle; n = 4–6 from four animals) and RIM-BP2 KO (gray open circle; n = 4–5 from five animals). ICas were elicited by 5 ms depolarizations. Two curves were significantly different (p<0.01 from mixed model). Each data point represents mean ± SEM. Numerical values of plots are provided in Figure 1—source data 1.
-
Figure 1—source data 1
Datasets of Ca2+ current and capacitance amplitudes presented in Figure 1 and Figure 1—figure supplement 1.
- https://cdn.elifesciences.org/articles/90799/elife-90799-fig1-data1-v1.xlsx
Figure 1—figure supplement 1
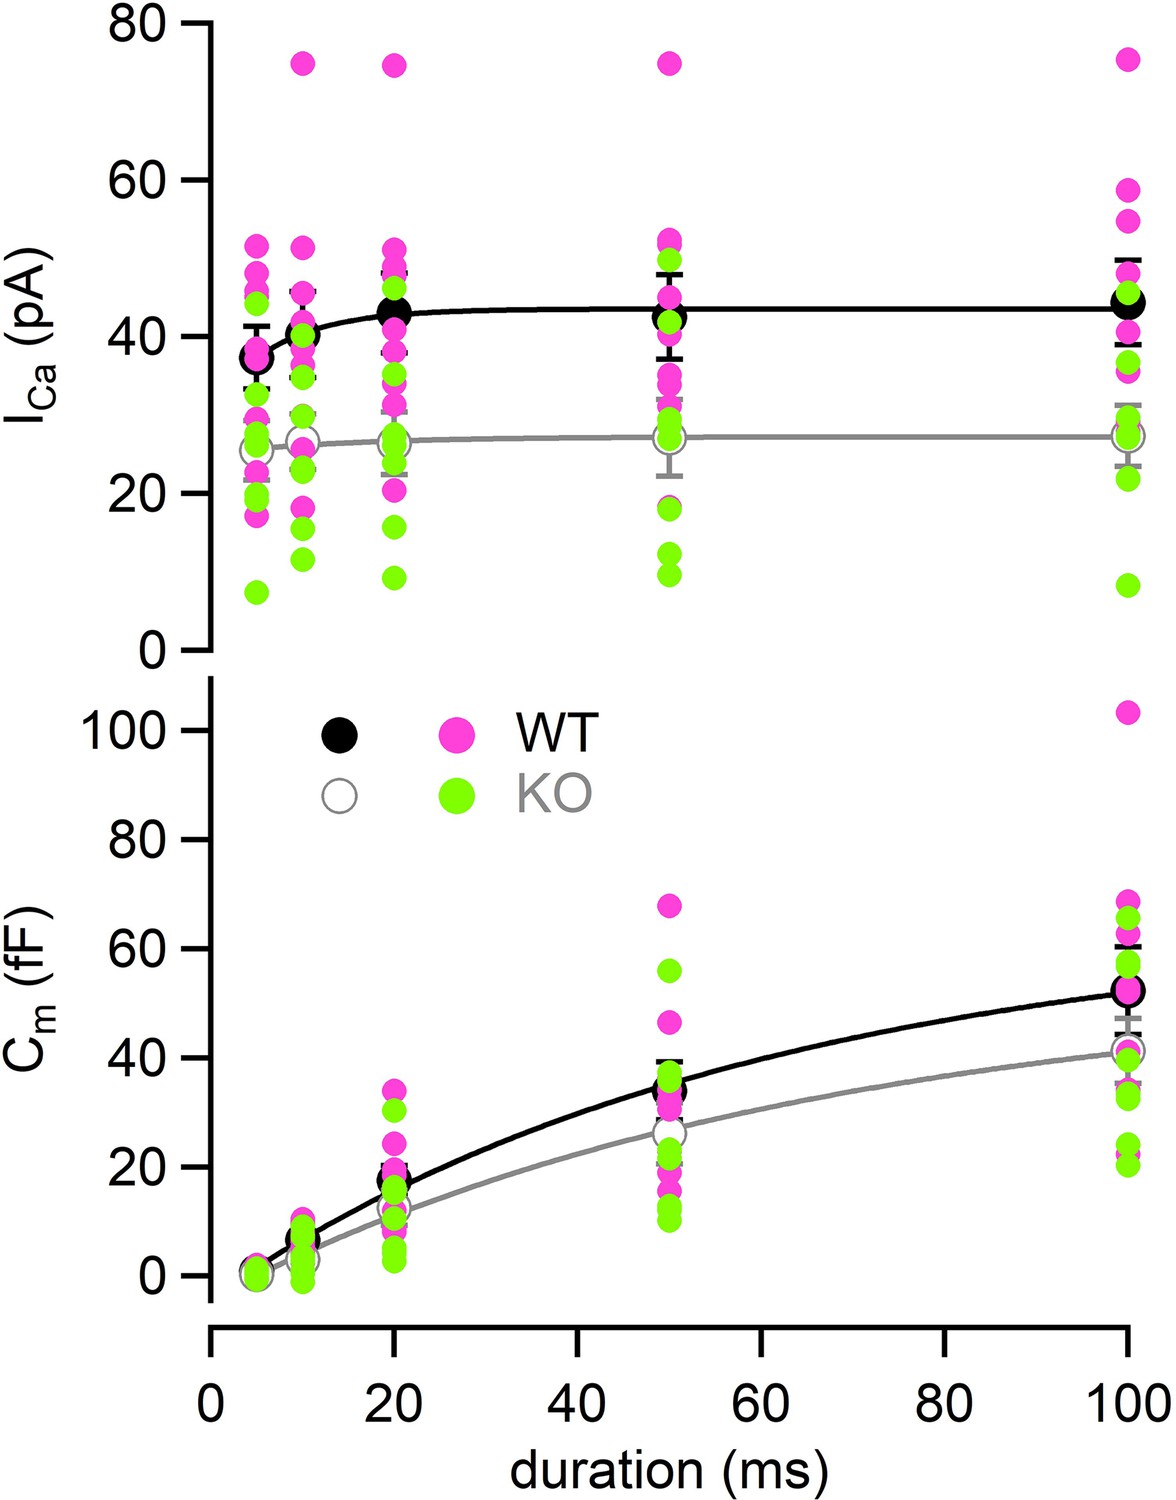
Individual value plot of Figure 1B.
Individual values of ICas (top) and Cms (bottom) in WT (pink) and RIM-BP2 KO (green) terminals are plotted against the pulse duration. Numerical values of plots are provided in Figure 1—source data 1.
Figure 2 with 1 supplement
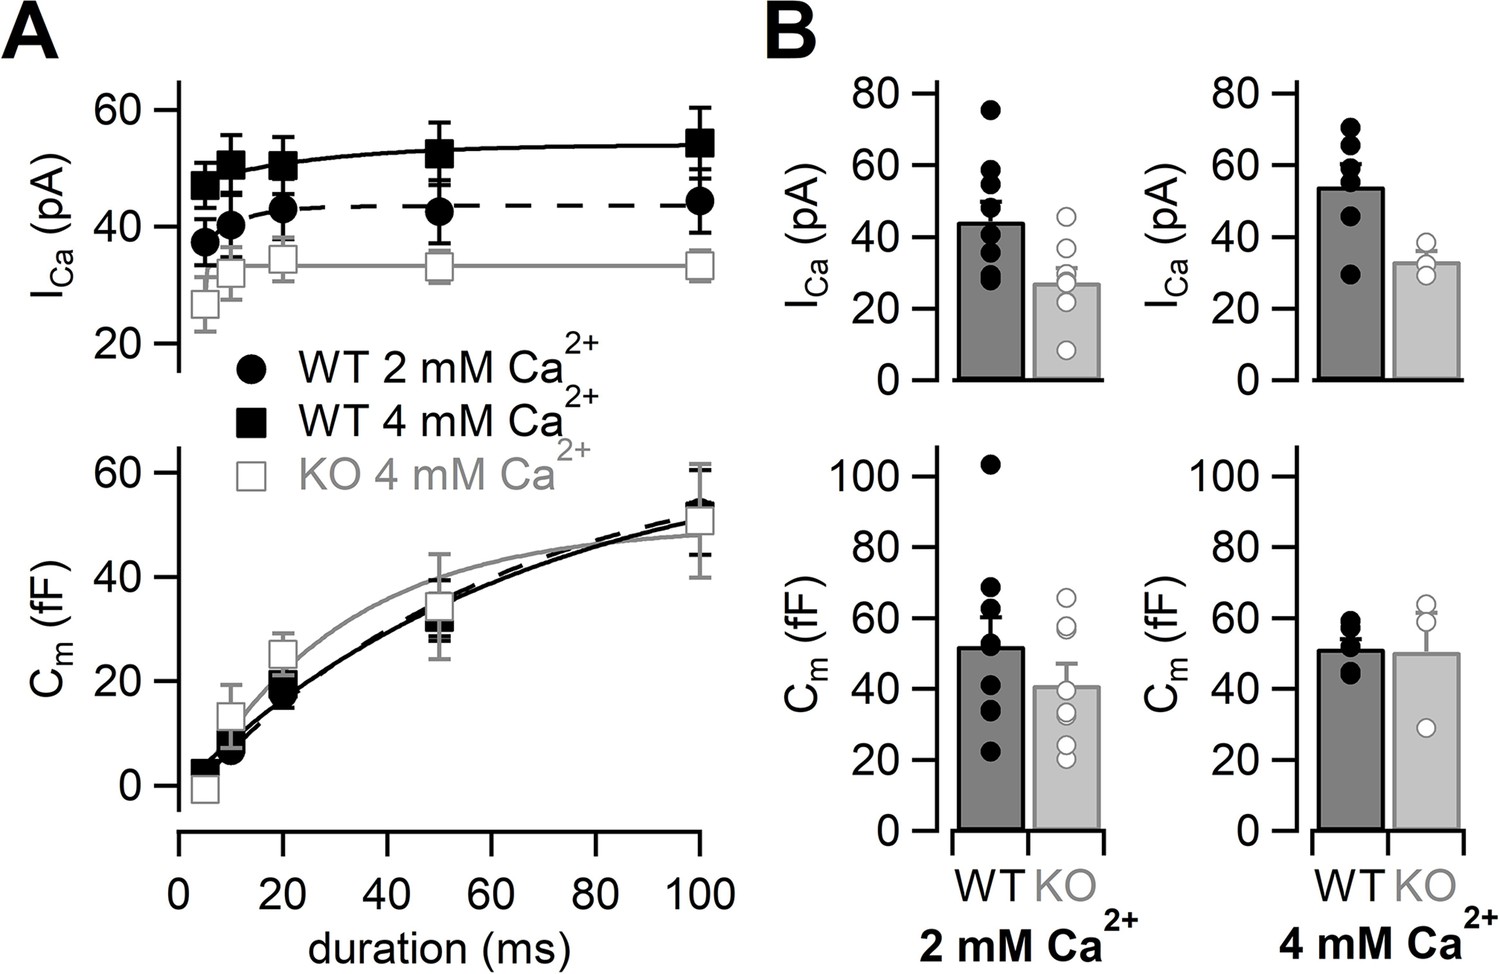
The effects of high extracellular calcium concentration on Ca2+ currents and capacitance changes.
(A) The ICas (top) and the Cms (bottom) are plotted against the pulse duration. Black filled squares and gray open squares represent the data from WT (n = 6–8 from six animals) and RIM-BP2 KO (n = 3–4 from two animals) at 4 mM [Ca2+]ext, respectively. For comparison, the WT data in 2 mM [Ca2+]ext are superimposed (black filled circle; n = 9) (the same datasets as Figure 1B). Each data point represents mean ± SEM. ICas were significantly different between WT and KO in 4 mM [Ca2+]ext (p<0.01 from mixed model). The WT ICas in 2 mM [Ca2+]ext and the KO ICas in 4 mM [Ca2+]ext were significantly different (p<0.02 from mixed model), but Cm were not significantly different (p=0.57 from mixed model). (B) Average ICas (top) and Cms (bottom) in response to a 100 ms pulse in WT (black bars) and RIM-BP2 KO (gray bars) terminals. Extracellular Ca2+ concentration was 2 mM (left) or 4 mM (right). Error bars show SEM. Circles indicate individual values. Numerical values of plots are provided in Figure 2—source data 1.
-
Figure 2—source data 1
Datasets of Ca2+ current and capacitance amplitudes presented in Figure 2 and Figure 2—figure supplement 1.
- https://cdn.elifesciences.org/articles/90799/elife-90799-fig2-data1-v1.xlsx
Figure 2—figure supplement 1

Individual value plot of Figure 2A.
Individual values of ICas (top) and Cms (bottom) recorded at 4 mM [Ca2+]ext in WT (pink) and RIM-BP2 KO (green) terminals are plotted against the pulse duration. Numerical values of plots are provided in Figure 2—source data 1.
Figure 3 with 2 supplements
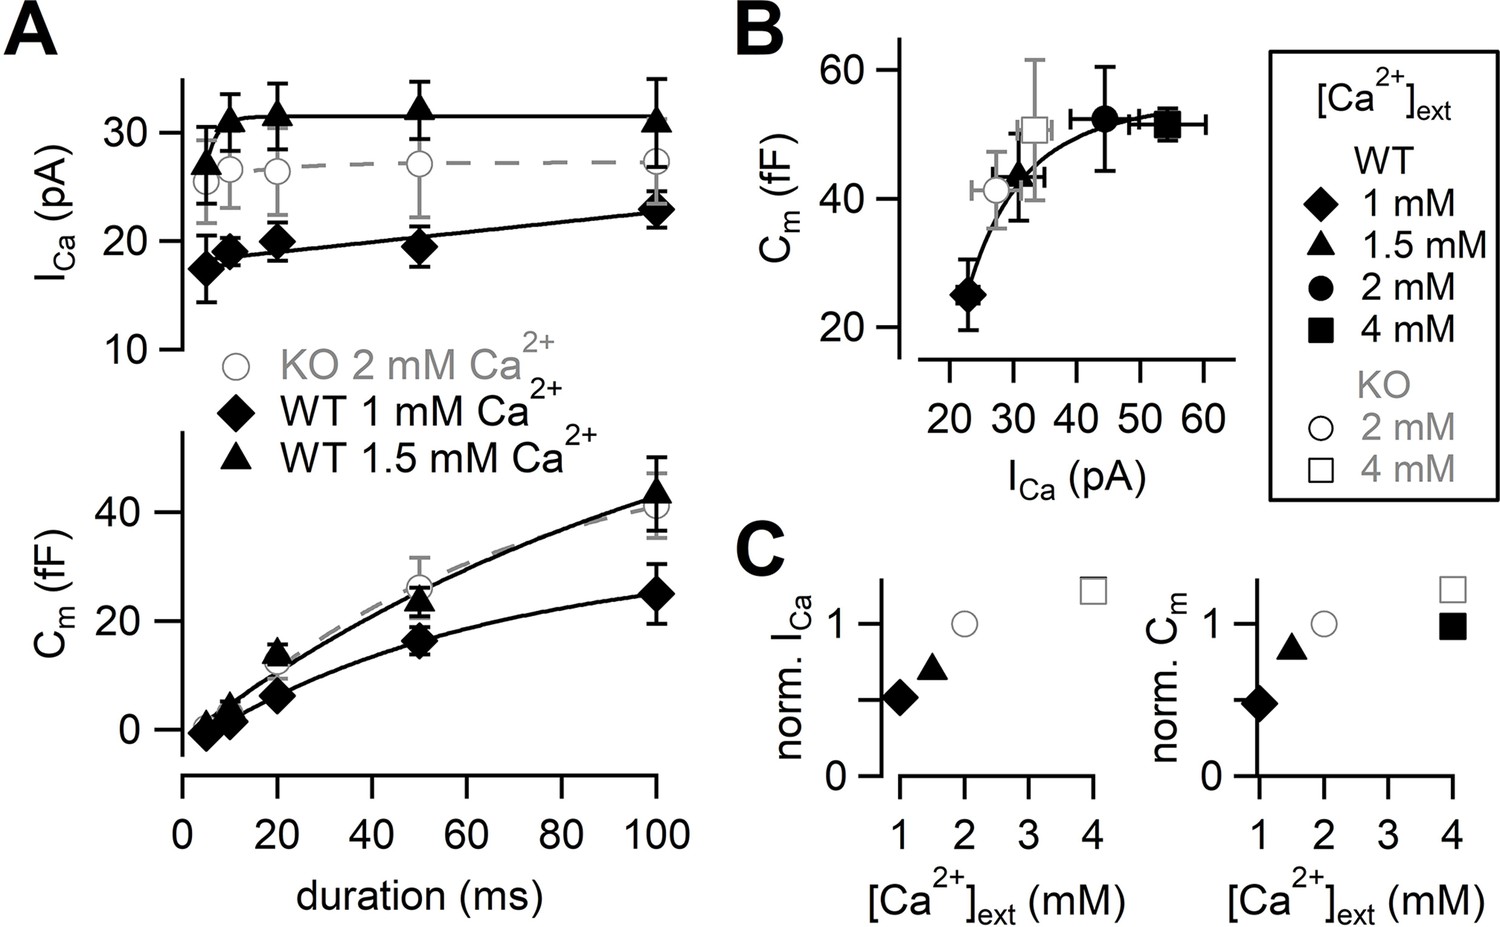
Calcium dependence of the release kinetics and the RRP size.
(A) Top: the relationship between peak Ca2+ currents and pulse durations at different [Ca2+]exts. Bottom: the relationship between capacitance jumps and pulse durations at different [Ca2+]exts. Gray open circles, black diamonds, and black triangles represent the data from RIM-BP2 KO at 2 mM [Ca2+]ext (n = 8) (the same datasets as Figure 1B), WT at 1 mM [Ca2+]ext (n = 3–5 from four animals) and WT at 1.5 mM [Ca2+]ext (n = 5–7 from six animals), respectively. Each data point represents mean ± SEM. (B) Capacitance jumps at various [Ca2+]exts are plotted against calcium current amplitudes. Pulses were 100 ms depolarization from –80 mV to +10 mV. Each data point represents mean ± SEM. Data points were fitted with a Hill equation with n = 3. (C) Left: average ICas at indicated [Ca2+]exts were normalized to the response at 2 mM [Ca2+]ext in each genotype. Right: average Cms at indicated [Ca2+]exts were normalized to the 2 mM [Ca2+]ext response in each genotype. Numerical values of plots are provided in Figure 3—source data 1.
-
Figure 3—source data 1
Datasets of numerical values presented in Figure 3 and Figure 3—figure supplement 1.
- https://cdn.elifesciences.org/articles/90799/elife-90799-fig3-data1-v1.xlsx
Figure 3—figure supplement 1

Individual value plot of Figure 3A.
Individual values of ICas (top) and Cms (bottom) recorded at 1 mM (green) or 1.5 mM (pink) [Ca2+]ext in WT are plotted against the pulse duration. Numerical values of plots are provided in Figure 3—source data 1.
Figure 3—figure supplement 2
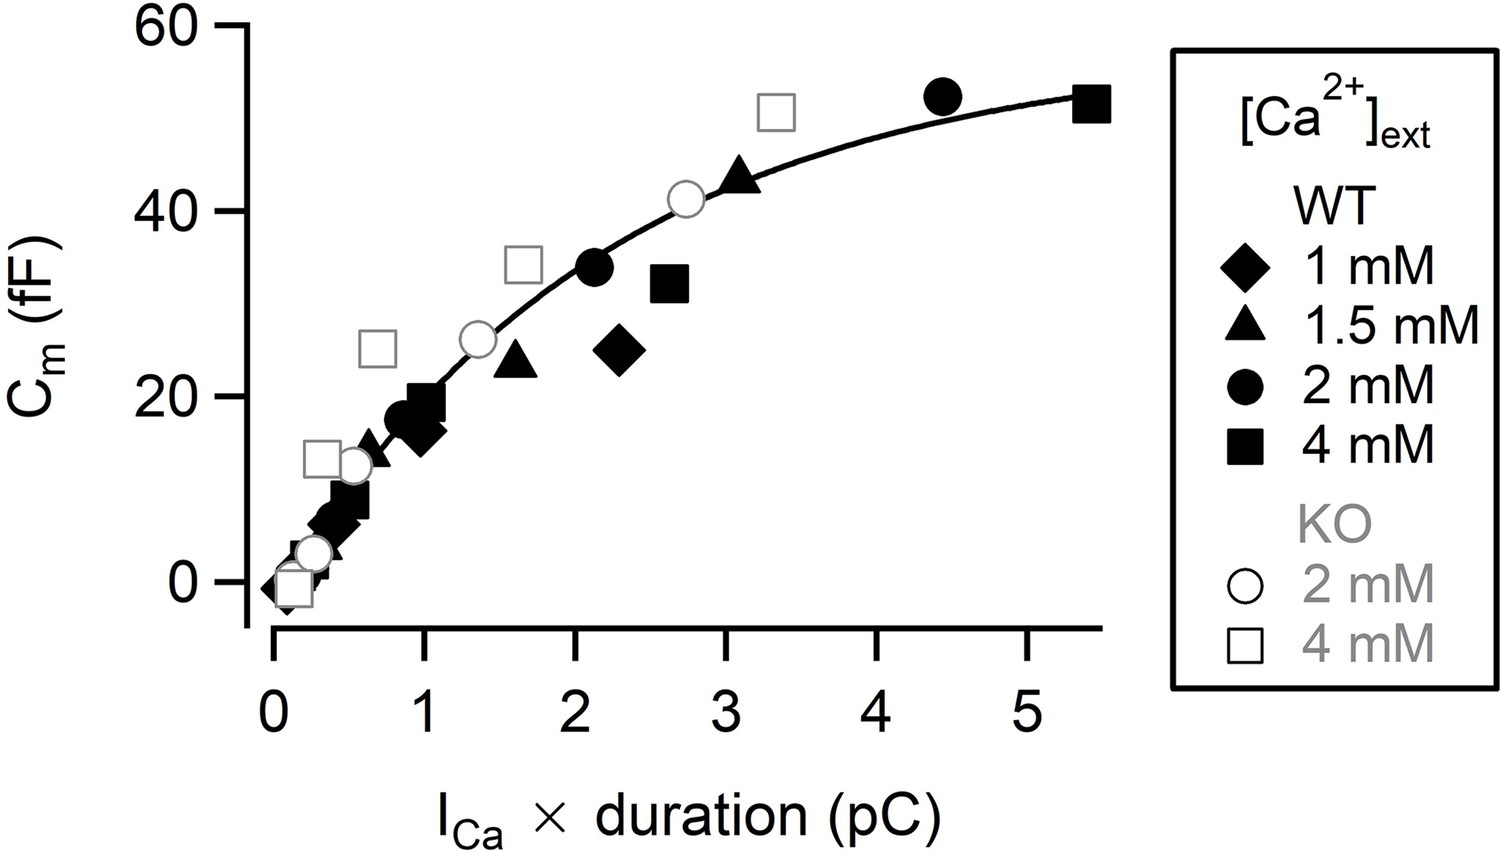
The relationship between synaptic vesicle release and total Ca2+ charge.
Capacitance jumps elicited by various pulse durations are plotted against total Ca2+ charge. The total Ca2+ charge was calculated by multiplying a peak Ca2+ current amplitude by pulse duration. Each symbol represents a data point obtained from WT (black filled symbols) and RIM-BP2 KO (gray open symbols) mice at various [Ca2+]ext. Data points were fitted by a single exponential function. Numerical values of plots are provided in Figure 3—figure supplement 2—source data 1.
-
Figure 3—figure supplement 2—source data 1
Datasets of Ca2+ charge and ΔCm presented in Figure 3—figure supplement 2.
- https://cdn.elifesciences.org/articles/90799/elife-90799-fig3-figsupp2-data1-v1.xlsx
Figure 4 with 1 supplement
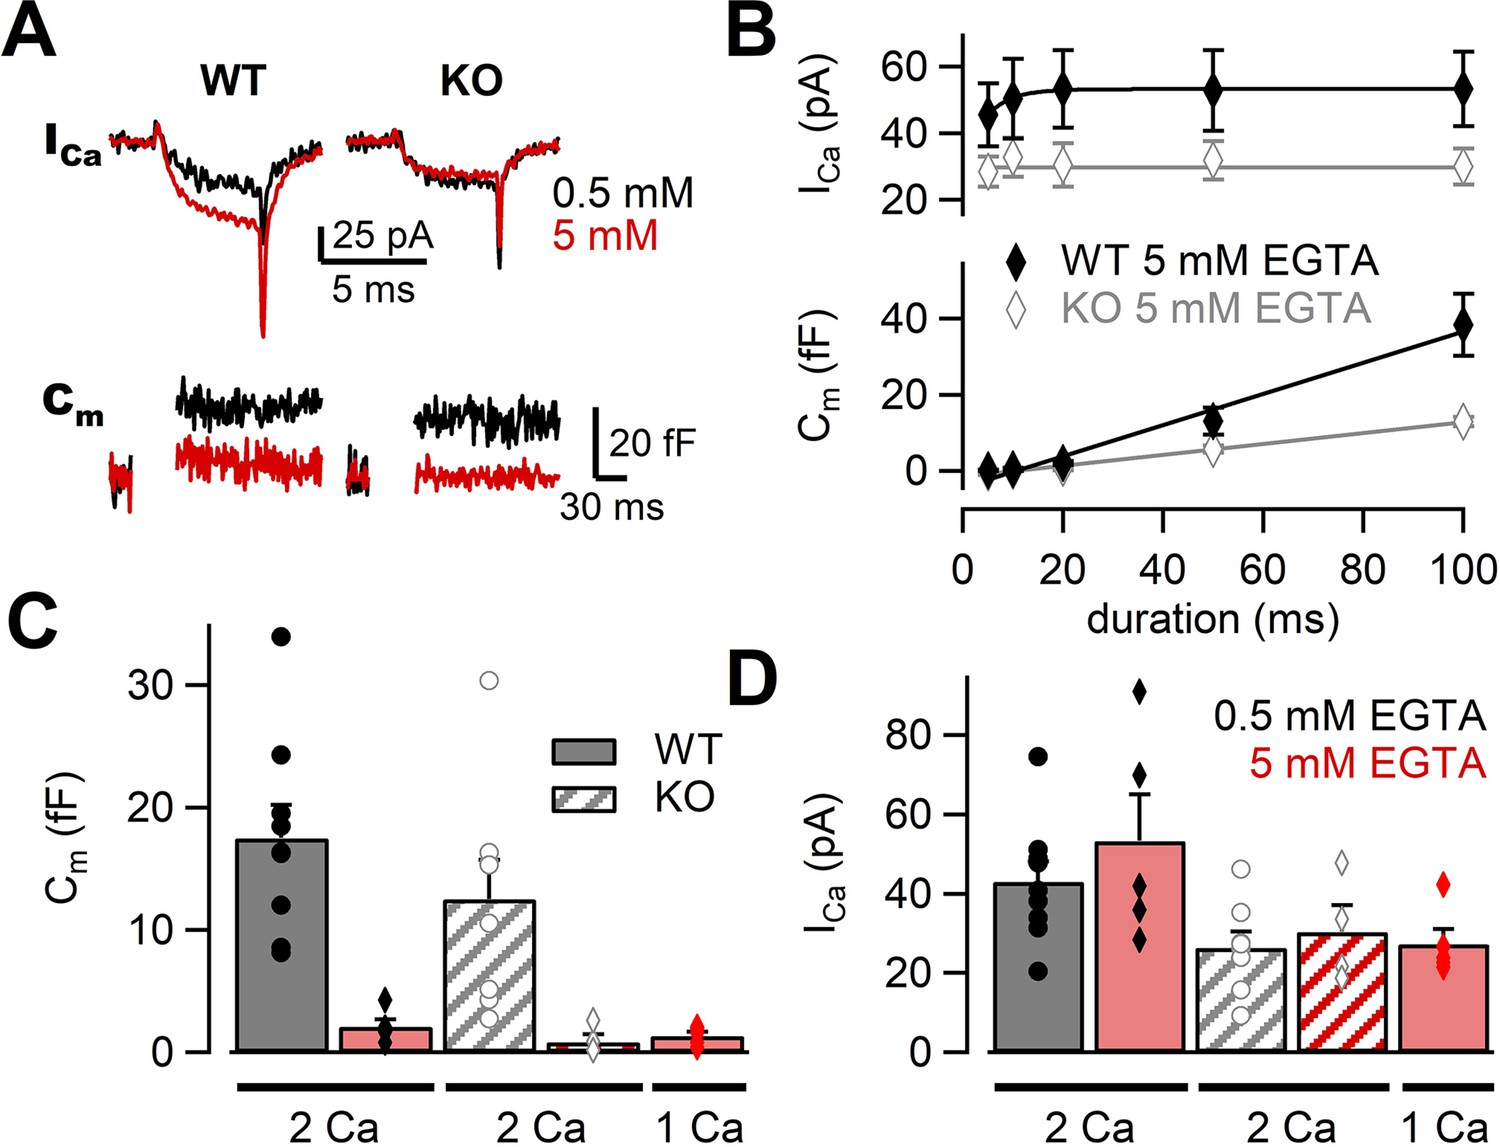
The effects of high EGTA on calcium currents and synaptic vesicle exocytosis.
(A) Example traces in response to a 5 ms depolarizing pulse to +10 mV in WT (left) and RIM-BP2 KO (right) boutons. Ca2+ current (ICa) and membrane capacitance (Cm) recorded with 0.5 mM EGTA (black) or 5 mM EGTA (red) in the patch pipette are shown. Note that each trace was obtained from different terminals but the traces were superimposed. (B) The ICas (top) and Cms (bottom) are plotted against the pulse duration. The patch pipette contained 5 mM EGTA. Black filled diamonds and gray open diamonds represent the data from WT (n = 4–5 from four animals) and RIM-BP2 KO (n = 4 from three animals), respectively. Each data point indicates mean ± SEM. (C, D) Average Cms (C) and ICas (D) elicited by a 20 ms pulse in WT (filled bars) and RIM-BP2 KO (hatched bars). The extracellular Ca2+ concentration was 1 mM (from five animals) or 2 mM. The intracellular solution contained either 0.5 mM EGTA (black) or 5 mM EGTA (red). Error bars show SEM. Circles and diamonds indicate individual values. Numerical values of plots are provided in Figure 4—source data 1.
-
Figure 4—source data 1
Datasets of Ca2+ current and capacitance amplitudes presented in Figure 4 and Figure 4—figure supplement 1.
- https://cdn.elifesciences.org/articles/90799/elife-90799-fig4-data1-v1.xlsx
Figure 4—figure supplement 1
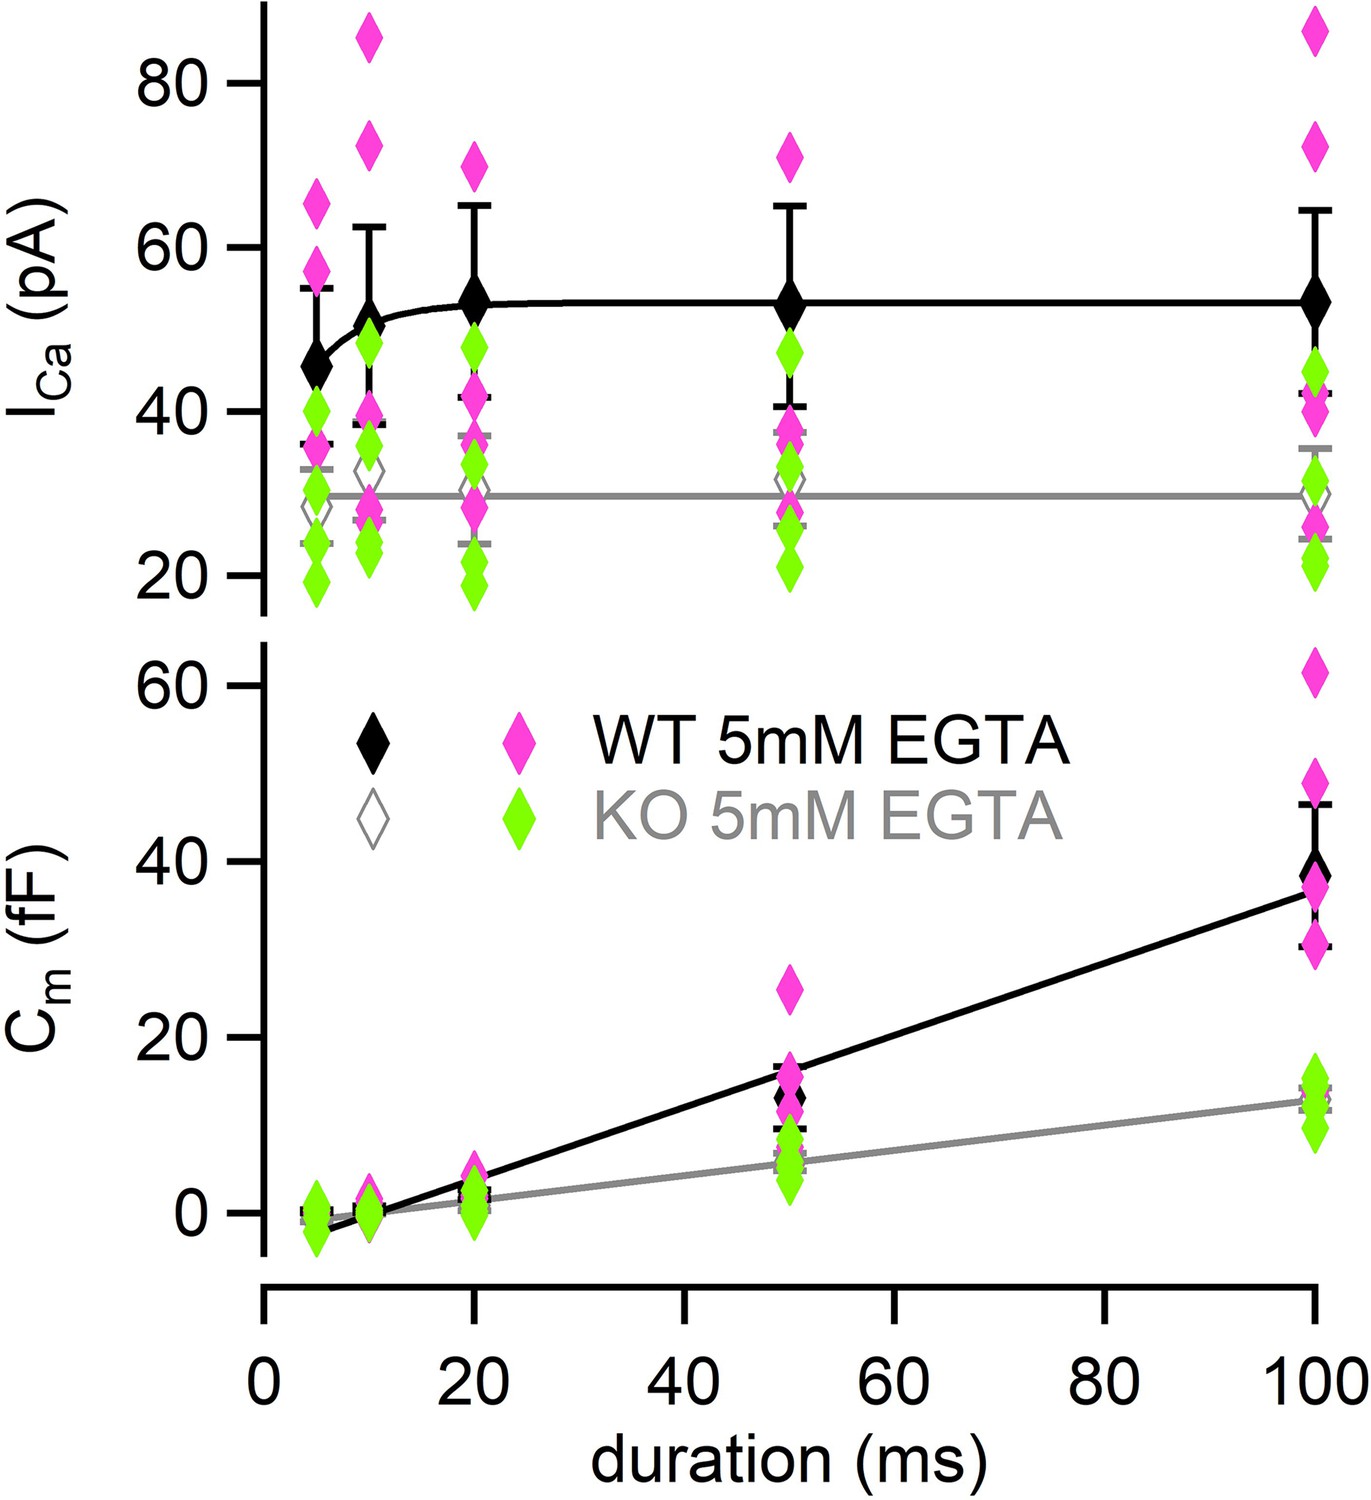
Individual value plot of Figure 4B.
Individual values of ICas (top) and Cms (bottom) recorded in the presence of 5 mM EGTA in WT (pink) and KO (green) were plotted against the pulse duration. Numerical values of plots are provided in Figure 4—source data 1.
Figure 5
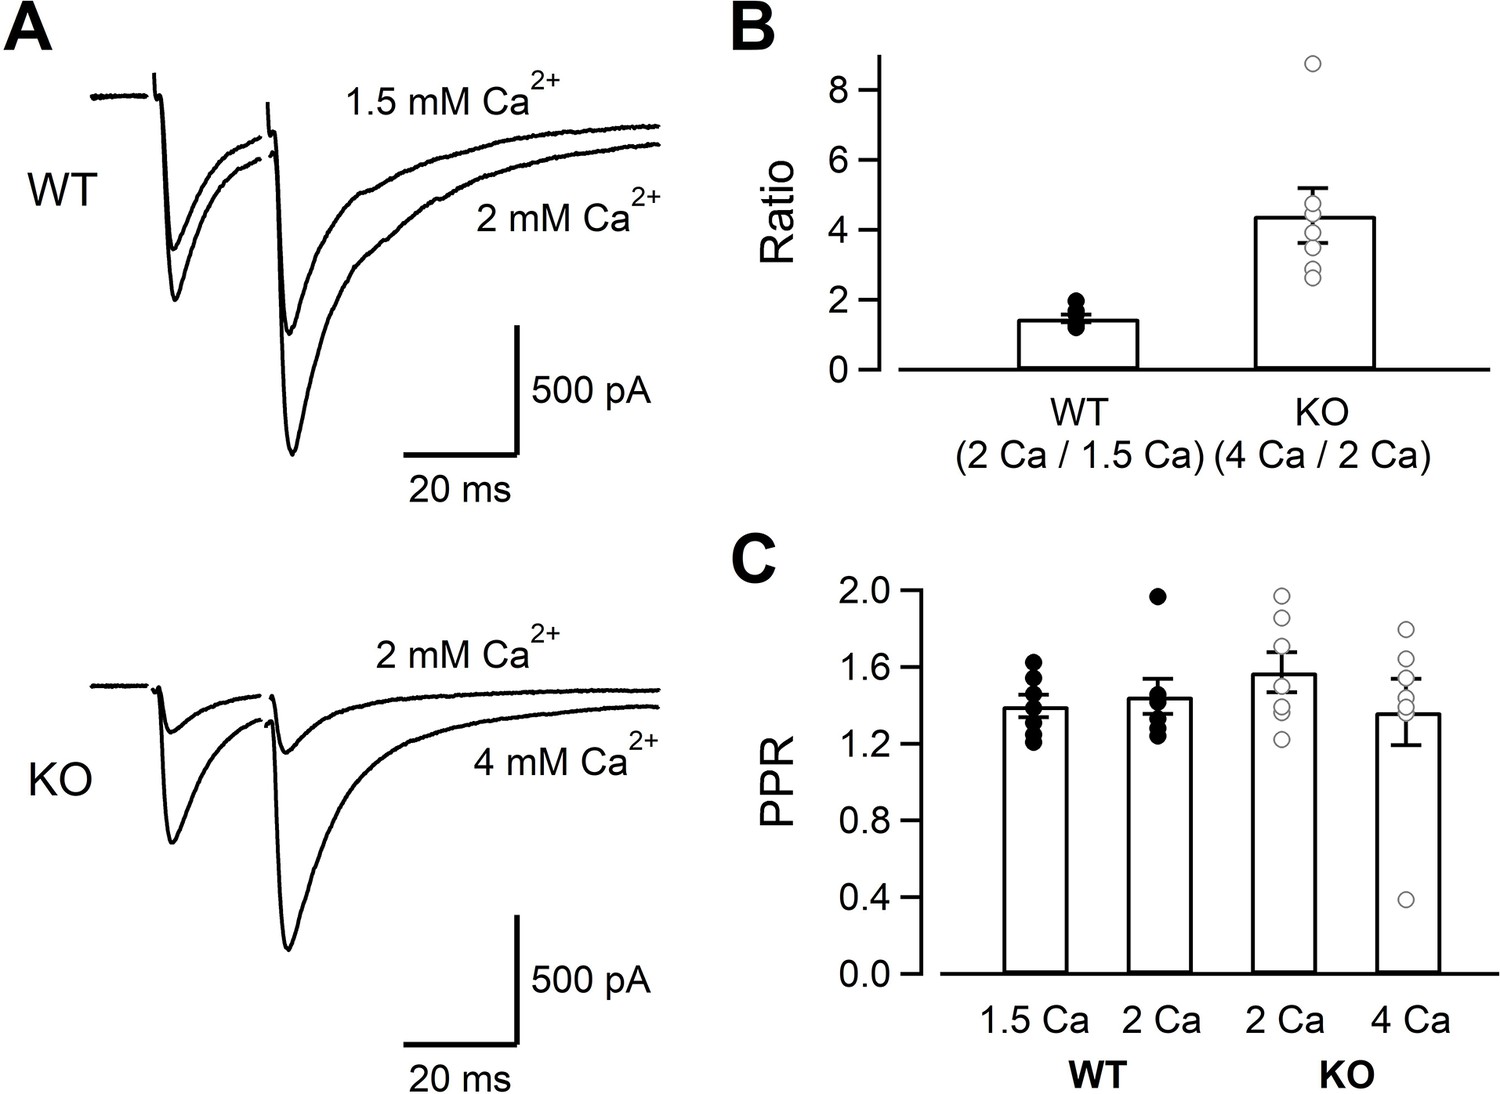
The evoked EPSC amplitudes in WT and KO, and their sensitivity to the extracellular Ca2+.
(A) The mossy fiber-evoked EPSCs measured at CA3 pyramidal cells. The fibers were stimulated twice with an interval of 20 ms. The responses of WT in 1.5 mM and 2 mM [Ca2+]ext (n = 7 cells from five animals), as well as those of KO in 2 mM and 4 mM [Ca2+]ext (n = 7 cells from six animals) are shown. The stimulus artifacts were blanked. (B) The amplitude ratios of WT EPSCs (2 mM/1.5 mM [Ca2+]ext) and KO EPSCs (4 mM/2 mM [Ca2+]ext) are shown. The concentrations were chosen to set the Ca2+ influx similar between WT and KO from Figures 1—3. (C) The paired pulse ratios under four conditions (WT in 1.5 mM and 2 mM [Ca2+]ext, KO in 2 mM and 4 mM [Ca2+]ext). Numerical values of plots are provided in Figure 5—source data 1.
-
Figure 5—source data 1
Datasets of numerical values presented in Figure 5.
- https://cdn.elifesciences.org/articles/90799/elife-90799-fig5-data1-v1.xlsx
Figure 6 with 2 supplements
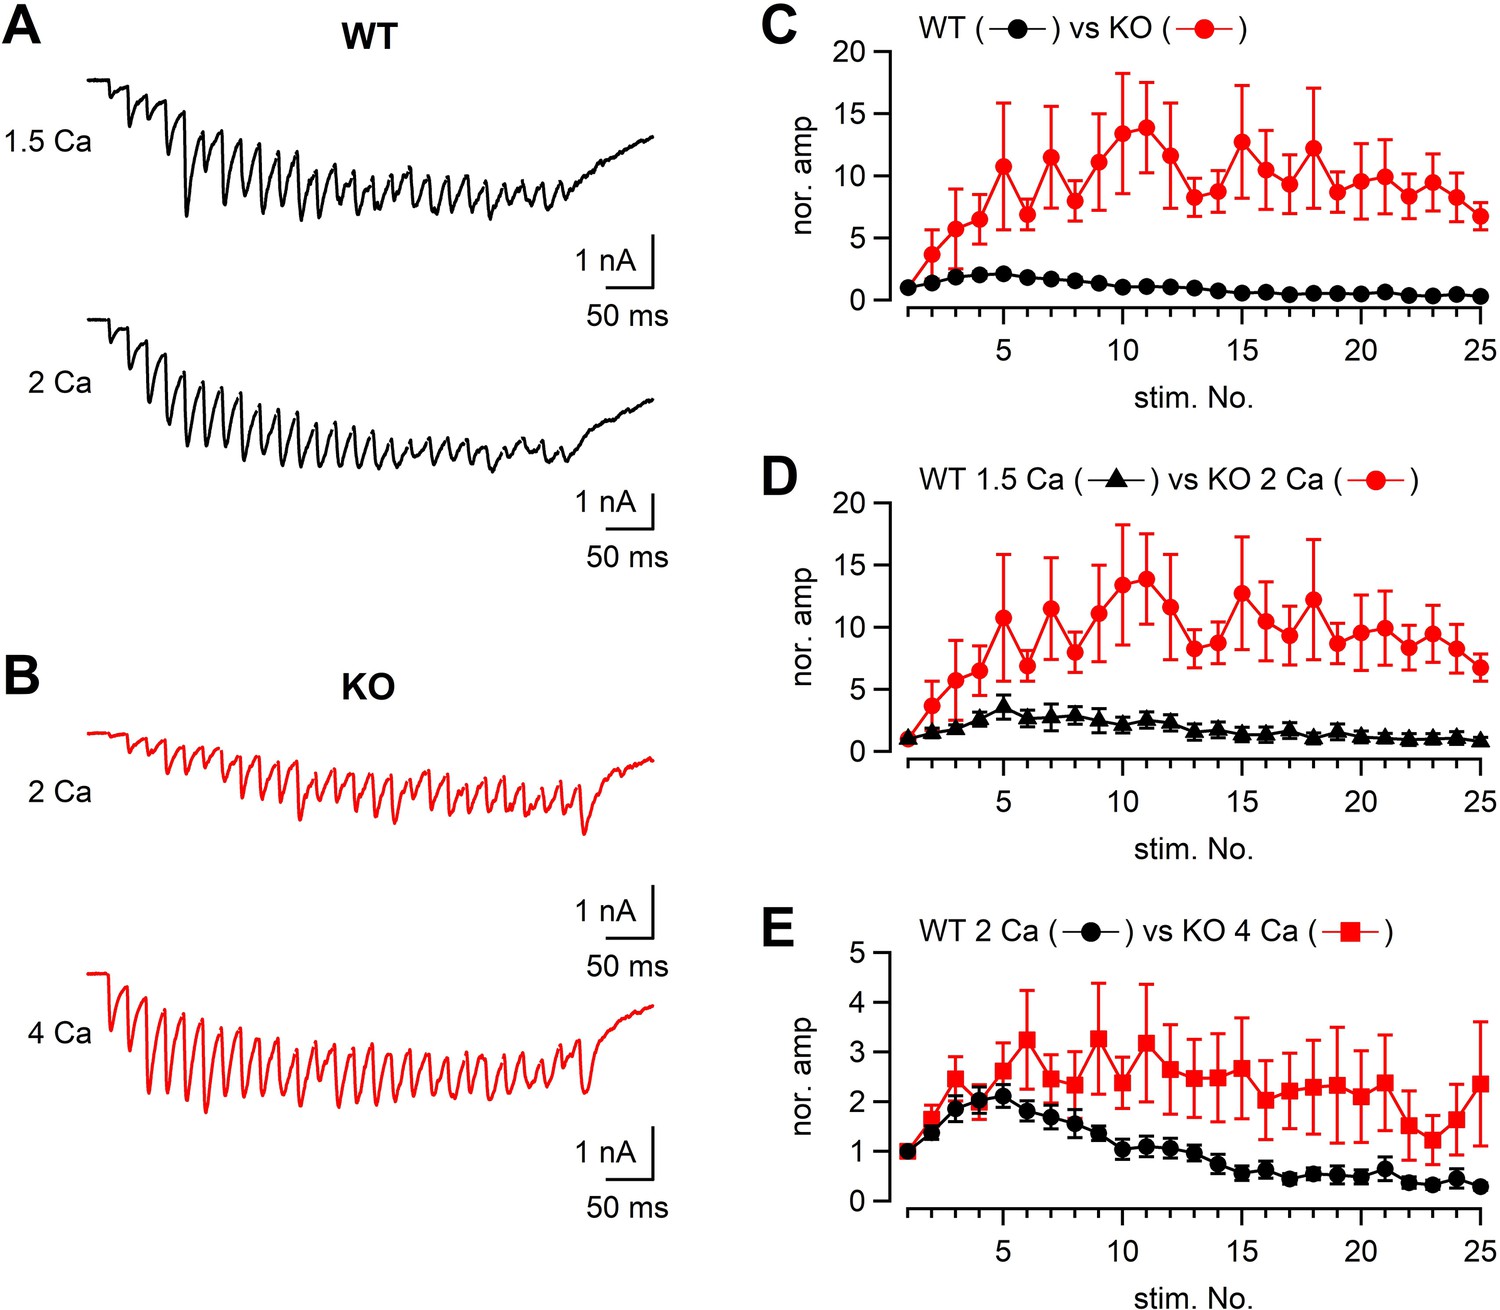
The time course of synaptic facilitation/depression in WT and KO.
(A) Mossy fibers were stimulated at 50 Hz (25 times) and the evoked EPSCs were measured in 1.5 mM (n = 5 cells from four animals) and 2 mM [Ca2+]ext (n = 7 cells from five animals) in WT. The stimulus artifacts were blanked. (B) Mossy fibers were stimulated at 50 Hz (26 times in this particular example), and the evoked EPSCs were measured in 2 mM (n = 7 cells from six animals) and 4 mM [Ca2+]ext (n = 8 cells from six animals). (C) The time course of EPSC amplitudes during a 50 Hz train. The data were obtained from WT and KO in 2 mM [Ca2+]ext. The time courses were significantly different (p<0.01 from ANOVA). (D) The same as (C), but the data were obtained from WT in 1.5 mM [Ca2+]ext and KO in 2 mM [Ca2+]ext. The time courses were significantly different (p<0.05 from ANOVA). (E) The same as (C), but the data were obtained from WT in 2 mM [Ca2+]ext and KO in 4 mM [Ca2+]ext. Numerical values of plots are provided in Figure 6—source data 1. The time courses were not significantly different (p=0.12 from ANOVA). Numerical values of plots are provided in Figure 6—source data 1.
-
Figure 6—source data 1
Datasets of numerical values presented in Figure 6 and Figure 6—figure supplements 1 and 2.
- https://cdn.elifesciences.org/articles/90799/elife-90799-fig6-data1-v1.xlsx
Figure 6—figure supplement 1

The EPSC amplitudes plotted against the stimulus number.
The same datasets as Figure 6C–E, but the absolute EPSC amplitudes are plotted instead of the normalized amplitudes. Numerical values of plots are provided in Figure 6—source data 1. Raw data were summarized. In Figures 5 and 6, the effect of holding potential was corrected so that the values were adjusted to those at –70 mV. Numerical values of plots are provided in Figure 6—source data 1.
Figure 6—figure supplement 2

The individual data of Figure 6.
WT in 2 mM (A) and 1.5 mM (B) [Ca2+]ext, and KO in 2 mM (C) and 4 mM [Ca2+]ext (D) are shown. Numerical values of plots are provided in Figure 6—source data 1.
Figure 7 with 5 supplements
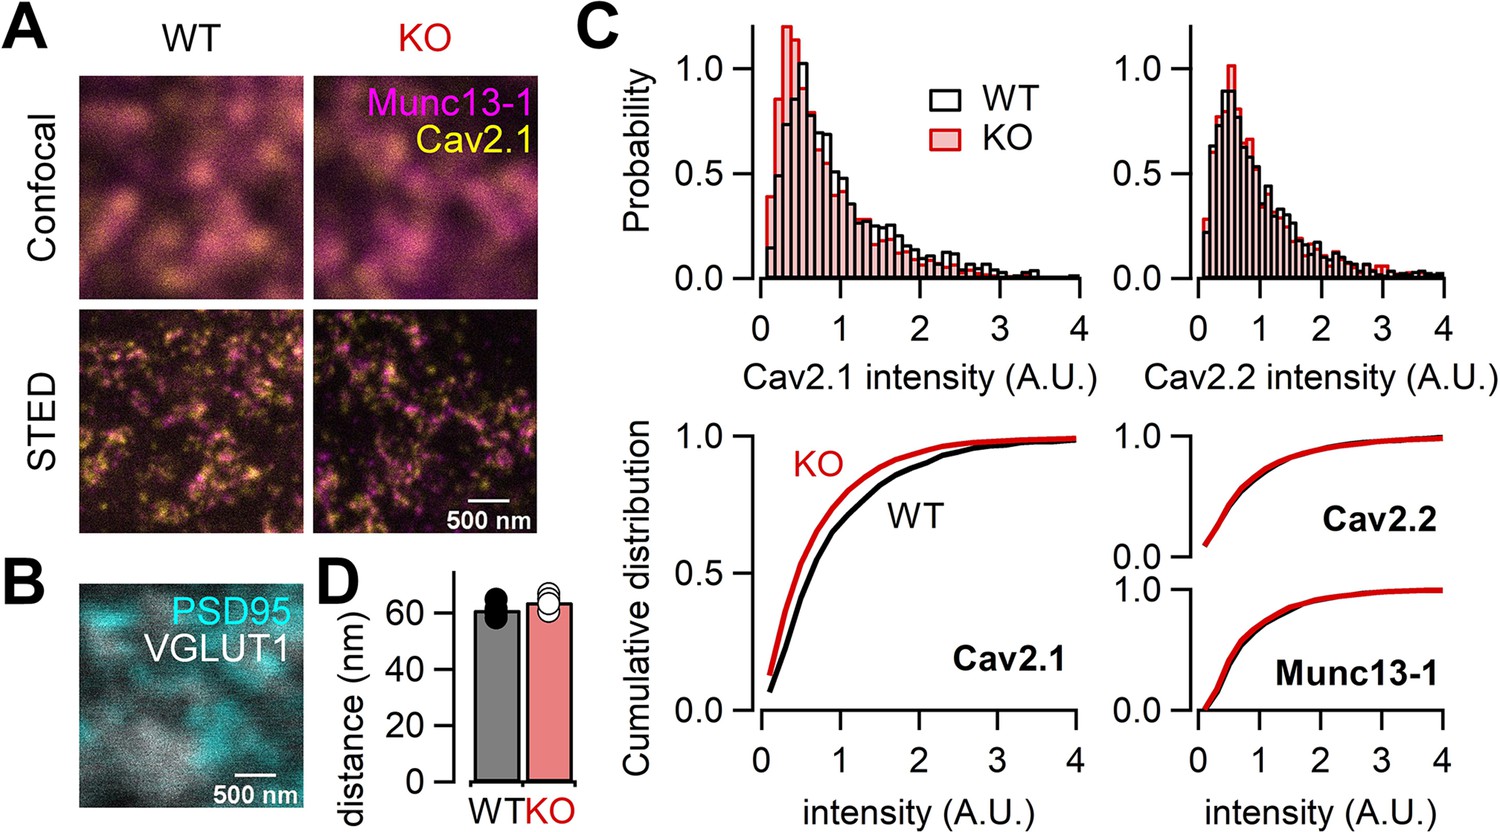
RIM-BP2 deletion alters the signal intensity of Cav2.1 clusters within the active zone (AZ).
(A) Confocal (top) and STED (bottom) images of Munc13-1 (magenta) and Cav2.1 (yellow) clusters at hippocampal mossy fiber terminals of WT (left) and RIM-BP2 KO (right) mice. Scale bar: 500 nm. (B) Confocal images of PSD95 (cyan) and VGLUT1 (white) to identify glutamatergic synapses in CA3 stratum lucidum: mossy fiber-CA3 synapses. Scale bar: 500 nm. The image was taken from same region shown in (A, left). (C) Histograms (top) and cumulative distribution plots (bottom) of the total signal intensity of Cav2.1 (left), Cav2.2, and Munc13-1 (right) at AZs in WT (black) and RIM-BP2 KO (red) mice. (D) The average nearest-neighbor distance between Cav2.1 and Munc13-1 clusters in WT (black; n = 4 animals) and RIM-BP2 KO (red; n = 4 animals) mice. Several hundreds of AZs per image were analyzed. Data show the average value of distance per animal, and error bars represent SEM. Each data point indicates individual values. Numerical values of plots are provided in Figure 7—source data 1.
-
Figure 7—source code 1
Custom-designed programs in Mathematica.
- https://cdn.elifesciences.org/articles/90799/elife-90799-fig7-code1-v1.zip
-
Figure 7—source data 1
Datasets of numerical values presented in Figure 7.
- https://cdn.elifesciences.org/articles/90799/elife-90799-fig7-data1-v1.xlsx
Figure 7—figure supplement 1

STED microscopy confirmed loss of RIM-BP2 proteins in KO terminals.
Confocal (top) and STED (middle) images of RIM-BP2 (yellow) in WT (left) and RIM-BP2 KO (right) hippocampal mossy fiber terminals identified by PSD95 (cyan) and VGLUT1 (white) (bottom). Scale bar: 500 nm. The bottom images show the same region as top and middle.
Figure 7—figure supplement 2

STED imaging of Cav2.2 at hippocampal mossy fiber terminals.
Confocal (top) and STED (middle) images of Munc13-1 (magenta) and Cav2.2 (yellow) clusters in WT (left) and RIM-BP2 KO (right) mice. Confocal images of PSD95 (cyan) and VGLUT1 (white) in the same region as top and middle are also shown (bottom). Scale bar: 500 nm.
Figure 7—figure supplement 3

Immunohistochemical characterization of large VGLUT1-positive terminals in the CA3 stratum lucidum.
(A) Confocal images of VGLUT1 (cyan) and mGluR1α (yellow) were taken with STED images of Munc13-1 (magenta) in the CA3 stratum lucidum. Arrows indicate representative large MF terminals identified by VGLUT1 signals. Scale bar: 5 µm. The right graph shows the proportion of large VGLUT1-positive terminals contacting mGluR1α-positive processes. (B) Same as (A) but for GluA4 instead of mGluR1α. Scale bar: 5 µm.
Figure 7—figure supplement 4

The area, length, and width of Cav2.1 cluster.
In (A), distribution plots of area (left), length (middle), and width (right) are shown. In (B), cumulative distribution plots are shown. The same samples as Figure 7. Numerical values of plots are provided in Figure 7—figure supplement 4—source data 1.
-
Figure 7—figure supplement 4—source data 1
Datasets of numerical values presented in Figure 7—figure supplement 4.
- https://cdn.elifesciences.org/articles/90799/elife-90799-fig7-figsupp4-data1-v1.xlsx
Figure 7—figure supplement 5
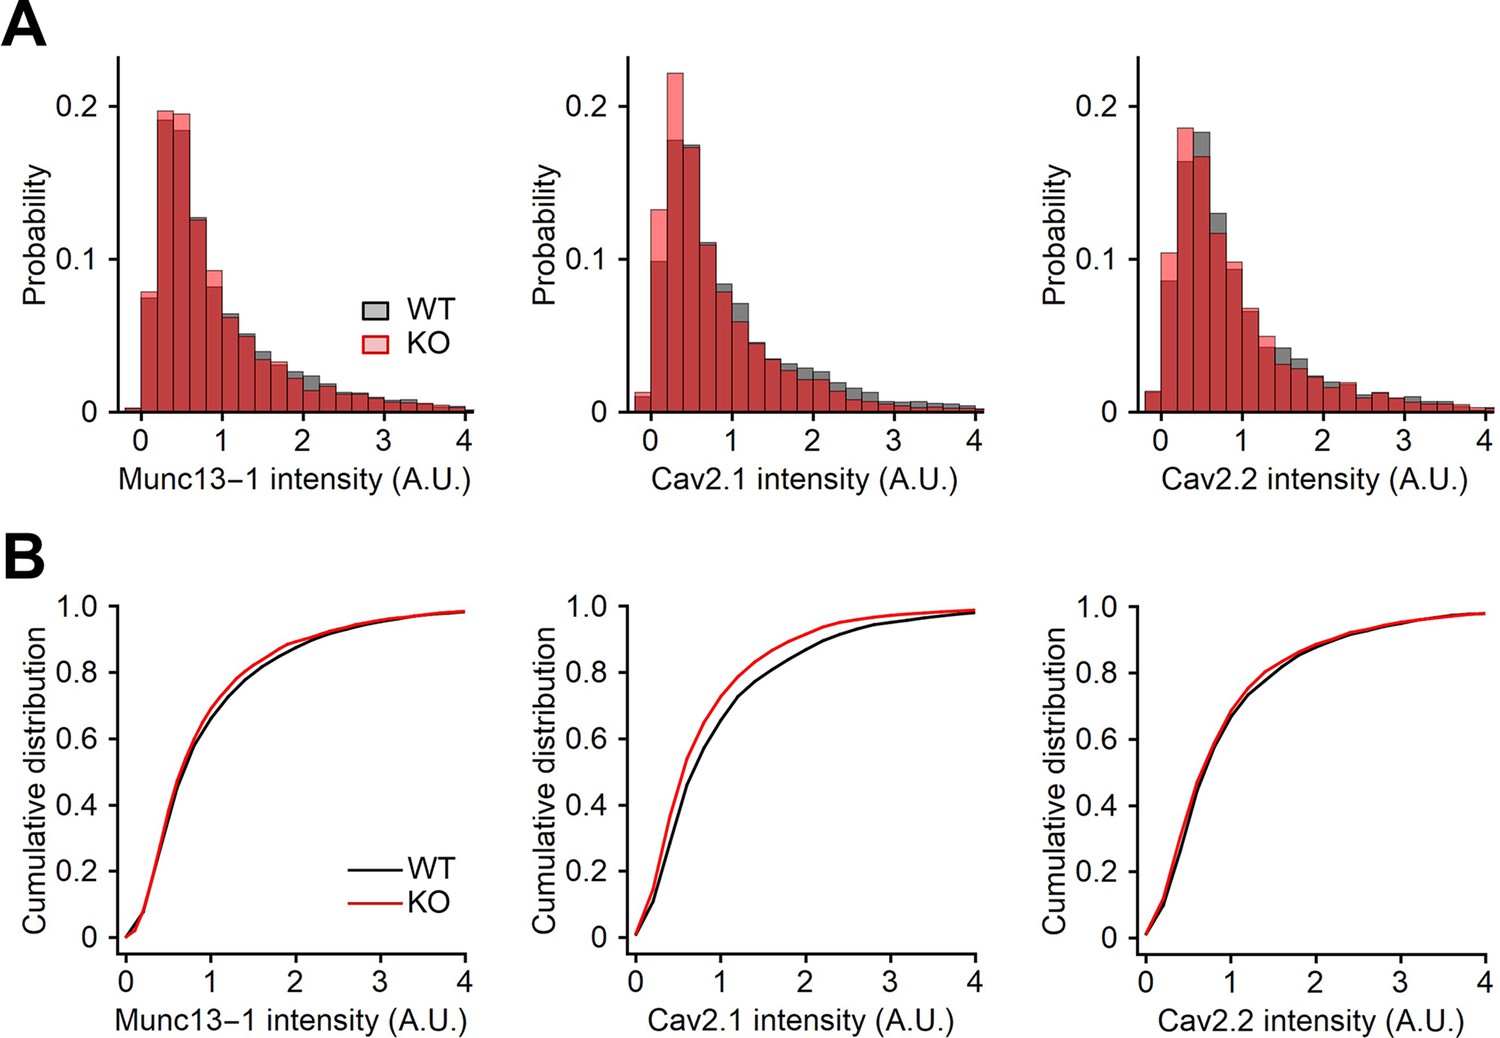
Quantification of the signal intensity using confocal images.
The signal intensity of Munc13-1 (left), Cav2.1 (middle), and Cav2.2 (right) at active zones (AZs) in WT (black) and RIM-BP2 KO (red) mice were quantified from confocal images. The position of AZ was determined from the Munc13-1 STED data, and the signal intensity of Munc13-1, Cav2.1, and Cav2.2 was measured. Histograms (A) and cumulative distribution plots (B) are shown. The same samples as Figure 7. Numerical values of plots are provided in Figure 7—figure supplement 5—source data 1.
-
Figure 7—figure supplement 5—source data 1
Datasets of numerical values presented in Figure 7—figure supplement 5.
- https://cdn.elifesciences.org/articles/90799/elife-90799-fig7-figsupp5-data1-v1.xlsx
Additional files
Download links
A two-part list of links to download the article, or parts of the article, in various formats.
Downloads (link to download the article as PDF)
Open citations (links to open the citations from this article in various online reference manager services)
Cite this article (links to download the citations from this article in formats compatible with various reference manager tools)
RIM-BP2 regulates Ca2+ channel abundance and neurotransmitter release at hippocampal mossy fiber terminals
eLife 12:RP90799.
https://doi.org/10.7554/eLife.90799.3


