Seasonally migratory songbirds have different historic population size characteristics than resident relatives
- University of Alaska Museum and Department of Biology and Wildlife, United States
- Department of Biology, Texas A&M University, United States
- Ecology, Evolution, and Environmental Biology, Columbia University, United States
Figures
Figure 1
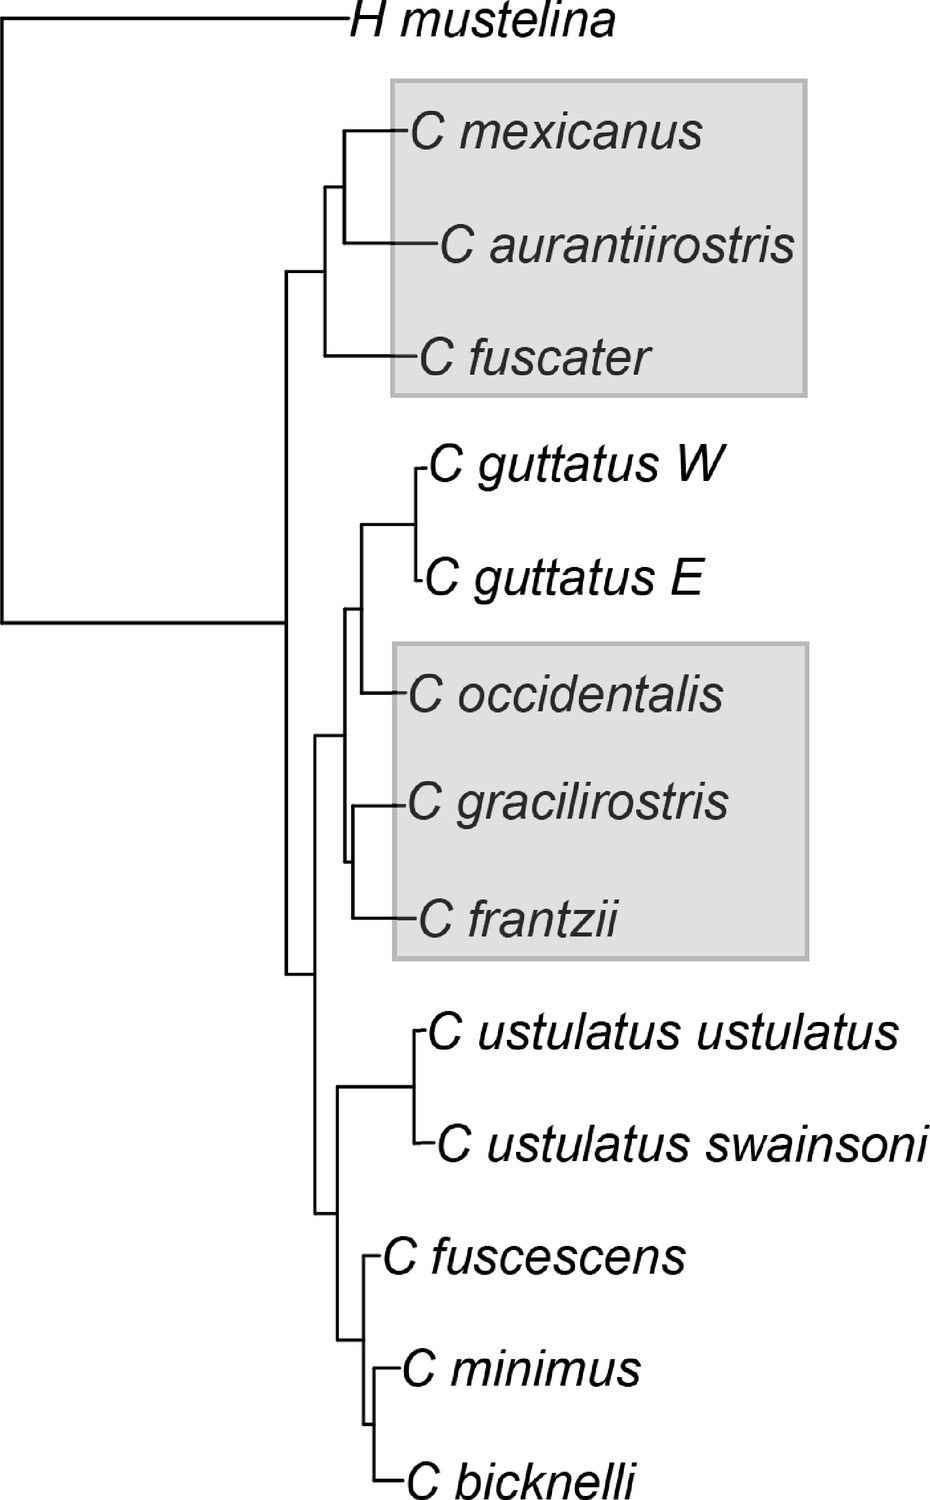
The phylogenetic tree of the songbird lineages in this study, from the genera Catharus and Hylocichla.
Neotropical residents are shaded in gray.
Figure 2
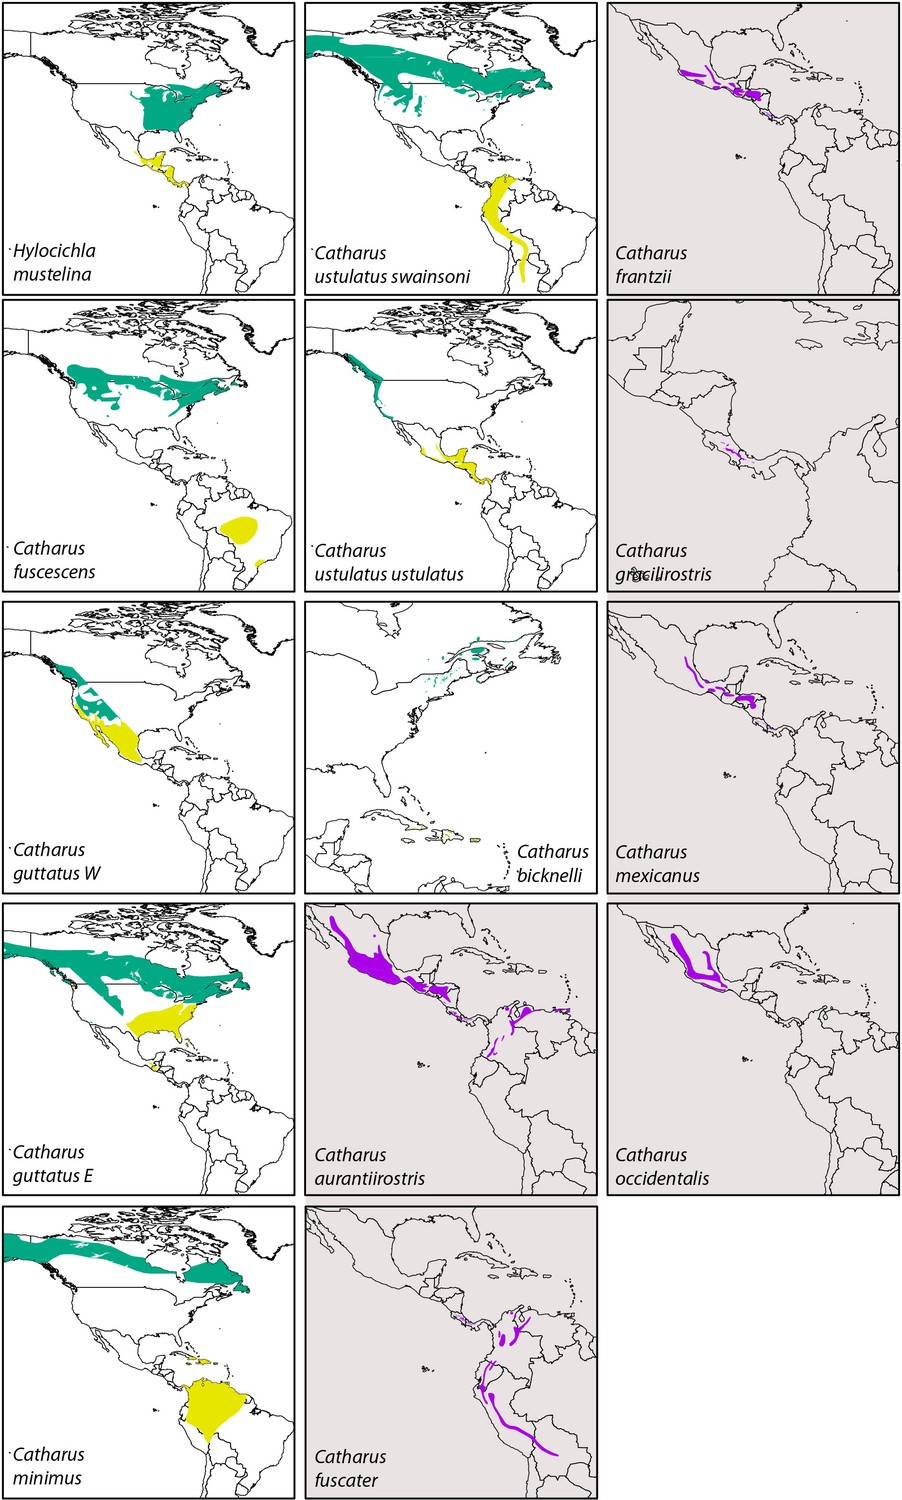
Distribution maps of the thrush taxa in this study.
Among seasonal migrants, green indicates breeding range and yellow is wintering range. Among sedentary lineages (those shaded in gray), purple indicates year-round range. Data are from Bird Life International and the Handbook of the Birds of the World, 2021. Available at http://datazone.birdlife.org/species/requestdis.
Figure 3
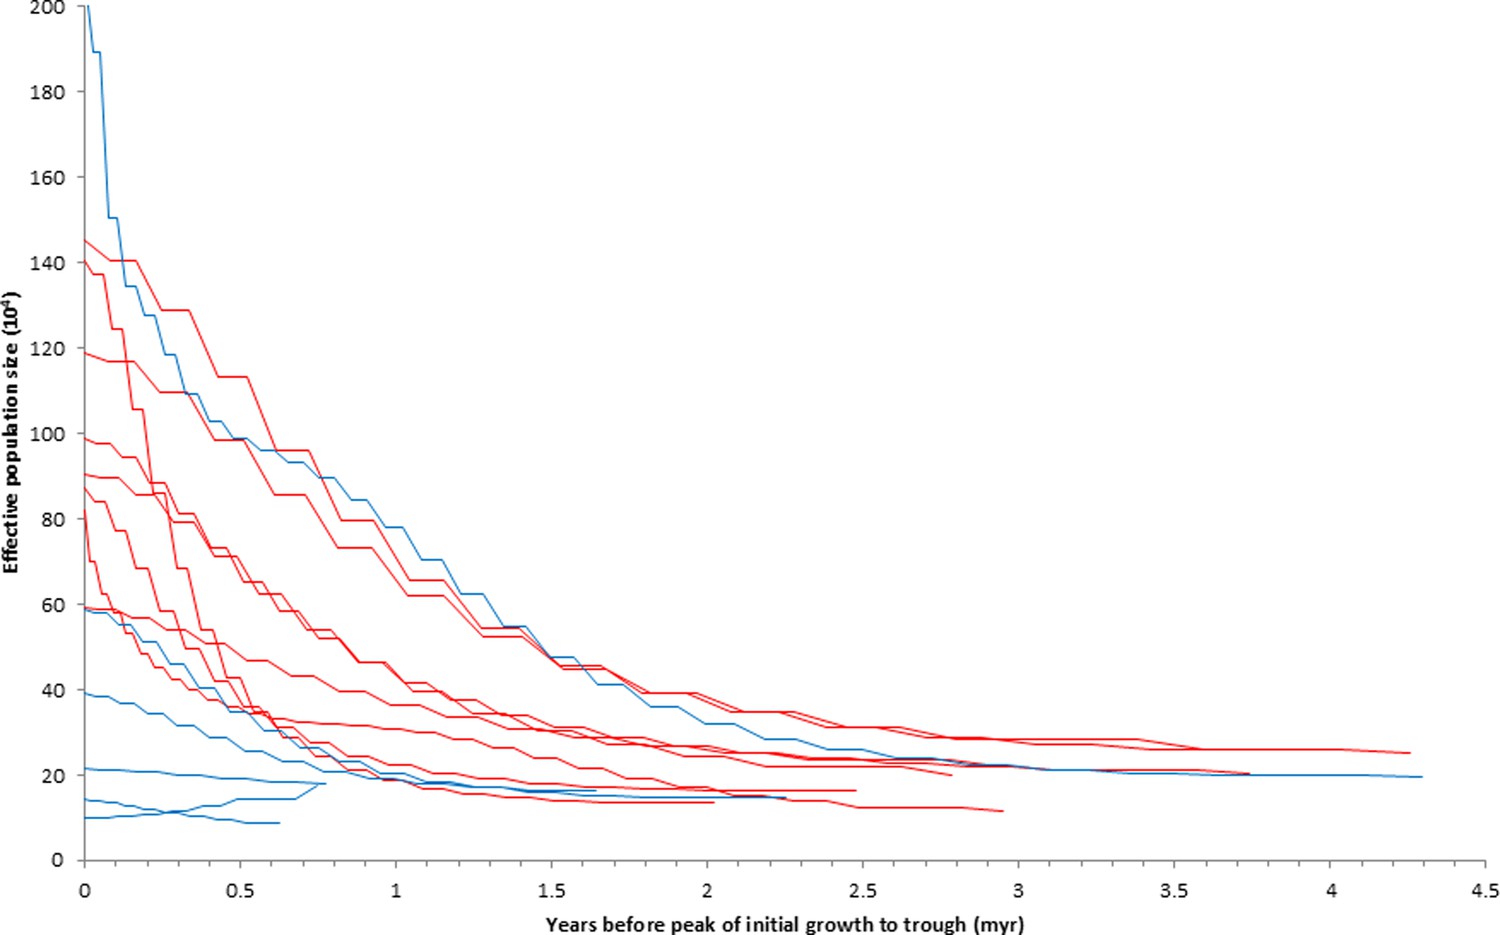
Partial historic effective population size curves from all lineages in this study, based on pairwise sequentially Markovian coalescent (PSMC) analyses.
Each peak of initial growth is set to zero years to set a common framework in which to visualize the periods and magnitudes of initial growth among migrant (red) and resident (blue) lineages. See specific lineages with their bootstrapped results in Figure 5.
Figure 4
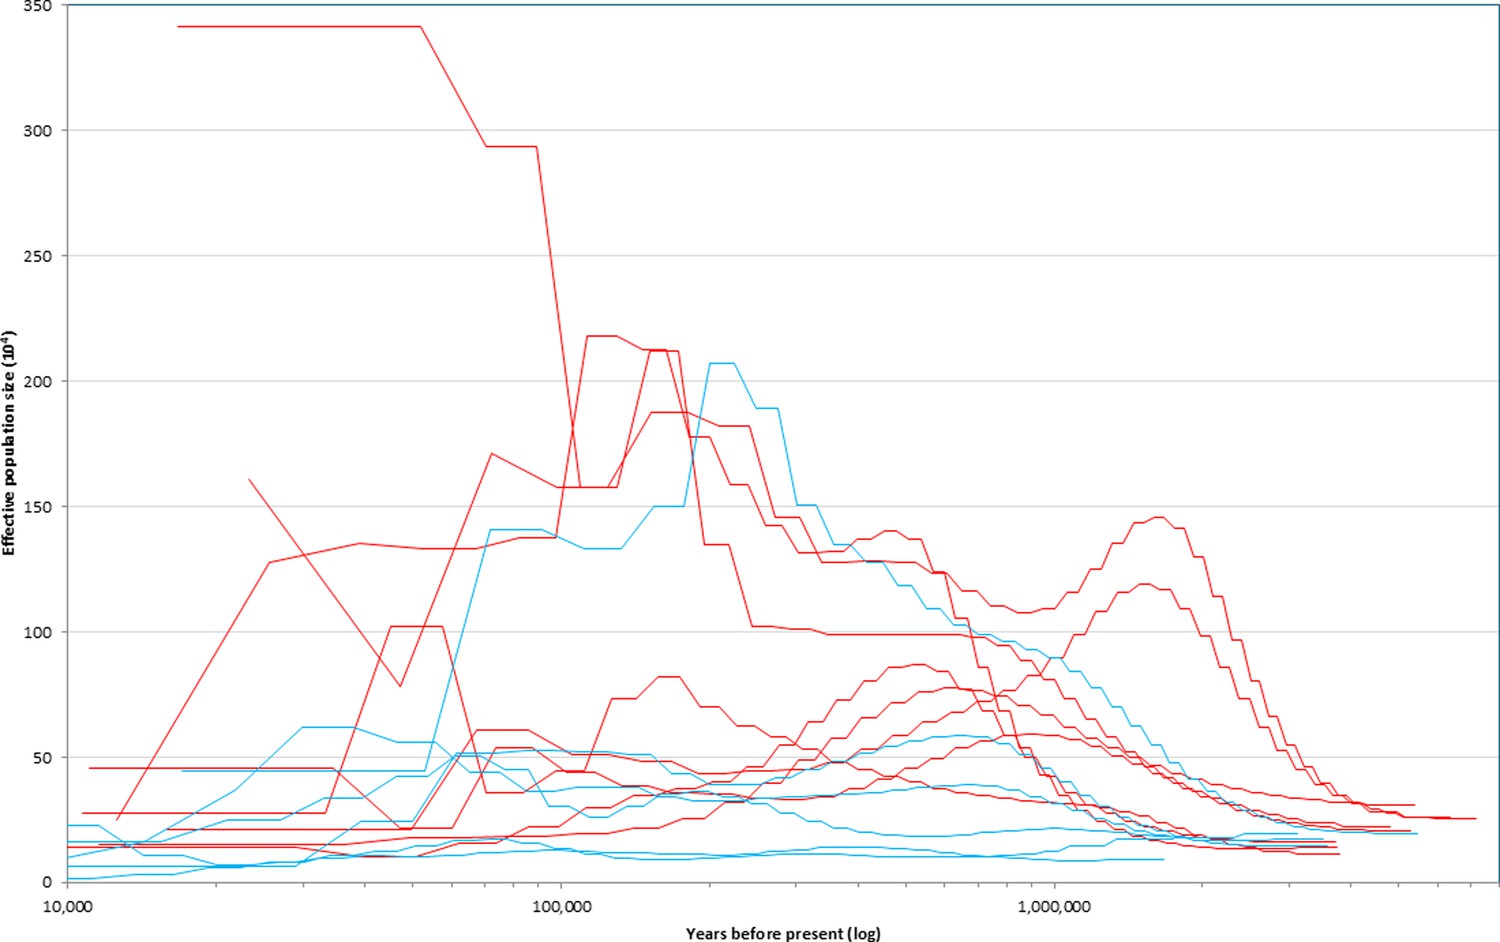
Historic effective population size curves from all lineages, based on pairwise sequentially Markovian coalescent (PSMC) analyses.
Migrant lineages are in red and resident lineages in blue. See specific lineages with their bootstrapped results in Figure 5.
Figure 5
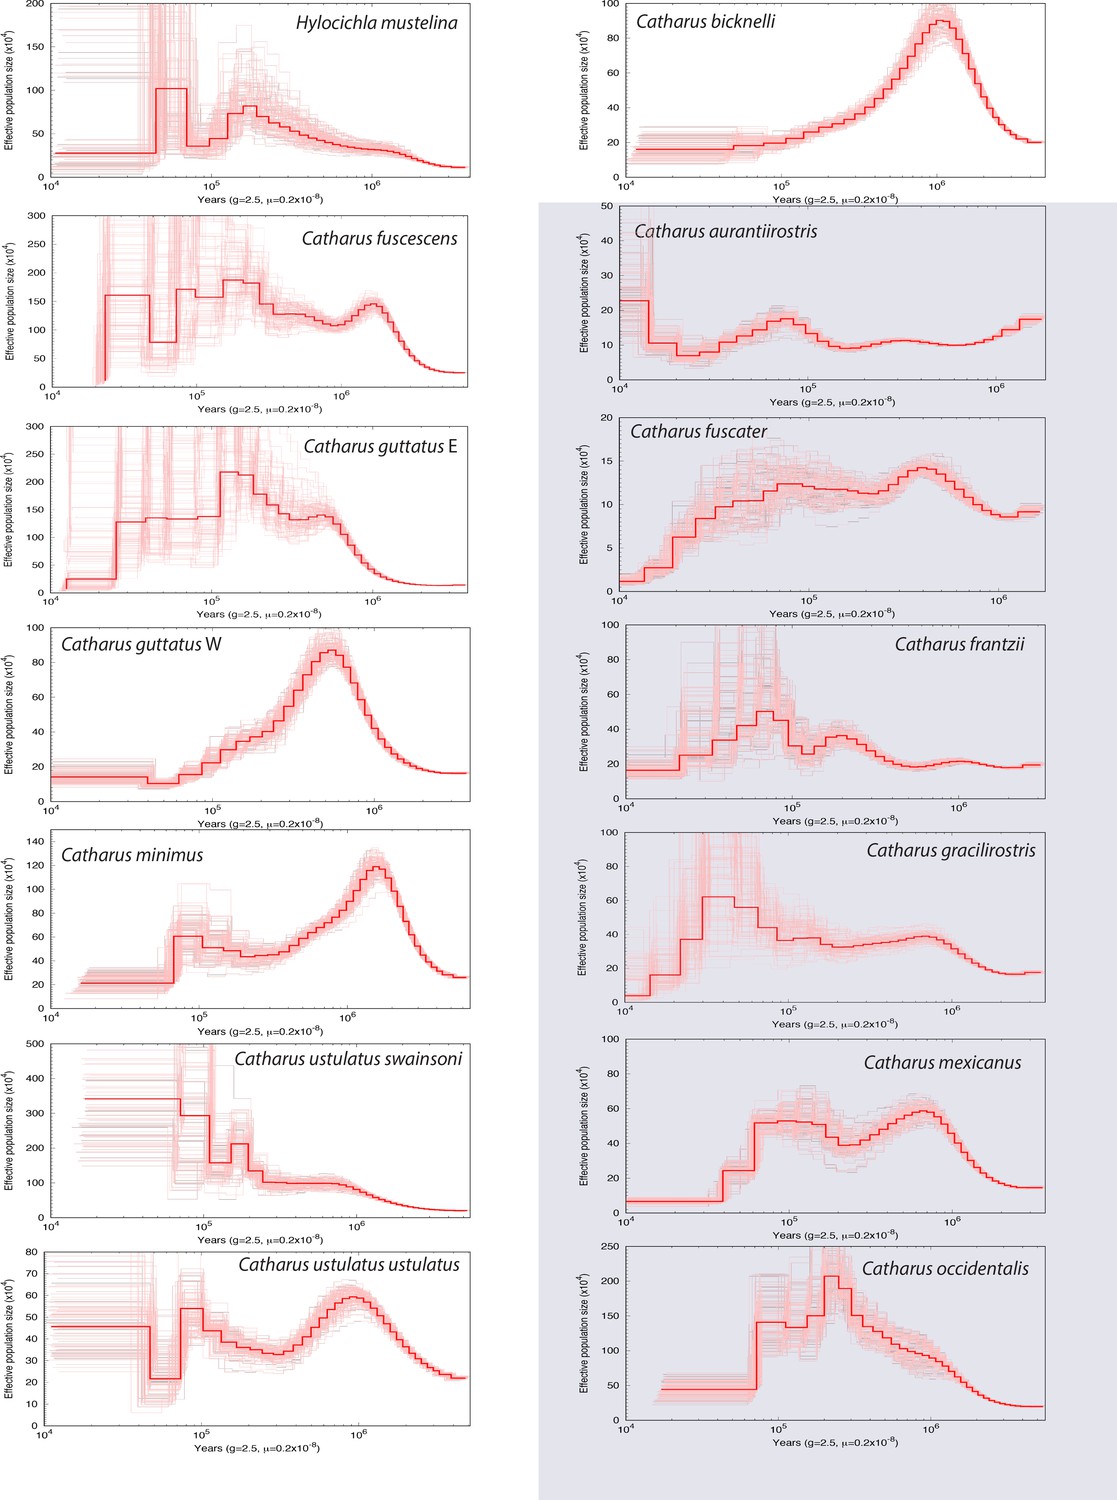
Montage of the historic effective population size curves of all lineages analyzed in this study, with each lineage in a separate panel (based on pairwise sequentially Markovian coalescent [PSMC] analyses).
Sedentary lineages are highlighted in gray. Note that scales on both axes vary among panels, and that the X axis is on a log scale. Bold red lines are the main curves from the original data, and pink lines reflect 100 replicates from bootstrapped sequences. Bold red curves are all overlaid on common axes in the single panel of Figure 4.
Figure 6
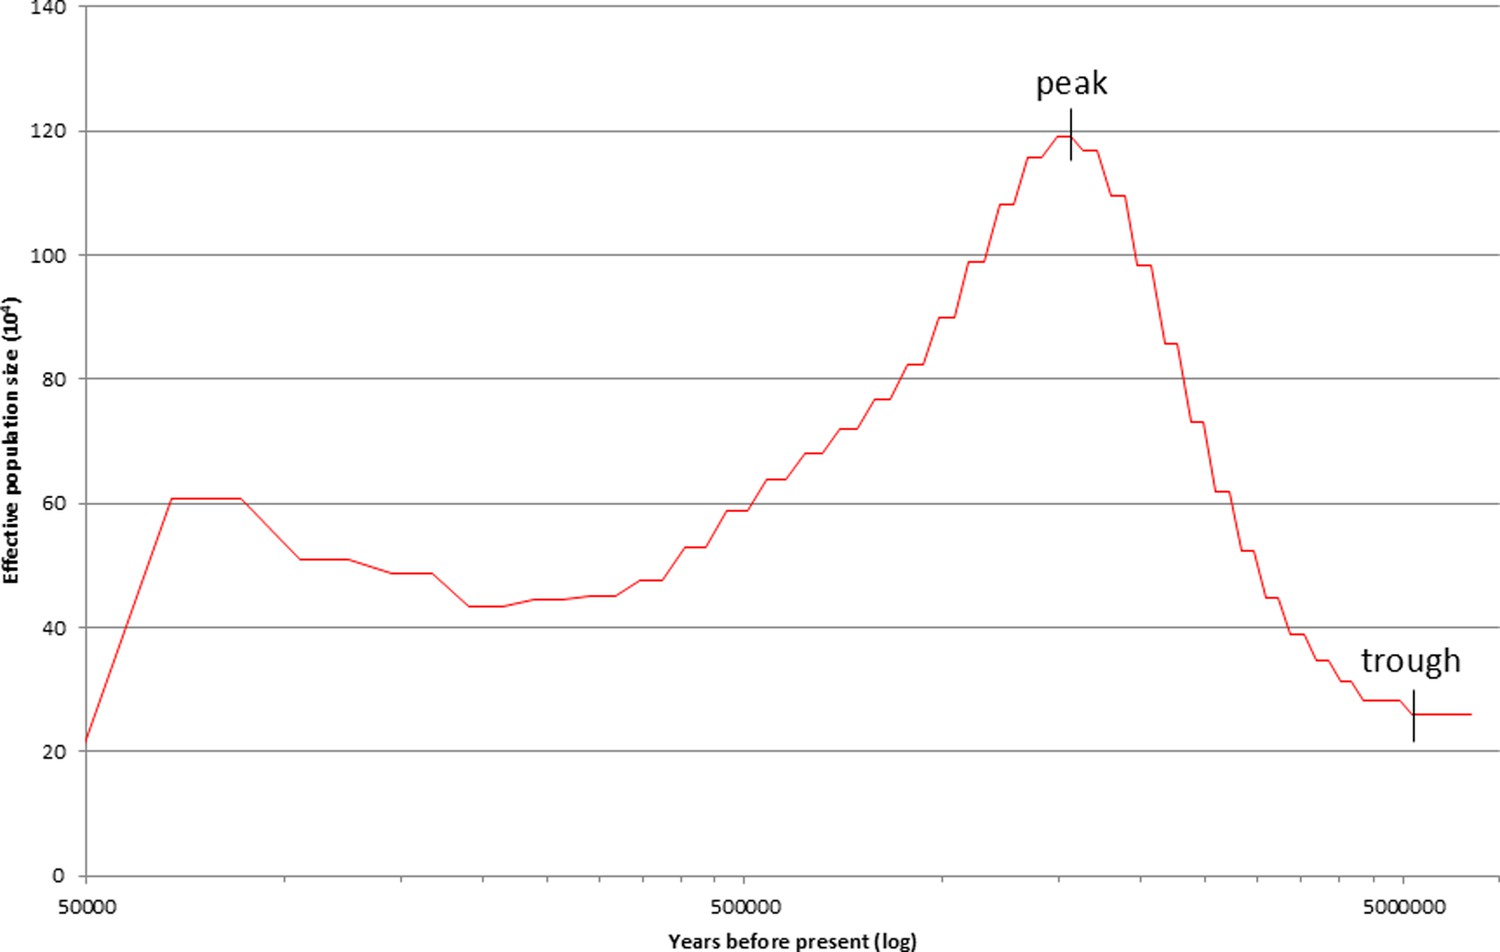
Graphic presentation of the C. minimus pairwise sequentially Markovian coalescent (PSMC) dataset, showing effective population size (Ne×104) from 50 Kyr back in time to the lineages’ origins as estimated from genomic data.
The variables in our analyses are the mean and SD of the effective population size (Ne) values, deltaT of initial growth (timetrough – timepeak), the degree of that growth (1 – [Ntrough/Npeak]), and the rate of that growth (degree/deltaT).
Tables
Table 1
Data from pairwise sequentially Markovian coalescent (PSMC) analyses reflecting effective population sizes (Ne×104) through history at depths > 50 Kyr and the five variables derived and analyzed from that output.
Taxa shaded in gray are Neotropical residents.
| Taxon | Mean Ne (±SD) | SD/mean | Degree of early growth 1 - (Ntrough/Npeak) | Rate of early growth degree/deltaT | deltaT |
|---|---|---|---|---|---|
| H. mustelina | 35.63 (±20.11) | 0.56 | 0.86 | 2.92E-07 | 2,946,862 |
| Catharus fuscescens | 95.59 (±50.99) | 0.53 | 0.83 | 1.93E-07 | 4,284,020 |
| Catharus guttatus E | 75.34 (±65.69) | 0.87 | 0.90 | 4.48E-07 | 2,021,768 |
| Catharus guttatus W | 39.72 (±24.20) | 0.61 | 0.81 | 3.28E-07 | 2,477,684 |
| Catharus minimus | 63.71 (±28.83) | 0.45 | 0.78 | 2.17E-07 | 3,594,914 |
| Catharus ustulatus swainsonii | 76.61 (±66.61) | 0.87 | 0.79 | 2.12E-07 | 3,740,764 |
| Catharus ustulatus ustulatus | 39.56 (±12.15) | 0.31 | 0.63 | 2.14E-07 | 2,943,763 |
| Catharus bicknelli | 46.90 (±24.12) | 0.51 | 0.78 | 2.79E-07 | 2,781,554 |
| Catharus aurantiirostris | 12.38 (±2.83) | 0.23 | –0.75 | –1.00E-06 | 747,451 |
| Catharus fuscater | 11.38 (±1.66) | 0.15 | 0.39 | 6.18E-07 | 627,449 |
| Catharus frantzii | 24.71 (±8.41) | 0.34 | 0.17 | 2.20E-07 | 774,024 |
| Catharus gracilirostris | 29.98 (±9.28) | 0.31 | 0.58 | 3.52E-07 | 1,637,663 |
| Catharus mexicanus | 37.10 (±16.18) | 0.44 | 0.75 | 3.34E-07 | 2,250,295 |
| Catharus occidentalis | 76.40 (±53.14) | 0.70 | 0.91 | 2.11E-07 | 4,292,405 |
| Means (±SD) | |||||
| Migrants | 59.34 (±35.70)* | 0.57 (±0.20)* | 0.798 (±0.08)* | 2.73E-7 (±0.85E-7) | 3,098,906 (±732,563)* |
| Residents | 31.99 (±15.25) | 0.36 (±0.19) | 0.341 (±0.59) | 1.23E-7 (±5.69E-7) | 1,721,547 (+1,409,939) |
-
*
p<0.05.
Appendix 1—table 1
Specimen data and NCBI-SRA numbers (PRJNA1112856).
Vouchered specimens are housed in the following institutions: UAM (University of Alaska Museum), MSB (Museum of Southwestern Biology, University of New Mexico), LSUMNS (Louisiana State University Museum of Natural Science), and FMNH (Field Museum of Natural History).
| Institution | Catalog # | Species | Year | Field no. | Locality | NCBI-SRA |
|---|---|---|---|---|---|---|
| UAM | 28620 | H. mustelina | 2010 | KSW5403 | Belize: Toledo District; Big Falls | SRR29089747 |
| UAM | 27774 | C. fuscescens | 2007 | KSW5151 | Belize: Toledo District; Big Falls | SRR29089742 |
| UAM | 15202 | C. guttatus E | 1992 | KSW4013 | USA: Vermont; Brandon | SRR29089748 |
| UAM | 26337 | C. guttatus W | 2008 | UAMX5095 | USA: Alaska; Kodiak | SRR29089739 |
| UAM | 22642 | C. minimus | 2003 | KSW5000 | USA: Alaska; Fairbanks | SRR29089741 |
| n.a. (blood) | KF15K01 | C. ustulatus swainsonii | 2011 | KF15K01 | Canada: British Columbia, Kamloops | Pending |
| n.a. (blood) | KF01K01 | C. u. ustulatus | 2011 | KF01K01 | Canada: British Columbia, Kamloops | SRS18060177 |
| UAM | 19996 | C. bicknelli | 2000 | KSW3633 | USA: Vermont; Mt Mansfield | SRR29089740 |
| UAM | 25341 | C. aurantiirostris | 2004 | MJM1154 | Panama: Chiriqui; El Salto | SRR29089749 |
| MSB | 31939 | C. fuscater | 2008 | MSB31939 | Peru: Amazonas; 4.5 km N Tullanya | SRR29089746 |
| UAM | 25098 | C. frantzii | 2004 | KSW4485 | Panama: Chiriqui; Volcan Baru | SRR29089744 |
| LSUMNS | 138784 | C. gracilirostris | 1990 | JMB1065; B-16270 | Costa Rica: San Jose; Cerro de la Muerte | SRR29089750 |
| UAM | 10352 | C. mexicanus | 1994 | PEP2489 | Mexico: Veracruz; Volcan San Martin | SRR29089743 |
| FMNH | 343305 | C. occidentalis | 1989 | MEX408 | Mexico: Oaxaca; Totontepec | SRR29089745 |
Appendix 1—table 2
Data from pairwise sequentially Markovian coalescent (PSMC) analyses reflecting effective population sizes (Ne) (×104) through history at depths >50 Kyr (using variable generation times) and the five variables derived and analyzed from that output.
Taxa shaded in gray are Neotropical residents.
| Taxon | Mean Ne (+SD) | SD/mean | Degree of early growth 1 - (Ntrough/Npeak) | Rate of early growth degree/deltaT | deltaT |
|---|---|---|---|---|---|
| H. mustelina | 35.63 (+20.11) | 0.56 | 0.86 | 3.03E-07 | 2,834,197 |
| C. fuscescens | 95.77 (+56.07) | 0.58 | 0.83 | 1.79E-07 | 4,627,125 |
| C. guttatus E | 78.69 (+76.09) | 0.97 | 0.90 | 4.89E-07 | 1,850,522 |
| C. guttatus W | 40.15 (+24.11) | 0.60 | 0.81 | 3.59E-07 | 2,266,059 |
| C. minimus | 63.71 (+28.83) | 0.45 | 0.78 | 2.35E-07 | 3,323,013 |
| C. ustulatus swainsonii | 76.61 (+66.61) | 0.87 | 0.79 | 2.12E-07 | 3,740,764 |
| C. ustulatus ustulatus | 39.56 (+12.15) | 0.31 | 0.63 | 2.16E-07 | 2,909,628 |
| C. bicknelli | 46.90 (+24.12) | 0.51 | 0.78 | 3.01E-07 | 2,580,641 |
| C. aurantiirostris | 12.39 (+2.78) | 0.22 | –0.75 | –7.93E-07 | 942,318 |
| C. fuscater | 11.33 (+1.66) | 0.15 | 0.39 | 5.57E-07 | 713,817 |
| C. frantzii | 24.97 (+8.61) | 0.34 | 0.17 | 1.93E-07 | 886,294 |
| C. gracilirostris | 30.80 (+11.08) | 0.36 | 0.58 | 3.25E-07 | 1,775,757 |
| C. mexicanus | 37.10 (+16.18) | 0.44 | 0.75 | 2.92E-07 | 2,575,082 |
| C. occidentalis | 76.39 (+53.14) | 0.70 | 0.91 | 1.97E-07 | 4,595,855 |
| Means (+SD) | |||||
| Migrants | 59.63 (+38.48)† | 0.61 (+0.21)* | 0.798 (+0.08)* | 2.87E-7 (+1.01E-7) | 3,016,494 (+875,860)* |
| Residents | 32.16 (+15.58) | 0.36 (+0.19) | 0.342 (+0.59) | 1.284E-7 (+4.71E-7) | 1,914,854 (+1,489,246) |
-
*
*p<0.05.
-
†
p<0.01.
Additional files
-
MDAR checklist
- https://cdn.elifesciences.org/articles/90848/elife-90848-mdarchecklist1-v1.docx
-
Supplementary file 1
Specimen data, NCBI-SRA numbers, and alternative generation time PSMC results.
- https://cdn.elifesciences.org/articles/90848/elife-90848-supp1-v1.docx
Download links
A two-part list of links to download the article, or parts of the article, in various formats.
Downloads (link to download the article as PDF)
Open citations (links to open the citations from this article in various online reference manager services)
Cite this article (links to download the citations from this article in formats compatible with various reference manager tools)
Seasonally migratory songbirds have different historic population size characteristics than resident relatives
eLife 12:RP90848.
https://doi.org/10.7554/eLife.90848.3


